
Crypto World
SEC crypto-law interpretation marks a start, not an end

Regulators are signaling a shift in digital-asset oversight as the SEC outlines an interpretive framework for applying securities laws to crypto. SEC Chair Paul Atkins, in prepared remarks at the Practising Law Institute, said the agency intends to move away from a broad enforcement-first stance toward a more principled, interpretive approach. The remarks follow the agency’s interpretive notice on crypto regulation and a memorandum of understanding with the CFTC signed last week.
“While the interpretation provides long-needed clarity, I should like to assure this audience that it amounts to a beginning, not an end,” Atkins told attendees, underscoring the framework is intended to evolve alongside market developments.
The interpretive notice, released earlier in the week, frames how federal securities laws may apply to crypto assets. It suggests that most cryptocurrencies are unlikely to be securities under federal law, with a narrow exception: traditional securities that are tokenized. Atkins later clarified that digital commodities, digital tools, digital collectibles including non-fungible tokens (NFTs), and stablecoins are typically not within the SEC’s purview.
Key takeaways
- The SEC signals a shift from enforcement-by-press release toward a interpretive, rules-based approach to crypto regulation after a new interpretive notice and a memorandum with the CFTC.
- Under the framework, most crypto assets are unlikely securities; only tokenized traditional securities would fall under federal securities laws.
- Assets like digital commodities, digital tools, NFTs, and stablecoins are generally not considered securities by the agency’s current interpretation.
- Regulatory progress intersects with Congress and the White House, as lawmakers push a market-structure bill (the CLARITY Act) and seek consensus on stablecoin regulation and crypto-asset provisions.
- Watch for how the evolving framework interacts with legislative efforts, potential CFTC authority expansion, and ongoing industry pilots and experiments.
Regulatory posture shifts amid a mixed legislative backdrop
The SEC’s interpretive stance arrives as part of a broader recalibration of how crypto regulation will be enforced and applied. The agency had long faced criticism for a perceived “enforcement-by-crisis” approach, especially for startups and projects navigating an evolving market. By contrast, the latest framework emphasizes clarity and consistency, aiming to reduce guesswork for issuers, exchanges, and investors while preserving robust investor protections.
The interpretive notice explicitly clarifies that, for many digital assets, existing securities laws may not apply in the same way as for traditional stocks or bonds. The acknowledgment that most crypto assets are not securities could lower some regulatory friction for many projects—though it also places a clear boundary around assets that would still be subject to securities regulation.
Atkins connected the interpretation to ongoing SEC coordination with the CFTC, noting the memorandum signed last week. The agreement signals an intent to harmonize approaches where possible, a relevant development given the overlapping jurisdictions in crypto markets, market infrastructure, and derivatives. The result could be a more predictable regulatory environment for token issuers and market participants, even as questions about enforcement and future rulemaking linger.
Contextual backdrop: market structure, stablecoins, and the legislative path
Beyond the SEC’s interpretive framework, lawmakers are actively shaping the arc of crypto regulation through legislation and hearings. A market-structure bill, known in industry circles as the CLARITY Act, advanced in the House in mid-2025 but has faced a slower path in the Senate. As of the latest briefing, it had not yet been scheduled for a markup in the Senate Banking Committee, leaving a critical regulatory hinge unresolved.
In parallel, the White House has engaged with lawmakers behind closed doors to advance the same package. A spokesperson for Wyoming Senator Cynthia Lummis confirmed that Republican senators met with White House crypto adviser Patrick Witt to discuss advancing the market-structure bill. Lummis’ team described the session as very productive and positive, with negotiators “99% of the way there on stablecoin yield” and ongoing, productive talks on the digital-asset provisions of the bill.
Stablecoins remain a focal point of regulatory and policy debate, particularly around yield, banking implications, and consumer protections. The sense among some policymakers is that achieving a workable framework for stablecoin issuance and redemption is a prerequisite for broader bipartisan consensus on crypto regulation.
The regulatory dialogue is further colored by ongoing market experiments and pilot programs. For example, the market has seen pilots exploring tokenized trading and other asset-ization concepts under the watchful eye of multiple agencies. While these pilots illustrate a regulatory appetite for innovation, they also underscore that practical, real-world testing will continue to inform how rules evolve in practice.
As the SEC’s interpretive framework takes root, traders, issuers, and developers should prepare for a regulatory environment that favors clarity and predictability but remains nuanced. The boundary between what constitutes a security in crypto, and what does not, will likely continue to shift as new asset classes and products emerge. The interplay between the SEC, the CFTC, and Congress will shape the pace and direction of this evolution in the months ahead.
Readers should watch for updates on the CLARITY Act’s progression in the Senate, any further formal guidance from the SEC, and on-the-ground outcomes from ongoing tokenization trials and stablecoin regulatory debates. The convergence of executive and legislative activity suggests that substantial clarity—across asset classes and market infrastructure—may still be months away, even as the groundwork for a more predictable regulatory framework takes shape.


Key Highlights
- IonQ achieved a groundbreaking 99.99% fidelity world record and targets millions of qubits by 2030.
- IBM earned a “Perfect 10” Smart Score rating on TipRanks with Moderate Buy consensus and analysts projecting 40.49% upside.
- Microsoft’s Majorana 1 chip powers chemistry research applications and carries a Strong Buy rating with 56.62% potential upside.
- Alphabet’s Google released research suggesting blockchain encryption could be compromised by quantum algorithms as early as 2029.
- Industry analysts forecast the quantum computing sector will surge from $1.42 billion in 2024 to $4.24 billion by 2030.
Quantum computing has transitioned from theoretical research into tangible commercial applications at an accelerating pace. For investors monitoring this emerging sector, three companies emerge as particularly compelling: IonQ, IBM, and Microsoft.
The quantum computing industry reached a valuation of $1.42 billion in 2024. Market researchers anticipate this figure will climb to $4.24 billion by the decade’s end. Such explosive expansion is attracting enterprise clients, lucrative government partnerships, and substantial capital investments.
IonQ: Prioritizing Precision Over Speed
IonQ has established itself as the premier pure-play quantum computing enterprise. The company’s technology recently achieved an unprecedented 99.99% fidelity rating in industry-standard benchmarking tests—a global achievement.
Precision represents the fundamental obstacle preventing quantum computing’s mainstream adoption. Systems plagued by frequent computational errors cannot deliver reliable results for practical applications.
IonQ’s approach centers on trapped ion technology. This methodology prioritizes exceptional accuracy over raw processing velocity, contrasting sharply with the superconducting architectures favored by competitors.
The organization’s 2026 roadmap includes deploying a 256-qubit architecture. Looking further ahead, IonQ aims to construct million-qubit systems by 2030. Successfully achieving these milestones while maintaining current accuracy standards could position the company as dominant in precision-dependent sectors.
IonQ’s quantum systems are accessible through partnerships with Amazon Web Services, Microsoft Azure, and Google Cloud. The company currently commands approximately $11 billion in market capitalization.
IBM: Bridging Quantum and Traditional Computing
IBM has charted a distinctive strategic course. Instead of solely pursuing qubit quantity, the tech giant emphasizes integrating quantum capabilities into established enterprise infrastructure.
International Business Machines Corporation, IBM
IBM’s development strategy centers on hybrid architectures where conventional CPUs, GPUs, and quantum processors operate cohesively. Industry experts consider this integration model the most viable pathway toward immediate commercial viability.
TipRanks analysts awarded IBM the platform’s maximum Smart Score of 10 out of 10. The stock maintains a Moderate Buy consensus rating, with Wall Street projecting 40.49% appreciation potential.
IBM leverages its extensive enterprise computing heritage and established client relationships, providing immediate market access for quantum services. The company’s development pipeline emphasizes enhanced qubit coherence and sophisticated error correction protocols.
Microsoft: Strategic Innovation with Transformative Potential
Microsoft has maintained a relatively understated public profile regarding quantum achievements compared to rivals like Google or IonQ. Nevertheless, its Majorana 1 quantum processor is delivering measurable outcomes.
The processor currently facilitates advanced chemistry research, enabling quantum simulations of intricate molecular behaviors that exceed classical computing capabilities. CEO Satya Nadella has characterized quantum technology as the forthcoming catalyst for cloud computing evolution.
Microsoft’s research concentrates on topological qubit architectures—a forward-looking methodology promising superior stability compared to existing quantum systems. The company’s Azure Quantum platform seamlessly embeds quantum capabilities into corporate computing environments.
Wall Street analysts assign Microsoft a Strong Buy recommendation with 56.62% upside potential. The stock holds a Smart Score of eight out of ten on TipRanks.
Alphabet’s Google division released 2025 research demonstrating an algorithm potentially capable of compromising contemporary blockchain encryption protocols in minutes—possibly operational by 2029. This revelation emphasizes the remarkable velocity of quantum computing advancement.

In March, the US jobs market recorded 178,000 new jobs, marking little change from the month before, according to the Bureau of Labor Statistics.
The anemic growth in job listings comes amid volatile policy swings from the White House, increased energy prices due to the US and Israel’s war with Iran and, according to recent research, AI disruptions to the labor market.
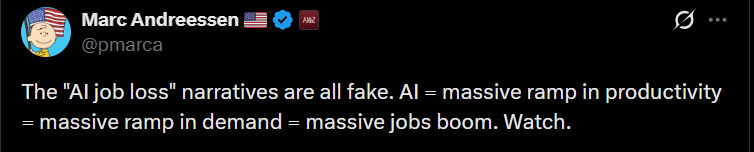
Proponents of AI and large language models have claimed that the tech will bring about an economic boom, thanks to the promise of efficiency breakthroughs.
But as AI becomes more integrated into daily business operations, there is a widening gulf between that promise of growth and efficiency, and what is actually happening.
AI dampens employment growth
On March 6, venture capitalist and Netscape co-founder Marc Andreessen said on X that fears about AI job displacement were overblown.

He also posted an article from Business Insider stating that, at least in tech, job openings are on the rise. Citing data from TrueUp, a tech jobs tracker, Business Insider said that job openings at tech companies have doubled to 67,000 since 2023.
But openings don’t necessarily translate to hiring. According to the Bureau of Labor Statistics, most employment growth in March did not happen in the tech industry. Of the 178,000 new jobs added in March, healthcare employed 76,000, construction grew by 26,000, transportation and warehousing added 21,000 and employment in social assistance increased by 14,000.
While the report doesn’t have a single section tracking the tech industry, related services like computing infrastructure providers and web search portals saw a 1,500 job decrease, or almost no change, respectively. Computer systems design and related services lost 13,000 jobs.
Related: Jack Dorsey’s Block to cut 4,000 jobs in AI-driven restructuring
AI has actually axed 16,000 jobs per month over the past year, according to a recent report from Goldman Sachs, as cited by Fortune. In particular, AI has led to a collapse in hiring for entry-level roles. A 2025 study from SignalFire found that new grad hiring had dropped 50% compared to pre-COVID-19 pandemic levels.

“The door to tech once swung wide open for new grads. Today, it’s barely cracked. The industry’s obsession with hiring bright-eyed grads right out of college is colliding with new realities: smaller funding rounds, shrinking teams, fewer new grad programs, and the rise of AI,” the SignalFire study stated.
This disruption could create ripples far into the future. According to Goldman Sachs, “AI-driven displacement could impose lasting costs on affected workers, worsening labor market outcomes for several years.”
“A key mechanism behind these worse outcomes is occupational downgrading. Workers displaced by technology are more likely to move into more routine occupations requiring fewer analytical and interpersonal skills, likely because the same technological shifts that eliminated their positions also eroded the value of their existing skills,” they continued.
These job losses are justified by the theory that AI will, at the very least, make workplaces more productive. But even that isn’t a given.
Reality of AI use clashes with C-suite expectations
Executives are still overwhelmingly supportive of AI. According to Harvard Business Review, 80% of leaders report weekly use of AI, with 74% reporting positive returns on early deployments.
But workers don’t feel the same. A study from HR consulting firm Mercer found that, for 43% of workers, their job is more frustrating.
One major issue is the number of mistakes churned out by generative AI. “For every 10 hours of efficiency gained through AI, nearly four hours are lost to fixing its output,” a Workday report stated.
AI can also be used to offload labor onto coworkers in what researchers at the Harvard Business Review have called “workslop” i.e., “content that appears polished but lacks real substance, offloading cognitive labor onto coworkers.”
They said that “41% of workers have encountered such AI-generated output, costing nearly two hours of rework per instance and creating downstream productivity, trust, and collaboration issues.”
According to Workday, only 14% of respondents to their survey said they “consistently achieve net-positive outcomes from AI use.”
Part of the gulf between executives’ understanding of AI and the reality at the productive level may be explained by the technology itself.
Per the Harvard Business Review, “Senior leaders tend to use AI for high-level synthesis, strategic drafting, and decision support, tasks where the technology performs well, so the current capabilities tend to benefit their work.”
For messier day-to-day operations like “workflows built over years, teams with uneven technical comfort, output that has to be consistently right, not just fast,” it doesn’t work so well.
“When the tool works, both groups understand and reap the benefits. When it fails, typically only one of them has to cope with the aftermath.”

Brian Solis, the head of global innovation at enterprise AI firm ServiceNow, said that this divide has created an “AI tax,” i.e., “More checking. More rework. More anxiety. Faster pace. AI slop. Less trust.”
Andreessen may not believe that the AI job-cut narratives are real, but OpenAI does. The AI company has acknowledged the impact the technology has on employment, and has even released a series of policy proposals to address it.
The list contains ideas that are “intentionally early and exploratory” that serve as a “a starting point for discussion that we invite others to build on.” It includes proposals to expand healthcare coverage, retirement savings and setting a new industrial policy agenda.
Far from Andreessen’s optimism, OpenAI’s proposal included a warning: “Unless policy keeps pace with technological change, the institutions and safety nets needed to navigate this transition could fall behind.”
Magazine: Asia Express: Phantom Bitcoin checks, China tracks tax on blockchain

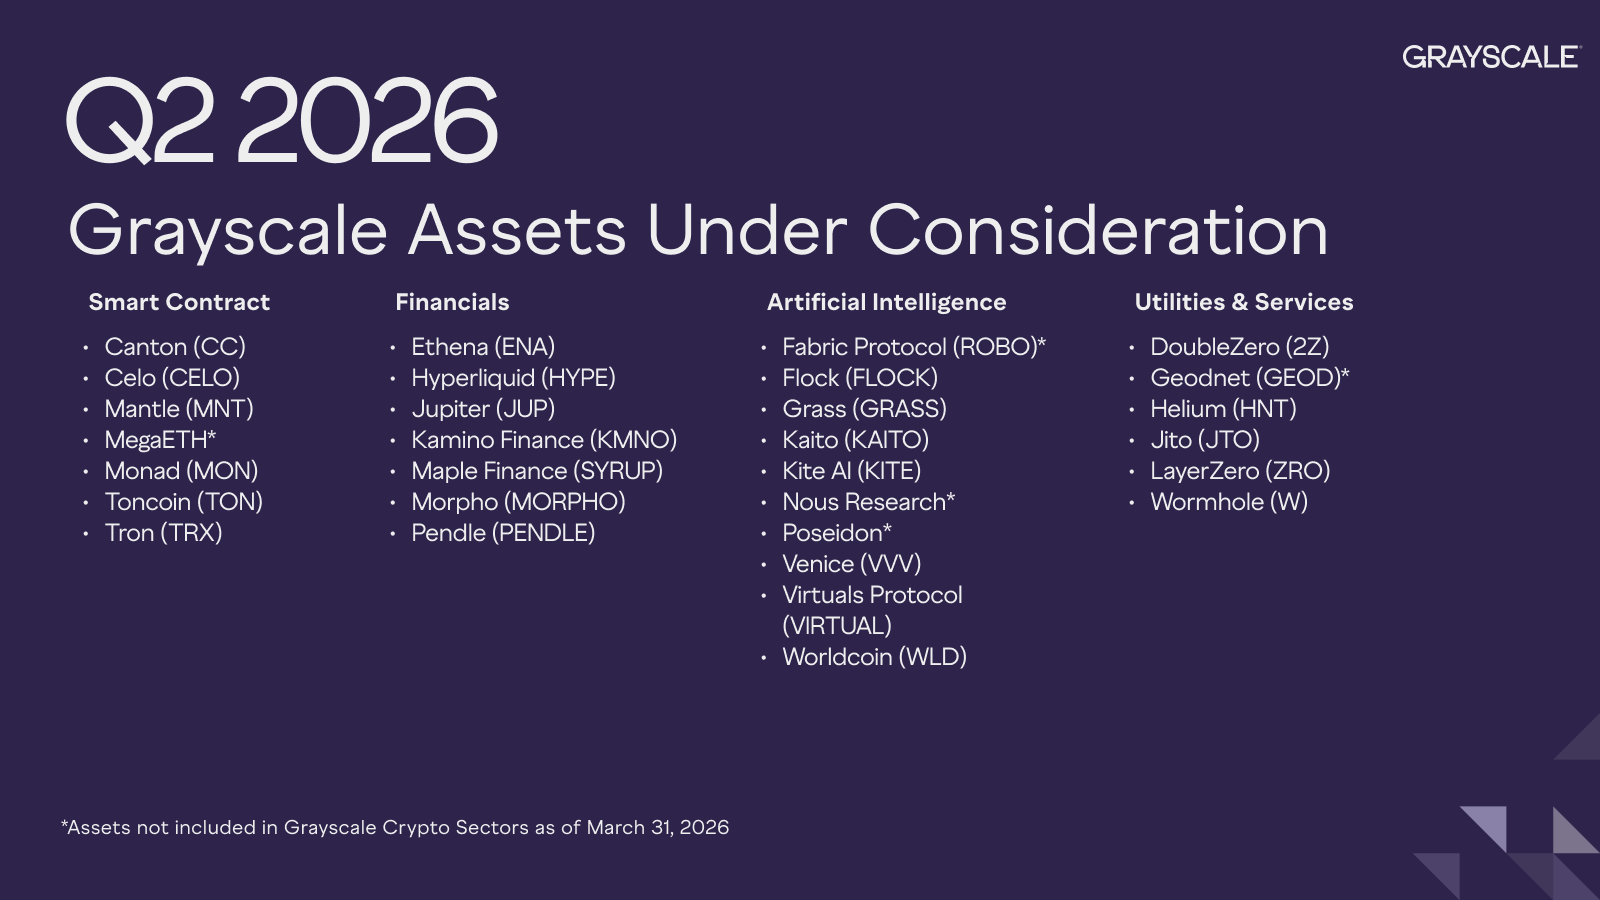
Grayscale has narrowed its list of crypto assets under review for potential inclusion in future investment products in the second quarter of 2026. The firm trimmed the roster to 30 tokens from 36 in the prior quarter and dropped an entire category tied to consumer-facing crypto projects.
The asset manager’s updated “Assets Under Consideration” list spans four segments: smart contract platforms, financial assets, artificial intelligence, and utilities and services.
Grayscale Q2 Update Focuses on Crypto AI Projects
In the first-quarter version, the firm had grouped 36 names across five segments, including a separate Consumer & Culture category that no longer appears in the latest update.
The change leaves artificial intelligence as the largest bucket on the list. Grayscale included 10 AI-linked assets in the second-quarter roster, up from seven in the previous quarter.
The additions include Fabric Protocol, Kite AI, and Venice, alongside names that remained on the list such as Flock, Grass, Kaito, Virtuels Protocol, and Worldcoin.
The revised list also added Canton in the smart contract segment and Helium in utilities and services.
At the same time, Grayscale removed a broad mix of tokens from earlier sector lists.
The names no longer included in the second-quarter version are Aptos, Arbitrum, Binance Coin, and Polkadot from smart contracts. Euler, Lombard, Plume Network, and Sky from financials; and ARIA Protocol, Bonk, and Playtron from the Consumer & Culture group.
The result is a smaller and more concentrated list. Smart contract assets fell to seven names from 10 in the prior quarter, while financial tokens dropped to seven from 11. Utilities and services increased from five to six.
Meanwhile, the latest reshuffle points to a sharper emphasis on infrastructure and AI-related crypto themes.
While Grayscale kept established names such as Celo, Mantle, Monad, Toncoin, Tron, Ethena, Hyperliquid, Jupiter, Kamino, Maple Finance, Morpho, Pendle, DoubleZero, Geodnet, Jito, LayerZero, and Wormhole, the biggest directional shift came from the expansion of AI entries.
Notably, AI-linked crypto projects had gained increased prominence during the first quarter of this year, thanks to the rapidly expanding generative AI space.
Over the past year, the sector has continued to attract significant institutional and commercial interest from the general public.
The post Grayscale Cuts Q2 Altcoin Watchlist, Drops Consumer Tokens and Adds AI Names appeared first on BeInCrypto.

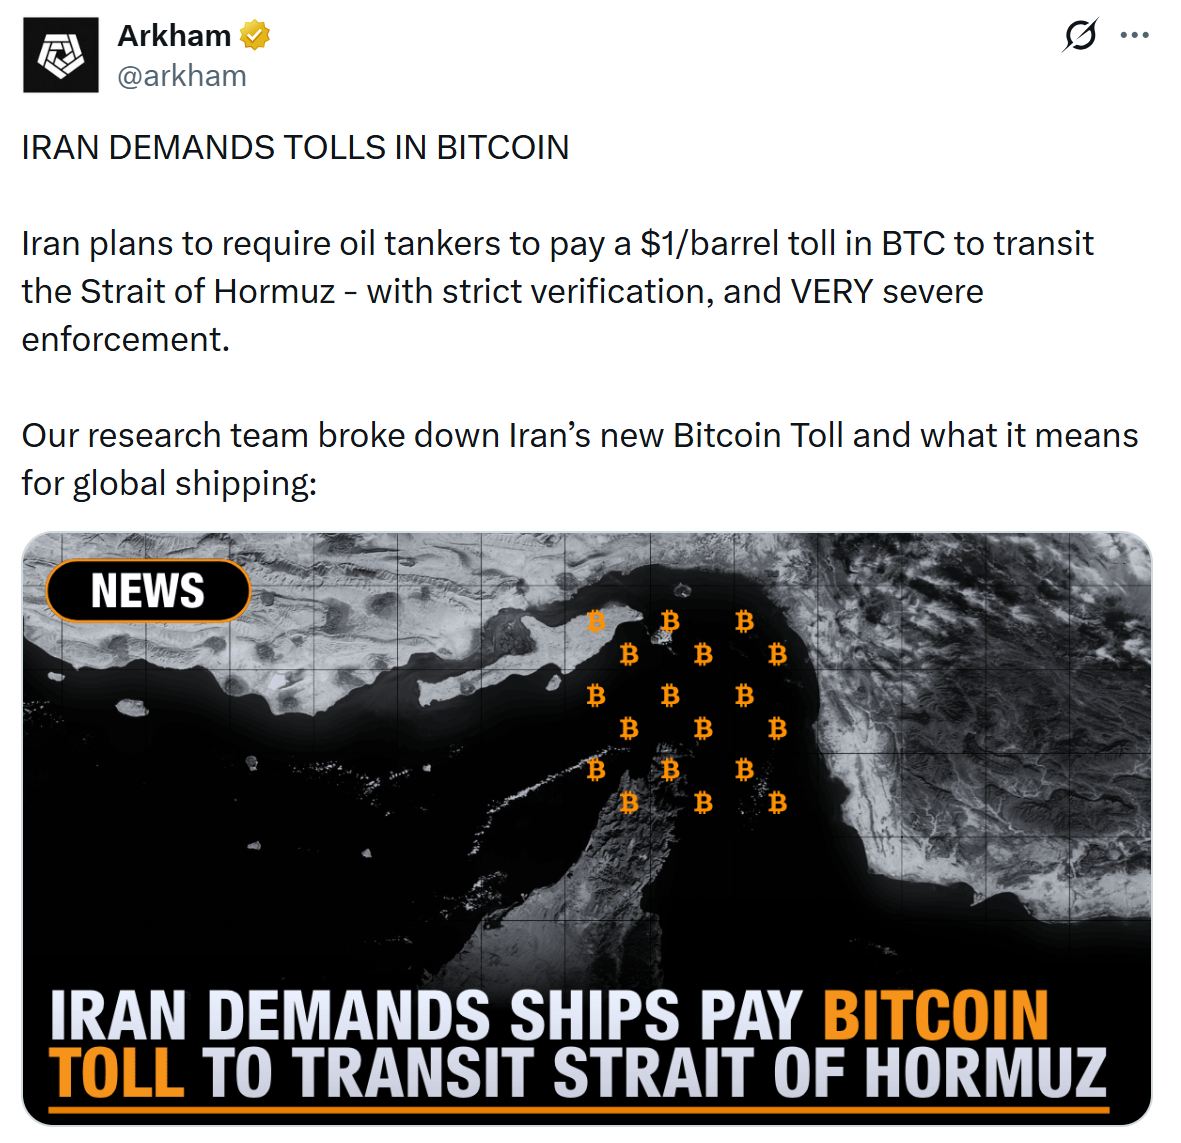
Shipping firms weighing cryptocurrency payments to cover potential transit fees through Iran face substantial sanctions risk, according to Kaitlin Martin, a senior intelligence analyst at Chainalysis. Under current sanctions frameworks, payments linked to the Iranian regime or other sanctioned actors can be interpreted as material support, exposing companies to both U.S. and international restrictions.
The alert comes as reports circulate that Tehran could seek to collect transit fees via crypto for passage through strategic waterways. While U.S. President Donald Trump has signaled he would not tolerate tolls on the Strait of Hormuz, the broader question remains whether crypto could serve as a workaround for sanctions—an idea that experts say is unlikely to escape scrutiny and enforcement actions.
Key takeaways
- Payments to the Iranian regime or sanctioned entities tied to transit routes can be treated as material support, creating meaningful sanctions exposure for shippers and financiers.
- Iran has expanded its use of digital assets, especially stablecoins, to facilitate trade in oil, weapons, and other commodities, but blockchain transparency does not guarantee a bypass of sanctions.
- Cryptocurrency transactions leave a traceable record, which investigators can leverage to freeze or seize assets at cash-out points, complicating evasion efforts.
- Besides Iran, other sanctioned states have explored crypto-enabled trade. Russia, for example, has used digital tokens to support cross-border commerce in the face of sanctions.
- Iran’s Bitcoin mining activity has declined markedly, while the global Bitcoin network remains robust; the disruption appears concentrated within Iran and does not appear to destabilize neighboring markets.
Crypto use and sanctions: what changes, and what remains uncertain
In a field where financial channels are traditionally governed by a dense matrix of controls, the idea that cryptocurrency can neatly sidestep sanctions is met with caution by investigators. Martin notes that while digital assets enable cross-border transfers outside conventional rails, they come with inherent visibility. “In many ways, cryptocurrency is actually easier to trace than traditional methods of sanctions evasion,” she said, highlighting the ability to track funds to eventual cash-out points where authorities can intervene or seize assets.
Public data suggests Tehran is pushing forward with crypto-enabled trade, leveraging digital assets to move value for oil, commodities, and related goods. The trend underscores a broader strategic pivot: sanctioned economies are exploring crypto as a tool to preserve some level of cross-border activity amid pressure from Western jurisdictions. Yet the traceability of blockchain transactions means that these efforts remain exposed to enforcement actions and risk mitigation strategies by banks, exchanges, and other counterparties.
There is a precedent for state actors adopting crypto as a supplementary mechanism for trade under sanctions. For instance, Russia has experimented with digital tokens to facilitate cross-border transactions after international restrictions intensified in 2022. Such moves illustrate the dual nature of crypto in geopolitics: it can expand access to value transfer, but it also amplifies the footprint of regulatory scrutiny and potential sanctions enforcement.
Iranian mining and the global network outlook
The same period that highlights Tehran’s interest in crypto-enabled trade also intersects with a broader crypto mining landscape. Iran’s Bitcoin hashrate has fallen sharply, dropping by about 7 exahashes per second and sliding to roughly 2 exahashes per second, amid ongoing geopolitical tensions and domestic pressures. While this represents a substantial local shift, the global Bitcoin network remains broadly stable, with total hashrate hovering near 1,000 exahashes per second. The decline appears concentrated within Iran, with neighboring Gulf states such as the United Arab Emirates and Oman showing little impact so far.
These dynamics matter for investors and builders in several ways. First, the concentration of mining power in a single region can affect energy markets and grid stress in that area, potentially influencing local policy and energy incentives. Second, the resilience of the global network despite regional disruptions reinforces Bitcoin’s core property as a globally distributed system. And third, the shift in Iran’s mining activity could influence the country’s capacity to monetize energy assets through crypto, a factor worth watching as sanctions and regional risk evolve.
What to watch next
Several developments bear watching in the near term. First, how strictly authorities pursue alleged crypto-enabled sanctions evasion in shipping lanes and whether there are new enforcement actions against companies facilitating such flows. Second, any shifts in Tehran’s crypto and stablecoin usage for trade, including potential policy signals from Iranian authorities. Third, the interplay between regional mining activity and energy policy, particularly in Iran and neighboring states, as sanctions and geopolitical tensions continue to reshape incentives for miners and exporters alike.

The Japanese Cabinet approved a bill on April 10 reclassifying crypto as a financial instrument under the amended Financial Instruments and Exchange Act, pulling digital assets out of the Payment Services Act framework and placing Japanese crypto on the same legal footing as stocks and bonds.
Maximum prison sentences for unregistered sellers jump from 3 years to 10 years. Fines climb from 3 million yen to 10 million yen. Insider trading on undisclosed information is now explicitly banned.
That’s not incremental regulatory cleanup. That’s a structural reclassification with enforcement teeth attached from day one.
The question is exactly what this changes for exchanges, institutional allocators, and the 13 million Japanese residents who already hold crypto accounts – and whether the compliance clock is as short as the headline implies.
- Reclassification under FIEA: Crypto moves from Payment Services Act treatment to full Financial Instruments and Exchange Act coverage, matching stocks and bonds.
- Insider trading ban: Crypto assets are now explicitly subject to insider trading prohibitions based on material non-public information.
- Penalty escalation: Unregistered seller sentences rise to 10 years; fines increase to 10 million yen.
- LPS Act amendment: Japanese venture capital firms can now directly hold crypto assets, removing a structural barrier that had pushed startup funding offshore.
- Tax alignment incoming: Maximum crypto tax rate set to drop from 55% to a flat 20% capital gains rate, matching equities.
- Bitcoin ETF legalization: FSA is targeting 2028 for crypto ETF approvals alongside these rule changes.
Discover: How Wall Street’s Institutional Bitcoin Moves Are Reshaping Crypto Markets
What Does Crypto Reclassification Under Japan FIEA Actually Change for Operators and Investors?
Under the old framework, crypto fell under the Payment Services Act, regulated primarily as a payment mechanism rather than an investment vehicle.
That legal container determined everything: custody standards, disclosure obligations, investor protections, and the severity of enforcement. The FSA’s February 2026 Financial System Council report was direct about the core problem: “information asymmetry” between issuers and retail investors had become structurally dangerous as crypto evolved into an investment asset class.
The new bill fixes that at the legal-definition level. By bringing crypto under the Financial Instruments and Exchange Act, issuers now face mandatory annual disclosure requirements covering technology, token supply, risk factors, and use cases – even for post-listing assets not actively fundraising.
That’s the same disclosure regime Japanese equity issuers operate under. For the 105 cryptocurrencies the FSA flagged for reclassification – including Bitcoin and Ethereum – the compliance surface area just expanded significantly.
The LPS Act amendment is the piece that most institutional observers are watching closely. Previously, Japanese venture capital funds structured as investment limited partnerships were legally prohibited from holding crypto assets directly.
That single restriction had been quietly pushing Web3 startup capital offshore for years. The amendment removes that barrier – meaning domestic VC can now deploy into crypto without restructuring through foreign entities. That’s not a marginal fix. That’s the structural precondition for a functioning domestic crypto venture ecosystem.

Finance Minister Satsuki Katayama framed the cabinet approval as a dual mandate: “expand the supply of growth capital” while ensuring “market fairness, transparency, and investor protection.” The two goals aren’t in tension here – securities-grade oversight is exactly what institutional adoption requires.
A Sandmark Crypto Intelligence Report from April 2026 found that 42% of global finance professionals cited regulatory uncertainty as their primary barrier to allocating to crypto.
Japan just removed that barrier domestically. XRP’s $120 million in weekly ETP inflows recorded in early April show how quickly institutional capital moves once the legal infrastructure aligns – Japan is now building that same infrastructure at the sovereign level.
The site’s position: this is the most consequential single piece of Japan crypto regulation since the PSA amendments that followed Mt. Gox. It doesn’t just add rules – it changes the legal category, which changes everything downstream.
The post Japan Crypto Revolution Inbound? Tokyo Pass New Law Equalising Crypto and Stocks appeared first on Cryptonews.
Crypto World
The Pepeto Price Prediction That Has Analysts Drawing Lines From Presale Entry to the Original Pepe Valuation

The Pepeto price prediction gets its strongest signal yet after Canary Capital filed for the first US spot PEPE ETF, proving meme coins are now serious enough for Wall Street fund wrappers, according to Yahoo Finance.
The meme sector added $2 billion in seven days to $31 billion. That shift changes the Pepeto price prediction for anyone tracking presale entries before listing. The project raised $8.86 million during extreme fear with a Binance listing approaching, and the math between the current entry and Pepe’s original valuation gives the forecast its clearest case yet.
Canary Capital filed to launch a US spot ETF tied to PEPE, making it the first meme coin fund application to go beyond Bitcoin and Ethereum into the meme category, according to Yahoo Finance. The proposed fund would hold spot PEPE through a custodian and could keep up to 5% of assets in ETH for gas fees.
Meanwhile the meme coin sector climbed 7% on the week to a $31 billion market cap, according to CoinMarketCap, with capital rotating from large caps into meme entries where the return math is far bigger.
Presale Entries and Listing Targets Shaping the Token Forecast
Pepeto: Zero Cost Swaps and Pepe Legacy Positioning the Strongest Presale of the Cycle
A spot PEPE ETF filing proves that meme coins have crossed from internet jokes into regulated investment products. One presale drawing even heavier capital through this cycle’s fear is Pepeto, structured not for short term noise but for the kind of returns that rewrite a portfolio after one listing event, making it the Pepeto price prediction that analysts keep returning to.
The project delivers lasting value on clear paths. Staking at 186% APY grows early positions ahead of listing. The 420 trillion token supply matches Pepe’s original structure, giving the Pepeto price prediction a direct reference point that traders can verify.

Exchange tools already handle live activity. PepetoSwap processes token swaps across chains at zero cost, keeping full position value intact. The cross chain bridge routes assets between networks without fees, giving holders access to every chain while protecting what they carry.
Over $8.86 million in capital arrived while the Fear and Greed Index showed extreme fear. Pepeto at $0.0000001863 sits at a fraction of what listing models project, and the space between that price and where trading opens is where the real returns take shape for wallets that act while the number holds.
The presale closes for good once the Binance listing goes live. A developer who built trading systems at Binance shaped every stage of the platform, and the identical supply to Pepe’s original token that reached a multi billion dollar cap with zero tools running gives forecasters the data they need. The wallets that built wealth from Pepe all made one decision: they moved while entry was still open. That same window is open right now, and the listing can drop at any moment.
Pepeto Price Prediction: Listing Targets and Return Scenarios
The Pepeto price prediction begins with the math. At the current presale entry with 420 trillion supply, the fully diluted value sits near $78 million. PancakeSwap launched at $200 million FDV and hit $7 billion. BNB started near $15 million and climbed past $100 billion.
Pepeto sits below both with a working exchange already live. Matching Pepe’s $7 billion cap delivers roughly 89x, and analysts who factor in exchange tools Pepe never had see that as a floor. The forecast ranges from 50x to 300x depending on listing volume.
Conclusion
The Pepeto price prediction points to returns no large cap can approach from current prices. A spot PEPE ETF filing proves that meme coins now attract Wall Street capital, and the project built by the same founder with a working exchange and a Binance listing sits at a fraction of where that capital will price it.
At $0.0000001863, every $1,000 grabs 5.37 billion tokens. If Pepeto matches even a fraction of Pepe’s run on the same 420 trillion supply, that $1,000 turns into six figures. Over $8.86 million already flowed in during extreme fear because thousands of wallets ran that math and committed. The listing can land at any moment, and early holders will be sitting on positions the rest of the market pays multiples more to chase. The Pepeto official website is where that entry is still open.
Click To Visit Pepeto Website To Enter The Presale

FAQs
What is the Pepeto price prediction based on listing models and Pepe’s market cap?
Analysts project 50x to 300x from presale based on Pepe’s $7 billion cap and working exchange tools Pepe never had. The Binance listing is approaching.
How does the 420 trillion supply affect the Pepeto price prediction?
The supply matches Pepe’s original token, giving analysts a verified reference point. Pepeto’s $78 million FDV sits below where exchange tokens historically launch.
Disclaimer: This is a Press Release provided by a third party who is responsible for the content. Please conduct your own research before taking any action based on the content.


The US government moved a small amount of bitcoin on April 10 from wallets that Arkham Intelligence linked to a criminal case. The transfer involved 2.438 BTC, worth about $177,000, sent to a Coinbase Prime address.
Summary
- US government moved 2.438 BTC from seized wallets tied to an alleged steroid conspiracy case.
- Arkham linked the funds to Glenn Olivio, who faced charges filed in 2025.
- The transfer renewed focus on how seized bitcoin moves under the federal reserve policy.
Arkham data showed two separate transactions from wallets labeled “U.S. Government: Glenn Olivio Seized Funds.” Both transfers went to the same Coinbase address, beginning with 3EMqu.
Government-linked bitcoin transfers are not unusual. Federal agencies often move seized assets for custody, consolidation, or other handling during legal and administrative processes.
The latest move still drew attention because the funds may be tied to a 2025 federal case. The transfer also comes after the Trump administration said it had stopped selling seized bitcoin.
That policy became clearer after President Donald Trump signed an executive order creating a strategic bitcoin reserve. Treasury Secretary Scott Bessent later said the government would keep bitcoin obtained through criminal forfeitures.
The Block reported that the seized bitcoin appears linked to Glenn Bradford Olivio. Court records show Olivio was arrested in May 2025 with Dana Rene Light.
Prosecutors charged the pair with five counts, including conspiracy to possess with intent to distribute controlled substances, money laundering conspiracy, aggravated identity theft, and drug possession counts.
The indictment said the case involved “a mixture or substance containing a detectable amount of anabolic steroids.” The listed substances included synthetic testosterone, Trenbolone, Nandrolone, Mestanolone, Oxandrolone, Stanozolol, and Methandienone.
Court filings also included a notice of forfeiture. That step is common when the government seeks to seize property, including cryptocurrency, that it says came from alleged criminal activity.
Reserve policy remains in focus
The transfer comes as federal bitcoin holdings remain under close watch. The US government currently holds about 328,000 BTC, valued at more than $22 billion at current market prices.
In recent weeks, government-linked wallets also moved funds tied to other cases, including assets associated with Ross Ulbricht, Chen Zhi, and Miguel Villanueva.
Those earlier transfers raised questions about whether the government was still sending bitcoin to custodial platforms despite the reserve policy. The latest Olivio-linked transfer is likely to draw similar attention.
PACER shows the steroid case last updated in June 2025. Public records reviewed by The Block did not confirm whether this case is related to an older 2015 marijuana arrest involving a man with the same name.
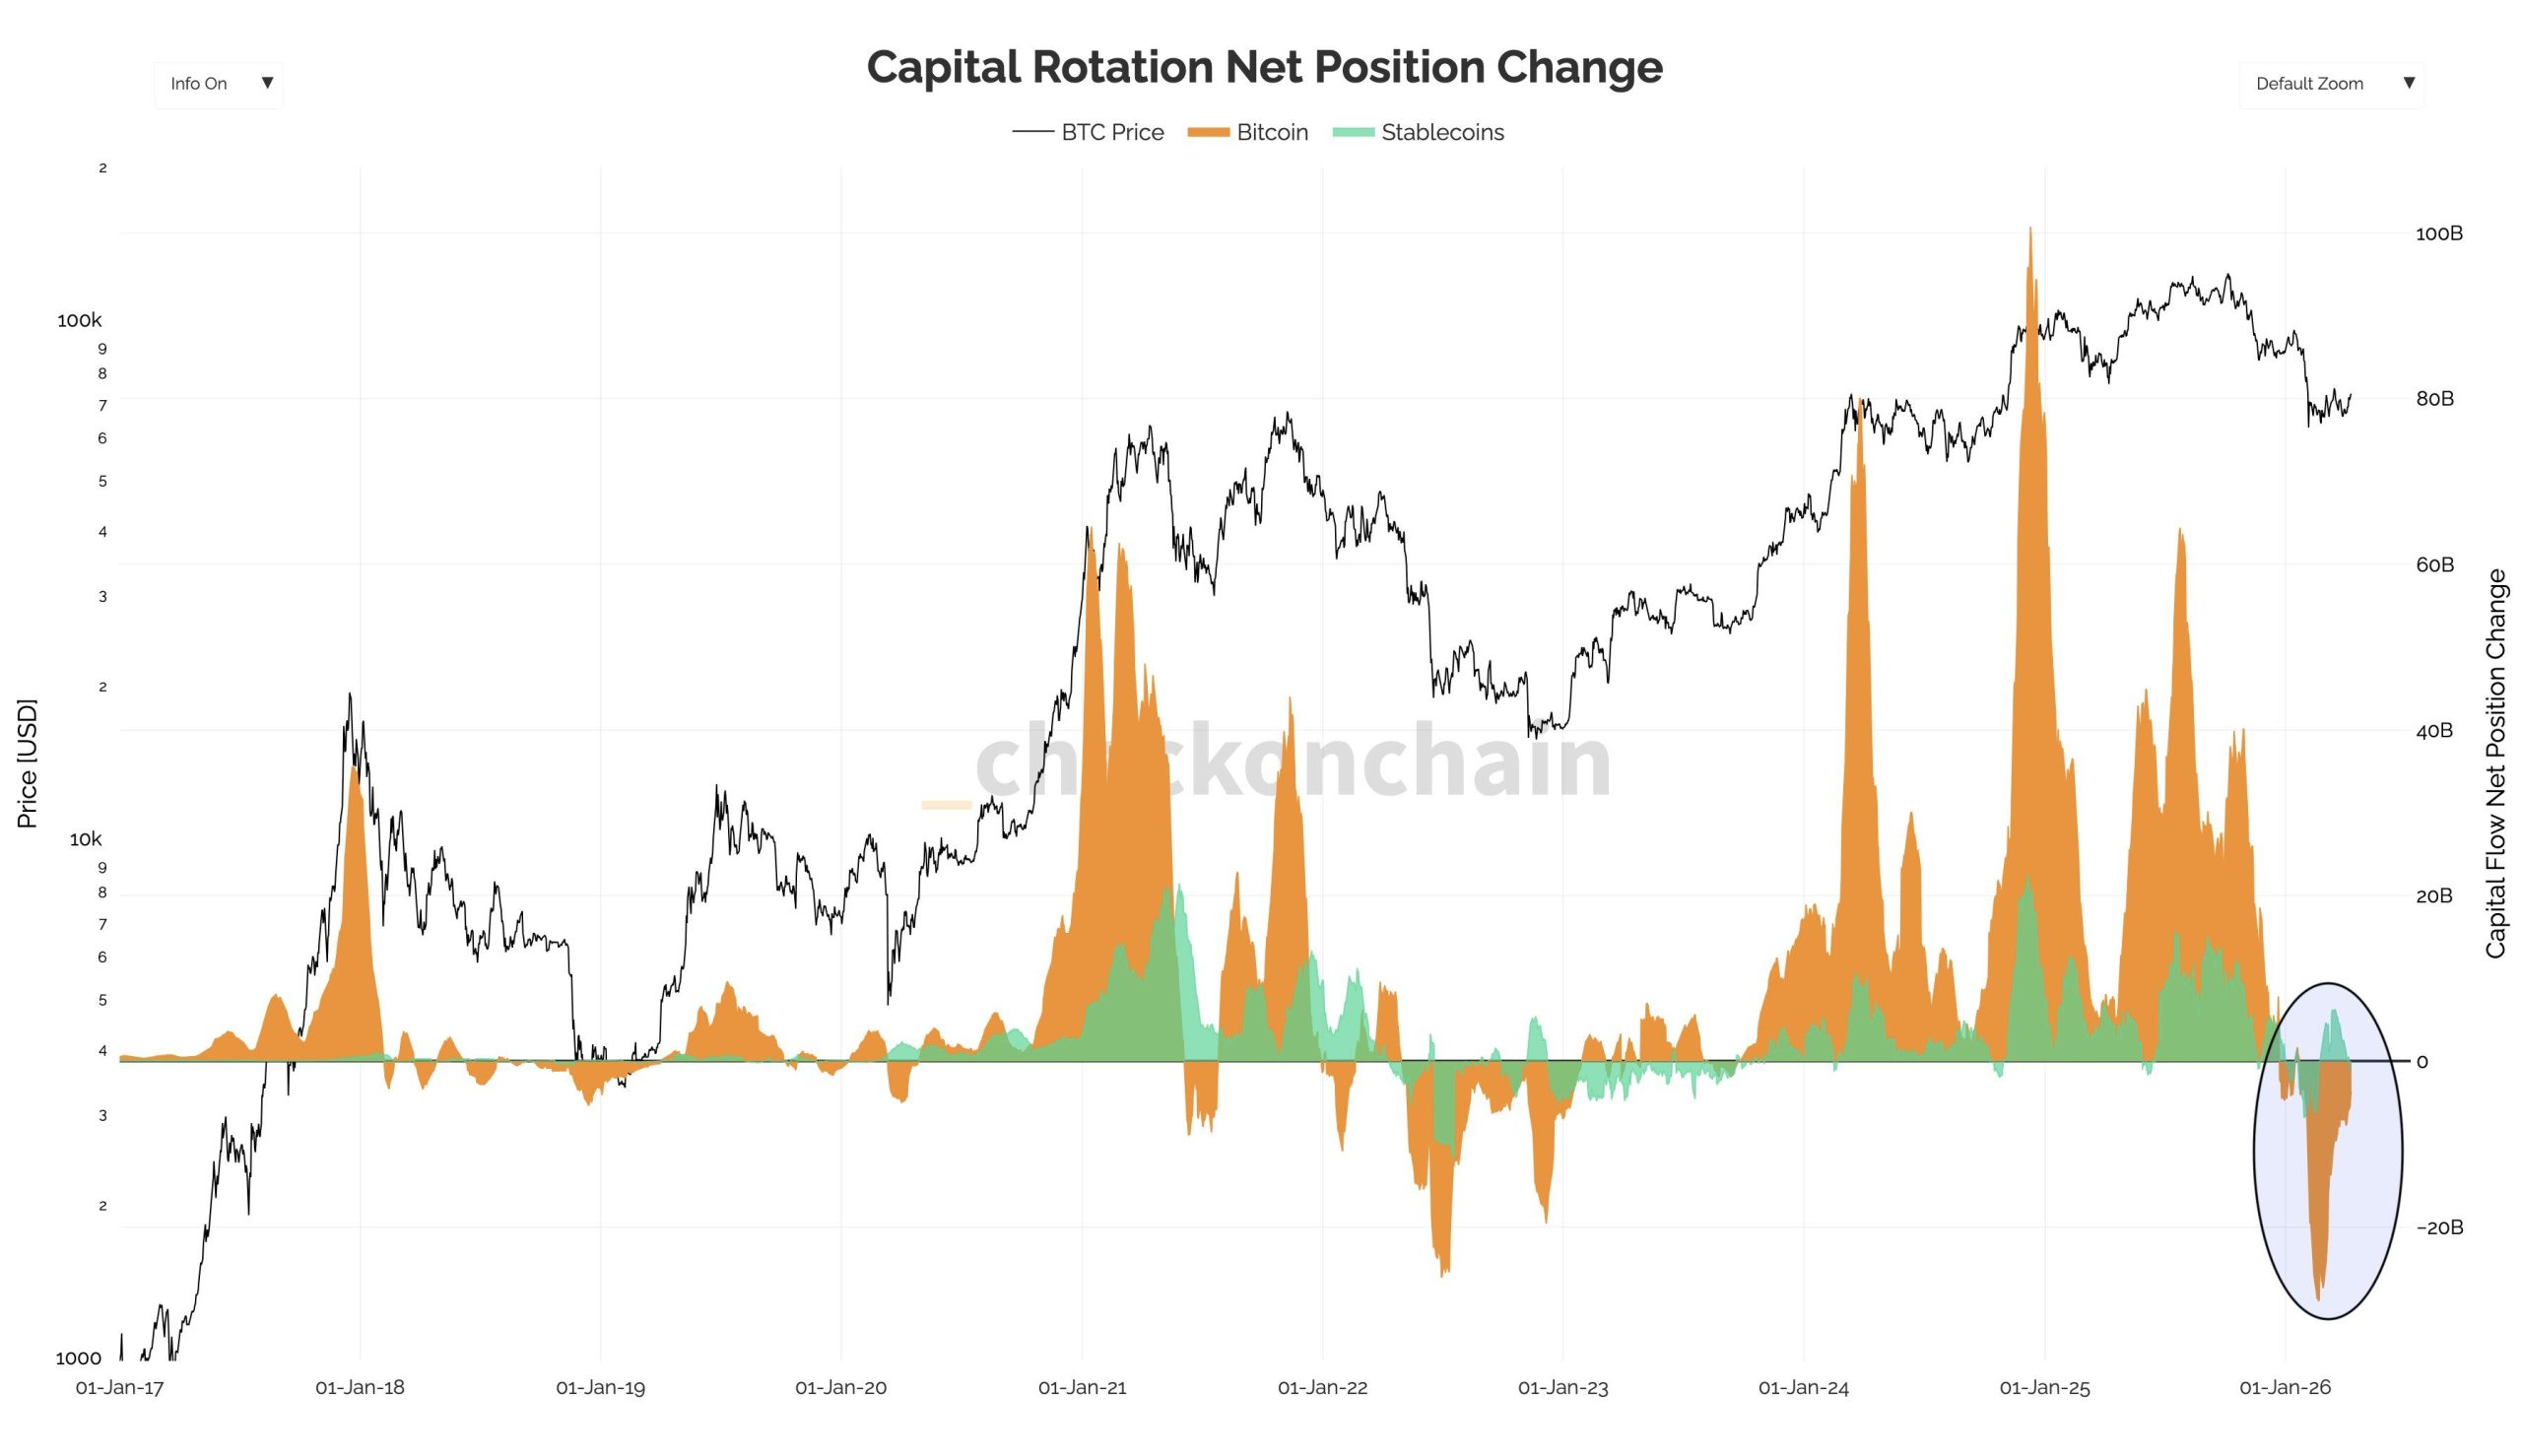
Bitcoin (BTC) is showing early signs of a liquidity rotation, with on-chain metrics and futures positioning both pointing to a gradual shift in investor behavior.
The move comes as BTC’s price has seen a modest recovery amid the conflict between the US, Israel, and Iran.
Stablecoin-to-BTC Pipeline Reopens
In a post on X (formerly Twitter), analyst Darkfost noted that at the end of February, Bitcoin’s realized cap hit an extreme low of -$28.7 billion. At the same time, stablecoin market capitalization grew to over $6 billion.
This reflected defensive positioning by investors looking to preserve capital without fully exiting the market. According to the analyst,
“This marked the first time such a rotation had been observed since the previous bear market. At that stage, this configuration signaled a clear intention from investors to protect their capital.”
Follow us on X to get the latest news as it happens
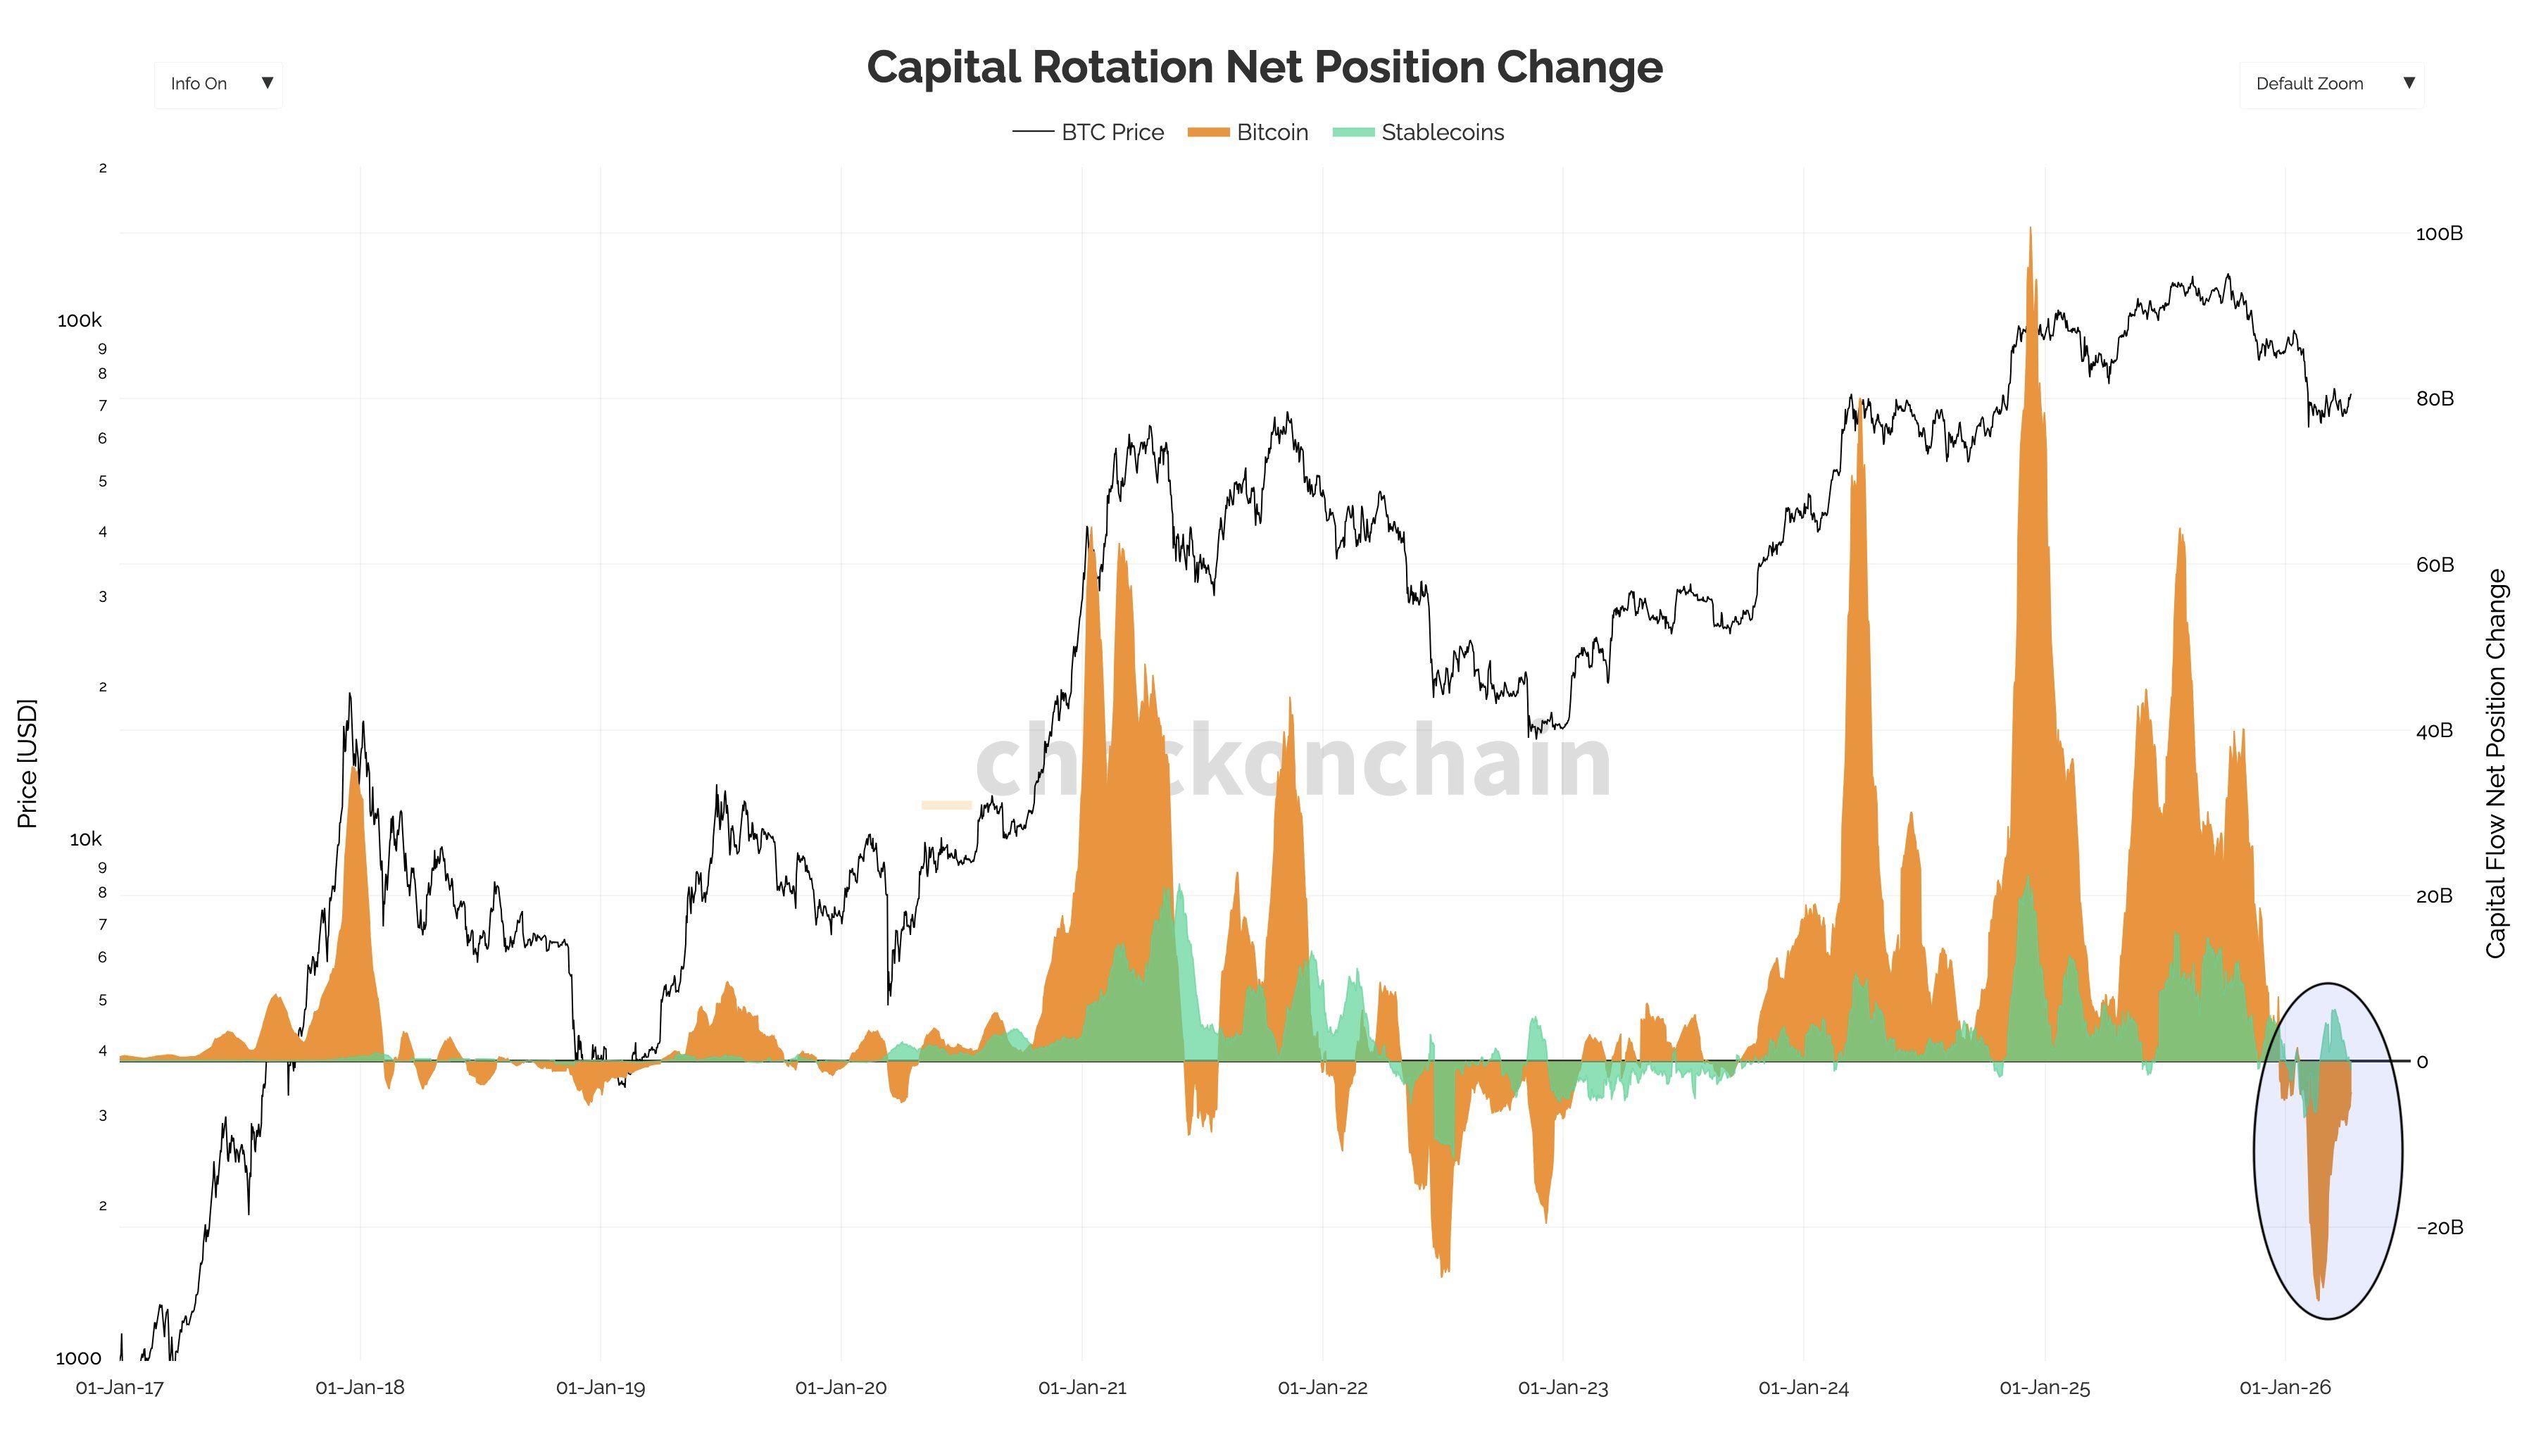
However, the picture has since shifted. Bitcoin’s realized cap has recovered to -$3 billion. Meanwhile, stablecoin capitalization has declined to -$1 billion. Capital that once sat on the sidelines appears to be flowing back into the largest cryptocurrency.
Futures Positioning Mirrors 2023 Pre-Breakout Setup
Derivatives data support the optimism. Analyst Michaël van de Poppe noted that speculators are now net long on Bitcoin.
“Very similar to previous cases where we’ve seen the same before a big breakout in 2023. Commercials’ Net Position has been net short on the markets, which is the inverse of the speculators,” Poppe said.
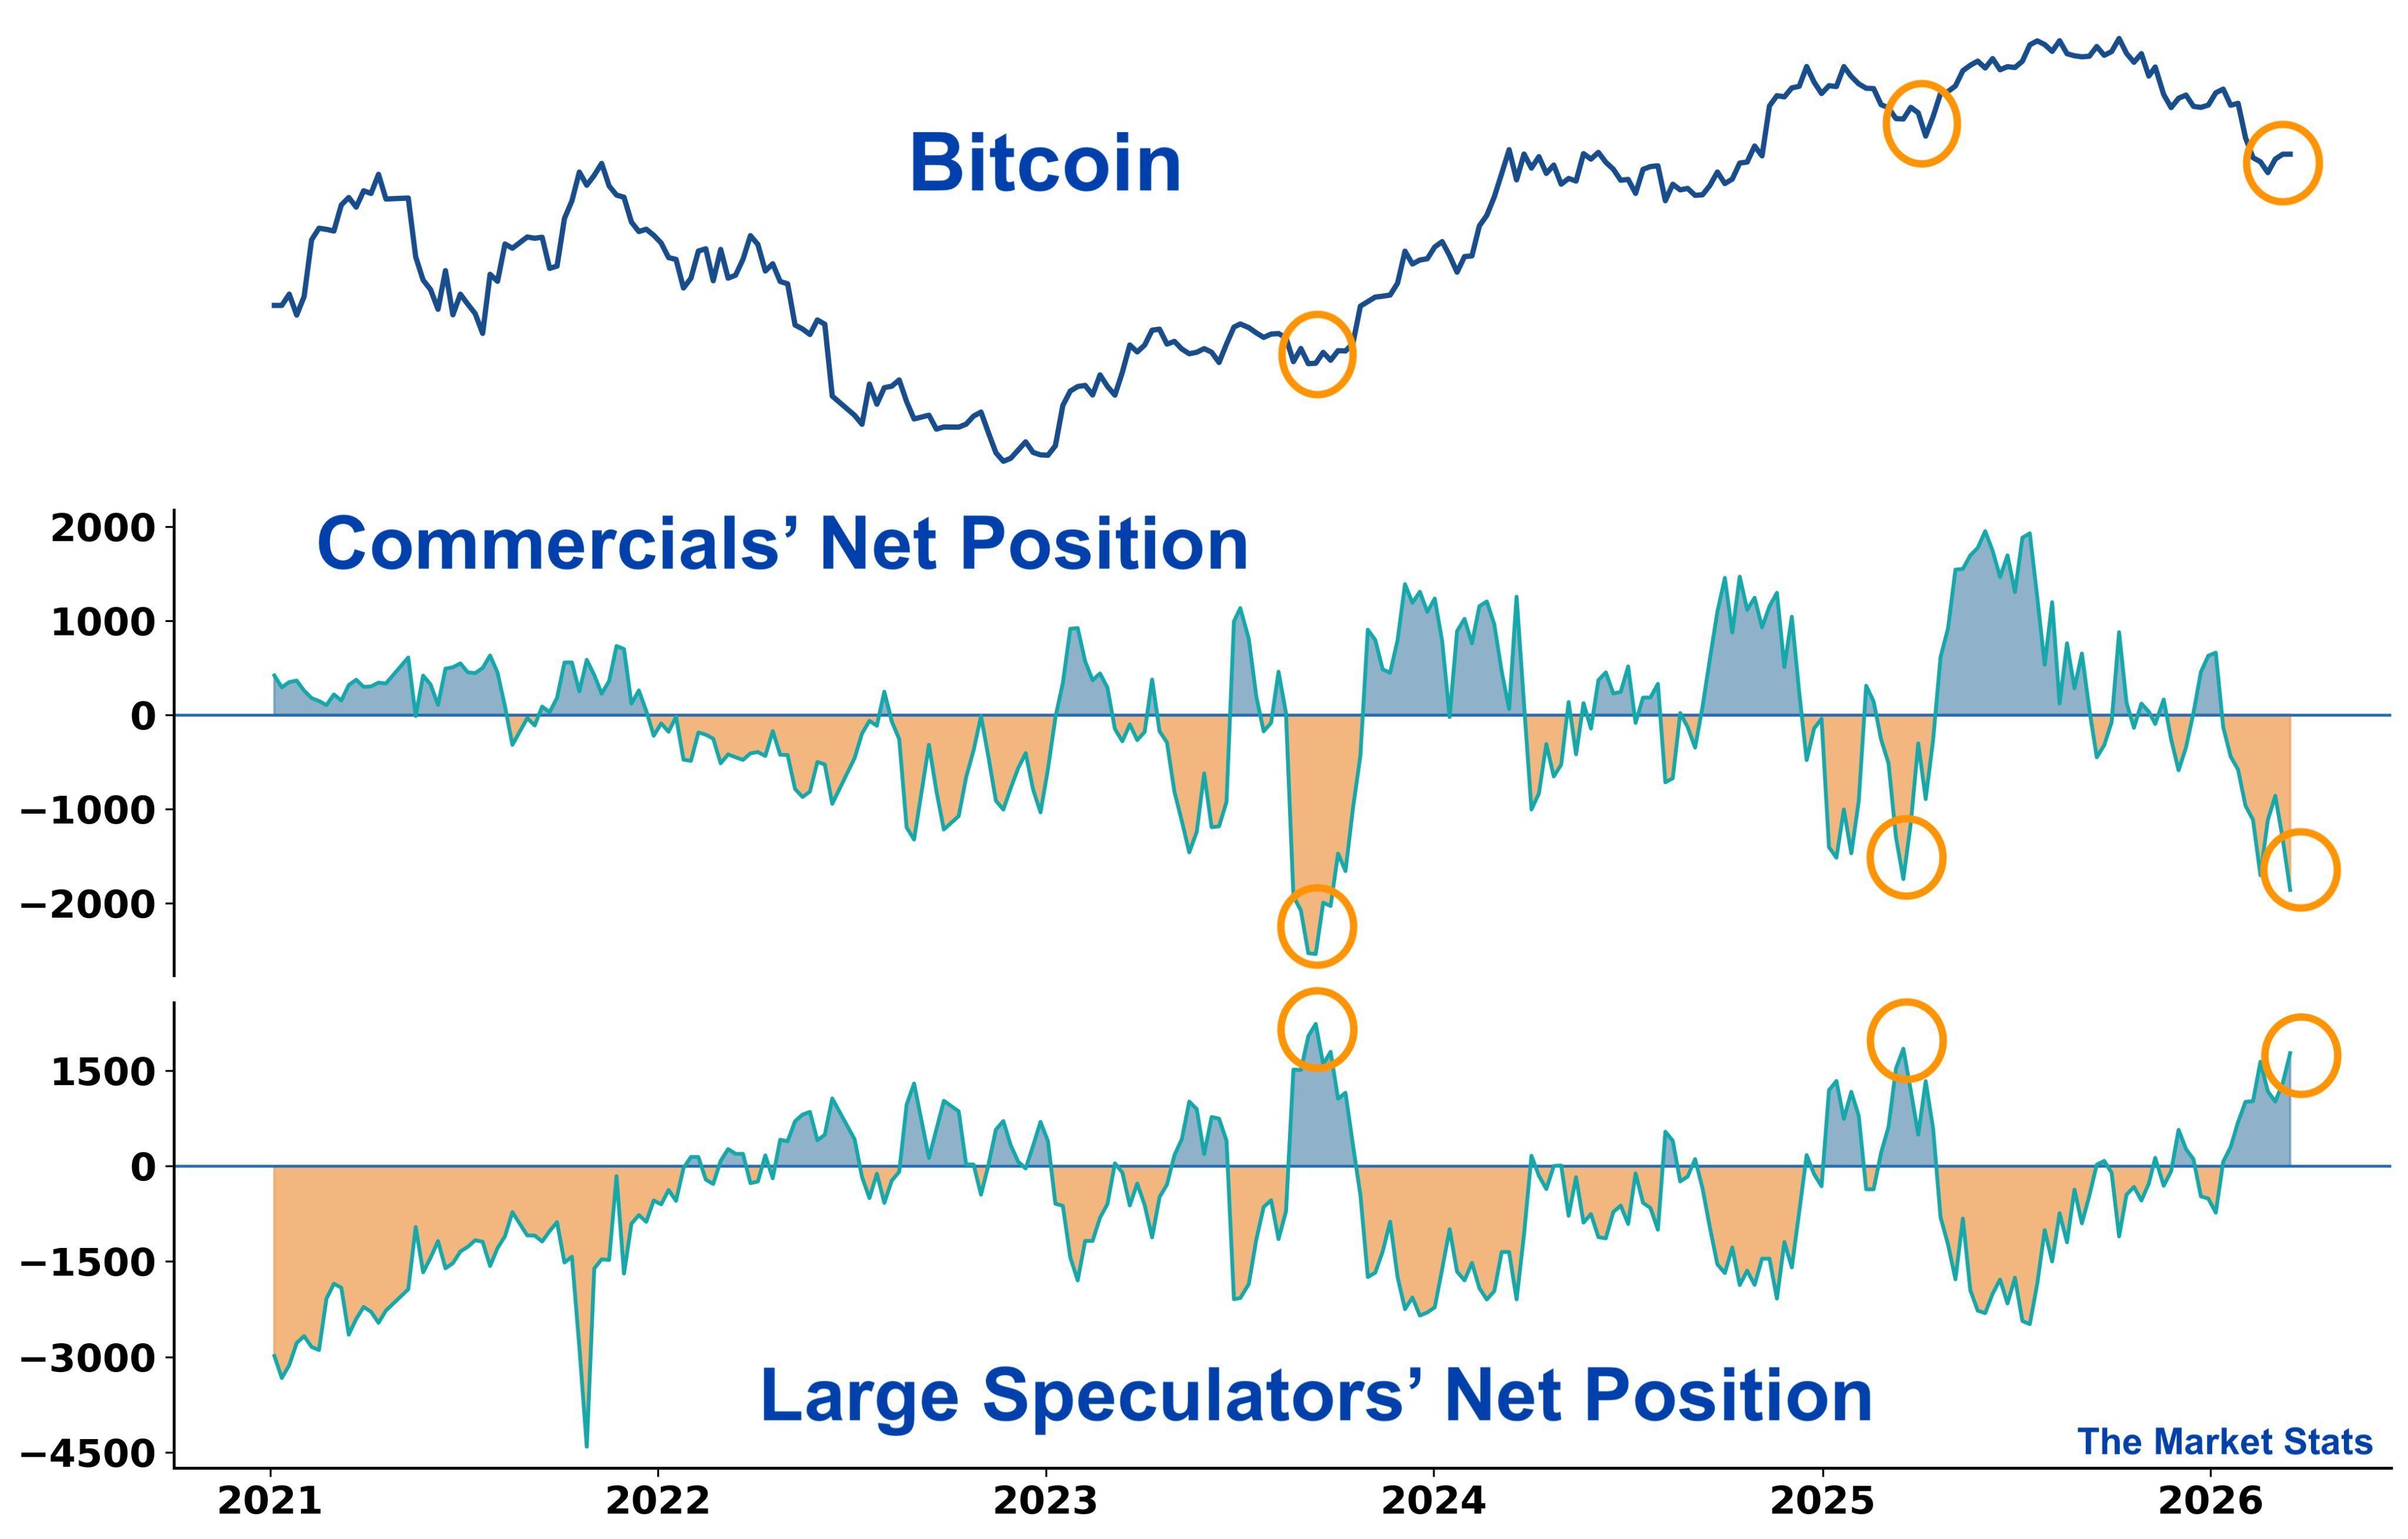
Van de Poppe suggested that BTC could reach $80,000- $85,000. He cautioned, however, that the data points to elevated volatility rather than a guaranteed directional move.
“Now, this doesn’t guarantee that we’re going to be breaking upwards massively. It does say that there’s a significant chance for volatility, also knowing that we’ve been ranging in this area for two months and markets refused to fall down,” he wrote.
Subscribe to our YouTube channel to watch leaders and journalists provide expert insights
The timing of these shifts is worth noting. Darkfost stated that it began as uncertainties surrounding the Iran conflict reached their peak.
“Almost as if some investors are starting to view Bitcoin as an edge against inflationary and economic risks stemming from the situation,” he remarked.
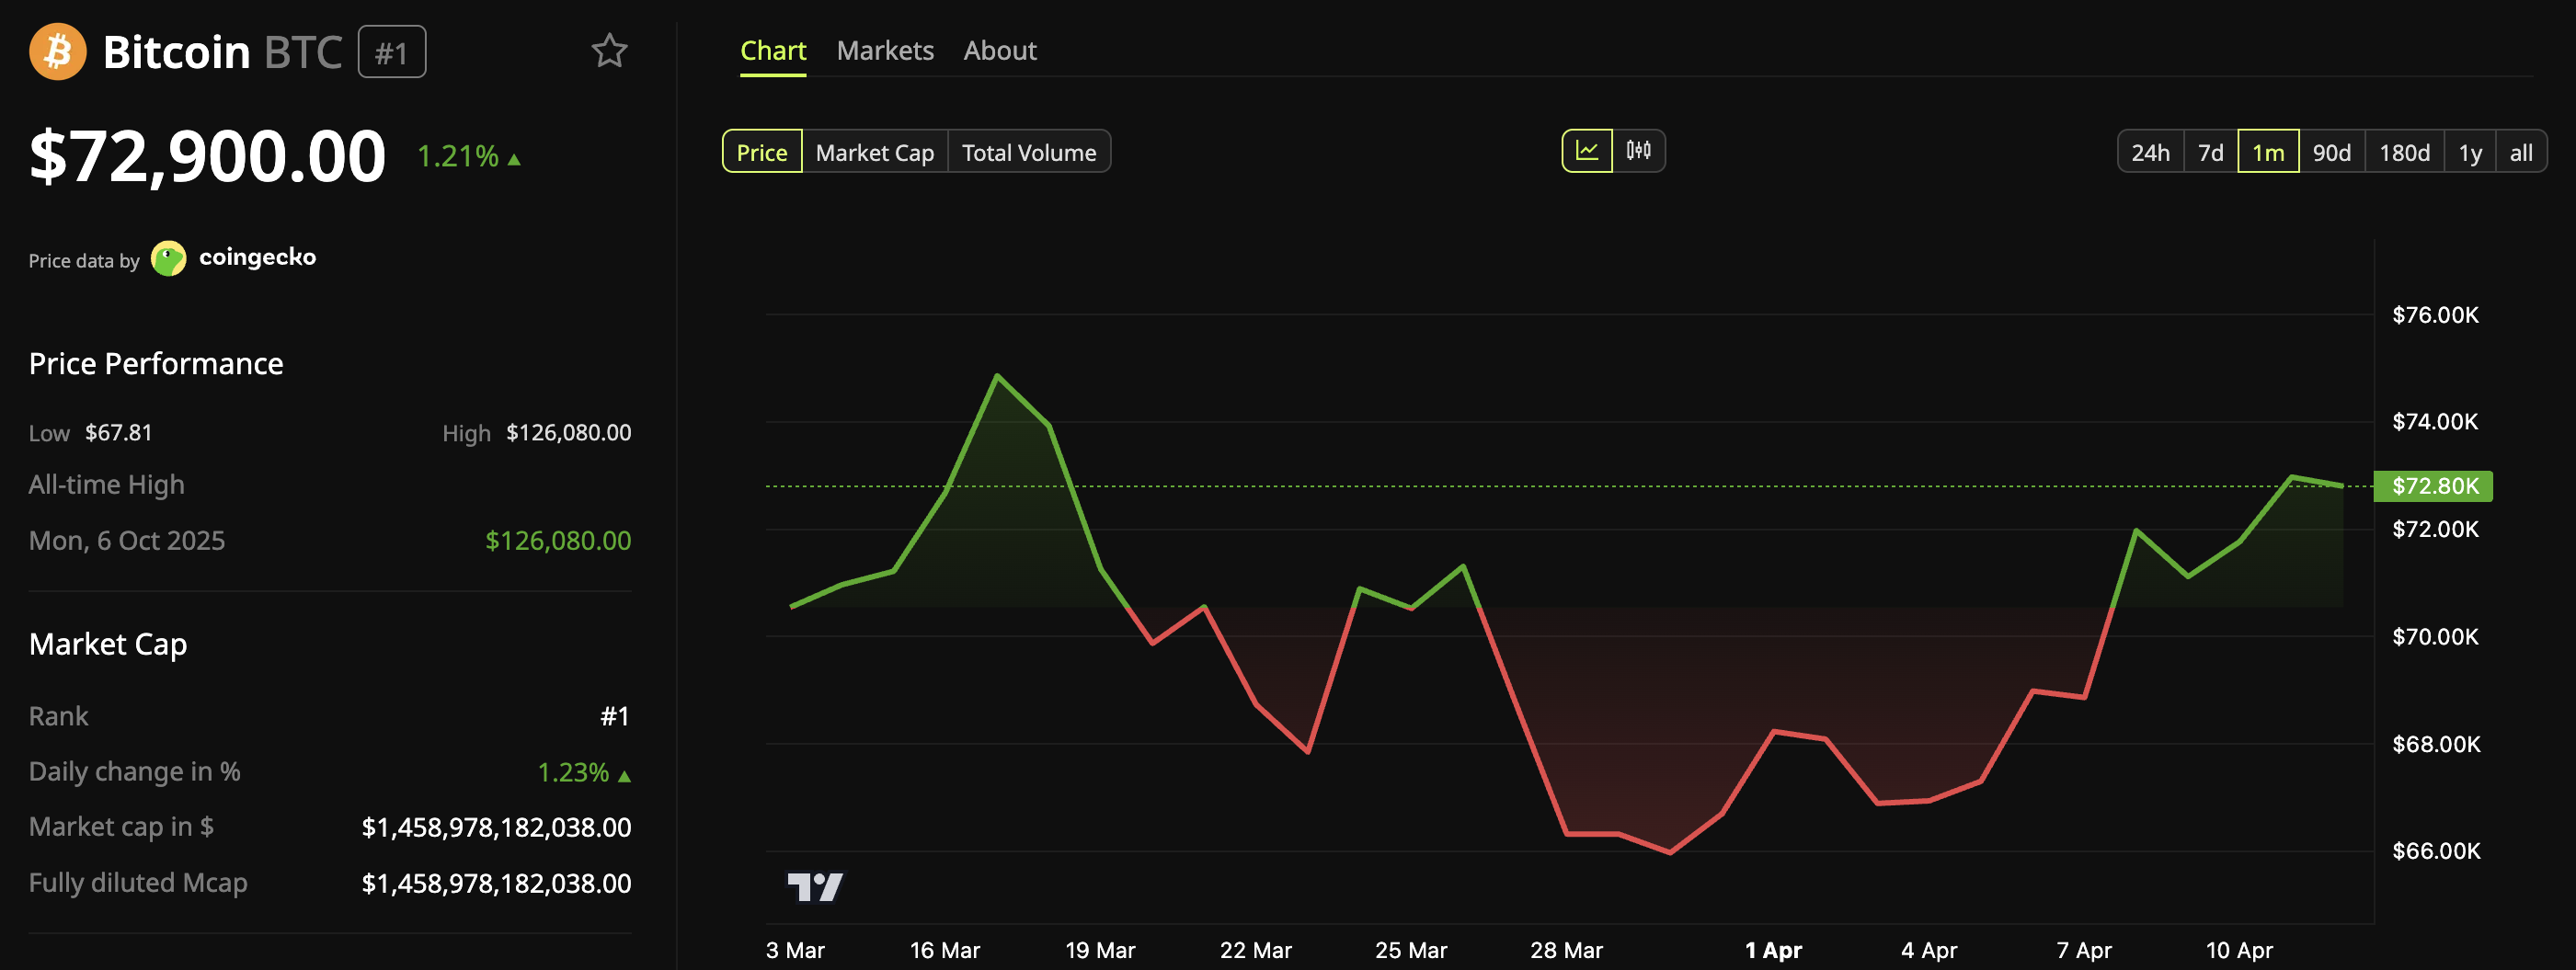
Bitcoin has gained over 10% since the war began on February 28. For now, the recovery remains modest, but Darkfost suggested that if the rotation continues, the asset’s recovery could continue.
BeInCrypto Markets data showed that BTC gained over 1% over the past day as ceasefire negotiations continue in Pakistan. At press time, the cryptocurrency traded at $72,900.
The post Money Is Rotating Back Into Bitcoin, On-Chain Data Shows appeared first on BeInCrypto.


San Francisco police arrested a suspect after an alleged firebomb attack at OpenAI chief executive Sam Altman’s home.
Summary
- Police arrested a 20-year-old after a firebomb attack at Sam Altman’s San Francisco home Friday.
- OpenAI said no one was hurt after the exterior gate of the property caught fire.
- Altman later addressed the attack and allegations from The New Yorker in a Sunday post.
The case drew wider attention after police said the same person later moved toward OpenAI headquarters and made threats.
The San Francisco Police Department said an unknown man threw an incendiary device at a North Beach home on Friday. Police said the device caused a fire at the exterior gate of the property.
Officers said the suspect fled on foot after the attack. Police later found and arrested a 20-year-old near OpenAI headquarters after reports of threats to damage the building.
A spokesperson for OpenAI told CNBC that no one was injured in the incident. The company said it is working with police as the investigation continues.
Police said the suspect threatened to burn the building down. Authorities have not yet disclosed charges, and investigators have not released further details about motive or evidence.
The attack came during a period of renewed public scrutiny around Altman and OpenAI. Earlier this month, The New Yorker published a report that questioned Altman’s handling of safety issues and leadership disputes.
Altman later addressed both the attack and the report in a blog post.
“Normally we try to be pretty private, but in this case I am sharing a photo in the hopes that it might dissuade the next person from throwing a Molotov cocktail at our house,” he wrote.
Blog post addresses past conflicts
Altman also responded to criticism raised in the New Yorker report. He said the article was “incendiary” and said he had underestimated “the power of narratives.”
He also acknowledged past mistakes at OpenAI. Altman wrote, “I have made many other mistakes throughout the insane trajectory of OpenAI,” and said he was sorry to people he had hurt.
Shipping firms that turn to cryptocurrency to pay potential transit fees to Iran could face significant sanctions exposure, according to Kaitlin Martin, senior intelligence analyst at Chainalysis.
Martin told Cointelegraph that under the current sanctions framework, any payments made to the Iranian regime, including those tied to passage through key waterways, could be interpreted as “material support,” putting companies at risk of violating US and international restrictions.
“Doing so could carry significant sanctions violation risk, as the Iranian Revolutionary Guard Corps is sanctioned by multiple jurisdictions and Iran is subject to comprehensive sanctions by the United States,” she said.
The warning comes amid reports that Iran may seek to collect transit fees in cryptocurrency. While there has been no official confirmation, US President Donald Trump has said he would not accept any attempt by Tehran to impose tolls on shipping through the vital waterway.
Related: White House warns staff as Iran bets add to growing insider trading concerns
Iran expands crypto use
Tehran has already expanded its use of digital assets, particularly stablecoins, to facilitate trade in oil, weapons and commodities, based on publicly available data, Martin said.
However, she noted that cryptocurrency is not a foolproof workaround for sanctions. While it enables cross-border transfers outside the conventional financial system, blockchain transactions are inherently transparent and leave a permanent record.

“In many ways, cryptocurrency is actually easier to trace than traditional methods of sanctions evasion,” she said, pointing to the ability of investigators to follow funds to cash-out points where assets can be frozen or seized.
Other sanctioned states have also explored similar approaches. Russia, for instance, has used digital tokens such as A7A5 to facilitate cross-border trade following sanctions imposed after its 2022 invasion of Ukraine.
Related: Bitcoin community weighs in on reports of Iran’s crypto toll for oil ships
Iran’s Bitcoin hashrate drops sharply
As Cointelegraph reported, Iran’s Bitcoin (BTC) mining power has dropped significantly over the past quarter, losing around 7 exahashes per second and falling to roughly 2 EH/s, amid escalating tensions with the United States and Israel.
Despite the regional disruption, the global Bitcoin network remains stable, with total hashrate holding near 1,000 EH/s. Notably, the impact has been contained within Iran, with neighboring countries such as the United Arab Emirates and Oman unaffected.
Magazine: Bitcoin may take 7 years to upgrade to post-quantum — BIP-360 co-author
Shivang Kumar: Like Pakistan’s Usman Tariq, SRH chinaman inspired by MS Dhoni’s ‘Untold Story’ | Cricket News
Apple TV’s New Keanu Reeves Movie Beats Bad Reviews With Strong Streaming Debut

Bolton awards recognise inspiring women in business

Why Israel is blocking foreign journalists from entering

Bitcoin: We’re Entering The Most Dangerous Phase

Alan Cumming Brands Baftas Ceremony A ‘Triggering S**tshow’

Paisa kamane wala app 2026 || NEW UPI MONEY EARNING APP || New Earning App Today || Jio Finance App

How J.P. Morgan Saved the U.S. Government during the financial crisis of 1895 #money

Stock Market, Gold & Silver Astrology Prediction: Big Turning Point Ahead? | Prashant Kapoor LIVE
-

 Business6 days ago
Three Gulf funds agree to back Paramount’s $81 billion takeover of Warner, WSJ reports
-

 Sports7 days ago
India men’s 4x400m and mixed 4x100m relay teams register big progress | Other Sports News
-

 Politics19 hours ago
US brings back mandatory military draft registration
-

 Fashion20 hours ago
Weekend Open Thread: Veronica Beard
-

 Tech4 days ago
How Long Can You Drive With Expired Registration? What Florida Law Says
-

 Business6 days ago
No Jackpot Winner, Prize to Climb to $231 Million
-

 Fashion5 days ago
Massimo Dutti Offers Inspiration for Your Summer Mood Board
-
 Sports20 hours ago
Man United discover Nico Schlotterbeck transfer fee as defender reaches Dortmund agreement
-

 Fashion4 days ago
Let’s Discuss: DEI in 2026
-

 Crypto World3 days ago
Bitcoin recovers as US and Iran Agree a Ceasefire Deal
-

 Crypto World2 days ago
Canary Capital Files SEC Registration for PEPE ETF
-

 Business17 hours ago
Tesla Model Y Tops China Auto Sales in March 2026 With 39,827 Registrations, Beating Cheaper EVs and Gas Cars
-

 Business7 days ago
Akebia Therapeutics, Inc. (AKBA) Discusses Pipeline Progress and Strategic Focus on Kidney Disease Treatments at R&D Day – Slideshow
-

 Business1 day ago
OpenAI Halts Stargate UK Data Centre Project Over Energy Costs and Copyright Row
-

 Tech5 days ago
Gamer Restores the Original PlayStation Portal From Two Decades Ago
-

 Tech5 days ago
Haier is betting big that your next TV purchase will be one of these
-

 Tech5 days ago
The Xiaomi 17 Ultra has some impressive add-ons that make snapping photos really fun
-

 Tech5 days ago
Samsung just gave up on its own Messages app
-

 Politics1 day ago
Malcolm In The Middle OG Turned Down ‘Buckets Of Money’ To Appear In Reboot
-

 Tech5 days ago
Save $130 on the Samsung Galaxy Watch 8 Classic: rotating bezel, sleep coaching, and running coach for $369
You must be logged in to post a comment Login