
Crypto World
SEC’s Paul Atkins Pushes Congress to Sign CLARITY Act

TLDR:
- SEC Chair Paul Atkins urges Congress to pass the CLARITY Act for clear crypto rules.
- Senate Agriculture Committee advances bill expanding CFTC authority over digital assets.
- Industry leaders like Coinbase and Ripple welcome clarity for institutional participation.
- Prediction markets show growing confidence that the CLARITY Act will pass in 2026.
The CLARITY Act is gaining momentum as SEC Chair Paul Atkins urges Congress to act. The bill seeks to define crypto market rules, protect consumers, and provide legal certainty for both retail and institutional participants in the U.S.
SEC Chair Calls for Immediate Congressional Action
SEC Chair Paul Atkins has publicly urged Congress to pass the CLARITY Act without delay. He stated that current frameworks for cryptocurrency oversight are insufficient to guide the rapidly evolving industry.
The emphasis is on creating rules through legislation rather than relying on enforcement actions or lawsuits. Atkins highlighted that regulatory uncertainty has become a risk to the market rather than a safeguard for investors.
He emphasized the importance of clearly defining jurisdiction, protecting consumers, and allowing institutions to operate with legal certainty. The SEC is actively seeking congressional support to implement these measures.
During a joint session with CFTC Chair Michael Salig, both regulators confirmed their commitment to harmonizing regulatory approaches.
The collaboration aims to provide confidence to market participants and ensure that the United States maintains a leadership position in the global cryptocurrency market.
Coinbase’s chief policy officer described the session as “extremely impressive,” noting Chairman Salig’s focus on bringing global crypto markets back to U.S. oversight.
The CLARITY Act is not intended to boost prices but to provide clear rules, allowing both retail and institutional participants to operate with certainty.
Atkins also indicated that delay is no longer acceptable. By publicly urging Congress, the SEC signals that a clear regulatory framework is essential for stable and predictable market operations.
Legislative and Industry Support Builds
The Senate Agriculture Committee recently voted 12-11 to advance cryptocurrency market structure legislation, expanding CFTC authority over digital commodities, including Bitcoin.
The bill complements the CLARITY Act framework passed by the House in 2025 and seeks to clarify the roles of the SEC and CFTC in market oversight.
Industry leaders have welcomed this development. Brad Garlinghouse of Ripple Labs stated, “Clarity is better than chaos.” Coinbase worked with banking institutions to rewrite parts of the market structure bill, addressing the concerns of both traditional and digital finance stakeholders.
Prediction markets tracking the bill show odds of passage rising from 20% to 60%, reflecting growing confidence among investors and policymakers. White House crypto czar David Sacks has convened meetings with banks, trade groups, and crypto firms to discuss the CLARITY Act.
If this momentum continues, the legislation could mark the end of the “wild west” environment for U.S. crypto markets. Clearer rules are expected to foster broader institutional participation, provide legal certainty, and support long-term growth across the digital asset ecosystem.


Strategy, the Bitcoin treasury vehicle led by Michael Saylor’s publicly traded company, continues to accumulate BTC even as the market retreats from the week’s high. After Bitcoin briefly topped the $73,000 mark, Strategy reaffirmed its intent to keep adding, underscoring a deliberate, long-horizon bet on digital assets despite broader macro headwinds.
On Sunday, Saylor circulated a chart tracking Strategy’s BTC purchase history and urged followers to “Think bigger,” a refrain that has become closely tied to the firm’s ongoing accumulation. The most recent disclosed buy occurred on April 6, when Strategy bought 4,871 BTC for more than $329.8 million, according to a filing with the U.S. Securities and Exchange Commission. With this addition, Strategy’s total holdings rose to 766,970 BTC, a stake valued at roughly $54.5 billion using contemporaneous prices cited in the filing. The Tysons Corner, Virginia-based company continues to be widely cited as the largest BTC treasury by holdings, a standing corroborated by BitcoinTreasures data.
Key takeaways
- Strategy pressed on with BTC accumulation, adding 4,871 BTC in the April 6 purchase for more than $329.8 million, bringing total holdings to 766,970 BTC.
- The average acquisition cost for Strategy’s BTC is $75,644 per coin; the current market value circumscribed by the cited prices places the cost basis notably below the prevailing price at publication.
- Strategy reports unrealized losses of about $14.5 billion on its BTC holdings for Q1 2026, according to its SEC filing, highlighting the contrast between cost basis and mark-to-market value during a prolonged bear phase.
- In March, Strategy’s accumulation outpaced new supply from miners, with miners producing ~16,200 BTC and Strategy purchasing 46,233 BTC that month—roughly three times the newly mined output.
- BitcoinTreasuries still ranks Strategy as the largest BTC treasury holder, with Twenty One Capital as the next-largest holder at 43,514 BTC; other notable activity includes MARA Holdings’ March sale of 15,133 BTC to finance a debt repurchase, signaling mixed treasury strategies in the sector.
Strategy’s unyielding BTC accumulation and what it signals
The ongoing accumulation posture by Strategy matters because it represents a steady, high-profile load of supply being absorbed by a single entity. The April 6 purchase—4,871 BTC for more than $329.8 million—keeps Strategy’s aggregate holdings near a threshold that many market observers consider a floor for the firm’s long-term bets on Bitcoin adoption and macro hedging. With the latest purchase, the total BTC reserve sits at 766,970 coins, a level that places Strategy well ahead of all other corporate treasuries tracked publicly by BitcoinTreasuries. The market value cited in the filing—about $54.5 billion at the prices of that day—illustrates the scale at which the firm operates within the sector’s balance-sheet dynamics.
The company’s stance sits in contrast to the capitulation narratives that have surrounded other large holders in a challenging operating environment. As Strategy continues to accumulate, it maintains a cost basis of roughly $75,644 per BTC on average. That figure sits below the current price band, offering a cushion relative to recent volatility. Still, the unrealized losses reported for the quarter magnify the tension between long-term confidence in Bitcoin’s narrative and the short-term mark-to-market realities that press publicly traded treasuries to disclose in quarterly filings.
Unrealized losses, mining dynamics, and the broader market context
Strategy reported approximately $14.5 billion in unrealized losses on its BTC position for the first quarter of 2026. Such a figure underscores that profitability on paper can diverge sharply from the firm’s long-term conviction in the asset class, particularly when accounting for ongoing accumulation strategies that deploy fresh capital into BTC during price drawdowns.
From a market dynamics perspective, Strategy’s buying cadence appears to be outpacing the rate at which new BTC is minted by miners. March data indicated miners produced about 16,200 BTC, while Strategy added 46,233 BTC during the same period. That delta—nearly three times the newly mined supply in a single month—has fed speculation about potential supply constraints in a market that has already seen years of gradual adoption and institutional interest intensify during bullish phases. Analysts cited in coverage have noted that persistent demand from large treasuries could influence Bitcoin’s supply dynamics, particularly if the pace of adoption by corporate and high-net-worth actors remains elevated despite cyclical headwinds.
Amid these developments, Strategy’s leadership has continued to articulate a long-horizon thesis. In April, Saylor emphasized that BTC represents digital capital and suggested that the market’s drivers were shifting away from a fixed four-year cycle toward flows of capital, underpinned by traditional and digital credit channels. That framing aligns with Strategy’s approach: accumulate on weakness, maintain a long-dated exposure, and view BTC as a form of capital allocation rather than a pure price-forecasting instrument.
Positioning within the BTC treasury ecosystem and notable market contrasts
Strategy’s 766,970 BTC reserve makes it the largest publicly known BTC treasury by holdings, according to BitcoinTreasuries. The next-largest known treasury is Twenty One Capital, which holds about 43,514 BTC. This ranking underscores the outsized influence Strategy commands in the corporate-BTC landscape and helps frame the possible ceiling for what a single, well-capitalized entity can accumulate over an extended period of time.
The sector’s dynamics are further colored by other corporate actions. MARA Holdings, for example, took a different route in March by selling 15,133 BTC for roughly $1.1 billion to fund a buyback of zero-coupon convertible notes due in 2030 and 2031. The company framed the move as enhancing financial flexibility and strategic optionality as it pursues a broader business portfolio beyond mining into “digital energy and AI/HPC infrastructure.” The contrast between MARA’s opportunistic sale to optimize the balance sheet and Strategy’s continued accumulation highlights a broader spectrum of treasury management strategies within the crypto market.
What these moves mean for investors and the road ahead
For investors observing BTC’s price action and treasury activity, Strategy’s continued purchases serve as a persistent signal of institutional confidence in Bitcoin’s long-term value proposition. While the unrealized losses on Strategy’s portfolio remind readers that mark-to-market accounting can be painful in the near term, the company’s willingness to deploy capital during a bear market suggests a belief in the asset’s durability and eventual appreciation potential. The dynamic between Strategy’s accumulation pace and miners’ production—where a single entity is rapidly absorbing a chunk of new supply—could influence liquidity and the marginal cost of capital for BTC in future cycles. If capital inflows accelerate or if macro conditions alter the calculus for large holders, the market could see shifts in supply-demand balance that ripple through mining economics, on-chain activity, and price discovery.
Looking forward, readers should monitor several moving parts: the cadence of Strategy’s purchases, any new disclosures around unrealized losses and cost basis, and evolving comparisons with other large holders. The regulatory environment, as well as broader credit and liquidity conditions that shape “digital capital” flows, will also influence how these corporate treasuries navigate future cycles. As Saylor has pointed out, BTC’s value proposition as digital capital remains central to the argument for long-term accumulation, even as near-term volatility persists.
For now, the market’s focus remains on Strategy’s next move. Will the firm press ahead with additional buys in the near term, or will macro volatility temper the cadence? The answer will help gauge whether the current accumulation trend can withstand ongoing price fluctuations and what it portends for BTC’s role as a strategic asset for institutions.


For years, the conversation about fan tokens in the United States followed a familiar and frustrating pattern. Executives at major sports franchises were interested. Their fans were curious. The technology was ready. But without clear regulatory guidance on how fan tokens would be classified under U.S. law, the risk of launching a program was simply too high for organizations with billions in brand equity to protect.
That era is over.
On March 17, 2026, the U.S. Securities and Exchange Commission and the Commodity Futures Trading Commission issued joint, binding guidance that formally classifies fan tokens as digital collectibles and digital tools, two distinct, legally recognized asset categories. The document, presented at the DC Blockchain Summit and titled Application of the Federal Securities Laws to Certain Types of Crypto Assets, is not an informal staff opinion or a tentative signal. It is final guidance issued simultaneously by the two most powerful financial regulatory bodies in the country. And it names Socios.com and Fan Token, trademarks owned by Chiliz, explicitly on pages 16 and 17 as concrete examples of the newly defined categories.
For American sports franchises in the NFL, NBA, MLB, and beyond, the message is clear: the playbook is written. The only question now is who executes first.
Understanding what you’re working with
The joint guidance divides the crypto asset landscape into five categories: Digital Commodities, Digital Collectibles, Digital Tools, Stablecoins and Digital Securities. Fan tokens sit across two of these.
As digital collectibles, fan tokens represent expressions of fan identity and loyalty. Think of them as digital membership cards or match tickets, assets that carry cultural weight and signal belonging to a community. They are not investments in the traditional sense. They don’t represent equity or profit-sharing. They represent affiliation, like a jersey or a season ticket, but reimagined for a digital-native audience.
As digital tools, fan tokens are utility instruments. They unlock real, functional value: voting in club polls, accessing merchandise discounts, entering exclusive experiences and engaging with the team in ways that passive fandom simply cannot offer. The value is participatory. It’s what the token enables, not what it might be worth on a secondary market.
This distinction matters enormously. It’s the difference between a legal gray area and a clearly defined commercial product that a franchise’s legal, marketing and partnership teams can build around with confidence.
What European football already knows
American sports organizations are stepping into a space that European football has been developing for years, and the results are instructive.
Clubs across Europe’s top leagues have used Socios.com to launch fan tokens that engage supporters far beyond matchday. Socios.com uses blockchain-based Fan Tokens to enable fans to vote on team-related matters, such as jersey designs and pre-game rituals, an innovation that not only enhances fan loyalty but also opens new revenue streams by tapping into the growing demand for participatory experiences.
The market dynamics are equally compelling. fan token price action is often driven by major sporting events and fan engagement, which can cause them to decouple from Bitcoin and broader market cycles, because in these periods, performance and anticipation around a club matter more than macro crypto sentiment. Meaning, a fan token program isn’t just a product launch; it’s an engagement mechanism that intensifies precisely when fans are most activated: during playoff runs, championship chases and historic moments.
The numbers bear this out. During Tottenham’s Europa League 2025 run, rising expectations after the quarter-final win led $SPURS to rally sharply, gaining +83% versus bitcoin’s +13%. A similar dynamic emerged with Paris Saint-Germain in the 2025 Champions League, where advancement to the semi-finals drove $PSG to +40% compared to bitcoin’s +17%.
Consider what these dynamics would look like layered onto the NFL playoffs, an NBA championship run, or a World Series. The built-in drama and emotional intensity of American sports aren’t just entertainment products. In the fan token economy, they are catalysts.
The American opportunity is uniquely powerful
American sports fans, in particular, are among the most digitally engaged on earth. They are already accustomed to spending money on team-branded experiences, from premium ticketing to merchandise drops to fantasy sports and sports betting. Fan tokens are a natural extension of that existing behavior, now formalized within a legally recognized framework.
When a team owns its digital ecosystem, it owns its connection to the fan. This is the strategic insight that should drive every franchise’s fan token thinking. In an era where platforms like social media act as intermediaries between teams and their audiences, a fan token program on Socios.com represents something different: a direct, owned relationship with the fan community, one that generates engagement data, revenue and loyalty simultaneously.
Tokenization breaks geographical barriers, allowing investors and fans worldwide to own a stake in sports franchises, players or stadiums – a democratized model that attracts micro-investors who may not have had the financial means to participate in the sports economy before. For American sports franchises and organizations with genuinely global fan bases, this presents a global revenue and engagement channel that previously had no viable regulatory pathway.
The 4-step playbook for launching right now
So how does a U.S. franchise actually move from interest to launch? Here’s the framework that makes the most strategic sense given where the market is today.
Step 1: Define your fan token identity
From a brand perspective, what does your fan token represent? What voting decisions will you give fans a voice in? What exclusive experiences can token holders access? Fans will engage with a token that lets them vote on jersey details for a special edition game or unlocks a pre-game experience they genuinely want.
Step 2: Align internal stakeholders early
The SEC-CFTC guidance has answered the most critical legal question, but internal alignment is essential. Brief your legal team on the specific classifications within the joint guidance. Brief your partnerships team on the revenue implications – fan tokens represent a new, recurring commercial relationship with your fan base. Brief your digital team on how the program integrates with your existing ecosystem. The franchises that will move fastest are those that treat this as a cross-functional initiative from day one, not a siloed experiment.
Step 3: Build for the global fan, not just the local one
The NBA’s global fan base rivals that of any European football club. NFL fandom is growing rapidly across the U.K., Germany and beyond. The United States is well-positioned to compete globally, as leagues accelerate their own international ambitions, the NFL will have staged nearly 25 games overseas by the close of the 2025 season. A fan token program doesn’t just serve the fans inside your stadium. It serves the supporter in Tokyo who wears your jersey to bed, the fan in Lagos who sets his alarm to watch your games live and the community in São Paulo that has followed your franchise for two decades without ever visiting the country.
Socios.com’s global infrastructure, now backed by regulatory clarity on both sides of the Atlantic, following the EU’s MiCA authorization for Socios Europe Services, means that your fan token launch is simultaneously a domestic product and a global distribution event.
The cost of waiting
U.S. sports franchises have watched their international counterparts partner with Socios.com and launch fan token programs for years. Teams in European football have built new revenue streams, deepened fan relationships across global audiences and experimented with novel forms of digital engagement.
That gap is now closeable. The franchises that move in 2026 will set the standard, capture first-mover advantage in their respective sports and cities and build fan communities that are meaningfully harder to replicate once established. The franchises that wait will find themselves explaining to their boards why they let a new revenue and engagement category get defined by their competitors.
The regulatory barrier was the last credible reason to wait. The framework is in place. The asset class has been recognized. The trademarks are named.
The American playbook for fan tokens is being written right now, by the franchises bold enough to pick up the pen.


DeFi protocol ZeroLend’s decision to shut down after three years in February, citing thin margins, hacks and inactive chains, landed with a tone the market now recognizes. Another reminder that the industry’s early optimism has given way to a far more demanding reality.
Zeroland isn’t alone. Several DeFi protocols and adjacent crypto platforms have wound down in 2025 and early 2026, squeezed by low usage, liquidity collapses, security incidents and token-driven business models that never achieved durable economics. For instance, Polynomial, a DeFi derivatives protocol that processed 27 million transactions, recently paused operations and is prioritizing user fund safety with plans to relaunch under the same team and a refined execution path. The confident mood across crypto has turned cautious.
But that wariness is cyclical, not terminal.
We are in a bear phase. In every asset class, bear markets contract speculative demand, thin liquidity and expose fragile structures. Weak models break, and strong ones consolidate. What we are witnessing in DeFi is not extinction but filtration.
The data shows rotation, not collapse
The slowdown is visible. Total value locked (TVL), long treated as DeFi’s headline metric, has fallen from roughly $167 billion at its October 2025 peak to around $100 billion in early February. That is a sharp drawdown in a short period and reflects a clear cooling of speculative capital.
Yet TVL alone does not define structural health.
Stablecoin market capitalization has continued to expand, recently surpassing $300 billion. Growth may have moderated at the margin, but the broader signal is unmistakable: liquidity is repositioning toward lower-volatility instruments and infrastructure that serves practical utility.
Institutional behavior reinforces that interpretation. Apollo’s investment in Morpho, one of the fastest-growing lending protocols, signals long-term conviction. A trillion-dollar asset manager does not deploy capital into infrastructure it believes is structurally broken. It allocates where it sees efficiency, scalability and staying power. The data suggests capital rotation instead of systemic collapse.
The structural gaps DeFi still must solve
ZeroLend’s closure, however, highlights unresolved weaknesses that define DeFi’s current phase.
Security risk remains systemic. DeFi operates through smart contracts, where code governs capital flows. Audits reduce exposure, but they do not eliminate it. Sophisticated exploits can erase years of accumulated trust in minutes because capital is programmatically accessible. This concentration of financial logic and liquidity makes DeFi uniquely attractive to attackers.
That said, not all protocols are equally fragile. Platforms such as Aave and Morpho have accumulated operating history, multiple audits, deep liquidity, institutional backers and visible teams whose reputations are intertwined with protocol stability. In a sector without harmonized global regulation, reputation functions as a form of soft governance.
Governance itself presents a second tension. Decentralization redistributes power; it does not eliminate concentration. Governance tokens enable community voting, but voting weight can cluster. Large holders can influence collateral parameters, risk models or incentive structures. Users, therefore, bear governance risk alongside market risk. Transparency is high. Stability is still maturing.
Regulation remains the third unresolved variable. Europe’s MiCA framework has introduced clarity for crypto assets broadly, but DeFi remains largely undefined. In the United States, regulatory posture has shifted with political cycles. Proposals to impose KYC-style obligations on decentralized protocols confront a practical question: who performs compliance in an autonomous system governed by code?
There is currently no technological architecture that seamlessly embeds global regulatory compliance into permissionless smart contracts without compromising decentralization. That ambiguity deters conservative capital, yet it has not halted development.
Why DeFi lending remains economically rational
Paradoxically, bear markets may be when DeFi lending is most logical to use.
Long-term crypto holders frequently face a liquidity dilemma. Their wealth is concentrated in digital assets. Selling into weakness crystallizes losses and forfeits upside exposure. Borrowing against collateral preserves participation while unlocking stable liquidity.
DeFi enables that structure with clarity. Users pledge crypto assets and borrow stablecoins at rates that often fall below 5%, depending on asset pair and utilization dynamics. Compared with traditional asset-backed lending, these terms are competitive, and the mechanics are transparent. Collateral ratios are predefined, and liquidation thresholds are automatic, which means there is no discretionary credit committee adjusting terms mid-cycle.
Liquidation risk is real. If collateral values fall sharply, positions are closed algorithmically. But participants understand the parameters in advance. In centralized environments, flexibility may exist, yet discretion can cut both ways. DeFi’s execution is impartial. For sophisticated users, predictability is a feature.
What the shakeout is actually filtering
The current contraction is also clarifying which models are sustainable. Protocols that relied heavily on token emissions to attract mercenary liquidity are struggling as incentives fade. In contrast, platforms with sustainable revenue streams, diversified liquidity pools, institutional integrations and transparent governance structures are consolidating.
The market is distinguishing between subsidy-driven growth and genuine lending demand. Infrastructure-level integrations, including exchange partnerships and institutional backing, are becoming more important than headline yield.
Adoption remains the missing link. For DeFi to move beyond early adopters, two dynamics must evolve simultaneously. I’m talking about broader financial literacy around onchain mechanisms and trusted distribution channels that abstract technical complexity.
Large platforms such as Coinbase and Kraken have begun integrating DeFi functionality into retail-facing environments. When intermediaries distribute DeFi lending products with user-friendly interfaces, they act as bridges between permissionless infrastructure and mainstream users. Retail demand follows comprehension. Institutional distribution follows demand.
Banks once dismissed crypto entirely. Today, many provide structured exposure. The same gradual integration is plausible for collateralized onchain lending.
Consolidation is a necessary phase
Every financial innovation progresses through subsidy, speculation and consolidation. DeFi is now in consolidation.
ZeroLend’s closure is not evidence that DeFi has failed, as some have framed it. It is evidence that DeFi is being compelled to mature. Because at the end of the day, stress tests do not kill durable systems. They reveal them.

TLDR:
- Bitcoin’s OTC share reached 82.26%, placing settlement activity firmly inside the Institutional Alert Zone.
- Coinbase captured 58.21% of CEX flows, reflecting its custody role for eight U.S. Bitcoin ETFs.
- Long-term holders deposited just 94.68 BTC to exchanges against 706,000 BTC moved on-chain in 24 hours.
- Analysts warn futures traders against short positions as public sell-side liquidity hits critical lows.
Bitcoin institutional dominance hit a macro alert level in the past 24 hours. On-chain analyst GugaOnChain reported OTC trading captured 82.26% of total BTC settlement volume.
Coinbase led centralized exchange flows at 58.21% of residual CEX activity. With BTC at $73,337, up 9.02% over seven days, settlement reached 706,000 BTC, worth $51.5 billion. These figures point to coordinated institutional accumulation on a large scale.
OTC Markets Signal Structural Accumulation
Bitcoin’s OTC share crossing 80% places it inside what analysts call the Institutional Alert Zone. This range, between 80% and 90%, marks periods when public liquidity contracts sharply.
As a result, only 17.14% of total settlement activity reached centralized exchanges in this window. Open order books were, therefore, left with minimal sell-side depth.
When OTC activity reaches this level, smart money moves large BTC volumes off-exchange. GugaOnChain noted this pattern has been intensifying over recent weeks.
Institutional buyers are consistently opting for private transactions over exchange-based order flow. This behavior gradually removes available supply from retail-accessible trading venues.
GugaOnChain posted a direct warning to futures traders on social media. The analyst wrote that 82% off-exchange settlement leaves the spot market sell side near empty.
Any demand spike, the post stated, would trigger a supply shock. Violent upward repricing of Bitcoin, the analyst warned, would follow closely.
The broader takeaway for active traders centers on managing directional risk. GugaOnChain explicitly cautioned against short positions in the current market environment.
With minimal sell-side liquidity in public markets, any demand spike faces no resistance. This structural setup makes short positions particularly vulnerable to sudden, sharp reversals.
Coinbase Leads CEX Flows While Long-Term Holders Stay Inactive
Within the 17.14% of flow transacted on centralized exchanges, capital concentration was notable. Coinbase dominated at 58.21%, reflecting its role as custodian for eight of eleven U.S. Bitcoin ETFs.
Binance followed at 22.13%, functioning primarily as a retail entry point rather than an institutional hub. Kraken accounted for 6.44%, drawing compliance-focused institutional capital.
To confirm the accumulation thesis, GugaOnChain cross-referenced OTC data with exchange inflow metrics. The analyst applied the “Bitcoin: Exchange Inflow – Spent Output Age Bands” indicator across all major exchanges.
Coins older than six months deposited to exchanges totaled just 94.68 BTC in 24 hours. Against 706,000 BTC moved on-chain that day, this confirms near-total dormancy among long-term holders.
This data shows veteran holders are not distributing into the current price rise. Old coins stay locked away while fresh institutional accumulation continues off-exchange.
Low long-term holder selling combined with high OTC absorption tightens the available supply structure. These converging factors build a case for continued upward price movement in Bitcoin.
The supply picture, taken together, favors sustained buying pressure. Liquidity drains privately while public order books remain thin and underpopulated.
Any fresh wave of spot demand will encounter very little sell-side resistance. The data consistently supports the setup for a continued Bitcoin price advance.


World Liberty Financial has challenged its largest private investor to a legal fight after he publicly accused the project of embedding a hidden freeze function in its token contract.
The dispute marks a sharp turn in a relationship that began with a $30 million investment in November 2024.
World Liberty Financial Turns on Its Biggest Backer: See You in Court
The investor, Tron founder Justin Sun, poured over $75 million into the platform and describes himself as the first and single largest victim of the project’s blacklisting practice.
In December 2024, the World Liberty Financial cleared its cbBTC portfolio of 102.9 tokens worth $10.4 million to acquire 103.15 WBTC.
The following day, Sun was named an advisor to WLFI, highlighting his growing interest in the DeFi project and the growing relationship between WLFI and WBTC.
Sun’s allegations center on a smart contract function he says was never disclosed to investors. He claims the mechanism grants WLFI unilateral power to freeze or restrict any token holder’s assets without notice or recourse.
“Does anyone still believe Justin Sun? Justin’s favorite move is playing the victim while making baseless allegations to cover up his own misconduct. Same playbook, different target. WLFI isn’t the first. We have the contracts. We have the evidence. We have the truth. See you in court pal,” wrote WLFI.
His wallet was blacklisted in September 2025 after on-chain data showed outbound token transfers, including one worth $9 million.
Sun’s frozen holdings have since lost roughly $60 million in value as the WLFI token price collapsed, leaving him unable to sell, hedge, or rebalance his exposure. WLFI has maintained the freeze was a security measure, not a targeted action.
The dispute has drawn attention to a separate but related concern. A DeFi analyst flagged that Dolomite, a lending protocol, is allowing $292 million to be borrowed against $400 million in WLFI collateral, with $158 million in USD1 already drawn.
The analyst noted that Dolomite’s founder is also WLFI’s CTO, raising direct conflict-of-interest questions.
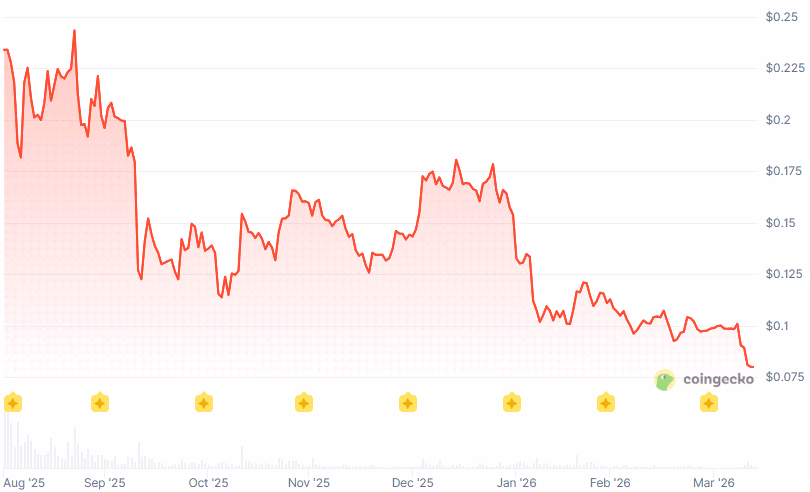
WLFI tokens hit a record low of $0.077 on April 11 and traded at $0.079 at press time, down roughly 76% from their all-time high of $0.30 set last September.
The post World Liberty Financial Dares One Of Its Biggest Backers to Court appeared first on BeInCrypto.
TLDR:
- JD Vance confirmed US-Iran nuclear talks failed, triggering a 3% Bitcoin price drop overnight.
- Bitcoin’s decline extended its drawdown to nearly 42% from its most recent all-time peak price.
- Nearly $1 billion in sell volume hit Binance derivatives within one hour of the failed talk news.
- Binance funding rates fell to -0.0065%, confirming short positions now dominate the derivatives market.
Bitcoin faced sharp selling pressure after US-Iran nuclear talks collapsed over the weekend. JD Vance confirmed no agreement was reached, sending BTC down 3% and back toward the $70,000 range.
Bitcoin Slides 3% After Diplomatic Breakdown
Bitcoin entered the weekend with cautious optimism, supported by improving geopolitical signals from the prior week. Traders had been watching the US-Iran negotiations closely for any sign of progress.
Instead, JD Vance announced overnight that talks had failed entirely. Disagreements over nuclear issues were cited as the main barrier to any deal.
The price quickly reflected the news, with Bitcoin dropping around 3%. That decline brought BTC back to the $70,000 area, a zone that had acted as support in recent sessions.
The move also extended Bitcoin’s drawdown to nearly 42% from its most recent peak. Despite the sustained decline, market participants continued to lean short.
Geopolitical tension has often added uncertainty to crypto markets, and this case was no different. The breakdown removed a layer of optimism that had been building throughout the week.
When that support gave way, the sell-off followed quickly and without hesitation. Bearish momentum took hold almost immediately after the announcement.
Trading volumes responded sharply as the news circulated. BTC price action was decisive, with sellers taking control during the session.
The broader crypto market also reflected the risk-off shift. Bitcoin, as the market’s lead asset, absorbed the brunt of the pressure.
Short Sellers Take Control of Binance Derivatives
Within one hour of the news breaking, nearly $1 billion in sell volume flooded Binance derivatives. Crypto analyst Darkfost noted in a post that this level of activity in such a short window pointed to heavy, coordinated short positioning.
The volume surge reinforced the already declining price trajectory. It was a clear signal that traders were reacting swiftly to the geopolitical news.
Funding rates on Binance moved further into negative territory, settling around -0.0065%. Binance incorporates an implicit interest rate of 0.01% into its funding rate calculations.
When the rate falls below that level, it confirms that short positions are already dominating. That threshold has now been crossed, placing control firmly with the bears.
This kind of short-side consensus has historically preceded counter-moves in the market. When most participants align on one side, price often moves in the opposite direction.
However, this dynamic tends to carry less force during bear market conditions. Any potential reaction is likely to remain limited in both scale and duration.
Traders watching this setup should remain measured in their expectations. The broader trend continues to favor the downside, even with crowded short positioning.
A reactive bounce is possible but not guaranteed under current conditions. BTC’s next move will likely depend on any fresh geopolitical or macro developments.
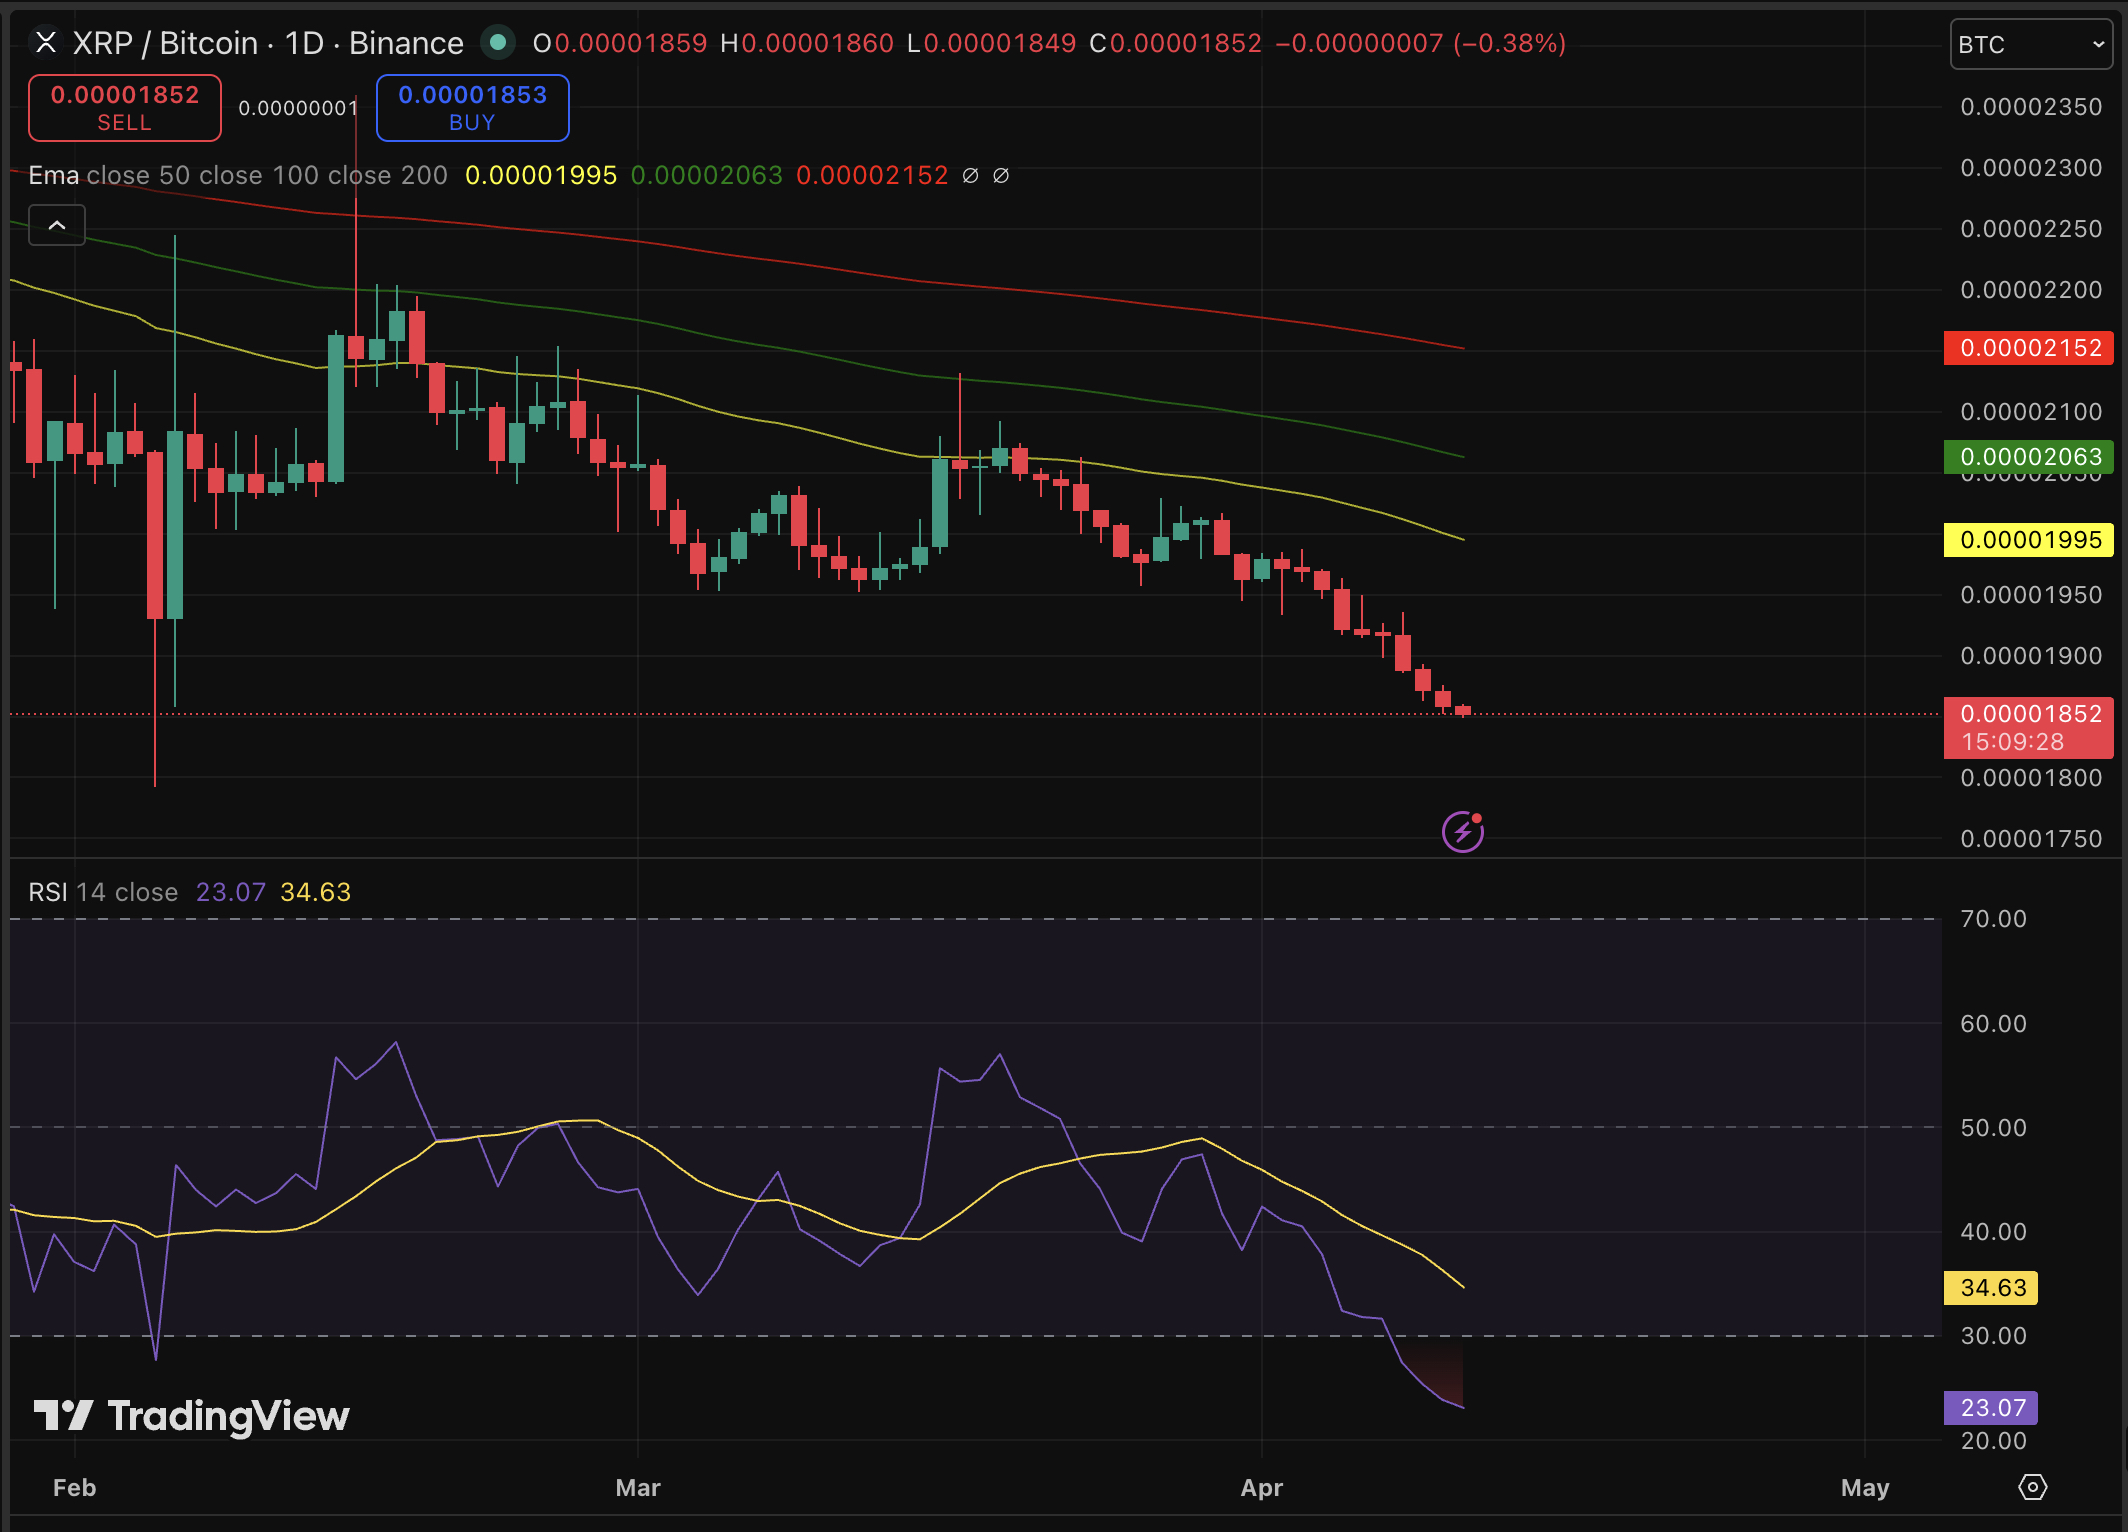
XRP price is trading at a whisper of green in an otherwise grim eight-month downtrend and continuation of bearish prediction. Volume remains elevated at the $2B range, showing that conviction hasn’t fully left the building. Are the indicators finally telling us something, or is this another false dawn before a deeper flush?
Technical data shows the RSI on the XRP/BTC ratio has collapsed to 23, the most oversold reading since October 2025. Historically, RSI prints at this level on the XRP/BTC pair have preceded breakouts of 65% to 345% against Bitcoin.

The XRP MVRV Z-score is simultaneously hovering near zero, a level that has aligned with accumulation zones in 2021, 2022, and 2024 before each subsequent major rally. The last comparable setup, June 2025, launched a 61% XRP/BTC ratio surge and a 92% price run to $3.66.
The Fear & Greed Index sits at an extreme 16, with 26 of 29 technical indicators currently bearish. Macro caution is real. But macro caution and structural bottoms have a long history of coexisting.
Discover: The best crypto to diversify your portfolio with
XRP Price Prediction: Reclaim $1.41 Resistance, or a Retest of $1.28 Support?
Price is consolidating in a tight band with clear technical boundaries. Resistance sits at $1.37, $1.39, and $1.41; the 50-day SMA looms overhead at $1.40, keeping bulls honest. Support clusters at $1.33, $1.32, and $1.31, with the strongest floor at the $1.28–$1.30 classical pivot zone.
The RSI on the daily timeframe has neutralized around 46.48, not oversold, but also not showing momentum in either direction.
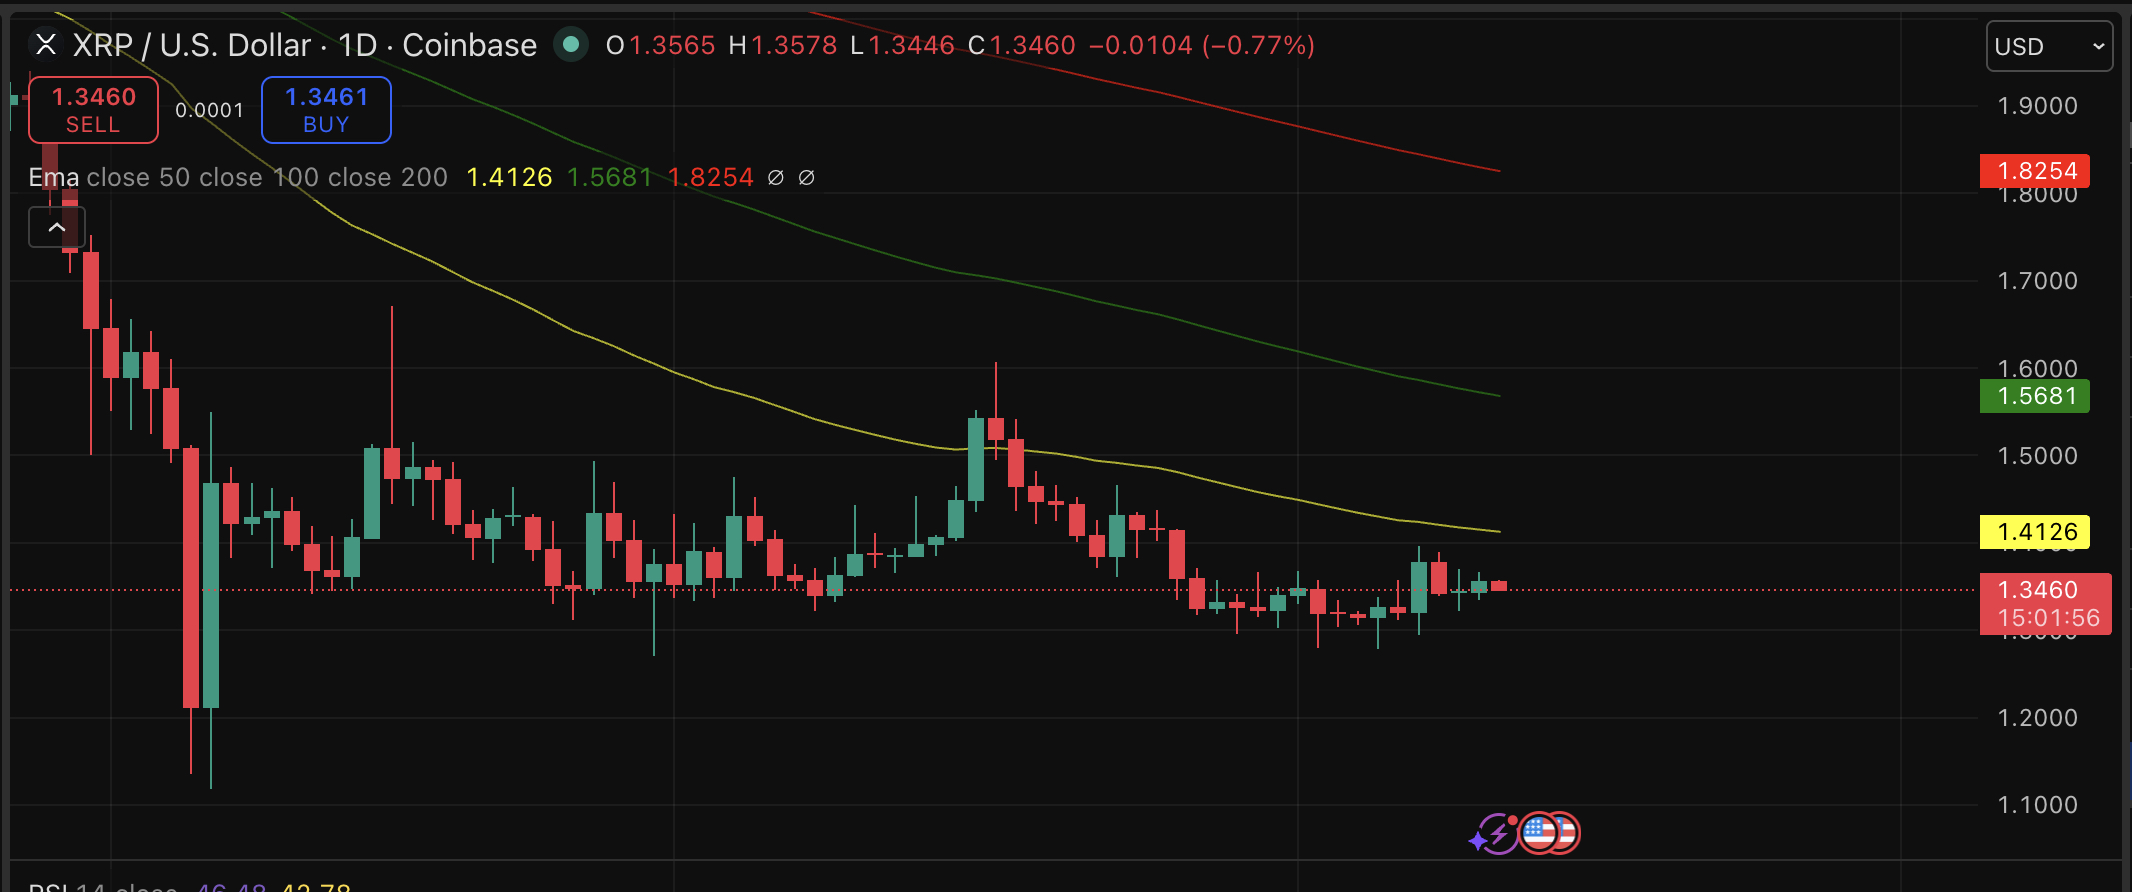
Short-term forecasts lean cautiously. April’s projected range is $1.30–$1.51, suggesting limited explosive upside in the near term even under optimistic conditions.
XRP’s recent price action has drawn comparisons to prior false recoveries, though the MVRV data distinguishes this moment from typical dead-cat setups. The XRP/BTC pair is also sitting inside a long consolidation range that has historically acted as a macro launch zone, which is either very reassuring or very easy to say in hindsight.
Discover: The best pre-launch token sales
LiquidChain Targets Early Mover Upside as XRP Tests Key Levels
XRP’s structural indicators may be pointing toward a bottom, but even a clean reversal to $1.5 only represents modest upside for capital already deployed at current prices. Institutional inflows into XRP ETPs have been notable, yet the price remains range-bound. Traders watching for asymmetric entries are increasingly scanning earlier in the capital stack.
LiquidChain ($LIQUID) is a Layer 3 infrastructure project built around a single thesis: that fragmented liquidity across Bitcoin, Ethereum, and Solana is the core unsolved problem in DeFi. Its Unified Liquidity Layer fuses BTC, ETH, and SOL liquidity into one execution environment, developers deploy once and access all three ecosystems simultaneously via Single-Step Execution and Verifiable Settlement.
A new layer emerges. Only a few see it first.
The future is LiquidChain⟁https://t.co/vqvBcdSj94 pic.twitter.com/R7ZeZ0NPGl
— LiquidChain (@getliquidchain) March 24, 2026
The presale is currently priced at $0.01448, with $650K raised to date and the project approaching its $1M milestone. It also offers 1600% APY Staking bonus for early participants.
For traders looking beyond near-term range-trading, research LiquidChain and check what it has to offer.
The post XRP Price Prediction: Bottom Signals Flashing, Good Time to Scoop? appeared first on Cryptonews.
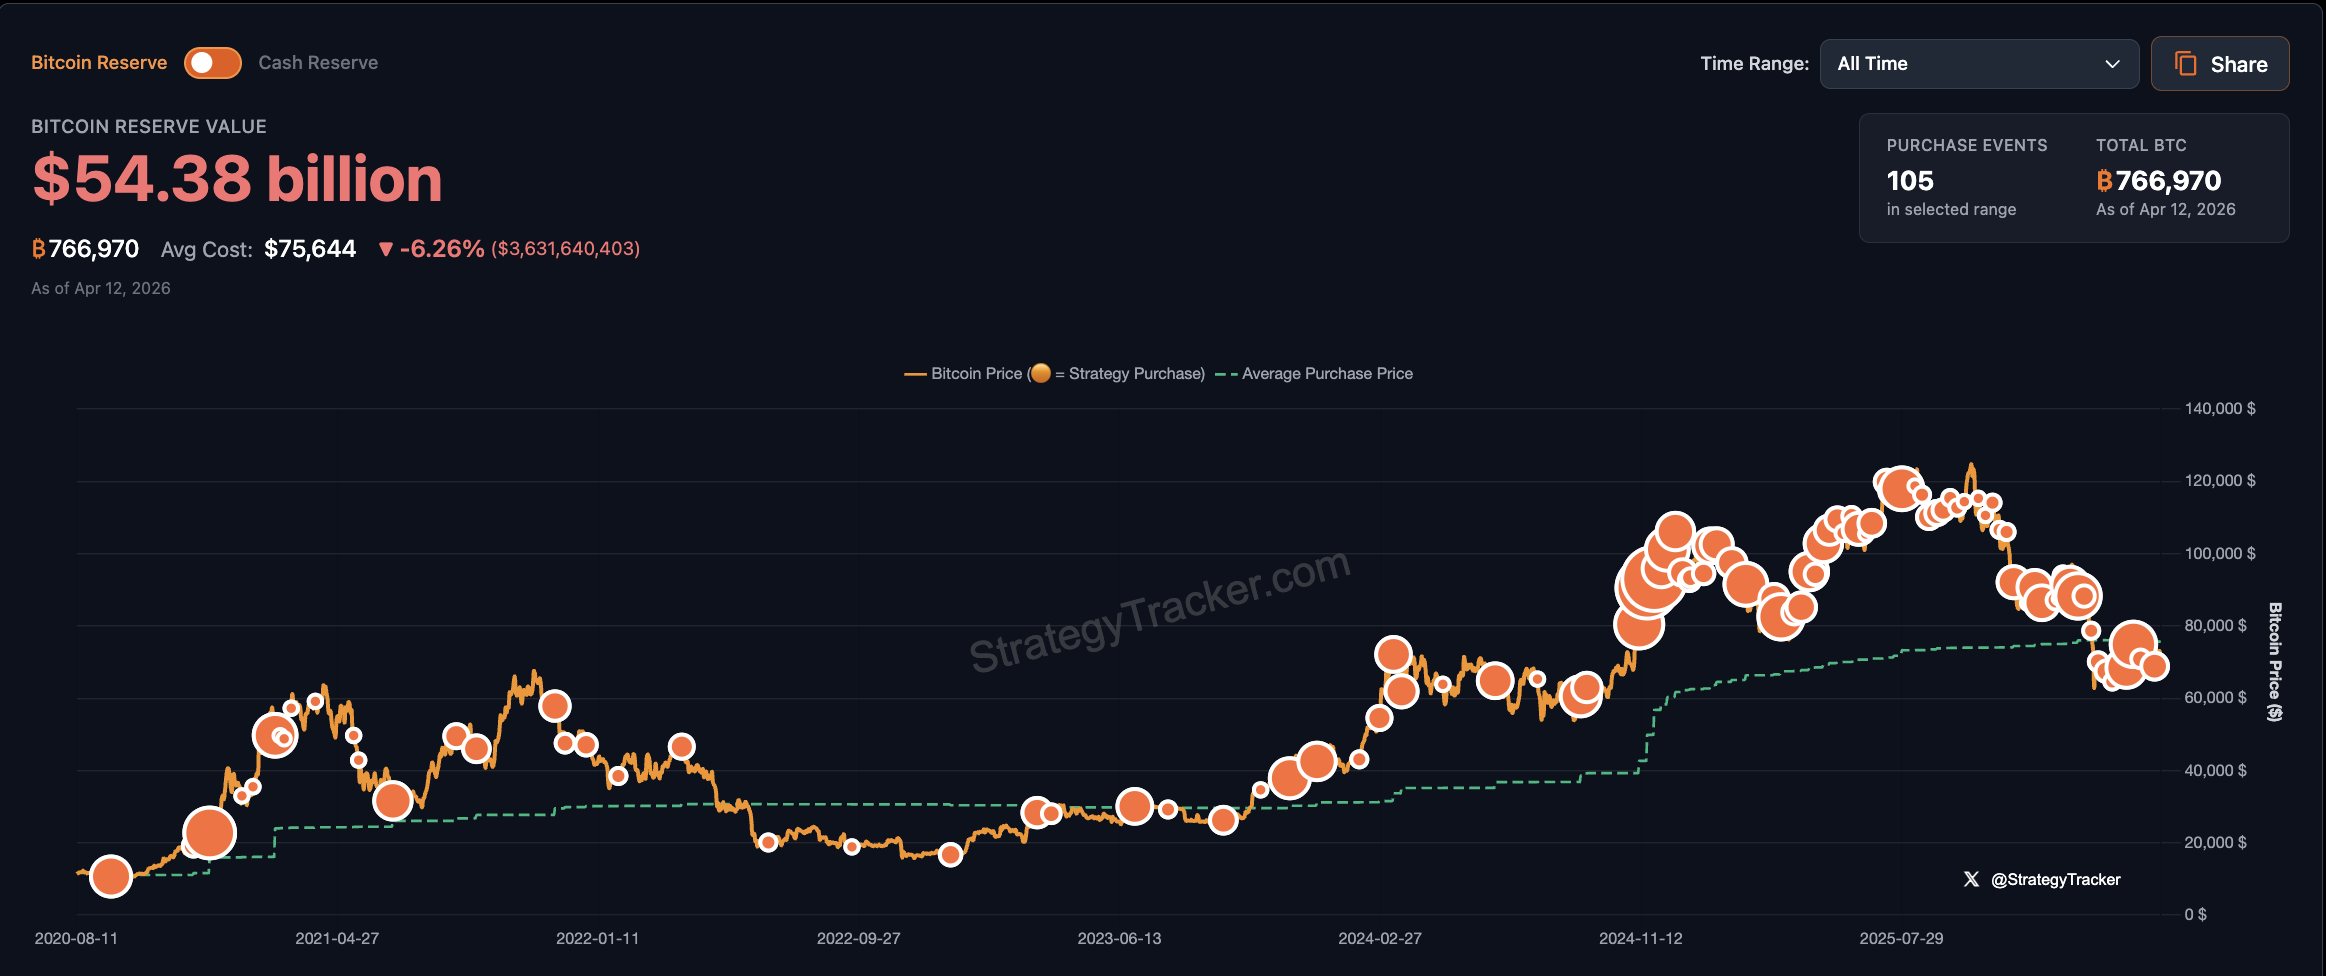
Michael Saylor, the co-founder of Bitcoin (BTC) treasury company Strategy, signaled that the company is acquiring more BTC, as the price retreated from the local high of over $73,000 reached this week.
“Think bigger,” Saylor said on Sunday, while sharing the chart of Strategy’s BTC purchase history that has become synonymous with imminent BTC acquisitions.
Strategy’s most recent BTC purchase was April 6, when it bought 4,871 coins for more than $329.8 million, bringing its total holdings to 766,970 BTC, valued at about $54.5 billion using market prices at the time of publication, according to the company.
The Tysons Corners, Virginia-based company continues accumulating BTC, even amid a bear market that pushed Bitcoin’s price down to two-year lows, putting Strategy’s BTC treasury underwater.

Related: Strategy set to resume buying Bitcoin via STRC: Will BTC price hit $80K?
Strategy is sitting on nearly $14.5 billion in unrealized losses
Strategy’s average cost of acquisition per BTC is $75,644, nearly $5,000 less than the market price at the time of this writing.
The company reported a loss of nearly $14.5 billion on its BTC holdings for the first quarter of 2026, according to a filing with the US Securities and Exchange Commission (SEC).
Despite the unrealized losses, Strategy continues to accumulate BTC at a faster rate than miners can produce new coins, leading some analysts to forecast a potential BTC supply squeeze.
Miners produced about 16,200 BTC in March, while Strategy accumulated 46,233 BTC during that same period, nearly three times the newly mined supply.

“The global consensus is that BTC is digital capital. The four-year cycle is dead. Price is now driven by capital flows. Bank and digital credit will determine Bitcoin’s growth trajectory,” Saylor said in April.
Strategy’s 766,970 BTC reserve makes it the biggest BTC treasury company by holdings, according to BitcoinTreasuries. The next largest is held by Twenty One Capital, which holds 43,514 BTC.
Strategy has bucked the trend during the ongoing bear market by continuing accumulation as other BTC treasury companies show signs of capitulation amid a challenging business environment. MARA Holdings sold 15,133 Bitcoin in March for roughly $1.1 billion to buy back $1 billion of zero-coupon convertible notes at a discount.
Chairman and CEO Fred Thiel commented that the transaction enhanced the company’s “financial flexibility” and increased its “strategic optionality” as MARA expands “beyond pure-play Bitcoin mining into digital energy and AI/HPC infrastructure.”
Magazine: Scottie Pippen says Michael Saylor warned him about Satoshi chatter


BNB Chain has told node operators to complete a required software update before the Osaka/Mendel hard fork reaches mainnet on April 28.
Summary
- BNB Chain told node operators to install BSC v1.7.2 before the Osaka/Mendel hard fork launches.
- The April 28 mainnet upgrade follows testnet activation and adds stability, gas limits, and finality.
- BNB Chain said outdated settings and poor binary replacement could cause nodes to lose sync.
The network said operators should move to BSC v1.7.2 and remove outdated settings to keep nodes running normally.
BNB Chain developers said node operators must complete the update before the Osaka/Mendel hard fork goes live on BSC mainnet. The network scheduled the upgrade for April 28 at 2:30 a.m. UTC.
The notice said operators need to replace binaries correctly and clean up old configuration fields. The team said those steps are needed to stop nodes from “losing sync” during the upgrade.
The message places the focus on infrastructure readiness before the hard fork date. It also shows that the update is not optional for operators who want their nodes to stay aligned with the chain.
The deadline comes as BNB Chain moves from testnet preparation to a full mainnet rollout. That shift usually puts more attention on validator and node performance across the network.
The Mendel upgrade adds BEP-652, which brings EIP-7825 into BNB Chain through a protocol-level gas cap for each transaction. The cap is set at 16,777,216 gas.
That change means all nodes will reject transactions above the limit in the same way. BNB Chain said this method is more reliable than the earlier soft cap model that operators could treat differently.
The broader network upgrade includes nine BEPs in total. BNB Chain also said it adopted seven of the 13 Ethereum proposals linked to Fusaka, including six that required a hard fork and one client-side RPC change.
The network did not adopt the other six proposals because of architecture differences. It also added two BNB Chain-specific updates through BEP-657 and BEP-648.
Testnet rollout came before mainnet launch
BNB Chain activated the Osaka/Mendel hard fork on the BSC testnet on March 24 at block 88,379,325. Developers said the test phase improved block construction, transaction handling at scale, network stability, and execution accuracy.
BEP-657 limits when blob transactions can be included based on block number. BEP-648 aims to reduce latency and speed up finality on the network.
The mainnet launch now depends on operators completing the required update on time. The latest alert shows BNB Chain wants nodes fully prepared before the April 28 hard fork begins.
The TRON founder accused the Trump-linked DeFi project of hiding a ‘trap door’ in its token contract.
The long-simmering conflict between TRON founder Justin Sun and World Liberty Financial (WLFI) erupted into an all-out public war on Sunday, with both sides hurling accusations on X.
Sun, who invested $75 million in the DeFi venture affiliated with the Trump family, published a lengthy statement accusing WLFI of embedding a hidden blacklisting function in the WLFI token smart contract, a mechanism he said gives the project “unilateral power to freeze, restrict, and effectively confiscate the property rights of any token holder, without notice, without cause, and without recourse.”
“This is a trap door marketed as an open door,” Sun wrote.
The dispute dates back to September 2025, when WLFI blacklisted a wallet containing more than 500 million of Sun’s WLFI tokens after on-chain analysts flagged transfers routed through HTX, Sun’s crypto exchange.
WLFI responded within hours, dismissing Sun’s allegations and threatening legal action.
“Justin’s favorite move is playing the victim while making baseless allegations to cover up his own misconduct,” the project’s official account posted. “We have the contracts. We have the evidence. We have the truth. See you in court pal.”
Sun fired back minutes later, demanding that whoever was operating the account identify themselves. “As the largest investor in this project, I demand that those responsible come forward by name, instead of hiding in the shadows.”
The feud follows days of scrutiny over WLFI’s treasury operations.
Sun went on to allege that governance votes cited to justify the project’s actions “were not conducted through a fair or transparent process” and that “the outcomes were predetermined.”
He accused the team of extracting fees, implanting backdoor controls, and “treating the crypto community as a personal ATM.”
Sun was careful to separate the WLFI operators from President Trump himself, opening his statement by reaffirming support for Trump and directing criticism at “the bad actors at WLFI.”
Since the September 2025 blacklist, WLFI has fallen roughly 76% from its all-time high of $0.30 to around $0.079, per CoinGecko, hitting an all-time low just yesterday. The token tanked 18% on its first day of trading and has barely recovered since.


Man charged with false imprisonment after Westhoughton incident

Flagship Launch Expected in May or June With Bold New Design

Saylor Signals MicroStrategy Set to Expand Bitcoin Holdings


-

 Business7 days ago
Three Gulf funds agree to back Paramount’s $81 billion takeover of Warner, WSJ reports
-

 Politics2 days ago
US brings back mandatory military draft registration
-

 Fashion2 days ago
Weekend Open Thread: Veronica Beard
-

 Tech5 days ago
How Long Can You Drive With Expired Registration? What Florida Law Says
-

 Politics3 hours ago
World Cup exit makes Italy enter crisis mode
-

 Fashion6 days ago
Massimo Dutti Offers Inspiration for Your Summer Mood Board
-
 Sports2 days ago
Man United discover Nico Schlotterbeck transfer fee as defender reaches Dortmund agreement
-

 Crypto World3 days ago
Canary Capital Files SEC Registration for PEPE ETF
-

 Fashion5 days ago
Let’s Discuss: DEI in 2026
-

 Business2 days ago
Tesla Model Y Tops China Auto Sales in March 2026 With 39,827 Registrations, Beating Cheaper EVs and Gas Cars
-

 Crypto World4 days ago
Bitcoin recovers as US and Iran Agree a Ceasefire Deal
-

 Politics3 days ago
Malcolm In The Middle OG Turned Down ‘Buckets Of Money’ To Appear In Reboot
-

 Business2 days ago
OpenAI Halts Stargate UK Data Centre Project Over Energy Costs and Copyright Row
-

 Business1 day ago
Ireland Fuel Protests Enter Day 5 as Blockades Spark Shortages and Government Prepares Support Package
-

 Tech6 days ago
Italian court says Netflix must refund customers up to $576 over price hikes
-

 Tech6 days ago
Gamer Restores the Original PlayStation Portal From Two Decades Ago
-

 Tech6 days ago
Haier is betting big that your next TV purchase will be one of these
-

 Tech6 days ago
The Xiaomi 17 Ultra has some impressive add-ons that make snapping photos really fun
-

 Tech6 days ago
Samsung just gave up on its own Messages app
-

 Politics2 days ago
LBC Presenter Mocks Trump Over Iran War Failures
You must be logged in to post a comment Login