
CryptoCurrency
SMT Divergence in Trading: Concepts and Strategies
SMT divergence is a way of comparing related markets to spot subtle shifts in momentum that price alone can hide. Instead of focusing on indicators or single charts, it looks at how correlated instruments behave relative to each other at key highs and lows. When those relationships break down, it can reveal useful information about market pressure, positioning, and potential turning points. This article explains how SMT divergence works and how traders apply SMT divergence strategies.
Key Takeaways
- SMT divergence is a market analysis concept that occurs when two correlated instruments fail to make matching highs or lows, signalling a potential shift in momentum and underlying market pressure.
- Its core components are correlated instruments, a clear price mismatch at key levels, and institutional positioning.
- SMT divergence is context-dependent. It is used near extremes and alongside market structure, rather than as a standalone signal.
SMT Divergence: Meaning
SMT divergence—short for Smart Money Technique divergence—is a market analysis concept used to identify price discrepancies between correlated financial instruments and anticipate shifts in momentum and potential reversal points.
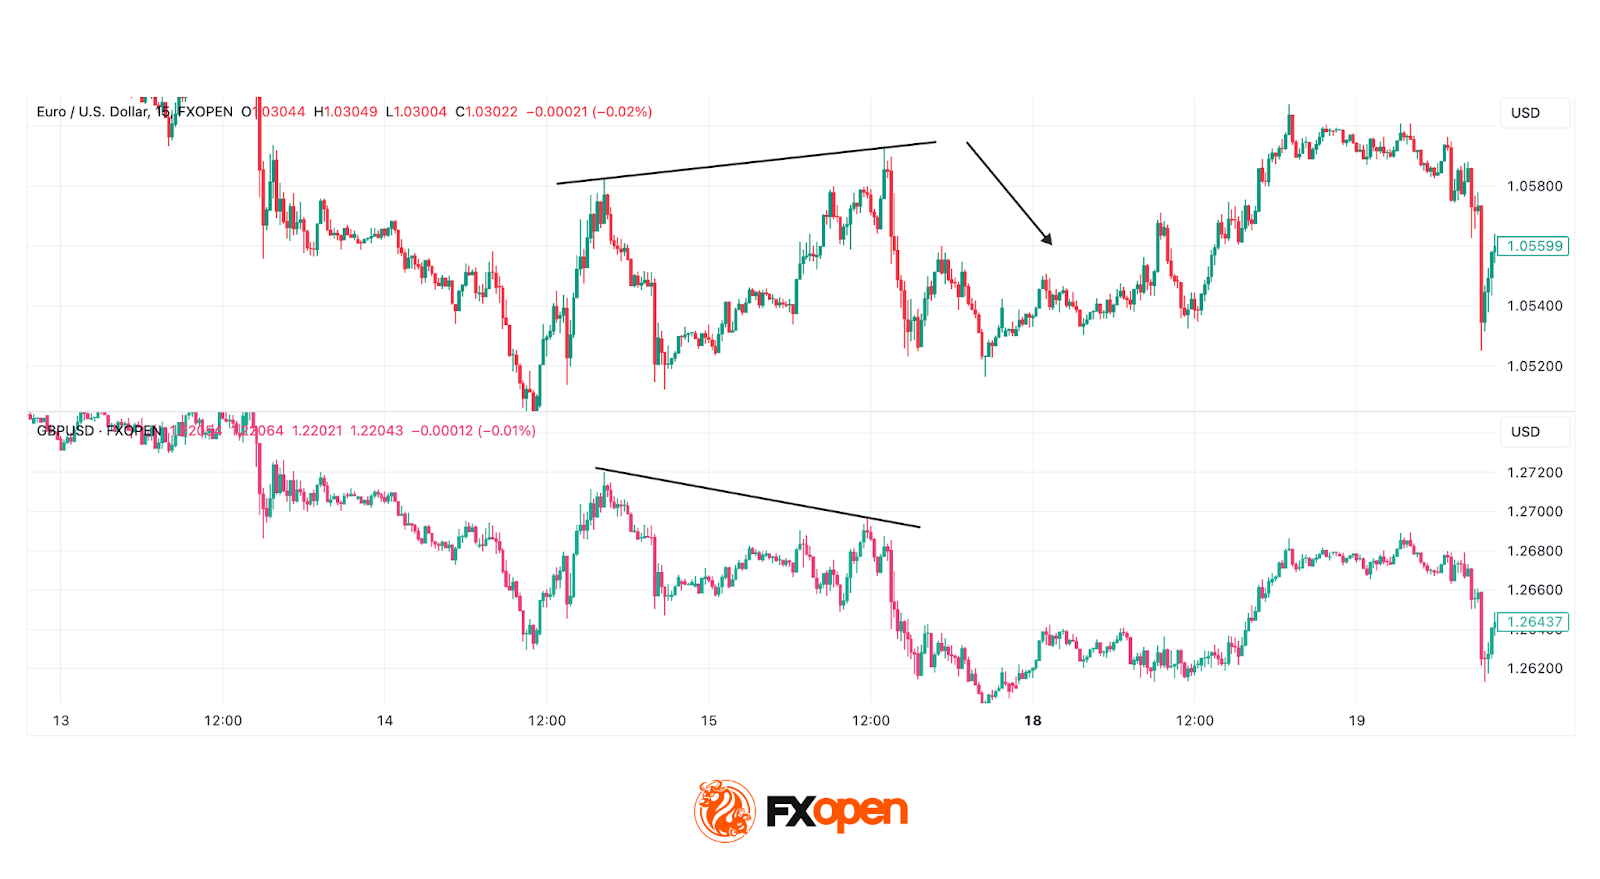
SMT divergence occurs when two or more correlated instruments—such as major currency pairs, indices, or equities—fail to make new highs or lows in unison. For example, if EUR/USD forms a new high, while GBP/USD lags behind and fails to break its previous high. This divergence could indicate waning momentum in one pair, hinting at a potential reversal or shift in the overall market structure. Traders analysing SMT divergence often use these moments to assess whether institutional players might be involved.
Rooted in the Inner Circle Trader (ICT) methodology, SMT divergence is widely interpreted as a sign of institutional involvement in the market — it highlights where activity of institutional traders may be causing inefficiencies between related markets, offering potential entry signals for retail traders following institutional footprints.
To identify an SMT divergence, you can monitor two correlated assets’ charts and observe discrepancies. For example, you can consider using live charts for analysis and trading in FXOpen’s TickTrader trading platform. Also, there are SMT divergence indicators for MT4, MT5, and TradingView available online that can automate the process.
The Core Components of SMT Divergence in Trading
SMT divergence relies on three key components: correlated instruments, divergence between price movements, and the involvement of institutional players. Understanding these elements is important for applying this concept.
1. Correlated Instruments
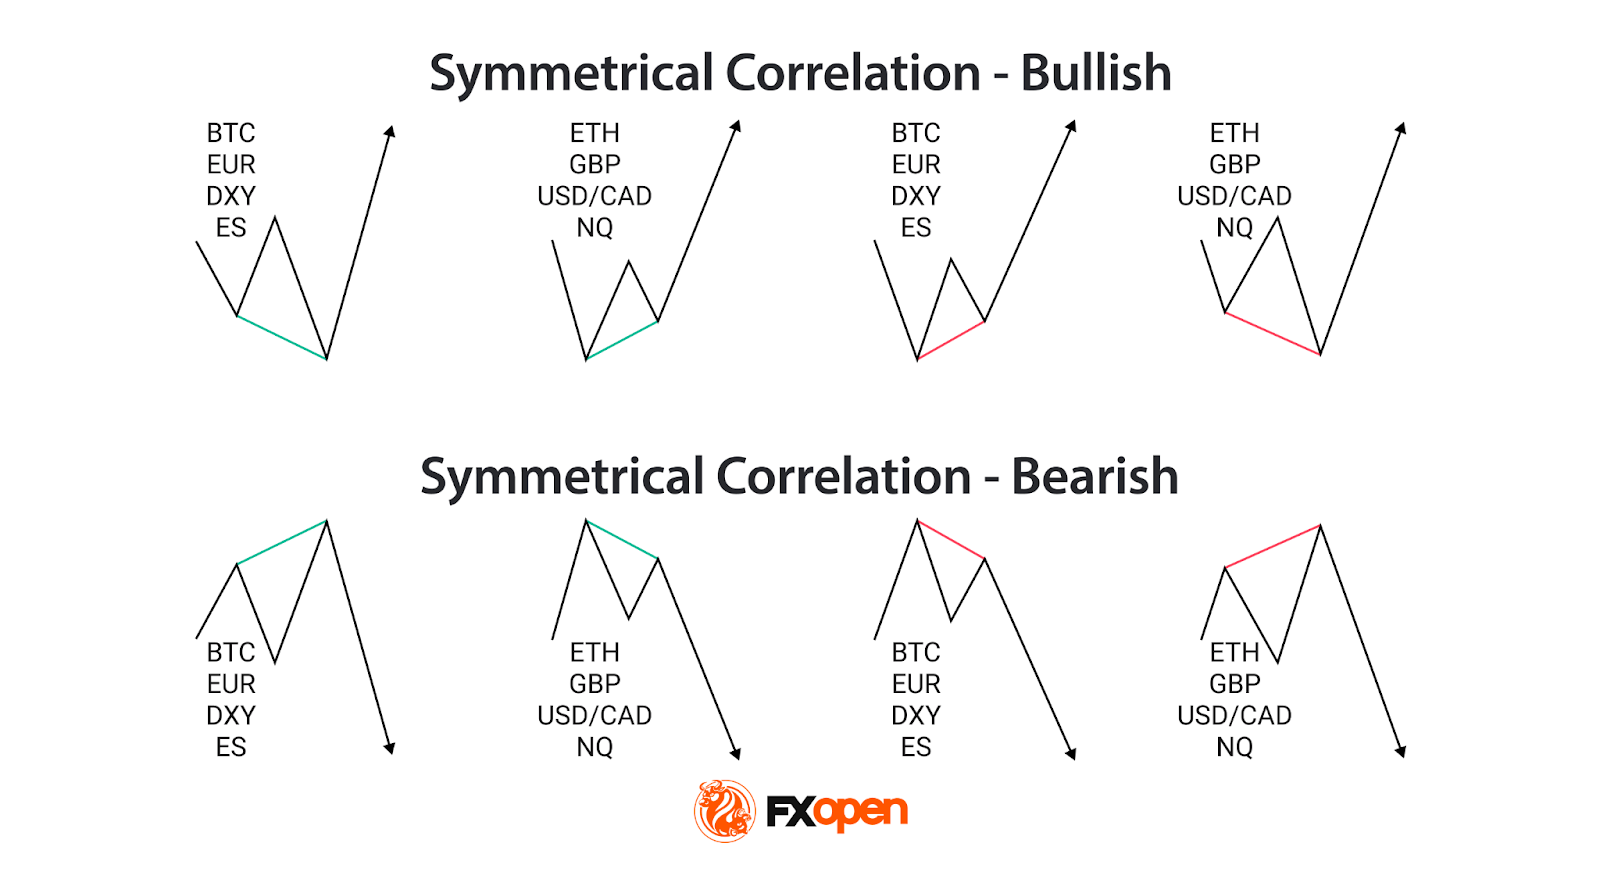
At the heart of SMT divergence is the relationship between correlated markets. Correlations can be positive, negative, or neutral:
- Positively correlated instruments tend to move in the same direction, such as EUR/USD and GBP/USD.
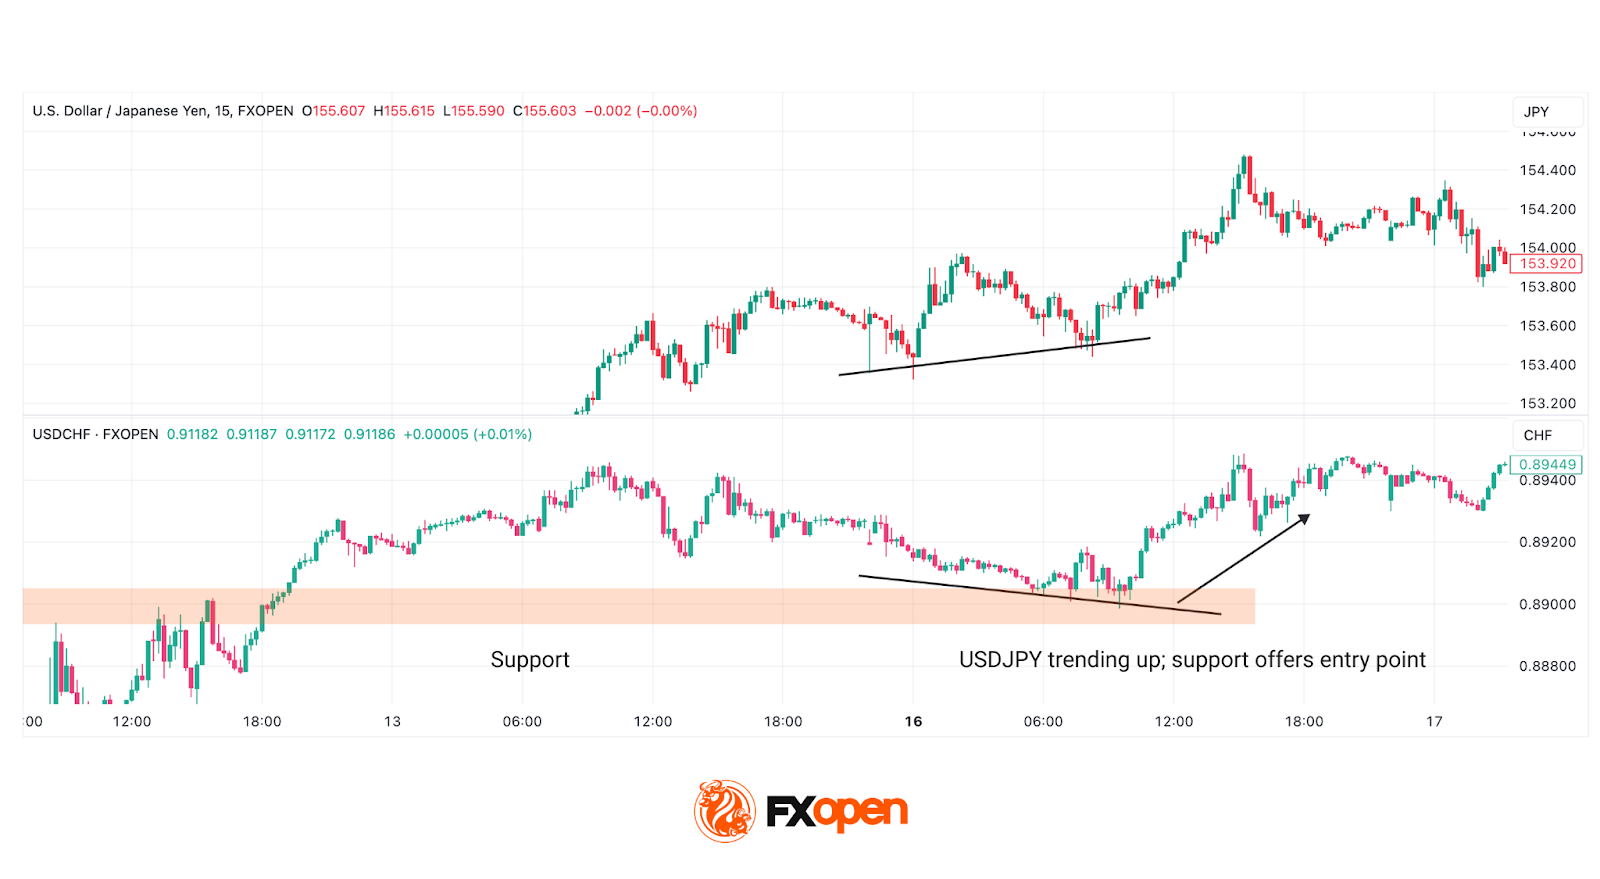
- Negatively correlated instruments move inversely, such as USD/JPY and gold in certain environments.
- Neutral or weak correlation refers to a statistical relationship between two variables where their movements are only loosely connected.
The SMT divergence uses positively correlated assets as they provide historically consistent relationships breaking down at key moments. In forex, major currencies often show clear co-movement patterns, especially when they share common drivers and are measured against the same base currency (Bundesbank). For instance, pairs like EUR/USD and GBP/USD often exhibit similar trends because they’re influenced by the strength of the US dollar, as well as their close regional ties and trade relationships. In equities, indices like the Nasdaq 100 and S&P 500 often align because they reflect broader market sentiment and contain overlapping stocks.
2. Divergence in Price Movements
The divergence occurs when these typically correlated instruments fail to move in sync. For example, one instrument may reach a higher high, while the other stalls or even reverses. This mismatch is more than just noise—it can signal a deeper imbalance in the market, often linked to uneven supply and demand dynamics. It’s these price discrepancies that traders scrutinise to identify potential turning points.
Importantly, SMT divergences can be bullish or bearish. Bullish divergence appears when one instrument makes a lower low while the correlated market holds above its prior low, suggesting selling pressure may be fading. Bearish divergence occurs when one market prints a higher high while the other fails to confirm, hinting at weakening buying momentum.
3. Institutional Activity
One of the reasons SMT divergence is so closely watched is its potential link to smart money behaviour. Institutions often use correlated instruments to mask their actions, creating subtle imbalances that only become apparent through careful analysis. For instance, when one correlated pair lags, it might reflect deliberate accumulation or distribution by larger players.
How Traders May Use the SMT Divergence Strategy
Analysing SMT divergence may help in understanding the nuanced relationship between correlated instruments and interpreting these imbalances correctly. Unlike leading correlations—such as oil influencing the Canadian dollar—SMT divergence doesn’t rely on one asset consistently driving the other. Instead, it focuses on shifts in momentum where neither instrument is the leader, but their combined behaviour hints at potential market moves.
Identifying Divergence
Traders start by observing price action in two correlated instruments or timeframes. SMT divergence becomes apparent when one instrument forms a higher high or lower low, while the other fails to do so. For example, if EUR/USD makes a higher high, but GBP/USD stalls below its previous peak, this inconsistency could signal fading bullish momentum in the broader market. The main point is that neither asset leads; instead, the divergence itself provides the signal.
Some common correlations traders use include:
- Forex Pairs:
- EUR/USD and GBP/USD
- USD/JPY and USD/CHF
- DXY and USD/CAD
- Cryptocurrencies*:
- BTC/USD and ETH/USD
- Equity Indices:
- S&P 500 and NASDAQ
- FTSE 100 and DAX
- Treasuries:
- US 10-Year Treasury Yield and USD/JPY
- Commodities:
- Brent Crude and WTI Crude Oil
Interpreting Divergence at Extremes
SMT divergence is a versatile analytical method that traders use to refine their strategies and deepen their understanding of market dynamics. Here’s how it’s typically applied in practice:
Identifying Market Turning Points
One of the most common uses of SMT divergence is spotting potential reversals. When divergence appears at key highs or lows, it often signals that momentum is shifting. When combined with other common trading tools, such as support and resistance, as well as ICT methodology concepts like order blocks and fair value gaps, this can be used to time entries or adjust risk exposure.
Contributing to Risk Management
SMT divergence can support risk management by offering early warnings about changes in market conditions. If divergence aligns with other factors—such as weakening volume or significant resistance/support levels—it can serve as a signal to tighten stops or reduce position sizes, depending on the trader’s broader approach.
At the same time, it can also provide clear boundaries for setting stop losses. If a trader has confidence that a reversal in one asset is likely due to an SMT divergence, then a stop loss could be placed immediately after the maximum or minimum of the divergence.
Adding Context
Traders rarely rely on an SMT divergence strategy alone. They often look for supporting evidence, such as volume analysis, market structure shifts, or order flow data, to confirm the signal. For instance, divergence combined with signs of institutional selling near a high could strengthen the case for a bearish move.
SMT Divergence in Different Market Conditions
SMT divergence behaves differently depending on market conditions, offering traders insights that vary between trending and ranging environments. Its reliability hinges on the context in which it appears, so understanding how it adapts to different scenarios is importnant.
Trending Markets
In trending markets, SMT divergence often signals potential reversals or pauses in momentum. For example, in a strong uptrend, divergence at a new high (where one correlated instrument makes a higher high while the other does not) can indicate waning buying pressure. This inconsistency might suggest that institutional players are beginning to reduce their positions or shift market direction.
A similar principle applies in downtrends: divergence at a fresh low, where one instrument breaks lower while the other doesn’t, could signal that bearish momentum is losing steam. Traders often use these moments to reassess their analysis and consider the possibility of a reversal or pullback within the trend.
Ranging Markets
In a range-bound environment, SMT divergence takes on a different role. Rather than hinting at trend reversals, it often highlights potential breakouts or false moves. For instance, during a consolidation phase, if one correlated instrument makes a sharp move outside the range while the other stays contained, it may signal that the breakout is unsustainable and a reversal back into the range is likely.
Alternatively, if both instruments diverge significantly at the edges of the range, it could suggest that smart money is accumulating or distributing positions in preparation for a breakout.
Different Asset Classes
SMT divergence isn’t limited to one market type. In forex, it often reveals imbalances caused by macroeconomic drivers like central bank policies. In equities, it can signal sector rotation or institutional adjustments. Commodities, particularly oil or gold, may show divergence influenced by supply and demand dynamics.
Limitations and Common Misconceptions of SMT Divergence
While SMT divergence is a powerful tool for analysing market imbalances, it’s important to understand its limitations and avoid common misconceptions. Misinterpreting divergence can lead to flawed decisions, especially if it’s viewed in isolation or without proper context.
Limitations
- False Signals: Not all divergences indicate institutional activity or meaningful shifts in the market. Low liquidity or erratic price movements can create divergence that doesn’t hold significance.
- Context Dependency: SMT divergence requires a solid understanding of market conditions. Its reliability decreases in highly volatile or choppy environments where correlations break down temporarily.
- Not a Standalone Tool: Relying solely on SMT divergence can be risky. Traders use it alongside other forms of analysis, such as market structure or volume data.
Common Misconceptions
- Always Linked to Institutional Activity: Not every instance of SMT divergence involves smart money. Divergences can also result from retail trading activity or macroeconomic events.
- Predicting Market Direction: SMT divergence doesn’t guarantee outcomes; it highlights imbalances. Further analysis is needed to evaluate whether the market will reverse, continue, or consolidate.
- Universal Applicability: While it works across various markets, not all instruments are equally suitable for SMT divergence due to differences in liquidity or drivers. Even within forex, market microstructure, dealer intermediation, and increasingly electronic and algorithmic trading can disrupt short-term relationships between correlated instruments (BIS).
The Bottom Line
The SMT divergence is a valuable tool for understanding market imbalances and spotting potential turning points. By combining it with other analysis methods, traders can gain deeper insights into price action. It may help frame moves within a broader market context, showing whether observed strength or weakness is specific to a single instrument or reflected across related assets. Used properly, it may encourage more selective entries, support proper timing around highs and lows, and provide a clearer read on when momentum might be genuinely shifting rather than simply pausing.
If you want to explore these concepts in real markets, you can consider opening an FXOpen account today to access the tools you need to analyse SMT divergence in four advanced trading platforms and deploy your strategies with competitive spreads and low commissions (additional fees may apply).
FAQ
What Does Divergence Mean in Trading?
Divergence in trading refers to a mismatch between the price action of an asset and a technical indicator or between two correlated instruments. It often signals a potential change in trend, as the imbalance suggests a shift in market momentum.
What Is SMT in Trading?
SMT in trading stands for Smart Money Technique. SMT divergence is one of the ICT trading concepts. It focuses on identifying market imbalances that may reflect the activity of institutional traders, seen through divergence between correlated instruments.
What Does SMT Divergence Mean?
The SMT divergence meaning refers to an occasion when two correlated instruments fail to move in sync. One can make a higher high while the other does not or one can make a lower low while the other doesn’t. This indicates potential smart money involvement and signals a possible trend shift.
What Is an Example of SMT Divergence?
A common example is in forex, where EUR/USD forms a higher high, but GBP/USD does not. This divergence could suggest fading bullish momentum, signalling a possible reversal in EUR/USD.
What Is the Strongest Divergence Indicator?
While SMT divergence itself is powerful, traders often combine it with indicators like RSI or volume profiles for added confirmation. The strongest signals come from divergence paired with a broader market context.
*Important: At FXOpen UK, Cryptocurrency trading via CFDs is only available to our Professional clients. They are not available for trading by Retail clients. To find out more information about how this may affect you, please get in touch with our team.
This article represents the opinion of the Companies operating under the FXOpen brand only. It is not to be construed as an offer, solicitation, or recommendation with respect to products and services provided by the Companies operating under the FXOpen brand, nor is it to be considered financial advice.


