
Crypto World
Solana Price Drops 3% but Longs Keep Piling In: 17 Million SOL Explain Why
Solana (SOL) price trades at $82.20 on April 9, down 3% in 24 hours and 34% year-to-date. Yet leveraged traders are betting heavily on a bounce.
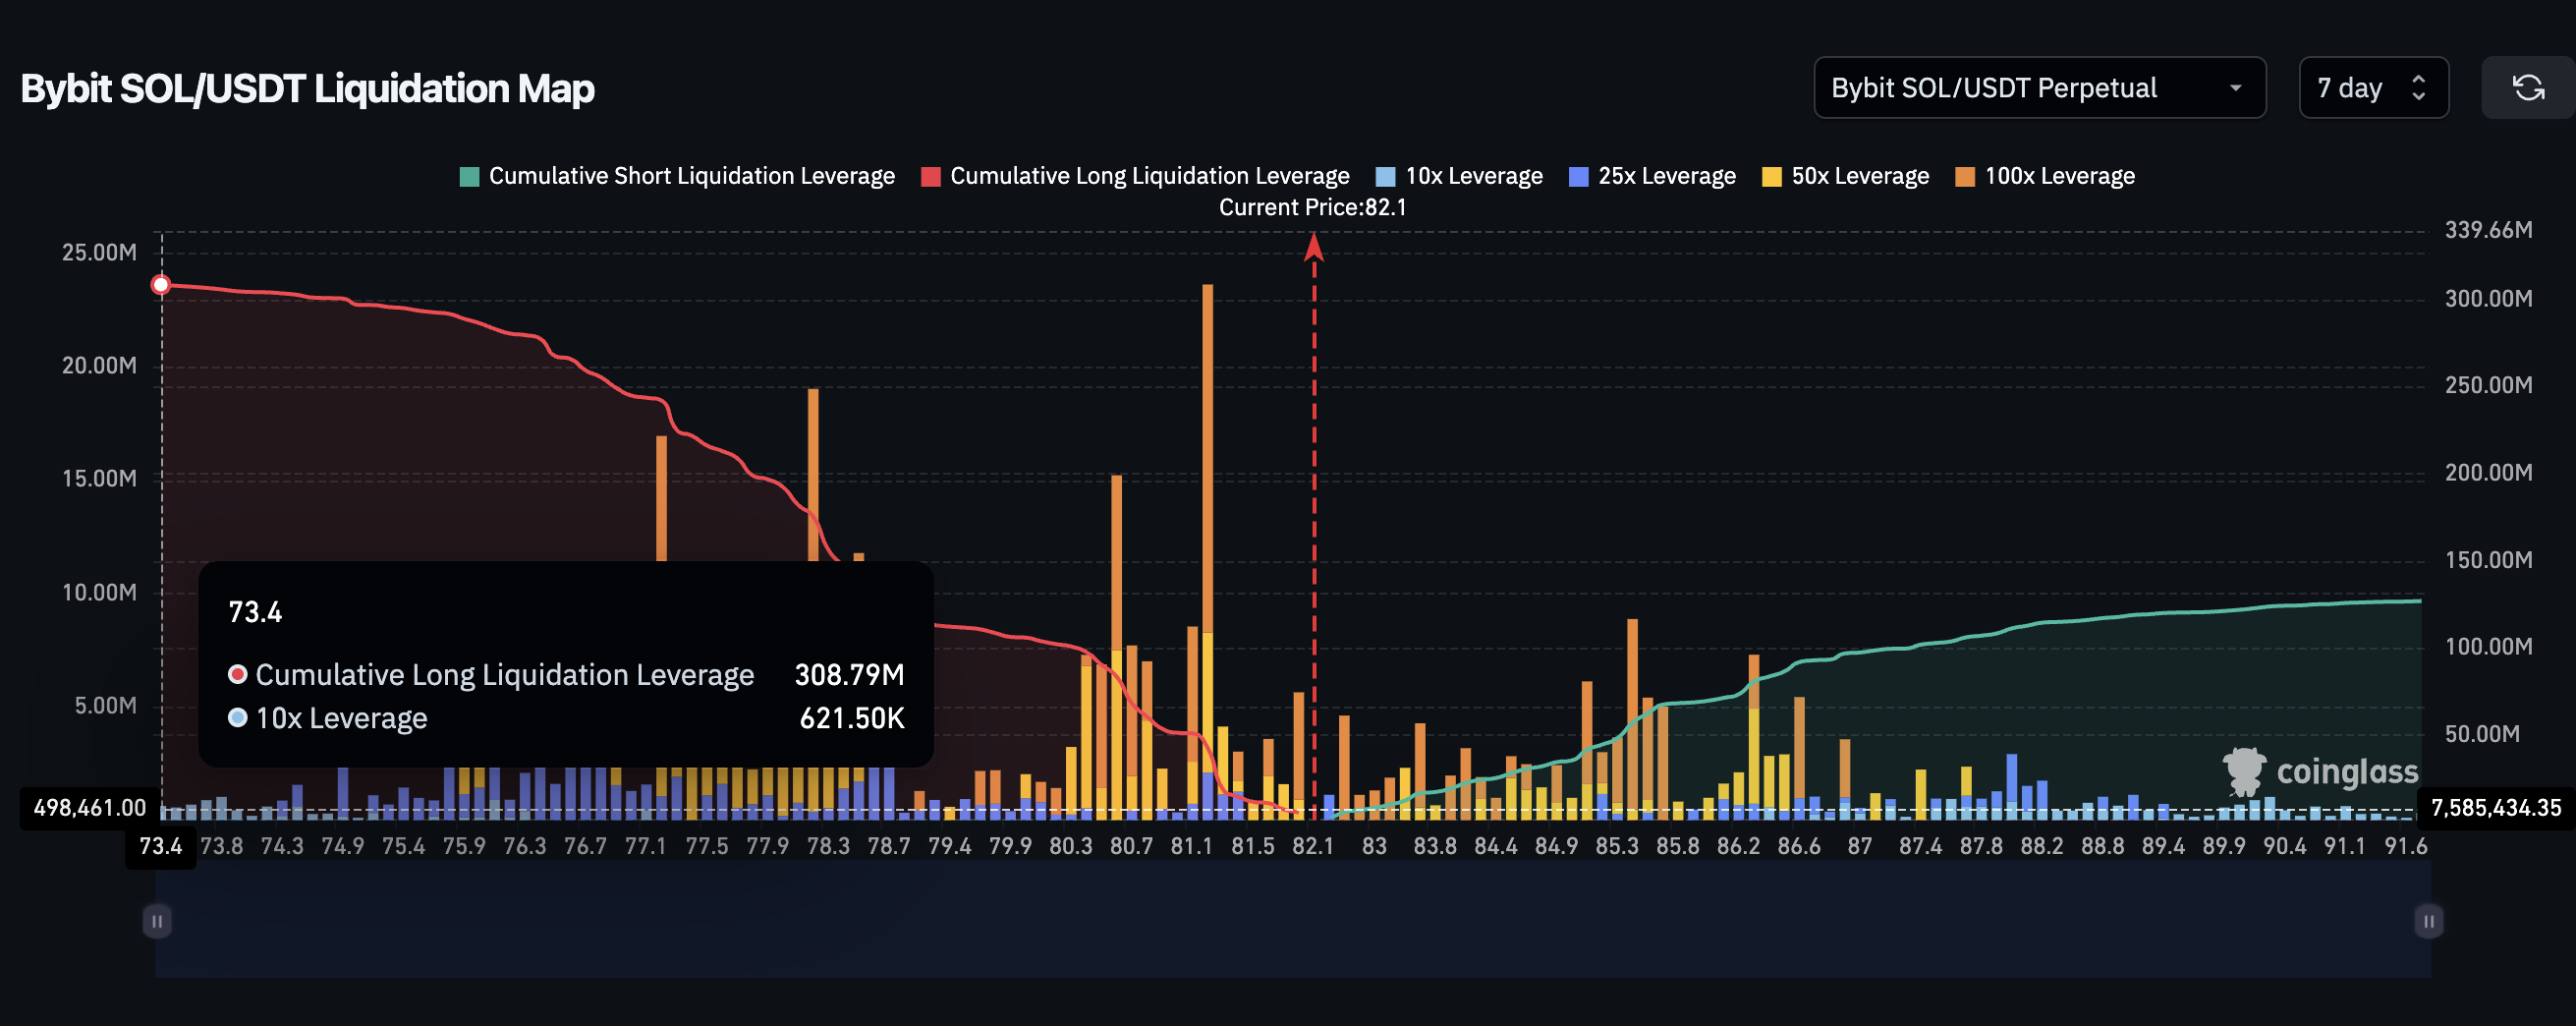
The seven-day liquidation map on Bybit shows $309 million in cumulative long leverage against just $127 million in shorts, a 2.4x mismatch that defies the price weakness. A bullish reversal pattern on the 12-hour chart and an on-chain supply wall may explain why the crowd refuses to turn bearish on Solana price despite the sustained bleed.
Price Weakness Meets a 2.4x Long Bias as a Reversal Pattern Takes Shape
Solana price has dropped almost 5% over the past 30 days while the broader market digested ceasefire uncertainty and capital rotation into equities. The 34% year-to-date decline makes SOL one of the weaker performers among top tokens.
The leverage picture tells a completely different story. On Bybit’s SOL/USDT perpetual market, cumulative long liquidation leverage stands at $308.79 million. Short liquidation leverage sits at $127.02 million. Longs outweigh shorts by roughly 2.4 to 1.
Want more token insights like this? Sign up for Editor Harsh Notariya’s Daily Crypto Newsletter here.
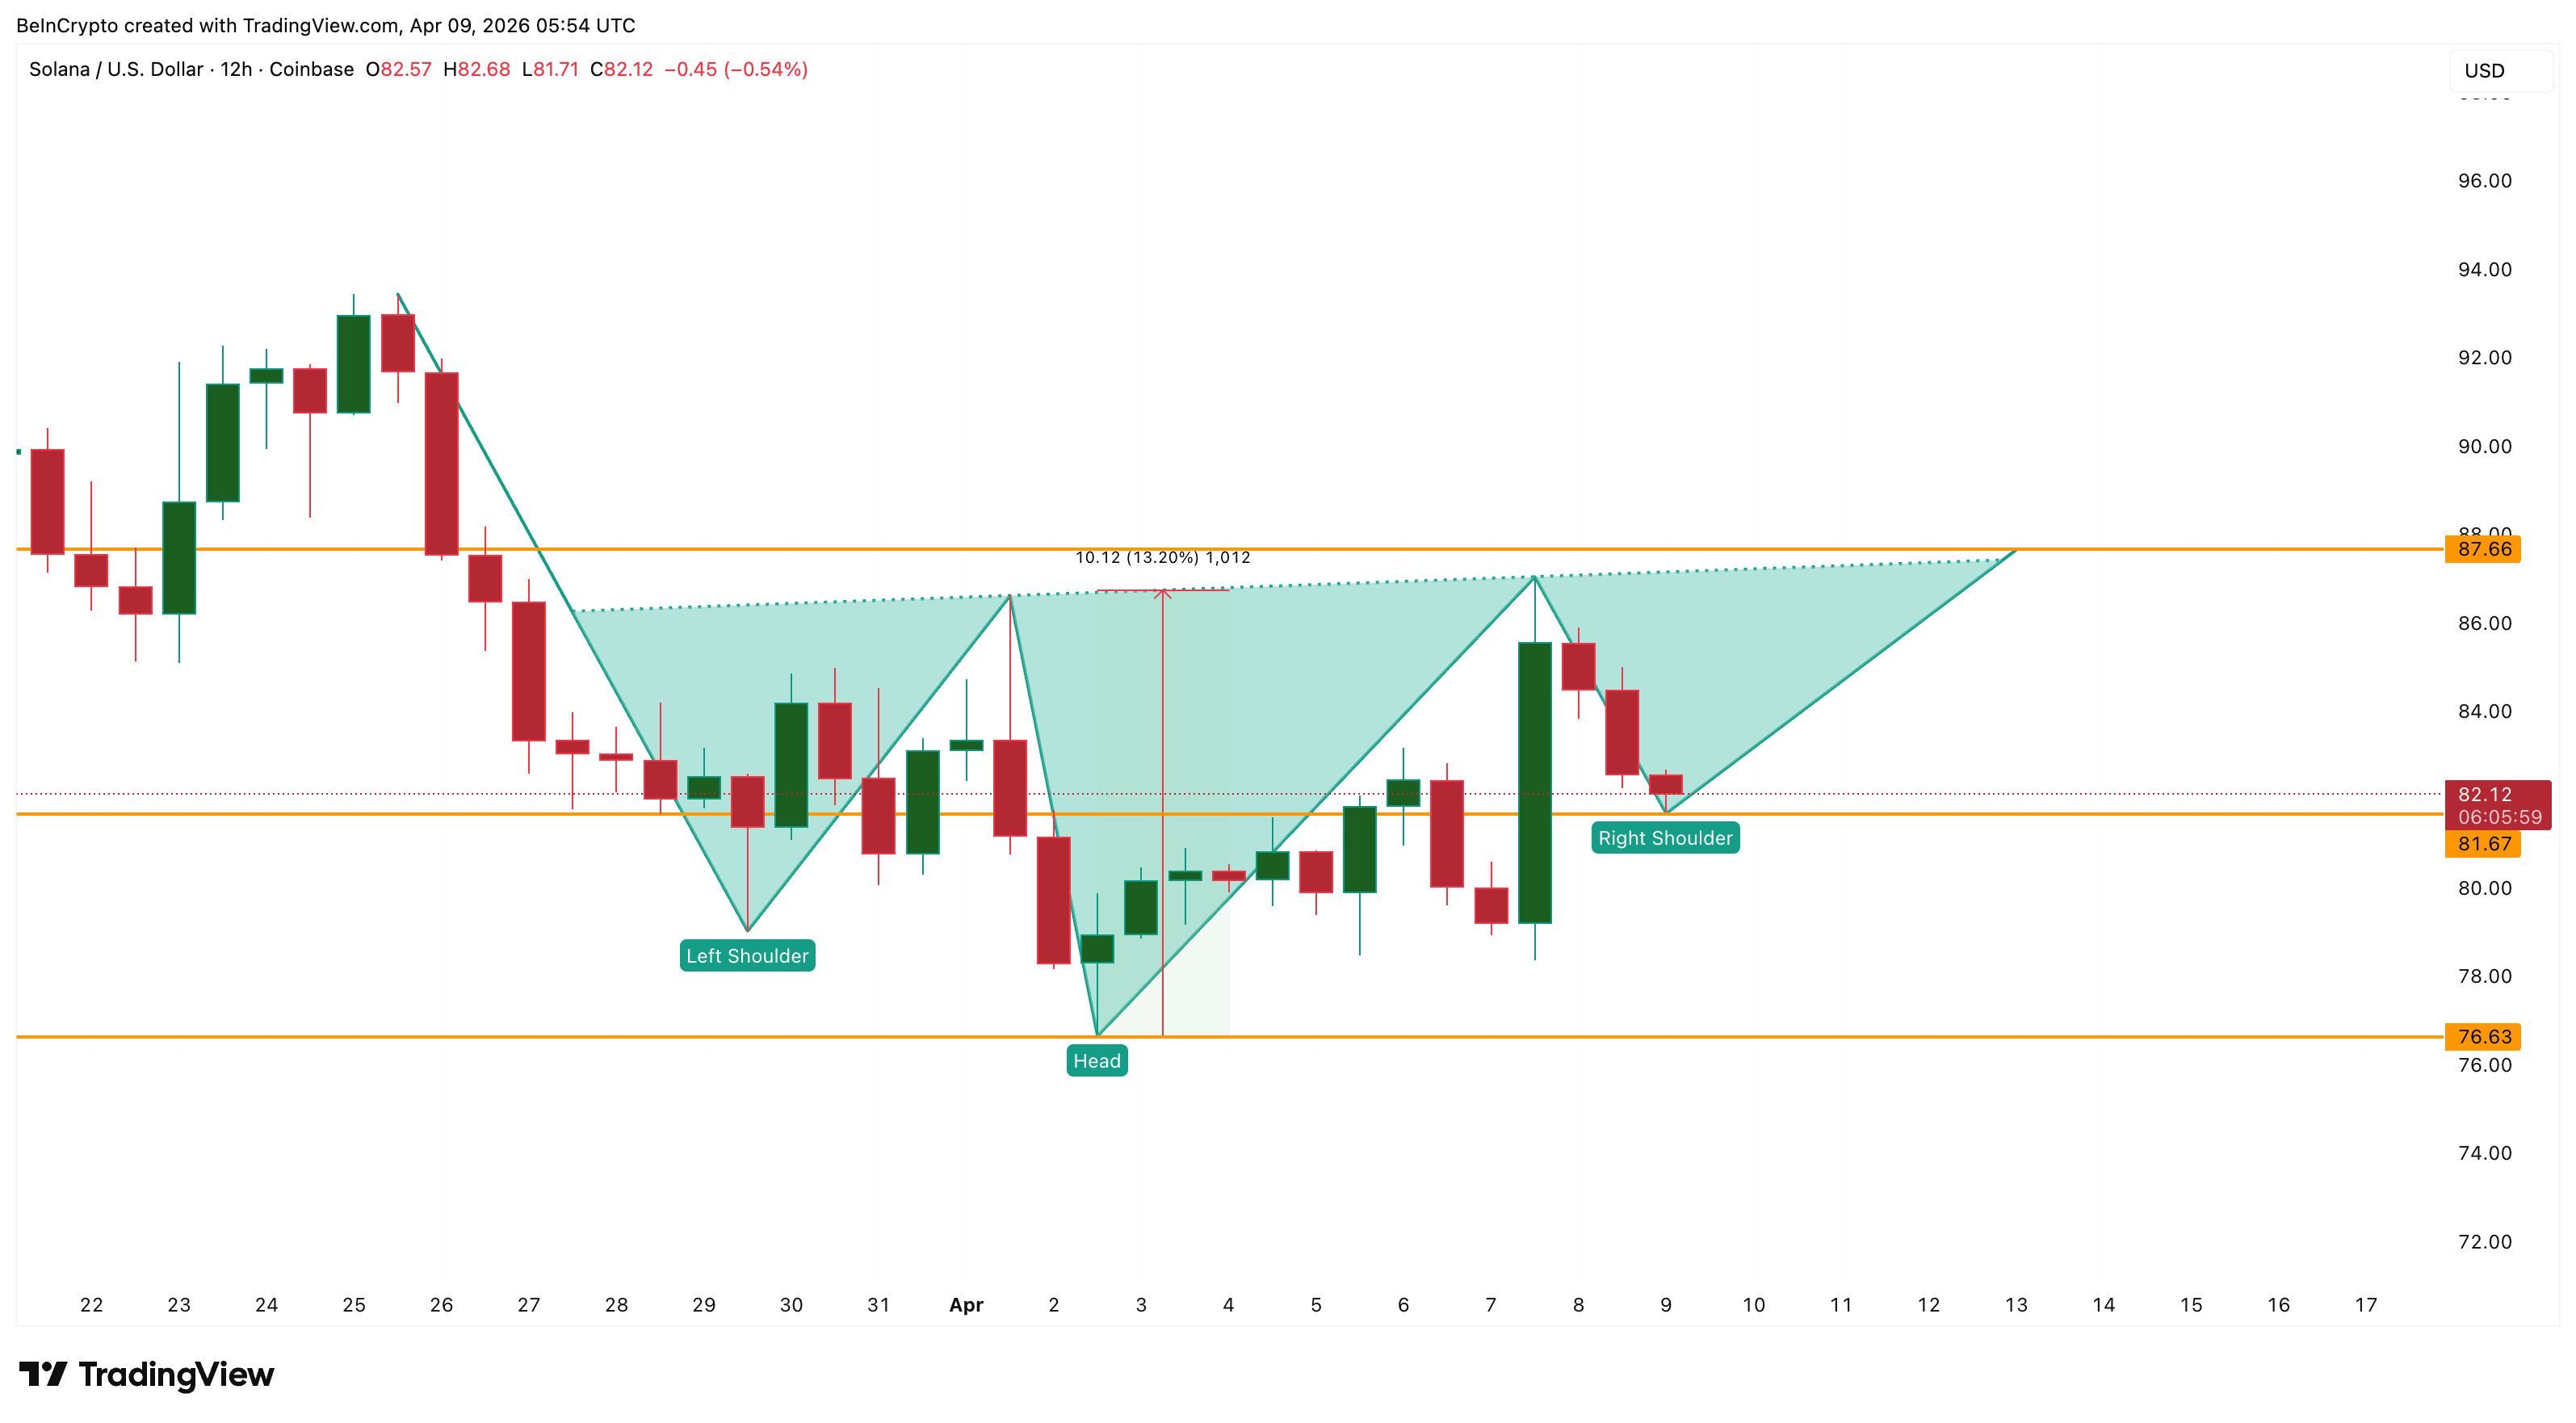
The mismatch becomes less puzzling when the 12-hour chart is considered. SOL is forming an inverse head and shoulders, a bullish reversal pattern. The right shoulder is currently taking shape, and the price is sitting near its base. As long as the pattern remains valid (SOL stays above $76.63), the leveraged crowd appears to be betting that the current dip is the final leg of the right shoulder before a breakout.
However, a pattern alone does not justify $309 million in directional bets. The on-chain picture reveals where that conviction is coming from.
17.5 Million SOL Accumulated at the Exact Level Where the Right Shoulder Sits
The cost basis distribution heatmap from Glassnode shows the densest supply cluster sitting between $81.16 and $81.98. Approximately 17.47 million SOL has been accumulated at this range, making it the strongest holder concentration zone on the chart.
The right shoulder’s lowest wick sits at $81.67, directly inside this cluster. The alignment is not a coincidence. Traders and holders who bought between $81.16 and $81.98 are defending their cost basis. Every dip into this zone gets absorbed because selling here would mean realizing losses for a large portion of the supply.
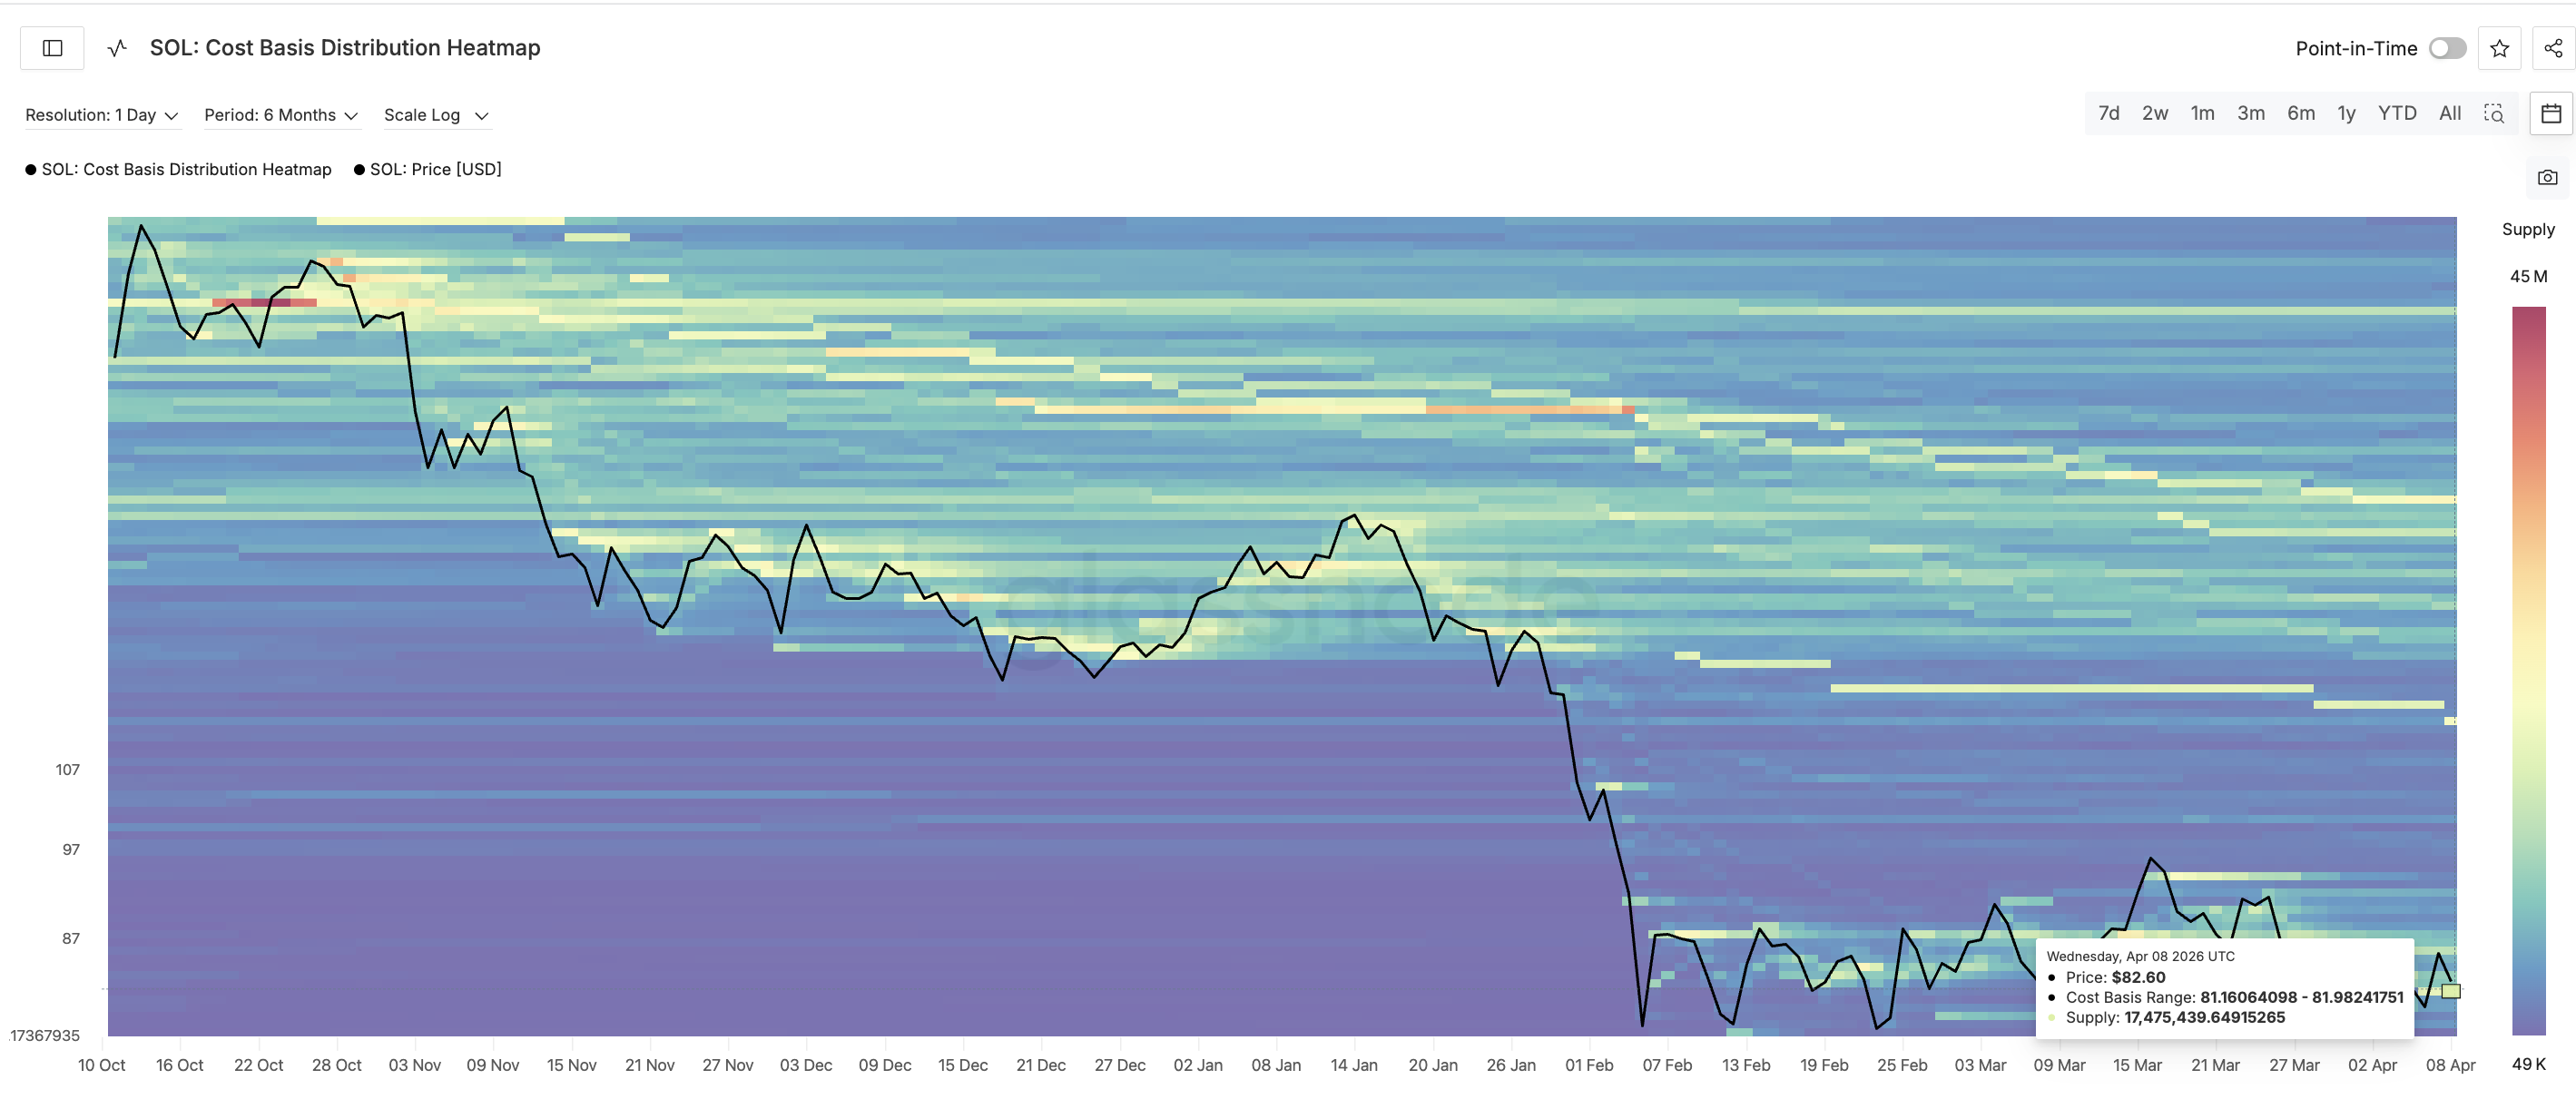
This on-chain wall gives the inverse head and shoulders its structural credibility. The pattern is holding because a real supply base supports it, not just speculative leverage. The longs on Bybit appear to be reading the same signal and positioning accordingly.
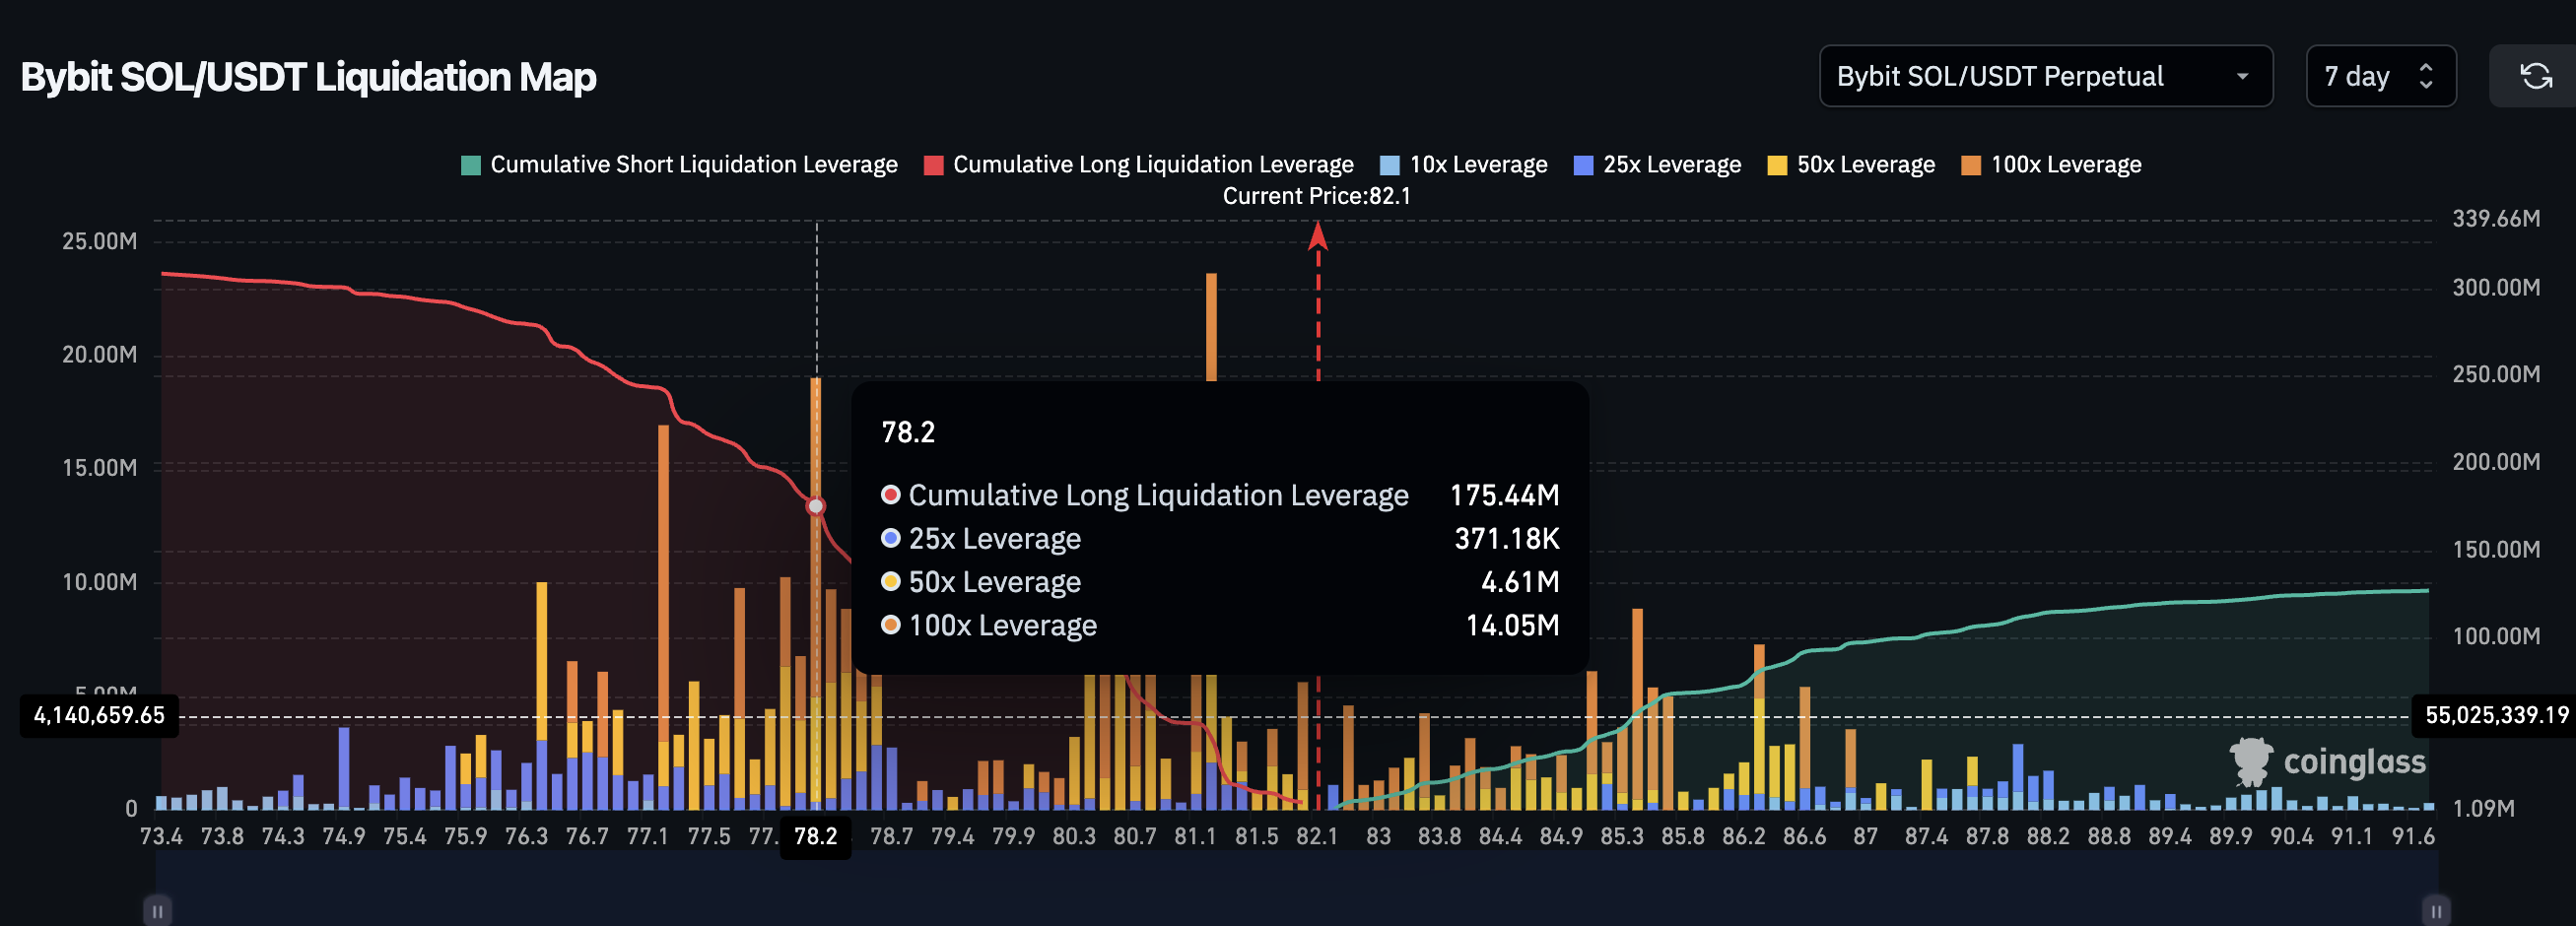
However, a $175 million long liquidation cluster sits around $78. If the cost basis wall fails and Solana price drops through $78, the resulting cascade could wipe out the bullish thesis rather quickly.
The SOL price levels now determine which outcome plays out.
Solana Price Levels That Decide if the Longs Are Right
SOL trades at $82.20. The first hurdle sits at $84.12 at the 0.236 Fibonacci level. A 12-hour close above $84.12 would suggest the right shoulder was completed earlier and buyers are now pushing toward the neckline.
The neckline zone sits between $86.86 at the 0.5 level and $88.09 at the 0.618 level. A daily close above $88.09 would confirm the breakout and activate the 13.2% measured move projection from the neckline. That targets $98.47-$98.80, per target projection.
On the downside, $81.67 is the right shoulder floor and almost the base of the 17.5 million SOL supply wall. A 12-hour close below $81.67 would deepen the right shoulder and raise questions about the pattern’s validity.
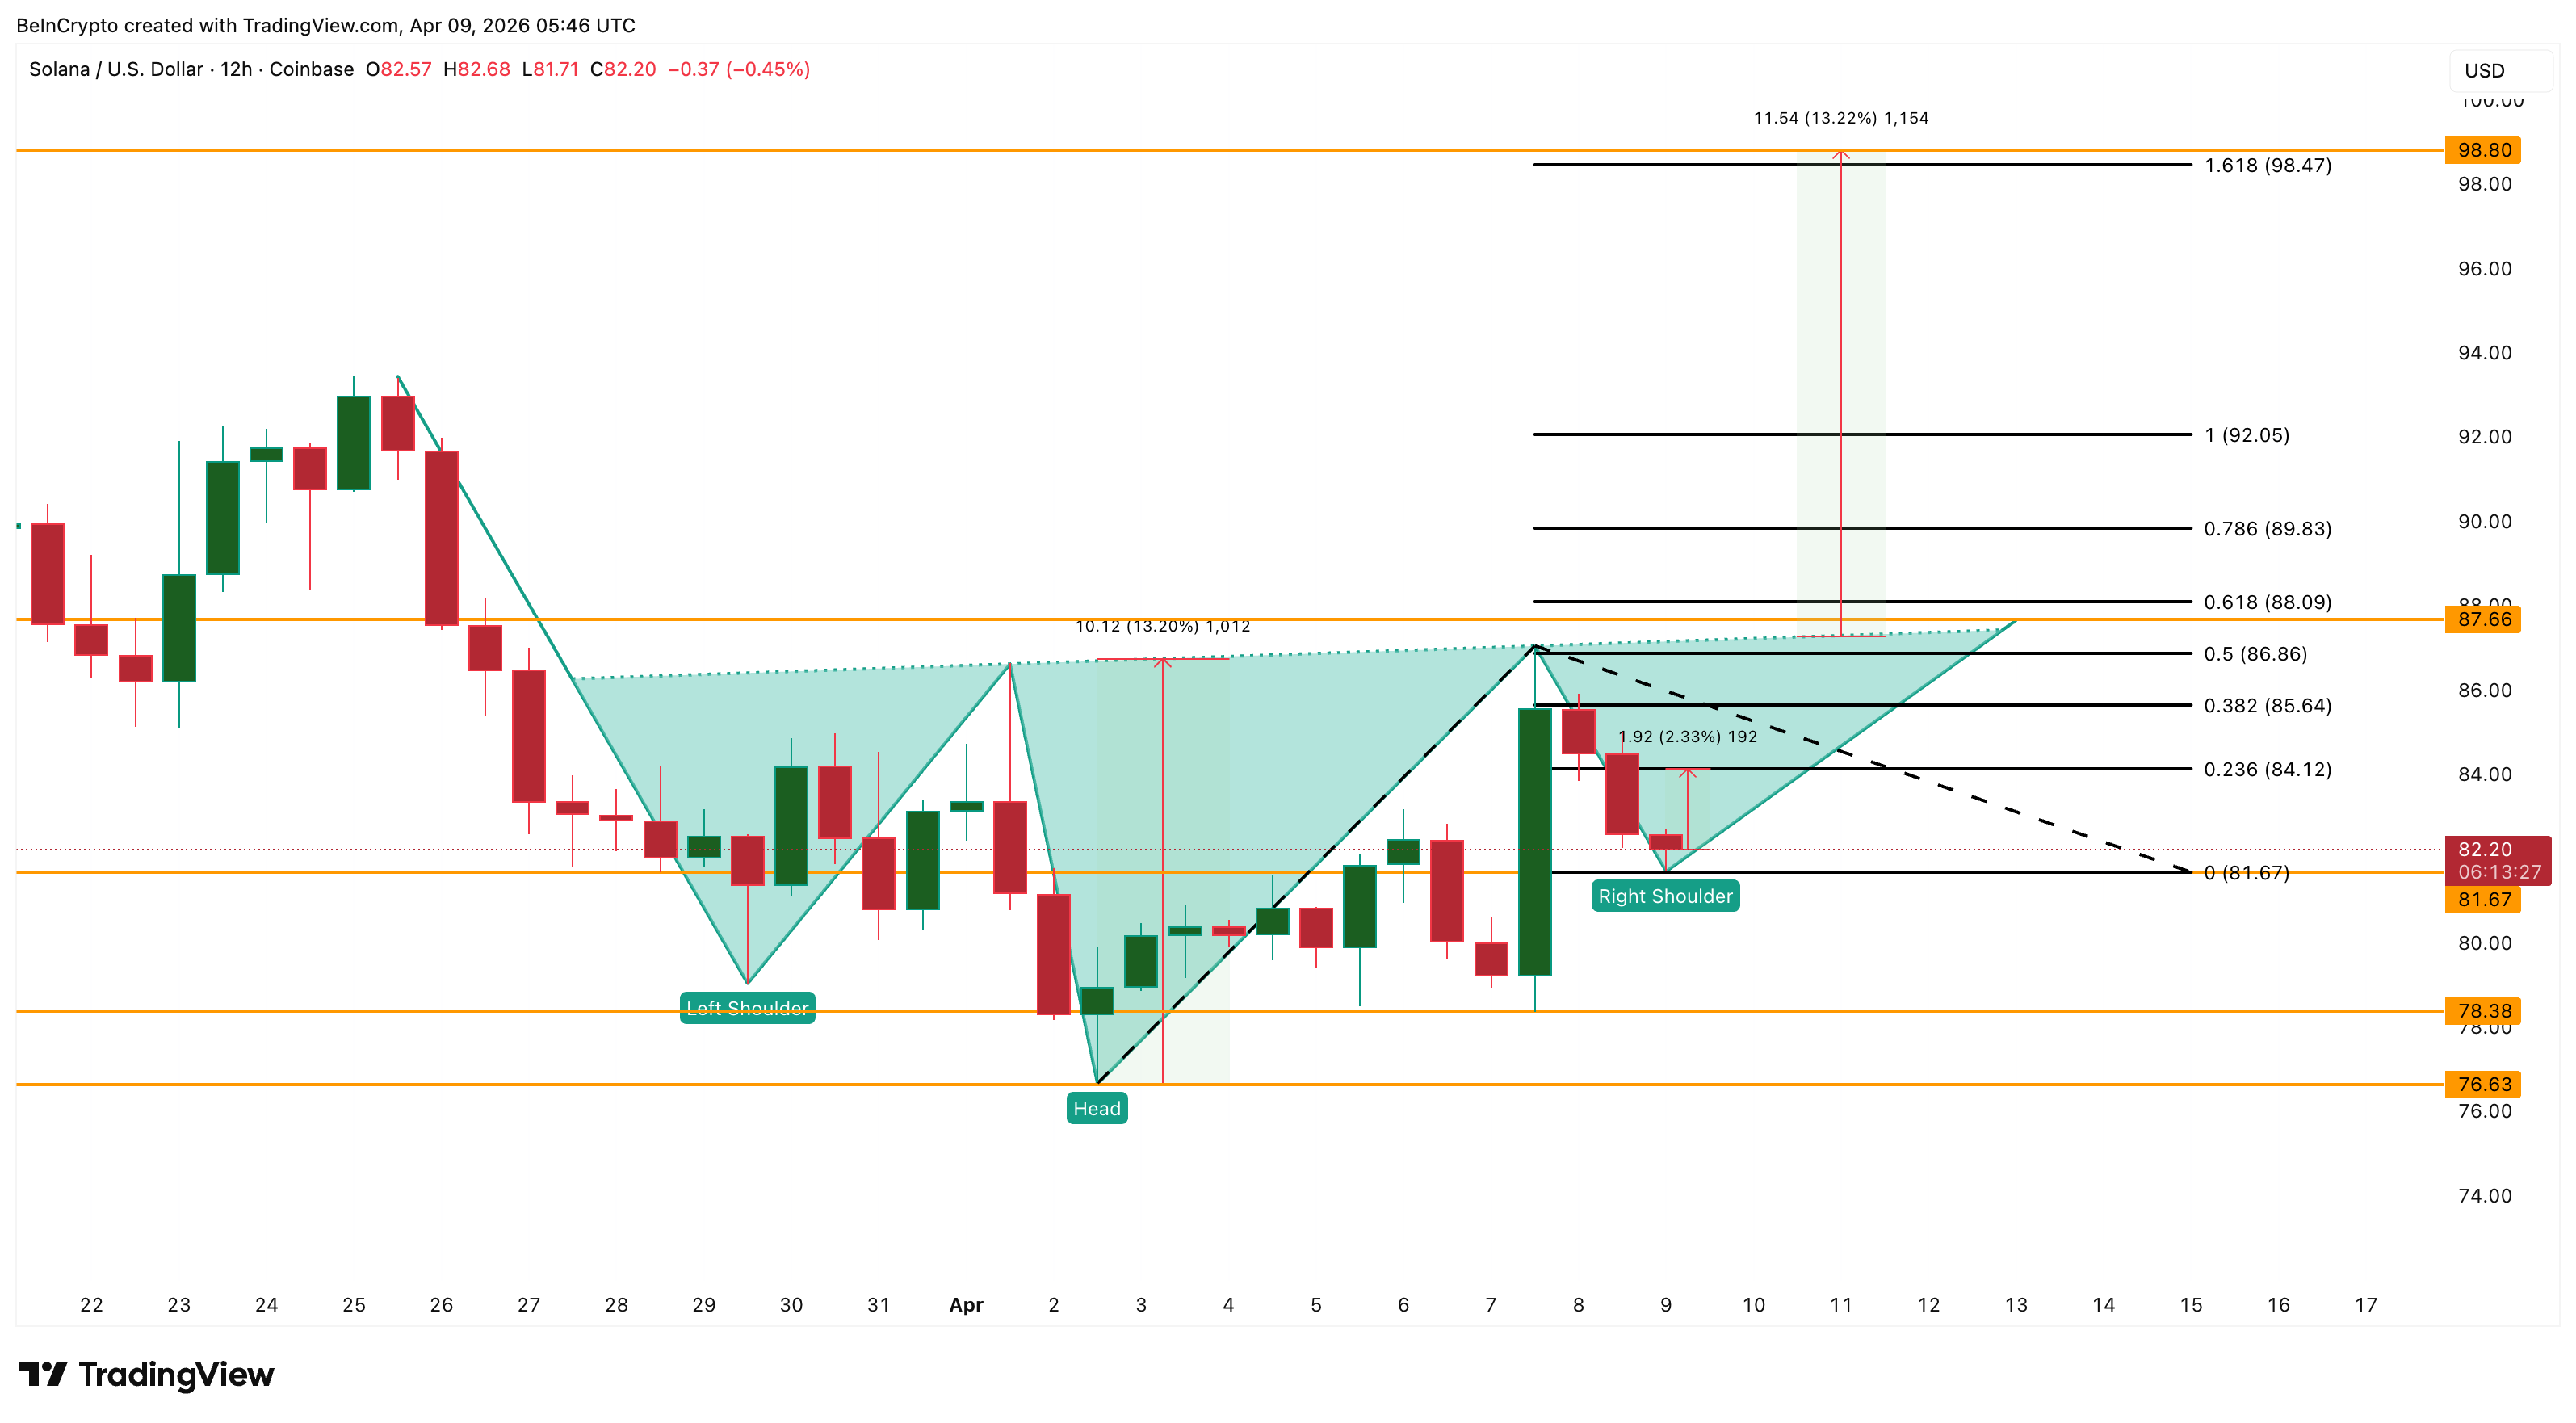
Below that, $78.38 offers the next technical support. However, the $78 zone is where roughly $175 million in long liquidations are clustered. If SOL reaches that level, forced selling from liquidated positions would likely accelerate the decline and damage the pattern significantly. A break below $76.63 at the head invalidates the inverse head and shoulders entirely.
For now, $88.09 separates a confirmed breakout toward $98.80 from a failed right shoulder that risks triggering $175 million in long liquidations below $78.
The post Solana Price Drops 3% but Longs Keep Piling In: 17 Million SOL Explain Why appeared first on BeInCrypto.


A StarkWare researcher has published what he says is the first method for making bitcoin transactions quantum-safe on the live network today, without any changes to the Bitcoin protocol. The scheme, however, costs up to $200 per transaction and is designed as an emergency measure rather than a permanent fix.
In a paper published this week, StarkWare researcher Avihu Levy introduced Quantum Safe Bitcoin, or QSB, a scheme that aims to enable quantum-resistant transactions without requiring changes to the Bitcoin protocol, by replacing signature-based security assumptions with hash-based proofs within its design.
The hash-based design survives the kind of quantum attack that would break today’s cryptography, but shifts the burden from consensus to computation, requiring heavy off-chain GPU work for every transaction.
Think of traditional digital signatures as a handwritten signature on a cheque, which proves you authorized a transaction using a secret key that others can cross check with a public key.
In Bitcoin, these digital signatures are called ECDSA signatures. They are secure against today’s computers, but a sufficiently powerful future quantum computer could, in theory, derive the secret key from a public key and potentially compromise funds.
QSB addresses that flaw by redesigning the system around a different kind of cryptography, involving hash-based proofs, which are more like a tamper-proof fingerprint, where instead of relying on signature alone, a unique mathematical digest of data is created. This is said to be extremely difficult to forge or reverse, even for powerful computers.
QSB works entirely within Bitcoin’s existing consensus rules for legacy transactions. It requires no soft fork (software upgrade), no miner signaling, and no activation timeline. This is a sharp contrast to BIP-360, the quantum-resistance proposal that was merged into Bitcoin’s official improvement proposal repository in February but has no Bitcoin Core implementation and faces years of governance delay.
The proposal builds on an earlier idea known as Binohash, which added an extra layer of computational work to secure bitcoin transactions. The problem is that it depends on a type of cryptography that quantum computers are expected to break. In practice, that means the protection disappears in a quantum scenario. An attacker could bypass the system’s core security check entirely, making it ineffective.
Extra cost
The hash-based solution, however, means extremely expensive transactions.
Generating a valid transaction requires searching through billions of possible candidates, a process Levy estimates would cost between $75 and $200 using commodity cloud GPUs. Currently, the cost to send a bitcoin transaction through the blockchain is around 33 cents.
The system also comes with practical hurdles. QSB transactions wouldn’t move through Bitcoin’s normal blockchain like typical payments. Instead, users would likely need to send them directly to miners willing to process them.
They also don’t work with faster, cheaper layers like the Lightning Network, and are far more complicated to create. Generating a transaction would require outsourcing heavy computation to external hardware, rather than simply signing and sending from a wallet.
Levy describes the scheme as a “last resort measure,” not a replacement for protocol-level upgrades. Proposals such as BIP-360, which aim to introduce quantum-resistant signature schemes through a soft fork, remain the more scalable long-term solution but could take years to activate.
BIP-360’s activation timeline is uncertain. Polymarket bettors are pricing in low odds of it happening this year, and Bitcoin’s governance history offers little reason for urgency — Taproot took roughly seven and a half years from concept to deployment. Then again, mature quantum computers capable of breaking the encryption that secures the network are not arriving tomorrow either.
QSB instead offers something different: a way to survive a quantum break using today’s rules, if users are willing to pay for it.
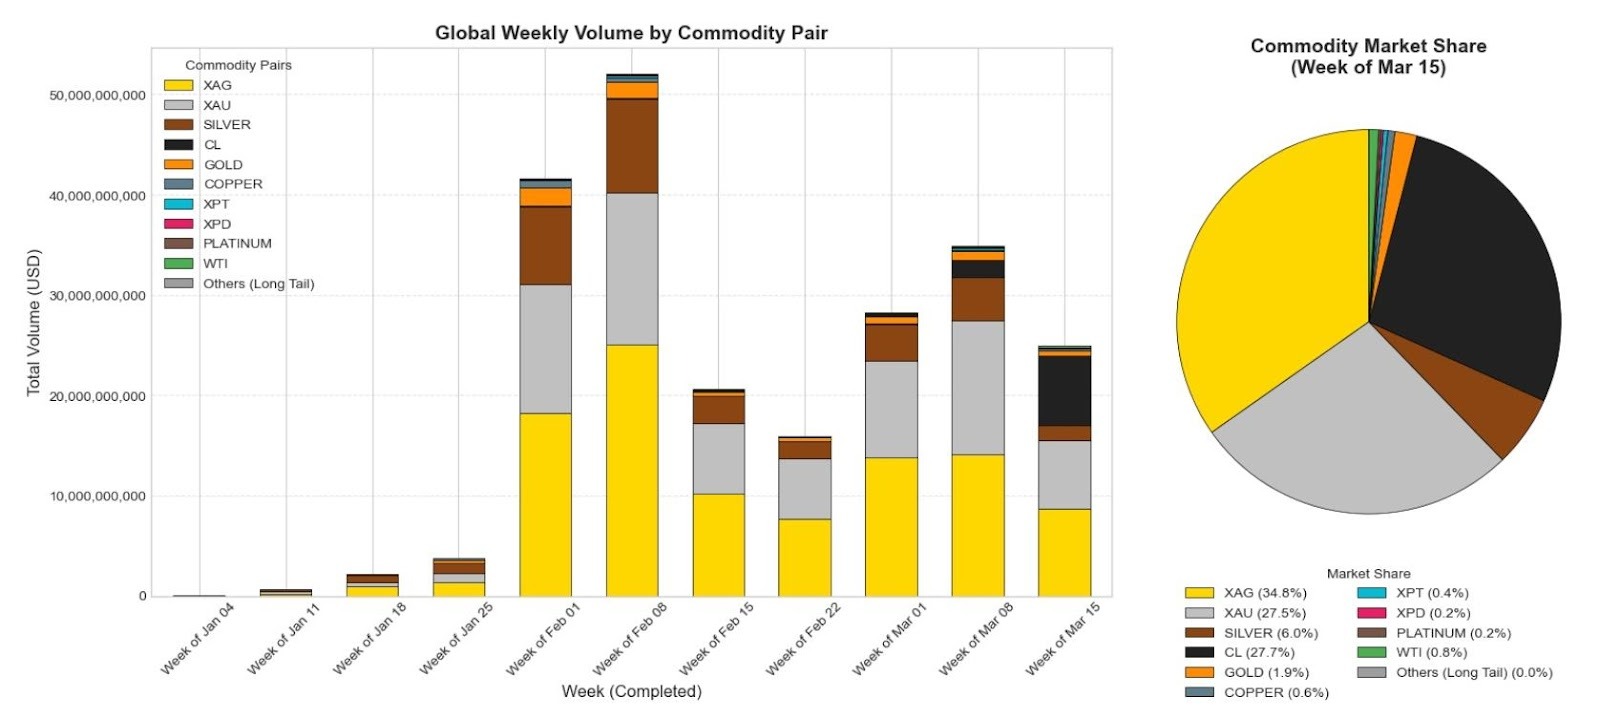
BitMEX said in a Thursday report that commodity perpetual swaps were the fastest-growing segment of TradFi perps in the first quarter of 2026, with weekly volume rising 65,463% from $38.1 million to $25.0 billion.
The report said silver, crude oil and gold drove most of that growth. By the week of March 15, Silver (XAG) accounted for 34.8% of the market share of tokenized commodities, followed by crude oil (CL) for 27.7%, gold (XAU) at 27.5% and Silver on Hyperliquid for 6%, according to a Thursday report.
BitMEX said the March entry of crude oil added a new leg to the market, attributing that move to Iran-related geopolitical tensions and broader demand for 24/7 commodity exposure on crypto-native venues.
The figures point to a fast-growing niche inside crypto derivatives markets.

Brent crude oil has risen by around 44% since the first US/Israeli strikes on Iran on Feb. 28, from around $69 to above $99 at the time of writing, according to data from Trading Economics. Oil prices peaked at around $114 on Tuesday, their highest level since the beginning of the conflict.

Weekend dislocations lifted commodity perps
Onchain TradFi perps are driving traders to “speculate and hedge against weekend geopolitical events like the recent Iran conflict, in real time,” Stephan Lutz, CEO at BitMEX, told Cointelegraph. “While the perpetual swaps model will continue to capture significant market share in commodities trading due to its 24/7 nature, we are highly skeptical about tokenising spot assets,” he said.
However, minting physical commodities on the blockchain is complicated by the legacy financial system’s “complex, arbitrary legal rules,” Lutz said, adding that onchain derivatives will continue to eat into the trading share of traditional commodities, until “legacy giants like the CME” launch their own 24/7 trading venues.
Related: Crypto exchanges gain as tokenized commodity market climbs to $7.7B
In the broader market, the total market capitalization of onchain commodities declined by 2.7% during the past 30 days to $7.34 billion as of Thursday, according to data aggregator RWA.xyz.

BitMEX, which says it launched the first perpetual swap in 2016, now offers more than 20 TradFi contracts, according to the report.
Binance, the world’s largest cryptocurrency exchange, introduced gold and silver perpetuals in January. It offers contracts spanning precious metals and tokenized equities. Its Silver (XAG) contract saw an average daily volume of $1.31 billion during the quarter, according to the report.
Magazine: Can Robinhood or Kraken’s tokenized stocks ever be truly decentralized?
A Bitcoin researcher has come up with a way that could immediately make Bitcoin transactions quantum-safe without the need for a soft fork.
In a proposal published Thursday, StarkWare chief product officer Avihu Levy proposed a Quantum Safe Bitcoin (QSB) transaction scheme that he said would remain secure “even against an adversary with a large-scale quantum computer running Shor’s algorithm.”
He added that the scheme requires no changes to the Bitcoin protocol and operates entirely within the existing legacy script constraints. The downside is that it is costly and likely is not useful for everyday transactions, he said.
The Bitcoin community has been split on how to tackle the quantum problem. QSB presents a temporary solution while a long-term approach is ironed out.
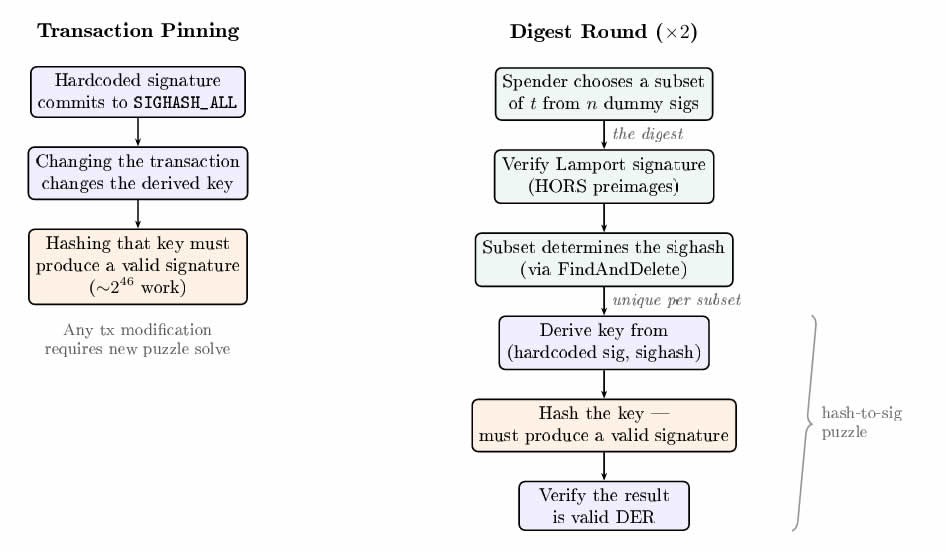
The scheme’s main feature is replacing the proof-of-work signature-size puzzle with a hash-to-sig puzzle.
Instead of relying on elliptic curve math that quantum computers can break, the spender must find an input whose hash output randomly happens to resemble a valid ECDSA (elliptic curve digital signature algorithm) signature, requiring brute-force work that even a quantum computer cannot shortcut.

Quantum Safe Bitcoin not practical for everyday use
The proposal comes with caveats, however. It costs the sender between $75 and $150 per transaction in GPU compute and is more complex than a typical Bitcoin transaction, and thus would only make sense for securing large BTC transactions.
Related: Bitcoin’s quantum challenges are ‘more social than technical’: Grayscale
“This is huge,” said StarkWare CEO Eli Ben-Sasson, claiming that it essentially makes Bitcoin quantum-safe today.
However, Bitcoin ESG specialist Daniel Batten said it was “an overstatement” because exposed public keys and dormant wallets are “not addressed in the paper.”
Batten was referring to an estimated 1.7 million BTC locked in early P2PK addresses that could be cracked by a quantum computer.
Its existence has led to fierce debate about what to do with the dormant coins, with the community split between leaving Bitcoin as-is to preserve its core ethos, freezing or burning the vulnerable coins entirely or upgrading the protocol to support quantum-safe signatures.
Protocol changes are the preferred solution
The researchers acknowledged that this is a last-resort measure as transactions are non-standard, costs don’t scale to all users and use cases like Lightning Network are not covered.
They concluded that protocol-level changes remain the preferred long-term path.
“While this article describes a solution that works today for quantum-safe Bitcoin transactions, it should be treated as a last-resort measure.”
Google published a paper in March that unsettled the Bitcoin community as it suggested that a quantum computer could potentially crack Bitcoin’s cryptography using far fewer resources than previously thought.
Meanwhile, Lightning Labs chief technology officer Olaoluwa Osuntokun on Wednesday published a quantum “escape hatch” prototype that enables users to prove Bitcoin wallet ownership from the original seed phrase without revealing it, which could serve as an alternative Bitcoin authorization method.
Magazine: Nobody knows if quantum secure cryptography will even work


The latest crypto update from Washington reshaped the CLARITY Act debate on Wednesday when the White House Council of Economic Advisers published a 21-page analysis finding that banning stablecoin yield would increase bank lending by just 0.02 percent, directly undercutting the banking industry’s central argument for restricting the product.
Summary
- The CEA report finds that prohibiting stablecoin yield would boost traditional lending by approximately $2.1 billion, equal to 0.02 percent of total loans, with 76 percent of that benefit flowing to large banks rather than the community lenders whose protection has driven the banking lobby’s position
- A ban would produce a net welfare loss of $800 million, meaning consumer costs outweigh any benefit to the financial system; the report also warns that tightening the CLARITY Act’s yield language further would be counterproductive
- Coinbase CPO Faryar Shirzad welcomed the findings while the banking industry pushed back, calling the conclusions beside the point, and the Senate Banking Committee markup remains targeted for late April
The Bloomberg report on the CEA analysis landed as the CLARITY Act remained deadlocked over the same stablecoin yield dispute that has stalled it since January. The study uses a model calibrated with Federal Reserve and FDIC data on deposits, lending, and bank liquidity, alongside stablecoin industry disclosures and academic estimates of how consumers move funds between assets. Its core finding is that when consumers buy stablecoins, the funds are typically reinvested in Treasury bills and redeposited into the banking system, leaving aggregate deposit levels largely unchanged regardless of whether yield is permitted.
The report’s bluntest conclusion: “In short, a yield prohibition would do very little to protect bank lending, while forgoing the consumer benefits of competitive returns on stablecoin holdings.”
The analysis hands crypto firms a White House-backed economic rebuttal to the banking lobby’s primary argument. The American Bankers Association has warned for months that stablecoins paying yield could drain deposits from community lenders, with the Independent Community Bankers of America estimating losses as high as $1.3 trillion. The CEA tested those numbers and found them implausible. Even under a scenario where the stablecoin market grew sixfold, reserves became unlendable, and the Federal Reserve abandoned its current framework, the lending boost from a ban would reach only 6.7 percent. The report describes those conditions as simultaneously implausible. Coinbase CPO Faryar Shirzad called the findings confirmation “that stablecoins aren’t a threat to community banks.”
What the Banking Industry Is Saying Back
Banking sources immediately pushed back, arguing the report underestimates how deposit outflows change the form in which funds return to banks, shifting them from lendable deposits into reserve assets that cannot be lent out. The American Bankers Association and Financial Services Forum said they want any legislative deal to support “the local lending to families and small businesses that drives economic growth.” That structural distinction between deposit forms, which the CEA model does not fully address, remains the contested ground in the negotiation.
What Comes Next Before the May Window Closes
As crypto.news has reported, the CLARITY Act is caught between four factions each with effective veto power over different parts of the bill. As crypto.news has noted, missing the May Senate window risks pushing the bill into midterm season, where the legislative calendar and Democratic incentives to cooperate both narrow sharply. The White House report is the most significant shift in the negotiation since the markup collapsed in January, and whether it unlocks a Senate vote by May is the question the industry is now watching closest.

Three US senators have reportedly asked one of the people behind US President Donald Trump’s memecoin whether the president intends to “dangle access” to himself at a luncheon event, given he is already planning to attend the White House Correspondents’ Association Dinner the same day.
According to a Thursday Politico report, Senators Elizabeth Warren, Richard Blumenthal, and Adam Schiff sent a letter to Bill Zanker, the individual behind the launch of the memecoin Official Trump (TRUMP). The lawmakers questioned whether Trump had been leveraging his appearance at a luncheon event scheduled for April 25, which the memecoin project announced in March.
“[O]rganizers are promoting a conference by dangling access to President Trump to potential attendees (and in doing so, are encouraging purchases of his meme coin that will generate transaction fees for the President and his family) on a day he may not actually be able to attend,” said the letter to Zanker, according to Politico.
While the memecoin event at Trump’s Florida Mar-a-Lago property is scheduled for April 25, so, too, is the White House Correspondents’ Association Dinner in Washington, DC, which the president said on March 2 that he planned to attend for the first time after boycotting it in his first term. Even before taking office, Trump attended many crypto-themed events, from the Bitcoin 2024 conference to the first dinner for TRUMP memecoin holders in May 2025.
Related: Bessent ramps up pressure on Congress to pass CLARITY Act
According to the terms and conditions from the project behind the memecoin, Trump “may not be able to attend” the April 25 event, and it could be cancelled for any reason. Cointelegraph reached out to the White House for comment on the president’s schedule and travel costs, but did not receive an immediate response.
US crypto market structure discussions are still underway
Amid the concerns from senators over potential conflicts of interest and “selling access” to the presidency, lawmakers and industry leaders have yet to publicly announce a compromise to allow a digital asset market structure bill to advance in Congress and be signed into law.
In July 2025, the House of Representatives passed the CLARITY Act, a bill to establish a market structure framework for cryptocurrencies in the US. Once passed to the Senate, the chamber’s agriculture committee advanced the legislation in January, but its banking committee indefinitely postponed a markup amid concerns over tokenized equities, stablecoin yield, and ethics.
As of Thursday, the Senate Banking Committee had not scheduled a markup on the bill, necessary to address securities laws before a potential floor vote. The White House released a statement on Wednesday claiming that a ban on stablecoin yield in the bill “would do very little to protect bank lending” in response to concerns from the banking and crypto industries.
Magazine: Anger grows over Polymarket bets on Iran war: ‘Dystopian death market’

TLDR
- Potential buyers are evaluating parts of Gemini rather than the entire company.
- Interested bidders want Gemini’s closed Europe and U.K. operations for regulatory access.
- European and U.K. approvals do not transfer automatically in an acquisition.
- Gemini’s stock has fallen more than 80% from its $28 IPO price.
- Gemini disclosed the departures of its COO, CFO, and CLO in a February filing.
Potential buyers are assessing parts of Gemini after the crypto exchange closed operations in Europe, the U.K., and Australia. Sources said bidders want licenses, not the full company. Gemini declined to comment.
The New York company cut 25% of its workforce in February. It also exited the U.K., the European Union, and Australia, while keeping U.S. and Singapore operations.
A person with direct knowledge said some interested parties want the closed European and British units. They seek regulatory access and do not want a full takeover.
Gemini licenses draw buyer interest in Europe and the U.K.
Gemini ran those businesses through national registrations and a MiCA license in Europe. In Britain, it held EMI status and cryptoasset registration with the FCA.
The source said buyers value those approvals because applications can take years. That timing explains interest in the closed units, even without interest in Gemini overall.
Still, buyers cannot simply inherit those permissions after a sale. European rules treat any takeover as a “change of control” event that triggers review.
Acquirers must notify the relevant authority and may need approval before closing. The FCA uses a similar process and does not allow a direct license transfer.
Stock slide and executive exits add to Gemini pressure
Gemini has extended beyond exchange trading into custody, staking, yield products, and payments. It also built a brokerage, clearing, and a crypto rewards credit card.
Yet the company has faced pressure since its September 2025 Nasdaq listing. The stock priced at $28, opened above $37, and closed its debut near $32.
That early rise faded, and the shares later fell to about $4.36. The drop left the stock down more than 80% from the IPO price.
Gemini disclosed three senior departures in a February filing. COO Marshall Beard, CFO Dan Chen, and CLO Tyler Meade left effective immediately.
Beard also resigned from the board, and Gemini said no dispute caused his exit. The filing linked the departures to no disagreement over operations, policies, or practices.
The exits came days after Gemini announced the shutdowns in the U.K., EU, and Australia. A company spokesperson declined to comment on the sale discussions.
After the report, Gemini shares rose 11% afterward. FactSet data also showed short interest at 15% of the company’s float.
Gemini Space Station, Inc. Class A Common Stock, GEMI
The company now keeps only its U.S. and Singapore businesses active. Those remaining operations followed the February cuts and the closure of overseas exchange units.
Its European and British entities now draw interest from buyers seeking market access through acquisitions, subject to formal approval reviews.


A new crypto law introduced by Manhattan District Attorney Alvin Bragg and New York State Senator Zellnor Myrie would convert unlicensed virtual currency operations from a civil regulatory issue into a criminal offense, carrying up to 15 years in prison for operators moving $1 million or more in a single year.
Summary
- The CRYPTO Act, or Cryptocurrency Regulation Yields Protections, Trust, and Oversight, was introduced January 14 and would add Section 408-b to New York’s Financial Services Law, creating a new offense of Unlicensed Virtual Currency Business Activity with graduated criminal penalties that currently do not exist at the state level
- Charges scale from a Class A misdemeanor at baseline to a Class E felony for $25,000 or more within 30 days, and a Class C felony carrying 5 to 15 years imprisonment for $1 million or more in a year; 18 other states and the federal system already criminalize unlicensed crypto activity
- The bill is a direct counter to the Trump administration’s April 2025 decision to pull back federal crypto enforcement, with Bragg positioning state prosecution as the necessary backstop where federal action has retreated
The announcement from the Manhattan DA’s office frames the legislation as a correction to the gap between New York’s existing BitLicense framework, which requires registration for crypto businesses, and the complete absence of criminal consequence for ignoring that requirement. Bragg told an audience at New York Law School that the crypto space needs accountability “on steroids.” Currently, unlicensed crypto operators in New York face only civil penalties. The CRYPTO Act would change that structure entirely, aligning the state with the majority of US jurisdictions that already criminalize the same conduct.
Any unlicensed virtual currency operation begins as a Class A misdemeanor. The charge escalates to a Class E felony once a business moves $25,000 or more within 30 days, or $250,000 or more in a year. A Class C felony, the top tier, applies to $1 million or more in a year and carries a maximum of 5 to 15 years in prison. Bragg made the stakes explicit: “Crypto is the go-to means for bad actors to move and hide the proceeds of crime. It is long past time for businesses that operate without a virtual currency license and flout due diligence requirements to face criminal penalties.”
Why New York Is Moving While Washington Steps Back
The Trump DOJ disbanded its National Cryptocurrency Enforcement Team in April 2025, directing federal prosecutors to focus on terrorism and drug cases rather than unlicensed money transmission or exchange level violations. Six Democratic senators have since challenged that decision as a conflict of interest. New York is moving in the opposite direction at the state level, asserting that the federal retreat has created a gap that state prosecutors must now fill using criminal law rather than civil penalties alone.
What the Bill Still Needs to Become Law
As crypto.news has reported, the federal regulatory framework for crypto is being built out under GENIUS Act implementation, with the FDIC, OCC, and Treasury each advancing separate rulemaking processes that apply only to licensed entities. As crypto.news has noted, the GENIUS Act’s compliance architecture leaves unlicensed operators in a regulatory blind spot, precisely the gap the CRYPTO Act targets through state criminal law. The bill still requires passage through the New York State legislature, and a legislative timeline has not been announced.

CAEX, a crypto platform tied to the Vietnam Prosperity Joint Stock Commercial Bank (VPBank) ecosystem, has secured strategic backing from OKX Ventures and HashKey as it pursues participation in Vietnam’s pilot regime for crypto exchanges. The announcement positions CAEX to join VPBank Securities (VPBankS) and technology partner LynkiD as shareholders and aims to help the firm meet Vietnam’s minimum charter capital threshold of 10 trillion dong (about $380 million), a prerequisite for entering the pilot program.
According to a release shared with Cointelegraph, OKX Ventures and HashKey will supplement existing shareholders as CAEX eyes the regulatory milestone necessary to qualify for the five-year pilot, which is designed to tightly regulate digital asset activity while expanding the legitimate onshore market.
Key takeaways
- Vietnam’s five-year crypto pilot will license only a small number of exchanges; the window for licensing opened on January 20, with a cap of five licensed operators.
- The regulatory framework imposes a foreign ownership limit of 49% and requires at least 65% of capital to be held by institutional shareholders, creating substantial entry barriers for new players, even those backed by banks.
- CAEX’s new backing from OKX Ventures and HashKey aims to reach the 10 trillion dong charter capital, a core condition to participate in the pilot.
- OKX described its role as strategic, focusing on ensuring CAEX has the financial strength and technical capabilities to meet both user expectations and regulatory standards, while keeping details of investment undisclosed.
- Vietnam’s crypto market has surged in adoption, but regulators have tightened oversight amid fraud probes and external pressure to curb unlicensed offshore platforms.
Backing with capital to clear regulatory hurdles
CAEX’s funding arrangement signals a concerted push to clear a central gating factor for the pilot: charter capital. The company has been working to raise the mandated 10 trillion dong threshold, a measure designed to ensure onshore exchanges have robust financial firepower before serving Vietnamese users. OKX, as a strategic partner, indicated that the investment will be deployed to bolster CAEX’s ability to meet both the capital and capability requirements, including areas such as technical infrastructure, security, compliance, and risk management. The spokesperson noted that the size of the investment and the exact stake in CAEX could not be disclosed, and declined to comment on whether the funding confirms selection in the pilot, emphasizing that the process remains regulated and ongoing.
CAEX’s ties to VPBank place the platform within a broader financial ecosystem that the bank envisions expanding into the digital asset space. VPBank has previously signaled a push to bring crypto activity into a regulated framework, with CAEX in the foreground as a potential onshore operator. In recent months, CAEX has been in talks about a charter capital increase to reach the pilot’s capital requirements, a move aligned with VPBank’s broader ambitions in digital asset services. OKX’s role as a strategic partner underscores the emphasis on building a compliant, institution-grade platform capable of meeting the high standards expected in a regulated market.
Regulatory backdrop: Vietnam’s pilot and its strict guardrails
Vietnam’s financial authorities are moving forward with a five-year crypto pilot that aims to balance innovation with consumer protection and financial stability. The pilot will permit a limited number of licensed digital asset service providers to operate exchanges onshore. Officials have underscored that only up to five enterprises will be licensed to run exchanges as part of the program, which opened its licensing window in late January. In addition to the cap on participants, the framework imposes foreign ownership limits of 49% and requires institutional investors to hold at least 65% of each licensed entity’s capital, creating steep thresholds for new entrants—even those aligned with established banks or financial groups.
Authorities have also signaled stricter controls could extend to overseas platforms. Once the first onshore exchanges are operational, the regime may block access to unlicensed overseas exchanges, a move that heightens the stakes for foreign firms seeking a regulated route into Vietnam’s market. The regulatory posture reflects a broader pattern in Asia where regulators are tightening oversight of digital assets while encouraging qualified participants to operate under a formal framework.
Market momentum, risk, and the practical implications for CAEX
Vietnam has emerged as a notable hub of crypto activity, with adoption growth placing the country among the top markets in global rankings. Chainalysis ranked Vietnam fourth in global crypto adoption in 2025, underscoring the potential for a regulated, onshore market to attract user participation and institutional interest. The regulatory move toward a structured pilot aligns with a desire to curb fraud and protect investors, particularly after a period of high-profile scams and investigations within the sector.
Recent enforcement activity in Vietnam has illustrated the risk environment for crypto ventures. In March 2026, authorities detained multiple suspects connected to the ONUS project amid allegations of false promotions and manipulation that allegedly misappropriated billions of dollars of investor funds. While these actions are not specific to CAEX, they underscore the atmosphere in which Vietnam’s regulators are pushing for tighter oversight and greater transparency in digital asset platforms. CAEX’s leadership notes that a regulated framework is a constructive step for the country’s crypto industry, particularly as it seeks to foster innovation within clear compliance boundaries.
For investors and builders, the key takeaway is that entering Vietnam’s onshore market will increasingly depend on meeting rigorous capital and governance standards. CAEX’s collaboration with OKX Ventures and HashKey signals an intent to combine deep liquidity, technical expertise, and robust risk controls with a bank-tied ecosystem to pursue a compliant market entry. The interplay between capital adequacy, regulatory compliance, and strategic partnerships will likely shape which entities ultimately win licenses and how they scale within Vietnam’s five-year plan.
What comes next for CAEX and Vietnam’s crypto sector
If CAEX meets the charter capital threshold and secures a license under the pilot, the company could become one of the few onshore platforms to offer digital asset trading under Vietnam’s regulated framework. The involved parties—CAEX, VPBankS, LynkiD, and strategic backers like OKX and HashKey—will need to navigate ongoing regulatory reviews, capital deployment milestones, and the evolving requirements of supervision authorities.
Beyond CAEX, observers will be watching how other players respond to the regulator’s thresholds, including foreign-backed ventures seeking a foothold in Vietnam’s onshore market. The emphasis on capital strength, institutional ownership, and rigorous governance suggests that the pilot will favor operators with substantial financial and compliance capabilities, potentially skewing the competitive landscape toward bank-affiliated and well-capitalized firms.
As Vietnam charts a cautious path toward crypto innovation, what remains uncertain is the precise timeline for final licensing decisions and how the pilot will evolve over the ensuing years. Regulators may refine capital requirements, adjust ownership caps, or expand the pool of eligible service providers as the ecosystem matures. For CAEX, the immediate milestone is clear: secure the requisite capital and complete the regulatory steps to enter Vietnam’s carefully calibrated onshore regime.
Observers should keep an eye on the regulatory timetable, the outcomes of CAEX’s capital-raise efforts, and any further disclosures from the participating banks and strategic partners about their roles in developing a compliant, scalable crypto exchange in Vietnam.
Vietnam’s dynamic market remains a focal point for crypto innovation in Southeast Asia. With authorities signaling a pragmatic approach to regulation and industry players aligning capital, technology, and governance, the coming months will be critical in determining which platforms emerge as credible, licensed onshore options for Vietnamese users and global participants alike.
As always, readers should monitor regulatory developments, licensing announcements, and the evolving stance of both domestic and international players seeking a legitimate foothold in Vietnam’s regulated crypto landscape.


OKX Ventures and HashKey Capital are backing a new Vietnam-based crypto exchange as Hanoi accelerates efforts to bring one of the world’s most active retail crypto markets under formal regulation.
Vietnam Prosperity Crypto Asset Exchange (CAEX) said Friday that the two firms have agreed to invest and become strategic partners alongside founding shareholders VPBank Securities and digital-identity firm LynkiD.
The funding will bring CAEX’s capital base to VND 10 trillion — roughly $380 million — the minimum needed to enter a government pilot program for regulated crypto trading under Resolution 05/2025.
The deal lands as Vietnam’s Digital Technology Industry Law, which took effect in January, formally recognized crypto assets and laid the legal groundwork for licensing, oversight, and industry incentives. Now regulators are pushing to shift activity onshore through a pilot program expected to grant licenses to a handful of domestic exchanges, part of a broader effort to restrict offshore trading and tighten control over capital flows.
That combination — legal recognition paired with controlled market access — has triggered a race among local financial institutions and global crypto firms to lock in early positioning. Vietnamese users moved an estimated $200 billion in digital assets in the year through mid-2025, placing the country among the top crypto-adoption markets globally.
Under the partnership, OKX Ventures and HashKey will work with CAEX on infrastructure, security, compliance, and liquidity. The exchange sits within the VPBank ecosystem, drawing on VPBankS for financial backing and governance and LynkiD for core technology and digital identity.
Vietnam was added to the Financial Action Task Force grey list in 2023 for weak anti-money laundering controls, particularly regarding virtual assets. That designation has been a major motivator behind the regulatory push.
The new framework requires crypto firms to obtain licenses, verify user identities, monitor transactions and file reports — measures designed to bring Vietnam closer to global compliance standards.
For Hanoi, the bet is that a regulated crypto market can help repair the country’s financial reputation. For OKX and HashKey, the calculus is simpler: get in early, meet the compliance bar, and grow with the market while the rules are still being written..


The DOJ crypto conflict reached a formal accusation this week when six Democratic senators told Deputy Attorney General Todd Blanche he had a “glaring conflict of interest” after ProPublica reported he held between $158,000 and $470,000 in Bitcoin, Ethereum, and Solana when he issued the memo disbanding the National Cryptocurrency Enforcement Team.
Summary
- Blanche signed an ethics agreement in February 2025 promising to divest within 90 days and not to participate in matters affecting his digital asset interests, then issued the enforcement rollback memo in April 2025 before divesting, during which window his Bitcoin holdings alone appreciated 34 percent
- When Blanche eventually divested, he transferred holdings to his adult children and a grandchild rather than liquidating them outright, a move ethics experts told ProPublica is technically legal but against the spirit of conflict of interest law
- Senators Warren, Hirono, Durbin, Whitehouse, Coons, and Blumenthal set a February 11 deadline for Blanche to produce all communications with ethics officials and the crypto industry around the time of the memo; the Campaign Legal Center simultaneously filed a complaint with the DOJ Inspector General
ProPublica’s investigation documents that Blanche’s memo, titled Ending Regulation by Prosecution, disbanded the NCET, halted Biden-era investigations into crypto companies, and directed the DOJ to assist Trump’s crypto working group. The memo benefited the crypto industry broadly, including Blanche’s own portfolio. A DOJ spokesperson told ProPublica the actions were “appropriately flagged, addressed and cleared in advance,” without specifying who cleared them or how. The senators wrote directly to Blanche: “At the very least, you had a glaring conflict of interest and should have recused yourself.”
The NCET was established in 2022 and led the Binance investigation that resulted in a $4.3 billion settlement. Blanche’s memo disbanded it entirely and directed the Market Integrity and Major Frauds Unit to cease cryptocurrency enforcement in order to focus on other priorities including immigration and procurement fraud. Going forward, the DOJ would only pursue crypto cases involving terrorism, narcotics, human trafficking, hacking, and cartel financing. The senators cited a January 2026 Chainalysis report showing illicit crypto activity surged 162 percent the prior year, arguing their predictions about the consequences of the rollback had proven correct.
The Divestiture Problem
When Blanche transferred his crypto holdings to family members rather than selling them outright, ethics experts told ProPublica this approach was at odds with the spirit of the law. The Campaign Legal Center argued the transfers did not eliminate his potential financial interest because his family retained the appreciated assets. ProPublica calculated his Bitcoin holdings rose 34 percent between the date of the memo and the date he divested, a gain that reached approximately $105,000 on that position alone.
What the Senators Demanded and What Comes Next
As crypto.news has reported, the DOJ conflict question has become a live variable inside CLARITY Act negotiations, where Democratic senators are pushing for ethics language barring government officials from profiting from crypto. As crypto.news has noted, the federal regulatory framework is being rebuilt through financial regulators rather than criminal enforcement, a structural shift Blanche’s memo accelerated. The Inspector General complaint filed by the Campaign Legal Center remains open, and the DOJ has not responded publicly to the senators’ demand for documentation.
“Death of a Salesman” review: The timely Broadway revival feels as urgent as ever

Trump boasts over his new renovation project at the Lincoln Memorial reflecting pool: ‘It will be much more beautiful’

Augusta National still can’t buy this family’s home


-

 Fashion6 days ago
Weekend Open Thread: Spanx – Corporette.com
-

 Business4 days ago
Three Gulf funds agree to back Paramount’s $81 billion takeover of Warner, WSJ reports
-

 Sports5 days ago
India men’s 4x400m and mixed 4x100m relay teams register big progress | Other Sports News
-

 Business6 days ago
Expert Picks for Every Need
-

 Tech2 days ago
How Long Can You Drive With Expired Registration? What Florida Law Says
-

 Business5 days ago
No Jackpot Winner, Prize to Climb to $231 Million
-

 Fashion4 days ago
Massimo Dutti Offers Inspiration for Your Summer Mood Board
-

 Fashion2 days ago
Let’s Discuss: DEI in 2026
-
Politics7 days ago
Wings Over Scotland | The quality of mercy
-

 Crypto World2 days ago
Bitcoin recovers as US and Iran Agree a Ceasefire Deal
-

 Business5 days ago
Akebia Therapeutics, Inc. (AKBA) Discusses Pipeline Progress and Strategic Focus on Kidney Disease Treatments at R&D Day – Slideshow
-

 Politics7 days ago
Why so many children are now classified as ‘disabled’
-

 Crypto World16 hours ago
Canary Capital Files SEC Registration for PEPE ETF
-

 Politics6 days ago
The UK should not pay a penny in slavery reparations
-

 Tech4 days ago
Haier is betting big that your next TV purchase will be one of these
-

 Tech7 days ago
The Threadless Ball Screw Never Took Off, But Don’t Write It Off
-

 Business7 days ago
HPS FY 2025 slides: SaaS inflection drives 22% revenue growth
-

 Fashion7 days ago
Tory Burch’s Spring 2026 Campaign Goes on a Getaway
-

 Fashion7 days ago
Frugal Friday’s Workwear Report: Hammered Metallic Button Sweater Vest
-

 Fashion6 days ago
Weekly News Update, 4.3.26 – Corporette.com
You must be logged in to post a comment Login