
Crypto World
Solana price risks drop to $52 as it enters consolidation trap below key SMA

Solana price has rebounded back above $85 on Friday morning, retracing back some of its losses following Wednesday’s rally. However, it still remains below a key SMA level that puts it at risk of moving to its next leg lower over the coming sessions.
Summary
- Solana price rebounds above $85 but remains below the key 50-day SMA, keeping downside risk intact.
- Repeating a three-step pattern signals consolidation phase may precede another sell-off.
- Failure to reclaim the $86 level could trigger a sharp decline toward $52.
According to data from crypto.news, Solana (SOL) price rose 4.5% to an intraday high of $85.2 before stabilizing around $83 at the time of writing. The rebound following a market-wide recovery as Bitcoin moved above $73,000 helped the altcoin to backpedal on some of its losses experienced since dropping from its Wednesday high.
Despite the token’s recent rebound, it remains at risk of a more downside in the coming weeks, as it has failed to reclaim a key SMA level, failure of which has historically led to strong downsides.
The daily chart shows that Solana price has been trading within the $76 to $92 range since February this year. The token recently moved into the lower end of this range in the past two weeks.
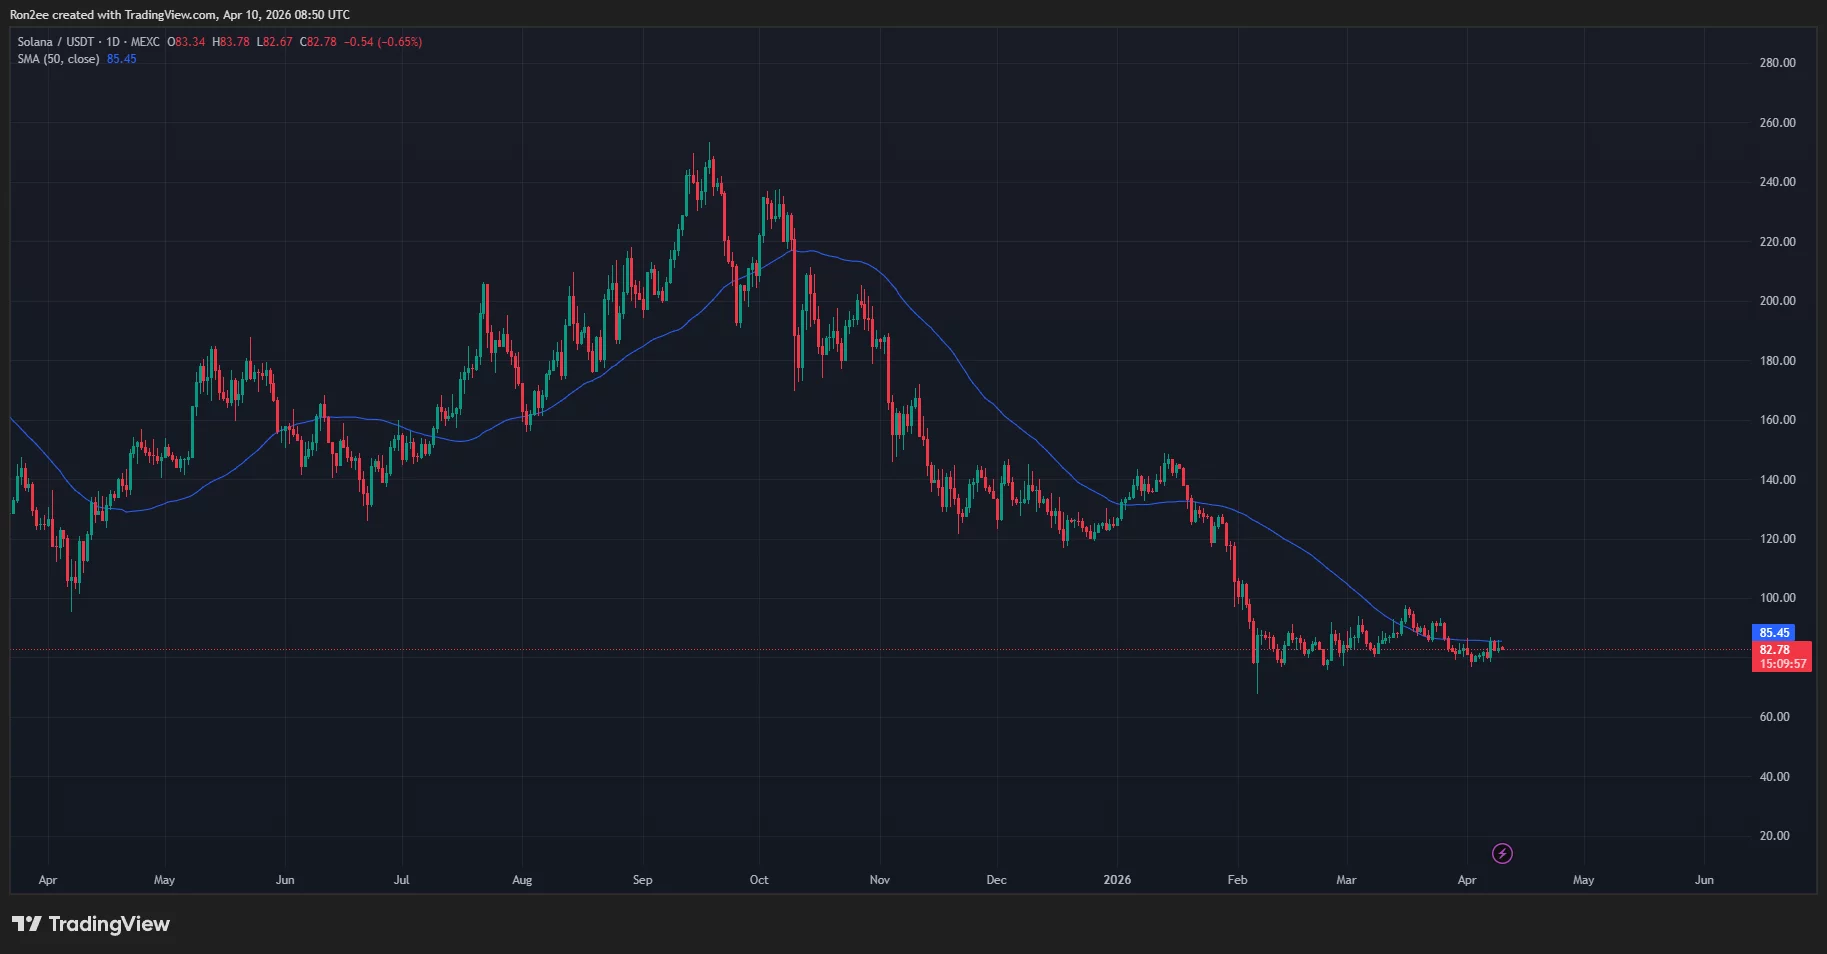
In doing so, Solana price has fallen below the 50-day SMA, which has historically been followed by significant bearish pressure since October 2023.
Notably, Solana price movement has been repeating a three-step cycle every time it prepares to transition to its next leg lower in the past six months.
The said pattern begins when Solana price reclaims the 50-day SMA, which is then followed by a rapid fall back below the indicator while losing the support of previous highs. Following this, the token enters into a consolidation trap, a period when the token moves sideways within a tight range before its final breakdown towards its next leg down begins.
As derived from the daily chart above, Solana price previously formed this pattern in November last year and again at the beginning of January this year, each time it fell below the 50-day SMA and subsequently entered a consolidation phase for weeks. Following this, it faced a strong sell-off, finally settling lower and forming a new local bottom.
In the most recent instance, Solana price moved above the key resistance in mid-March when it surged all the way to $97. The token has since been on a downtrend, making lower lows and lower highs in the process. Moving on to the last couple of days, the token has been stuck in its consolidation phase in the second step of the current cycle as it hovers between $79 and $81, and rests below the 50-day SMA around the $86 mark.
Assuming that the pattern holds, the ongoing sideways movement should not be interpreted as a sign of stabilization but as the token coiling before initiating its next leg down.
As such, if Solana fails to reclaim the $86 50 day SMA level in the coming sessions, it risks a rapid decline towards $52, a level calculated by subtracting the average percentage drop observed during previous cycles from the current consolidation peak.
Disclosure: This article does not represent investment advice. The content and materials featured on this page are for educational purposes only.

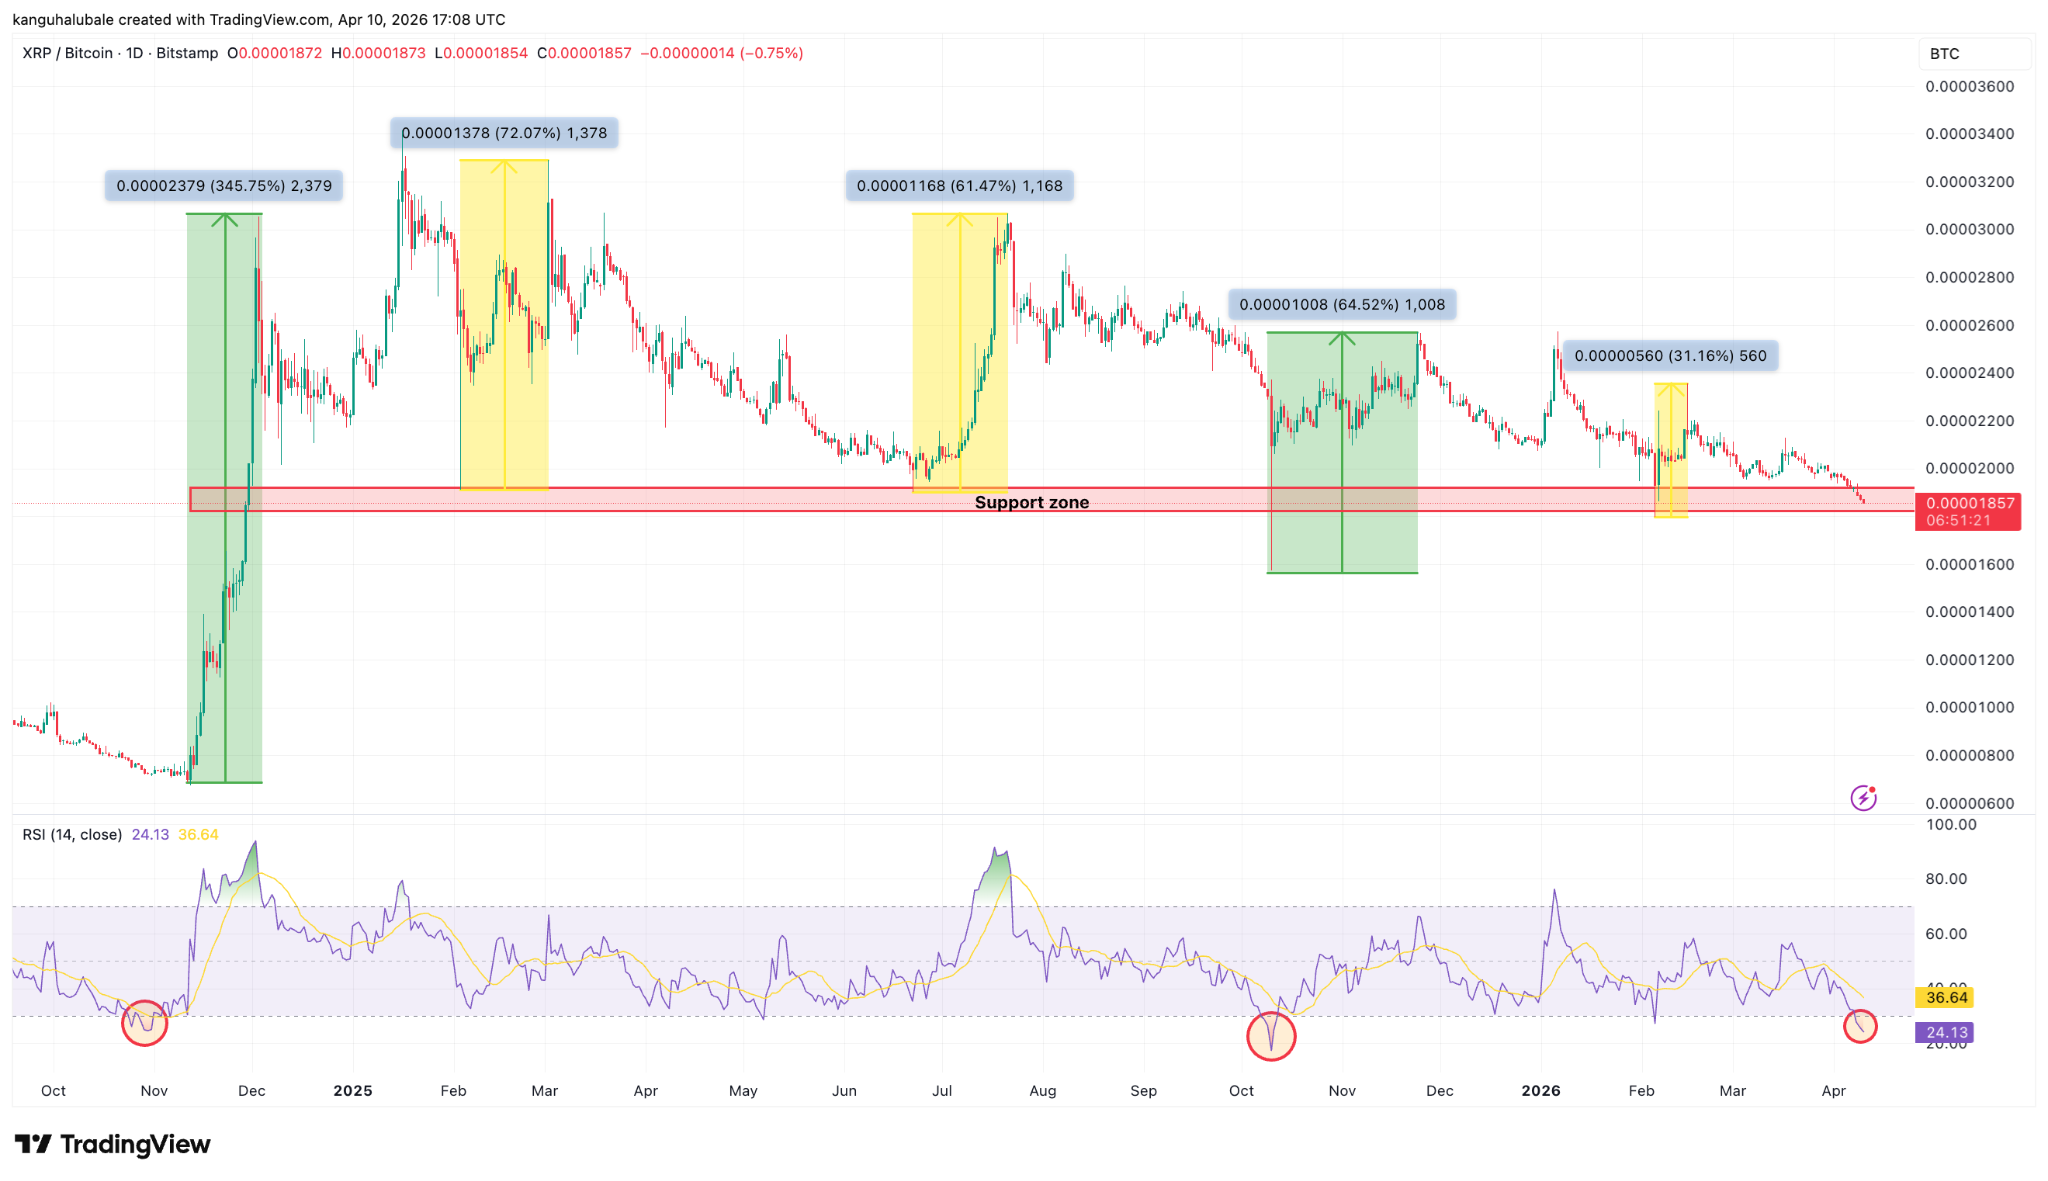
XRP (XRP) has been in an eight-month downtrend, with momentum and onchain indicators at levels that previously coincided with macro bottoms.
Data from TradingView reveals that the relative strength index (RSI) of the XRP/BTC ratio is at 24, the most oversold level since October 2025.
Such low levels in the daily RSI have marked market bottoms for the ratio, ultimately leading to 65% to 345% XRP price breakouts against Bitcoin as seen late 2024 and 2025.

The chart above also shows that the XRP/BTC pair is trading within a long consolidation range, which has previously acted as a strong launching pad for the ratio.
The last time XRP bottomed against Bitcoin around this zone was in June 2025. It marked the beginning of a 61% increase in the XRP/BTC ratio, accompanying a 92% XRP price rally to a multi-year high of $3.66.
Other instances shown by the yellow bars in the chart reinforce the reliability of this level in marking macro bottoms for XRP/BTC.
MVRV Z-Score suggests XRP price is bottoming
XRP’s MVRV Z-score is hovering near zero, a level that historically aligns with accumulation zones and market bottoms.
This indicates that most holders are close to breakeven, reducing sell pressure and signalling potential downside exhaustion. Similar patterns appeared in 2021, 2022 and 2024 before major rallies.

Note that the last time XRP’s MVRV Z-score fell to similar levels in late 2024 coincided with a macro market bottom at $0.30 and preceded a multi-month rally, with the XRP/USD pair rising 500% to a multi-year high above $3.
Meanwhile, the 0.80 MVRV pricing band, which has historically marked cycle bottoms, is currently at $1.14, coinciding with a 15-month low reached on Feb. 6.

These onchain metrics suggest that XRP is undervalued and may continue the ongoing recovery, potentially rising toward $1.70 or higher.
XRP price must hold above $1.30
Meanwhile, XRP/USD remains cautiously bullish as long as it holds the $1.25-$1.30 support zone.
“$XRP is sustaining the major support zone between $1.30-$1.25 levels since early Feb’26,” trader ChiefraT said in an X post on Friday, adding:
“If this zone continues to hold, then a short-term bounce towards $1.45 can’t be ruled out.”

The importance of this support level is reinforced by cost basis distribution. The heatmap below shows that nearly 1.73 billion XRP were acquired around this price.

Below that, the next line of defence is the $1.15 demand zone, where the 200-week simple moving average is.
If XRP/USD drops below this level, it would be in a free-fall toward the measured target of the bear flag at $0.80, or 41% below the current price.
As Cointelegraph reported, holding $1.27-$1.30 would be a sign of strength among the bulls who must push the XRP/USD pair toward the $1.61 range high to regain control.
This article is produced in accordance with Cointelegraph’s Editorial Policy and is intended for informational purposes only. It does not constitute investment advice or recommendations. All investments and trades carry risk; readers are encouraged to conduct independent research before making any decisions. Cointelegraph makes no guarantees regarding the accuracy or completeness of the information presented, including forward-looking statements, and will not be liable for any loss or damage arising from reliance on this content.
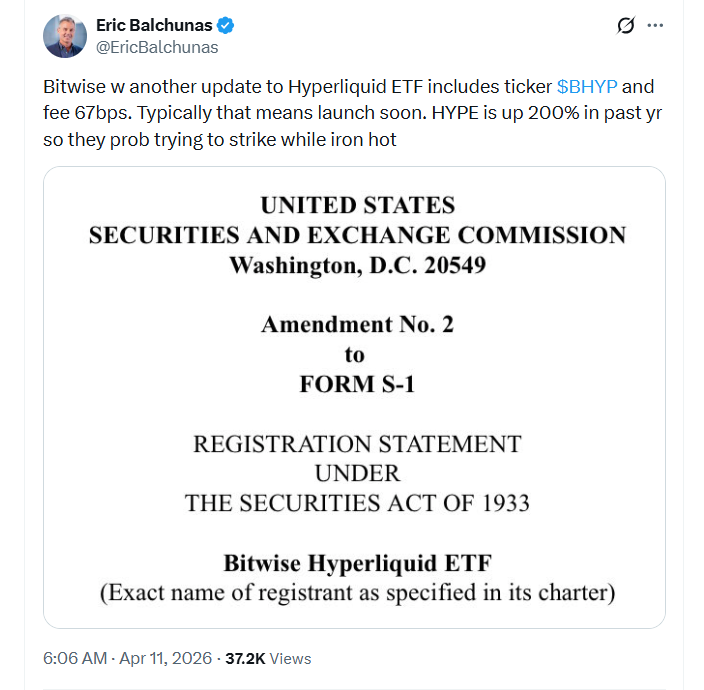
Bitwise Asset Management has reportedly taken a key step toward launching its proposed spot Hyperliquid exchange-traded fund, filing a second amendment with the US Securities and Exchange Commission.
In an X post on Friday, Bloomberg senior ETF analyst Eric Balchunas highlighted that Bitwise had updated its Hyperliquid ETF to include the ticker $BHYP and had also set a management fee of 0.67% (67 basis points).
According to Balchunas, the filing of these details generally indicates that the product will “launch soon.”
“HYPE is up 200% in the past year,” he said, adding that the firm was likely “trying to strike” while the iron was “hot.”
The filing comes amid competition from other asset managers vying to launch the first spot ETF tied to the crypto perpetual futures protocol and blockchain, with Grayscale and 21Shares also pushing for similar products of their own.
Bitwise was the first of the three to submit a Hyperliquid ETF filing with the SEC in September. 21Shares followed a month later with its own, while Grayscale submitted its filing in late March.

If approved, Bitwise’s ETF will trade on the NYSE Arca stock exchange and offer investors exposure to the spot price of Hyperliquid.
In the firm’s first filing amendment from December, Bitwise also indicated that the fund would seek to generate additional returns from HYPE staking — something Grayscale and 21Shares haven’t explicitly indicated their funds would do.
Hyperliquid continues to gain traction
According to data from CoinGecko, the price of HYPE is up 65% since the start of 2026 to around $41.96 at the time of writing, despite a tough start to the year for the broader crypto market. Over 12 months, the price of HYPE is also up about 182%.
Related: BlackRock Bitcoin ETF sees $269M inflows, best day since early March
Alongside a strong token performance, blockchain analytics platform CoinGlass reported in early April that Hyperliquid had broken into the top 10 crypto derivatives platforms by volume, joining the likes of Binance, OKX and Bybit.
During Q1, Hyperliquid generated $492.7 billion in trading volume, putting it shy of ninth-placed Coinbase by about $90 billion.
Magazine: Should users be allowed to bet on war and death in prediction markets?

TLDR:
- Aave Labs secured SOC 2 Type II for security, availability, and confidentiality controls across software operations.
- The audit tested whether Aave’s controls worked consistently over time, not only at one review date.
- The milestone supports Aave’s institutional DeFi push through stronger governance and risk frameworks.
- Aave said the same compliance standards now extend across Pro, Kit, App, and future software products.
Aave Labs has secured SOC 2 Type II attestation, marking a notable compliance milestone for one of DeFi’s largest software contributors. The certification covers security, availability, and confidentiality controls across the company’s software development and operations.
The update arrives as Aave expands deeper into institutional and enterprise-focused DeFi infrastructure. Besides, the move places operational discipline at the center of the protocol’s next growth phase.
Aave SOC 2 Type II Sengthens DeFi Security Standards
The attestation covers the Trust Services Criteria defined by the AICPA. It focuses on whether internal controls worked effectively over time.
Unlike a point-in-time review, Type II testing measures performance across a defined audit window. That gives partners clearer visibility into process consistency.
According to Aave’s official announcement, the audit reviewed development workflows, software safeguards, and information handling practices. The scope also included operational methodologies tied to software releases.
The result confirms that Aave Labs applies standardized controls across the software it contributes to the Aave Protocol. That includes products such as Aave Pro, Aave Kit, and Aave App.
For institutional DeFi users, this matters because compliance standards increasingly shape counterparty decisions. Security controls now carry similar weight to protocol design.
Aave Institutional Strategy Expands Through Compliance and Risk Controls
The timing aligns with Aave’s broader enterprise roadmap. The company has increasingly linked product growth to governance, risk, and market architecture.
Its announcement directly connected the attestation to initiatives like Aave Horizon. That product direction targets institutional and regulated market use cases.
Aave also framed the milestone around operational resilience and confidentiality. Those areas remain central for institutions evaluating DeFi integrations.
The company noted that maintaining SOC 2 Type II requires continuous control testing. That means the process extends beyond a one-time audit achievement.
By embedding those controls into software shipping cycles, Aave positions its infrastructure for larger counterparties. The emphasis stays on repeatable internal standards.
The update also reflects a wider shift in crypto infrastructure. More DeFi platforms now prioritize enterprise-grade software assurance alongside transparent governance.
For Aave, the certification formalizes internal practices already tied to product delivery. It also strengthens the protocol’s credibility with risk-aware finance participants.


The U.S. Commodity Futures Trading Commission has unveiled the first roster of members for its Innovation Task Force, part of a broader effort to bring clearer rules to the crypto market. Spearheaded by Michael Passalacqua, the CFTC’s senior advisor to Chairman Mike Selig, the initiative aims to provide greater clarity for American developers and investors navigating digital assets.
In an announcement on Friday, the agency named five initial members who will join Passalacqua: Hank Balaban, formerly a crypto-focused attorney at Latham & Watkins; Sam Canavos, an ex-Patomak advisor with crypto and prediction markets experience; Mark Fajfar, a longtime CFTC legal veteran; Eugene Gonzalez IV, who previously practiced cryptocurrency law at Sidley Austin; and Dina Moussa, a Market Participants Division special counsel at the CFTC. Chairman Selig praised the lineup, saying the group combines deep legal expertise with a shared commitment to delivering clear “rules of the road” for U.S. innovators.
The expansion of the Innovation Task Force fits a broader push by U.S. regulators to provide regulatory clarity for the digital asset sector, a project outlined under the direction of the Trump administration. The CFTC’s move comes alongside parallel efforts at the Securities and Exchange Commission to define regulatory boundaries for crypto assets.
Key takeaways
- The CFTC has formalized its Innovation Task Force with a first five-member roster led by Michael Passalacqua, signaling a structured approach to crypto governance.
- The new task force is part of the agency’s effort to deliver clear rules of the road for American innovators and to reduce ambiguity around crypto markets.
- The CFTC has also launched an “innovation tracker” to map ongoing work across crypto, artificial intelligence and autonomous systems, and contracts and prediction markets.
- Regulatory clarity remains entangled with the broader political debate, including questions about the CLARITY Act and how the CFTC and SEC divide jurisdiction over digital assets.
A new lineup for regulatory clarity
The initial members bring a blend of legal and regulatory experience tailored to crypto markets. Balaban’s background at a major law firm and Gonzalez IV’s Sidley Austin credentials anchor a practice familiar with crypto law. Canavos’s policy-oriented experience at Patomak and Fajfar’s long tenure within the CFTC provide institutional continuity, while Moussa’s role in the Market Participants Division emphasizes practical, participant-focused considerations. Together with Passalacqua, the group is positioned to translate evolving technology and market developments into more predictable oversight parameters.
“The Innovation Task Force brings together a leading team that exhibits deep expertise and an enthusiastic commitment to deliver clear rules of the road for American innovators,” Selig said in the announcement. The wording underscores the regulator’s intent to move beyond static guidance toward actionable policy that market participants can rely on as the crypto ecosystem evolves.
Innovation tracker and three focus areas
Alongside naming the task force, the CFTC introduced an innovation tracker intended to document the agency’s ongoing efforts to modernize regulation in three priority areas: crypto and blockchain, artificial intelligence and autonomous systems, and contracts and prediction markets. The tracker signals where policymakers believe clarity is most urgently needed and where technological progress intersects with market integrity.
The move occurs amid a broader regulatory dialogue about how U.S. authorities will handle crypto assets, particularly in relation to securities laws and futures framework. The CFTC’s emphasis on “clarity” aligns with a broader push by federal agencies to set clearer boundaries for who regulates what in the digital-asset space, a shift that could influence market structure, product design, and compliance costs for firms building in this space.
Regulatory landscape and the CLARITY Act
Another layer shaping the next steps is the debate over the CLARITY Act, a legislative proposal that some policymakers advocate as a way to codify regulatory jurisdiction for crypto. SEC Chair Paul Atkins has publicly urged Congress to pass the act to establish a durable framework that can accommodate rapid innovation while protecting investors. In parallel, the SEC has signaled that it does not see most crypto assets as securities, a position that would naturally concentrate regulatory authority with the CFTC for many tokenized products if the law changes or is clarified in law.
While both agencies have indicated readiness to implement a clearer framework, the ultimate outcome remains tied to Congressional action and how the CLARITY Act is translated into enforceable policy. For market participants, the tension between the CFTC’s emphasis on spot markets, risk controls, and market infrastructure, and the SEC’s security-centric view, could shape product design, listing decisions, and compliance programs in the near term.
Investors and builders should watch how the Innovation Task Force’s work translates into concrete guidance, potential safe harbors, or pilot programs that could lower uncertainty and speed legitimate innovation. The cross-agency dialogue and the push for legislative clarity may, if successful, unlock a more predictable regulatory environment that balances innovation with market integrity.
Source for the task force announcement: Michael Passalacqua, via a post on X, and the CFTC press release detailing the initial membership and the broader policy objective.
What happens next remains linked to congressional action and how the CLARITY Act is refined and enacted. In the meantime, market participants should monitor how the tracker’s focus areas evolve into practical rules, and which areas—if any—move from guidance toward formal rulemaking or enforcement priorities.


CAEX has secured major backing from OKX Ventures and HashKey Capital as it prepares to enter Vietnam’s strictly regulated digital asset market.
Summary
- CAEX secured fresh backing from OKX Ventures and HashKey Capital to help meet a 10 trillion dong capital requirement for Vietnam’s upcoming crypto exchange pilot.
- The Vietnamese government plans to limit the five-year pilot program to only five licensed entities while maintaining strict caps on foreign ownership and institutional capital.
According to an April 10 press release, the two firms are joining VPBank Securities and LynkiD as shareholders in the platform, which operates within the ecosystem of VPBank, one of the country’s largest private lenders.
This capital injection is designed to help CAEX meet a steep 10 trillion dong (approximately $380 million) charter capital requirement. Reaching this financial threshold is a prerequisite for any firm hoping to secure one of the few licenses available under the government’s new pilot program.
CAEX will use the new investment from OKX Ventures and HashKey Capital to comply with the minimum charter capital requirement of 10 trillion dong that mandates all firms participating in the pilot program must maintain substantial financial reserves to operate legally in Vietnam.
The exchange has confirmed that it is now in the final stages of finalizing its 10 trillion dong capital base to meet the January pilot criteria.
“We believe the future of crypto will be built on regulated, local platforms that users can trust and CAEX represents that future in Vietnam,” OKX Founder and CEO Star Xu noted in a recent blog post regarding the partnership.
Vietnam’s Ministry of Finance and the State Securities Commission are currently rolling out a five-year testing phase for the industry. However, the window for entry is narrow. Only five companies will be permitted to operate exchanges during this period, with the licensing process having officially started on January 20.
The regulatory framework imposes significant restrictions on how these businesses are structured. Foreign investors cannot own more than 49% of an exchange, and at least 65% of the total capital must come from institutional shareholders. These high barriers are intended to ensure only well-capitalized, professional entities enter the space.
Beyond setting high entry costs, the government is signaling a crackdown on the informal market. Once the official onshore exchanges begin operations, authorities may block access to unlicensed international platforms. This policy shift makes a local partnership essential for foreign firms like OKX and HashKey to maintain a compliant presence in the country.
Growing adoption meets increased oversight
Chainalysis ranked Vietnam fourth globally for crypto adoption in 2025. However, the market has struggled with significant fraud.
In March 2026, police detained several individuals linked to the ONUS platform. Investigators allege the group used deceptive promotions and price manipulation to steal billions of dollars from investors.
By integrating with VPBank’s network, CAEX looks to position itself as a stable alternative to the offshore platforms that currently dominate the local landscape. The company confirmed it is now in the final stages of finalizing its 10 trillion dong capital base to meet the January pilot criteria.


The Japanese government passed an amendment to the Financial Instruments and Exchange Act on Friday, officially reclassifying crypto assets as financial instruments.
Summary
- The Japanese government officially reclassified cryptocurrency as a financial instrument on Friday through an amendment to the Financial Instruments and Exchange Act.
- New regulations reported by Nikkei now prohibit insider trading and require asset issuers to provide transparent financial disclosures once a year.
According to a report by Nikkei, the new legislation introduces a ban on insider trading and prohibits any buying or selling of digital assets based on non-public information.
Previously, the Financial Services Agency handled crypto under the Payment and Settlement Act, viewing it primarily as a tool for transactions. The pivot to the new legal framework comes as a direct response to a surge in institutional interest.
Under these updated rules, crypto “issuers” must adhere to higher transparency standards, including mandatory annual disclosures.
To support this transition, the Financial Services Agency has updated its oversight from the previous Payment and Settlement Act.
Cryptocurrency “issuers” are now required to maintain higher levels of transparency, including the mandate to disclose financial information at least once a year. The amendment also stiffens penalties, increasing both fines and potential prison sentences for exchanges that operate without a license.
“We will expand the supply of growth capital in response to changes in financial and capital markets, and ensure market fairness, transparency, and investor protection,” Finance Minister Satsuki Katayama said in an accompanying statement.
Beyond immediate regulations, the government is also overhauling the tax structure to encourage market participation. In December, officials backed a plan to drop the maximum tax rate on crypto profits in favor of a 20% flat rate.
This follows comments from Katayama earlier this year, suggesting that robust exchange infrastructure is essential for citizens to benefit from blockchain technology.
The long-term roadmap includes the legalization of crypto exchange-traded funds (ETFs) by 2028, as noted in a January report. Major financial players, such as Nomura Holdings and SBI Holdings, are already expected to lead the development of these crypto-linked products as the country prepares for broader mainstream adoption.


World Liberty Financial has dismissed market warnings regarding its borrowing activity on the lending platform Dolomite, labeling concerns over its debt health as “FUD.”
Summary
- On-chain data shows World Liberty Financial deposited 5 billion WLFI tokens on Dolomite to borrow $75 million in stablecoins shortly before a major U.S. foreign policy announcement.
- World Liberty Financial dismissed liquidation concerns as FUD.
On-chain data from Arkham reveals that a wallet belonging to the Trump family-backed project deposited approximately 5 billion WLFI tokens into the protocol to secure a $75 million loan in USDC and USD1 stablecoins.
Subsequently, the World Liberty wallet transferred over $40 million to Coinbase Prime just hours after Trump announced a U.S.-Iran ceasefire.
Dolomite was co-founded by Corey Caplan, an advisor to World Liberty; as such, the high concentration of WLFI on the platform has triggered intense scrutiny from DeFi analysts.
Currently, WLFI tokens represent $428.9 million of the $825.4 million in total assets supplied to Dolomite. This means the project’s native token now accounts for more than half of the protocol’s total liquidity, creating what researchers describe as a significant concentration risk.
DeFi analysts on X warned that if WLFI’s price hits liquidation levels, the lack of market depth could result in massive bad debt for the protocol’s other lenders.
“If that WLFI collateral position ever gets close to liquidation, it’s basically unliquidatable without major losses for lenders,” wrote analyst EthanDeFi.
He pointed to the token’s low liquidity relative to its $10 billion valuation, advising users to withdraw stablecoins from any pools that accept WLFI as collateral.
In a series of posts on Thursday, World Liberty countered that its presence as an “anchor borrower” actually helps the platform by providing higher yields for other participants.
The team maintained that they have ample resources to defend their position, noting they have repurchased 435 million tokens over the last six months to support the ecosystem.
“We are nowhere near liquidation — and frankly, even if markets moved dramatically against us, we’d simply supply more collateral,” the team stated.
“That’s not a risk. That’s how this works.”
Despite these assurances, WLFI’s price fell 5.6% to $0.86 as the controversy spread, bringing its total decline over the past week to 14%.
The project is now looking toward a governance vote scheduled for next week to address a long-awaited token unlock for early retail buyers. This plan will involve a structured, phased vesting schedule rather than an immediate release of all tokens.
The team remains firm that the protocol is designed for long-term growth rather than short-term speculation.
“The critics are looking at the wrong thing,” World Liberty added. “We’re building something that compounds.”


The global crypto market cap rose back above the $2.5 trillion figure as geopolitical and macroeconomic concerns led to the wipeout of over $250 million in short positions that fueled crypto price gains.
Summary
- Crypto market cap climbed back above $2.5T as over $250M in short positions were liquidated, driving price gains.
- Bitcoin touched $73K while ETF inflows rebounded, with $343M into BTC ETFs and $85M into ETH products.
- Ceasefire tensions and sticky U.S. inflation remain key risks that could trigger renewed volatility.
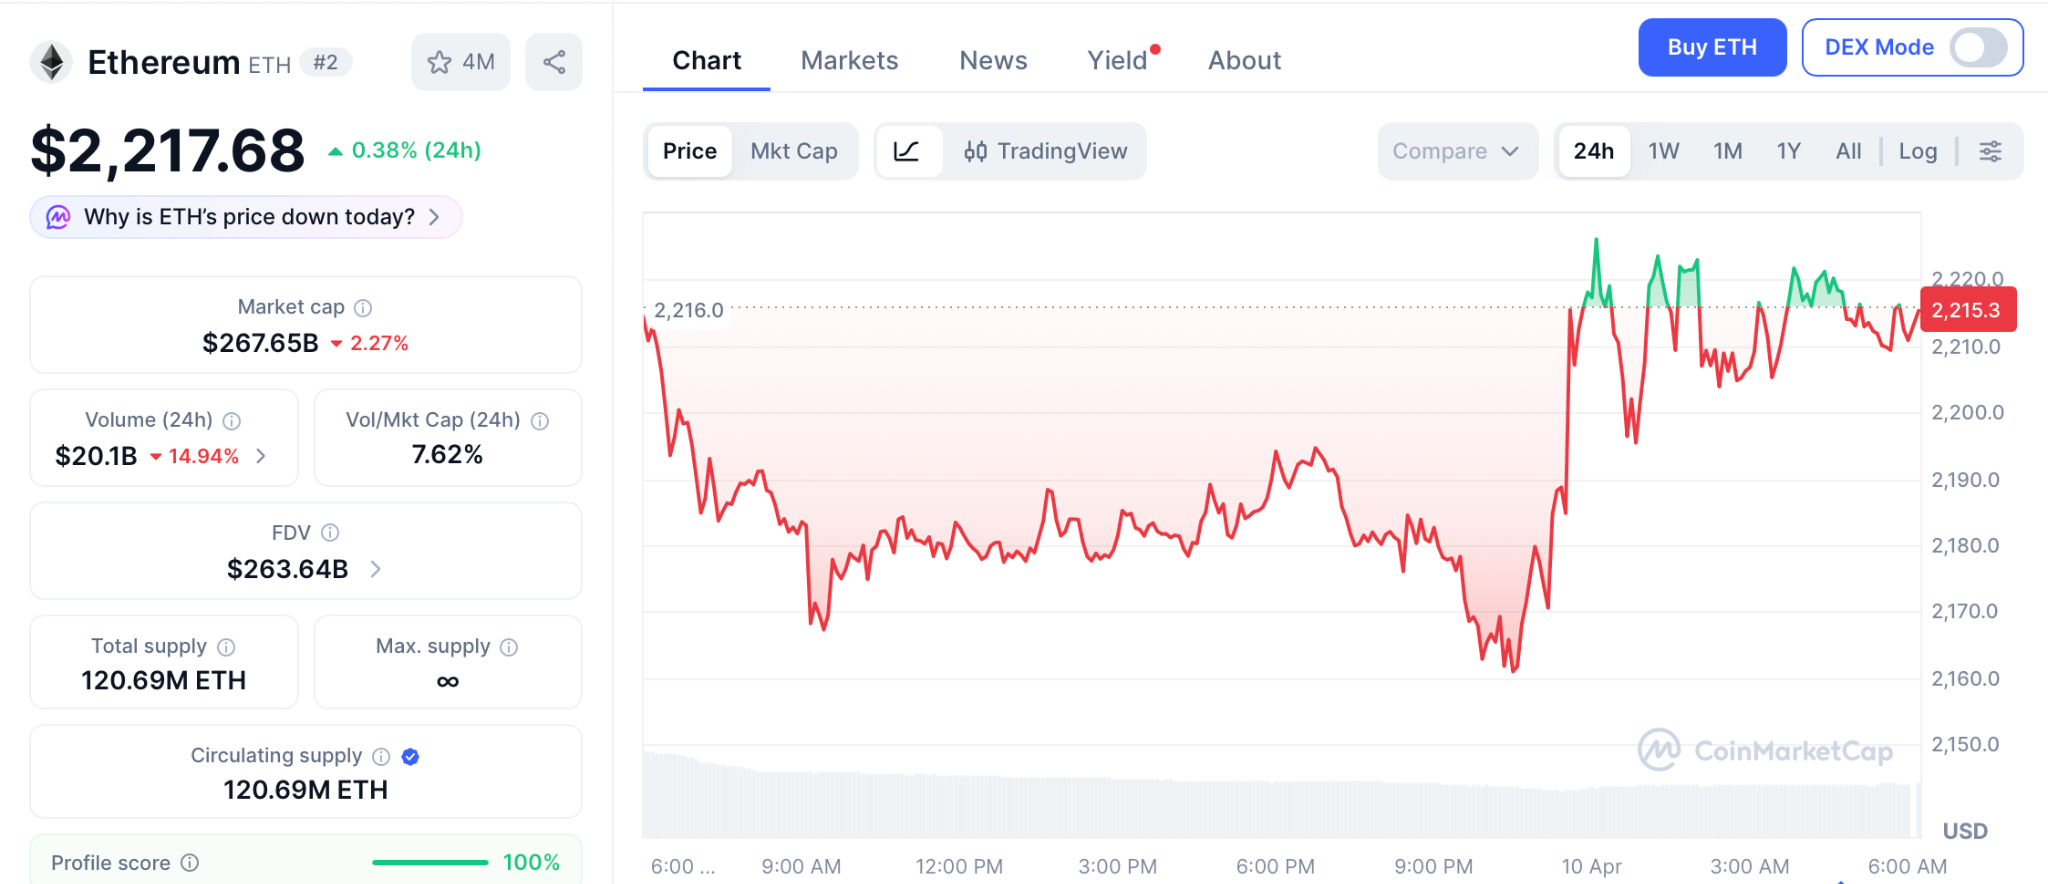
According to data from CoinGecko, the total market cap of all cryptocurrencies combined rose 1.4% to $2.52 trillion on Friday, April 10. Bitcoin (BTC) rose over 3% to touch the $73,000 mark before paring off with some of its gains and settling at $72,000 at the time of writing. Ethereum (ETH) surged past $2,200 while other top 10 major crypto assets were also seen in the green territory.
The market rally began in late U.S. hours yesterday after news broke out that Iran was looking into accepting Bitcoin for oil cargo ships crossing the Strait of Hormuz.
The sudden uptick in crypto prices caught short sellers off guard, who were then forced to buy back assets, fueling the crypto market rally. Data from CoinGlass shows that over $250 million of short positions were liquidated in the past 24 hours, in comparison to $95 million in long positions.
Crypto ETFs also played a significant part in supporting market gains. Data compiled by SoSoValue shows that spot Bitcoin ETFs drew in $343 million in net inflows on Thursday, while their Ethereum counterparts drew in $85 million. Both of these investment products had recorded outflows over the past two days.
The crypto market also appeared to share the positive sentiment from Asian tech stocks such as Japan’s Nikkei 225, which rose 1.8% over the past day, alongside the Hang Seng and Shanghai Composite, which also posted notable gains.
Investors also seem to be rotating capital from traditional safe-haven assets such as gold and silver, which have given up some of their gains over the past day. Gold and Silver fell by 1% each, trading at $4,750 and $75.5 each at press time.
However, there remains a key concern that could potentially derail crypto prices again.
First, the stability of the ceasefire remains quite shaky as Iran has so far failed to comply with the specific terms of the agreement, having still maintained a military presence in the Strait of Hormuz area. U.S. President Donald Trump has threatened the regime to uphold its side of the deal or face strikes with full force from the American military. Meanwhile, the Iranian government continues to maintain a defiant stance.
Such geopolitical tensions could likely continue to trigger volatility, especially if no clearer diplomatic resolution is reached to end the war.
Second, recent U.S. economic data have pointed out that inflation has continued to remain stickier than expected. Data from the U.S. Bureau of Economic Analysis showed that the core PCE index rose by 0.4% on Thursday.
This inflationary pressure might force the Federal Reserve to maintain a hawkish stance and hence delay interest rate cuts, which generally hurts risk assets, including cryptocurrencies, by keeping borrowing costs elevated.
Disclosure: This article does not represent investment advice. The content and materials featured on this page are for educational purposes only.


Binance co-founder Changpeng ‘CZ’ Zhao believes blockchain and cryptocurrency are on a path to becoming as common and unnoticed as the internet within the next five years.
Summary
- Binance co-founder Changpeng Zhao expects blockchain to become an invisible part of daily life by 2031 and compares its future integration to how the world uses the internet today.
- Zhao warns that nations failing to adopt blockchain and AI will face significant economic disadvantages.
Speaking on Scott Melker’s Wolf of All Streets podcast on Thursday, Zhao explained that the goal for the industry is to reach a stage where the underlying technology is no longer the main topic of conversation.
He compared the current phase of crypto to the early days of the web, suggesting that the technical jargon will eventually fade into the background.
“I’m hoping that we don’t talk about crypto as crypto in five years, just like we don’t talk about the internet anymore, we don’t talk about TCP/IP, we don’t talk about HTML, JavaScript, etc. We don’t talk about that stuff anymore. We just use it,” Zhao said.
The drive toward mainstream use is backed by recent data and industry forecasts. Figures from DemandSage show that global crypto users have reached an estimated 559 million in 2026.
Financial institutions are also preparing for this transition; a Citi survey from last September revealed that most banks and asset managers expect tokenized securities and stablecoins to handle 10% of global post-trade market turnover in less than five years.
Looking further ahead, ARK Invest recently projected that the digital asset market could reach $28 trillion by 2030. Other industry leaders, such as Tether co-founder Reeve Collins, expect nearly all traditional currencies to eventually transition into stablecoins.
Chainalysis has shared an even more aggressive outlook, estimating that stablecoin volumes could reach $1.5 quadrillion by 2035.
The role of AI and global competition
Zhao noted that the rise of artificial intelligence is likely to pull blockchain adoption along with it, particularly as AI agents begin to handle financial transactions. He suggested that the combination of these technologies is now essential for national competitiveness.
“I think there’s really three big industries in my adult lifetime: the internet, blockchain and AI. Any country that misses one of them is going to be severely disadvantaged,” he said.
While Microsoft recently identified the United States as the leader in AI infrastructure, other nations are moving faster in specific areas of adoption.
Signzy and Arkham have both highlighted Switzerland as a top hub for crypto innovation, while the United Arab Emirates has outpaced the U.S. in the actual day-to-day usage of new digital tools.
To keep pace, Zhao previously advised AI developers to focus on the practical utility of their tools rather than simply launching new tokens to raise money.
Crypto World
Could Pepeto Deliver the Best Crypto Presale to Buy as ETH and ARB Recover on Ceasefire News
A two week ceasefire between the U.S. and Iran just triggered $427 million in short liquidations, sending BTC back above $72,000 and ETH past $2,200 in a single session. Wallets positioned before the news printed gains overnight that took months of patience to build.
While the rally lifts large caps, Pepeto has crossed $8.87 million in presale capital while a Binance listing draws closer, making it what analysts call the best crypto presale to buy before the next wave of capital arrives.
The U.S. and Iran agreed to a two week ceasefire that includes reopening the Strait of Hormuz and suspending strikes, according to Yahoo Finance.
BTC jumped 4.5% to $71,926 and ETH climbed 6.3% to $2,239 within hours. The rally erased weeks of fear driven selling and pushed total crypto market cap above $2.4 trillion according to CoinMarketCap. Short sellers lost $427 million in forced closures overnight.
How ETH, ARB, and Pepeto Stack Up After the Ceasefire Rally
Pepeto: Swap Tools and Pepe Legacy Creating the Entry Analysts Keep Flagging
Every cycle has a moment where one presale pulls capital while the rest of the market bleeds, and this time the signal is hard to miss. One name drawing serious money through the noise is Pepeto, a presale built for real returns rather than temporary hype, which is why analysts keep naming it the best crypto presale to buy this cycle.
The ecosystem rewards holders on multiple levels. Staking at 186% APY gives early wallets growing returns that compound ahead of the listing. The 420 trillion token supply keeps active traders and committed holders in balance.
The exchange system already runs and processes live trades. PepetoSwap handles token swaps across chains at zero cost, so holders protect the full size of every position. The risk scorer reviews each contract before a trade completes, catching red flags that cost unprepared wallets their capital every day.
Capital kept coming even when the Fear and Greed Index touched single digits, pushing total presale past $8.87 million. Pepeto at $0.0000001863 trades at a fraction of what listing projections show, and the distance between that entry and where trading opens is where wealth gets created for wallets that commit while the number exists.
The presale locks out permanently when the Binance listing opens, and the current entry goes away forever. Market watchers target 100x or more, pointing to the cofounder’s history of building the original Pepe coin to billions without a single working product. Stages keep selling out ahead of schedule, and the wallets still searching are watching the entry they wanted get smaller with every hour that passes.
Ethereum: ETH Climbs on Ceasefire but Faces Familiar Ceiling
ETH trades near $2,217 according to CoinMarketCap after jumping 6.3% on the ceasefire. BlackRock’s staked ETH fund saw $15.5 million in first day volume.
Support holds at $2,000 with resistance near $2,400. Even reaching $5,000, the August 2025 all time high, delivers roughly 120% from here, strong for a large cap but far from what the best crypto presale to buy can produce in the same window.
Arbitrum: ARB Sits 96% Below Its Peak With Unlock Pressure Ahead
ARB trades near $0.10 according to CoinMarketCap, sitting 96% below its all time high of $2.40. An $8.72 million token unlock arrives April 16, releasing 92.65 million tokens that add selling pressure.
Monthly unlocks keep dragging the price lower even as the Layer 2 network processes real DeFi volume. A recovery to $0.20 only doubles capital while dilution risk remains for holders waiting for the unlock schedule to end.
Conclusion:
The best crypto presale to buy becomes clearest when a rally reminds everyone that crypto rewards wallets already inside. ETH and ARB recovered on the ceasefire, but their ceilings pale against what presale entries produce when a listing arrives. Pepeto combines swap tools and contract protection with pricing that reshapes a portfolio after one event.
Pepe exploded from presale price and those early wallets collected life changing returns, and the same pattern is forming around Pepeto before the crowd confirms it. Capital flowing through Pepeto proves the signal is loud, and the presale price disappears permanently when the Binance listing opens. Every hour the presale stays open is an hour closer to the listing that turns this into the best crypto presale to buy someone else got instead of you.
Click To Visit Pepeto Website To Enter The Presale

FAQs
What makes Pepeto the best crypto presale to buy right now?
Pepeto runs live swap tools with zero fees, a Pepe cofounder leads the project, and a confirmed Binance listing sits days away at $0.0000001863 entry. The presale pulled $8.87 million during extreme market fear.
Did the ceasefire rally change the crypto outlook?
The ceasefire triggered $427 million in short liquidations and sent BTC above $72,000 in hours. Fresh capital entering the market benefits presale entries like Pepeto that are priced before exchange listing.
Disclaimer: This is a Press Release provided by a third party who is responsible for the content. Please conduct your own research before taking any action based on the content.

Bath break Northampton hearts on one of European club rugby’s great nights

US plane carrying team for talks with Iran lands in Islamabad, two Pakistani sources say

XRP Price Flashes Multiple Bottom Signals As Bulls Defend $1.30.

Why Israel is blocking foreign journalists from entering

Bitcoin: We’re Entering The Most Dangerous Phase

Alan Cumming Brands Baftas Ceremony A ‘Triggering S**tshow’

XRP- Ripple Treasury Ceritified To Tap 11,000+ SWIFT Banks? Yes – Bitcoin Hits $200K What Is XRP???

ULTIMATE Cryptocurrency Trading Course (From Beginner To PRO)

Gs Finance – New Loan App for Low Cibil ( Review ) | New Loan App review 2026 | Only On KYC
-

 Business5 days ago
Three Gulf funds agree to back Paramount’s $81 billion takeover of Warner, WSJ reports
-

 Sports6 days ago
India men’s 4x400m and mixed 4x100m relay teams register big progress | Other Sports News
-

 Politics11 hours ago
US brings back mandatory military draft registration
-

 Fashion12 hours ago
Weekend Open Thread: Veronica Beard
-

 Business7 days ago
Expert Picks for Every Need
-

 Tech3 days ago
How Long Can You Drive With Expired Registration? What Florida Law Says
-

 Business6 days ago
No Jackpot Winner, Prize to Climb to $231 Million
-

 Fashion5 days ago
Massimo Dutti Offers Inspiration for Your Summer Mood Board
-
 Sports12 hours ago
Man United discover Nico Schlotterbeck transfer fee as defender reaches Dortmund agreement
-

 Fashion4 days ago
Let’s Discuss: DEI in 2026
-

 Crypto World3 days ago
Bitcoin recovers as US and Iran Agree a Ceasefire Deal
-

 Business9 hours ago
Tesla Model Y Tops China Auto Sales in March 2026 With 39,827 Registrations, Beating Cheaper EVs and Gas Cars
-

 Crypto World2 days ago
Canary Capital Files SEC Registration for PEPE ETF
-

 Business6 days ago
Akebia Therapeutics, Inc. (AKBA) Discusses Pipeline Progress and Strategic Focus on Kidney Disease Treatments at R&D Day – Slideshow
-

 Business18 hours ago
OpenAI Halts Stargate UK Data Centre Project Over Energy Costs and Copyright Row
-

 Tech5 days ago
Haier is betting big that your next TV purchase will be one of these
-

 Tech5 days ago
The Xiaomi 17 Ultra has some impressive add-ons that make snapping photos really fun
-

 Tech5 days ago
Samsung just gave up on its own Messages app
-

 Tech5 days ago
Gamer Restores the Original PlayStation Portal From Two Decades Ago
-

 Tech5 days ago
Save $130 on the Samsung Galaxy Watch 8 Classic: rotating bezel, sleep coaching, and running coach for $369
You must be logged in to post a comment Login