
Crypto World
Strategy Reveals Capacity to Withstand Bitcoin Price Collapse to $8,000

TLDR:
- Strategy can maintain full debt coverage even if Bitcoin price crashes 88% to $8,000 levels
- Michael Saylor plans to convert company’s convertible debt into equity over three to six years
- The announcement demonstrates Strategy’s confidence in its balance sheet and risk management approach
- Debt-to-equity conversion strategy aligns with Saylor’s long-term bullish outlook on Bitcoin
Strategy announced it can weather a Bitcoin price decline to $8,000 while maintaining sufficient assets to cover all outstanding debt obligations.
The bitcoin-focused company made the statement amid ongoing market volatility. Michael Saylor, the firm’s founder, simultaneously revealed plans to convert convertible debt into equity over a three to six-year period. The disclosure provides insight into the company’s risk management approach.
Financial Buffer Against Market Downturn
Strategy’s official statement indicates the company maintains substantial financial cushion despite aggressive bitcoin accumulation.
The company posted that it “can withstand a drawdown in BTC price to $8K and still have sufficient assets to fully cover our debt.” The $8,000 threshold represents an 88% decline from Bitcoin’s current trading levels.
Such a dramatic collapse would bring the cryptocurrency to prices last seen in early 2020. The company’s assertion demonstrates confidence in its balance sheet structure and asset management strategy. Strategy has positioned itself as a corporate bitcoin treasury company.
The firm holds one of the largest corporate bitcoin reserves globally. This financial resilience stems from the company’s debt-to-asset ratio and overall capital structure.
Strategy has raised billions through various financing mechanisms to fund bitcoin purchases. The company apparently structured these obligations with significant downside protection in mind.
Convertible Debt Transformation Timeline
Michael Saylor shared his vision for the company’s debt management through a post on X. Saylor stated: “Our plan is to equitize our convertible debt over the next 3–6 years.” This approach would transform debt obligations into equity stakes.
The conversion strategy aligns with Saylor’s long-term bullish outlook on bitcoin. Converting debt to equity reduces fixed obligations and interest expenses. It also provides flexibility as the company continues building its bitcoin position.
The timeline Saylor outlined suggests a gradual transition rather than immediate conversion. This measured approach allows the company to optimize conversion timing based on market conditions.
The strategy potentially reduces dilution risk for existing shareholders while maintaining operational flexibility. The combination of debt coverage capacity and conversion plans reflects Strategy’s evolving corporate structure.


![]()
A state judge in Nevada extended a temporary ban on prediction market provider Kalshi’s sports-related contracts in the Silver State on Friday.
Judge Jason Woodbury in the First Judicial District Court told attorneys at a hearing in the Carson City courthouse that he would also grant the Nevada Gaming Control Board’s request to impose a preliminary injunction against Kalshi banning it from offering some of its prediction markets until a broader court case from the state gaming regulator could be resolved. He extended the temporary restraining order he first granted on March 20 by two weeks to sort out the language of the injunction, Reuters reported Friday.
The judge’s original temporary restraining order blocked Kalshi from offering sports, entertainment and election-related bets.
The judge said buying a contract on a baseball game on Kalshi was “indistinguishable” from placing a bet on a state gaming platform, Reuters reported.
“So I find based on the arguments that have been presented that it is a gaming activity that is prohibited for any non-licensee to engage in,” he said.
Spokespeople for Kalshi and the Nevada Gaming Control Board did not return requests for comments.
State regulators have moved to block prediction market providers in much of the U.S., arguing that these companies’ sports-related products appear to be gambling products that should be regulated at the state level. Kalshi and other prediction market providers argue that they are federally regulated designated contract markets offering swaps, a type of derivative product, and therefore are not subject to state regulators.
The Commodity Futures Trading Commission, helmed by Chairman Mike Selig, has taken a stance agreeing with these companies. It filed an amicus brief in an appeals court case earlier this year, and sued Arizona, Illinois and Connecticut on Thursday alongside the Department of Justice, arguing that it is the proper regulator and alleging that the states are infringing on its role.
The hearing took place the same day as another hearing at a federal court in Arizona. In that hearing, Kalshi had filed to block state regulators from filing to block the prediction market provider’s products in the state. Arizona Attorney General Kris Mayes had previously filed an information alleging criminal charges against Kalshi.
According to the court docket, District Judge MIchael Liburdi heard arguments and is considering the motion.
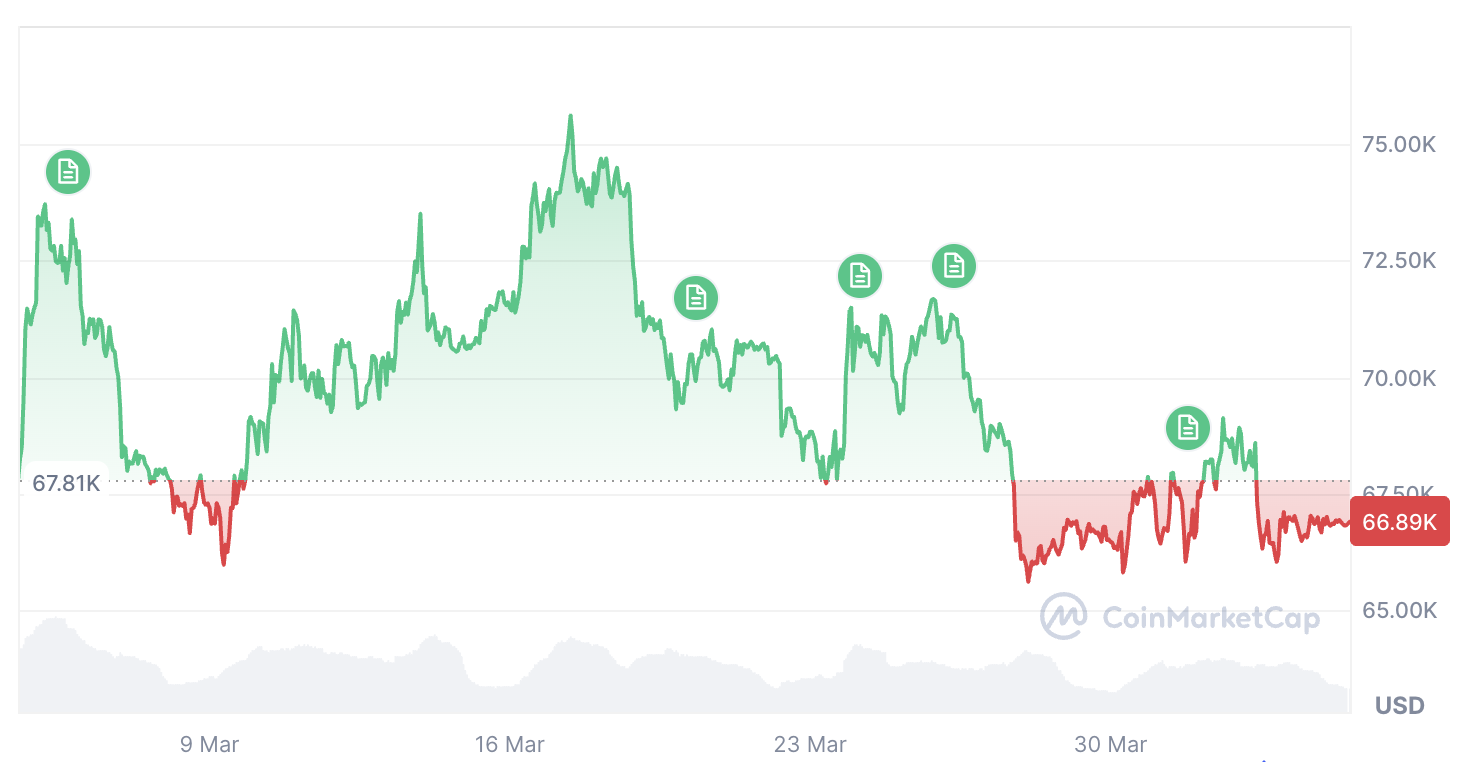
Bitcoin’s prolonged consolidation below $70,000 may be paving the way for a more significant rally, according to a crypto analyst.
“The longer it lasts, the heavier the breakout will be,” MN Trading Capital founder Michael van de Poppe said in an X post on Friday.
“Bitcoin remains stagnant in this area, which means that there’s literally no direction,” van de Poppe said, adding that he is eyeing Bitcoin (BTC) breaking through $71,000, a level the asset hasn’t reached since March 26.
Bitcoin has been trading in a narrow range
Since reaching a yearly low of $60,000 on Feb. 6, Bitcoin has been trading in a narrow range between $60,000 and $74,000. Bitcoin is trading at $66,890 at the time of publication, down 8.25% over the past 30 days, according to CoinMarketCap.

Crypto analyst Ted said that $60,000 “wasn’t the bottom” in an X post on Friday. “This doesn’t mean another 50% crash will happen,” he said, adding that “there’ll be one final capitulation before the bottom.”
Van de Poppe’s optimistic call comes amid sentiment toward the broader crypto market being down. The Crypto Fear & Greed Index, which measures overall sentiment in the crypto market, stayed within “Extreme Fear” territory on Saturday, recording a score of 11.
“Deeper bear” for Bitcoin still on the cards
While van de Poppe is watching for a potential reversal as Bitcoin continues to consolidate, other analysts are more skeptical.
Bitcoin analyst Willy Woo said in an X post on Mar. 30 that there is a “very good chance we get a deeper bear due to a breakdown of the secular bull market in global macro.”
Related: Bitcoin ‘done’ with 85% crashes, says Cathie Wood amid new $34K target
Meanwhile, veteran trader Peter Brandt recently told Cointelegraph that he doesn’t anticipate Bitcoin reaching a new price high in 2026.
“Not until maybe the second quarter of 2027,” he added.
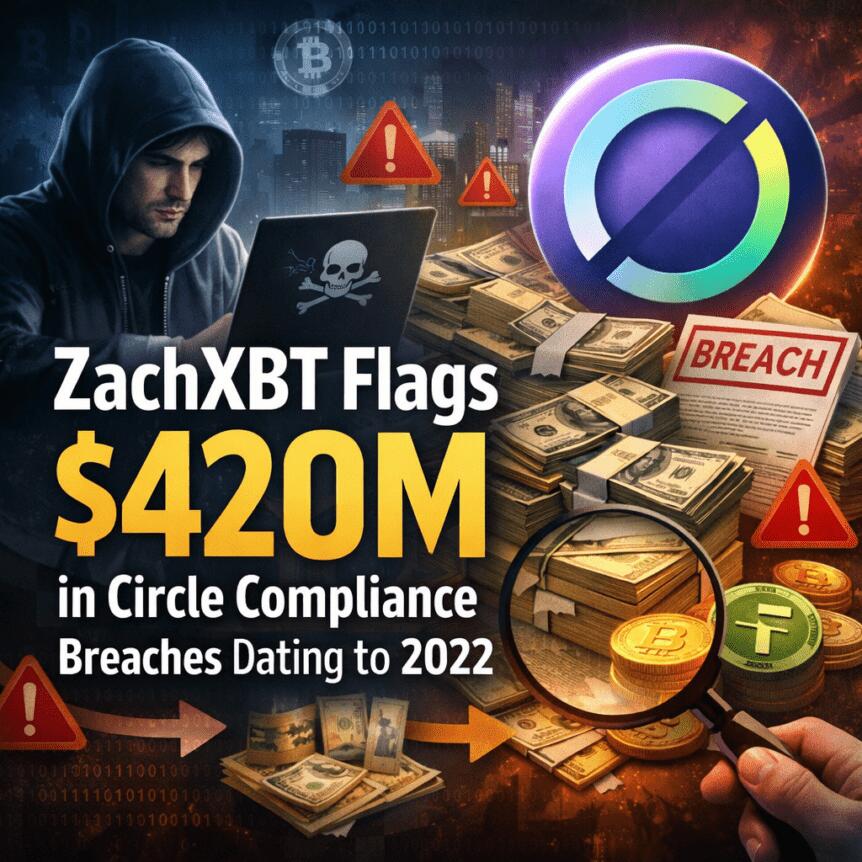
On-chain sleuth ZachXBT has escalated a critique of Circle, the issuer behind the USDC stablecoin, contending that the company has failed to freeze or blacklist roughly $420 million in illicit fund flows since 2022. Circle can freeze assets and blacklist wallets, but ZachXBT argues that the amount of action taken has been minimal in several high-profile cases, including ones tied to North Korea-linked actors, and across multiple hack-and-fraud episodes.
The allegations come amid a broader conversation about the responsibilities of centralized service providers in a crypto ecosystem where illicit activity still flows through centralized rails. ZachXBT frames the issue as one of real-world consequences for users and ecosystems when law enforcement requests and private-sector flags collide with a company’s implementation practices.
“Nine figures were lost from the ecosystem because of repeated inaction across three years on law enforcement requests, private sector requests, and their own infrastructure. The $420 million-plus only accounts for major public cases. The real figure is likely significantly higher.”
Cointelegraph reached out to Circle for comment; as of publication, no immediate response had been received.
Key takeaways
- ZachXBT asserts Circle has not frozen or blacklisted roughly $420 million in illicit USDC flows since 2022, a figure derived from publicly documented cases he tracks.
- Alleged examples include $9 million in USDC linked to the GMX hack in July 2025, which ZachXBT says Circle did not freeze, and $232 million in illicit flows tied to the Drift Protocol incident, where USDC was moved in multiple transactions before action was taken.
- Circle has taken recognizably proactive steps in some cases, such as freezing USDC held by Tornado Cash addresses (sanctioned by OFAC) in 2022, and it has signaled interest in reversible or amendable transaction models for hacks and fraud.
- The discussion feeds into a broader debate about the gatekeeping role of centralized issuers and custodians in a largely decentralized ecosystem, with online discourse spotlighting how enforcement and technology intersect.
What ZachXBT is pointing to—and why it matters
The core of the critique rests on a pattern ZachXBT describes as inconsistent or delayed action by Circle in the face of illicit flows. He highlights several high-profile incidents where USDC moved through centralized rails during or after a hack or fraud event, arguing that Circle’s response in some cases was insufficient to stop or reverse the movement of stolen or fraudulently obtained funds.
Among the episodes cited are the GMX exchange hack in July 2025, which involved illicit transfers of USDC that, according to ZachXBT, were not frozen in a timely manner. In another incident, the Cetus DEX breach in May 2025 led to roughly $200 million in USDC being converted to ETH, with Circle allegedly failing to block or freeze the involved addresses in the moment. A further instance involved the Drift Protocol hack, in which a six-hour window saw attackers move funds from USDC to ETH across numerous transactions, yet Circle reportedly did not intervene swiftly enough to halt those movements.
Beyond individual cases, ZachXBT frames the issue as systemic. He argues that a sustained pattern of inaction—despite law enforcement requests, private-sector notices, and the company’s own infrastructure signals—erodes trust in centralized risk controls and undermines the resilience of the broader ecosystem. The gist, he suggests, is that the cost of inaction is borne by ordinary users who rely on stablecoins for legitimacy, accessibility and liquidity in day-to-day trading and transacting.
Circle’s actions and the evolving debate over reversible transactions
The circle of debate around Circle has been widening over the past year. In September 2025, Circle’s president Heath Tarbert disclosed that the company was exploring “reversible” USDC transactions—an option that could allow funds to be rolled back or amended in response to hacks, theft and fraud. The concept would represent a fundamental shift in stablecoin risk management, offering a remedy in cases where illicit flows slip through conventional controls.
Circle has not shied away from taking action in certain circumstances. The issuer has publicly frozen USDC funds and blacklisted wallets tied to Tornado Cash addresses, a move aligned with OFAC sanctions in 2022. These steps demonstrate that Circle is willing to intervene actively when inputs from regulators or enforcement agencies align with its risk-mremediation framework. How a reversible-system would interact with existing sanctions regimes and private-sector notices remains a topic of intense discussion among auditors, exchanges and users.
Context, risks and the road ahead for investors and builders
The conversation around Circle’s approach sits at the intersection of compliance, user protection and market structure. Proponents of stronger on-chain controls argue that clear, enforceable standards help reduce the gatekeeping risk that centralized entities pose to users who operate across permissioned and permissionless ecosystems. Critics caution that heavy-handed or opaque asset-containment tools could introduce new vectors for market manipulation or hamper legitimate liquidity flows, underscoring the tension between security and permissionless innovation.
For investors and builders, the key questions are where the boundaries lie between legitimate enforcement and overreach, and how policy and technology evolve to address new attack vectors. The incidents cited by ZachXBT underscore that even widely used stablecoins can become flashpoints for debates about responsibility, transparency and accountability among the parties that stand between users and the crypto economy—issuers, exchanges, and custodians alike.
Public commentary from the crypto community—including observers who track on-chain activity—has highlighted the role of centralized actors as potential chokepoints in the flow of illicit funds. Some commentators have pointed to the need for more robust, verifiable compliance signals embedded in stablecoins, while others argue that the best way forward is to design systems with stronger, trust-minimized fraud detection and response capabilities that do not rely solely on centralized intervention.
What to watch next
Key questions remain unsettled: Will Circle move from exploratory reversible transactions toward a concrete, auditable framework for rollback or remediation in hacks? How will regulatory expectations shape Circle’s risk controls and the timing of asset freezes or blacklists? And will further public reporting or independent audits emerge to illuminate how USDC flows are managed in real-world incidents?
As Circle contemplates these questions, the industry will continue to monitor the company’s responses to past incidents and any formal commitments it makes regarding future safeguards. The ongoing debate will likely influence how users evaluate stablecoins’ reliability, how developers design protection layers for on-chain protocols, and how regulators calibrate enforcement around centralized crypto rails.
Readers should stay tuned for any formal statements from Circle and for new data points from on-chain researchers and auditors that could recalibrate the assessment of how USDC and similar stablecoins behave during hacks, fraud, and other stress events.

Bitcoin spot ETFs may soon surpass gold ETFs in assets under management, fracturing the long-standing narrative that “digital gold” is a perfect stand-in for investors seeking a safe haven. Bloomberg ETF analyst James Seyffart shared the view in an interview linked to the Coin Stories podcast, arguing that Bitcoin’s multiple use cases — from store of value to growth asset and liquidity driver — create a broader appeal than gold, which the market typically frames in a single light.
“There are just more use cases of why somebody would put a Bitcoin ETF in a portfolio,” Seyffart said on the podcast. He emphasized Bitcoin’s roles as a store of value, a portfolio diversifier, a form of digital capital, and even a growth-risk asset, suggesting that the crypto may attract a wider spectrum of investors than gold over time. While gold has historically served as a hedge against monetary debasement, Bitcoin’s evolving narrative as both a digital asset and a potential macro hedge underpins the case for larger ETF demand in the years ahead.
Key takeaways
- Bitcoin ETFs could grow to exceed gold ETFs in total assets under management as demand broadens beyond the traditional “digital gold” story, according to James Seyffart, a Bloomberg ETF analyst.
- March ETF flows show divergent momentum: U.S. spot Bitcoin ETFs attracted about $1.32 billion in net inflows, while U.S. gold ETFs recorded net outflows of roughly $2.92 billion.
- A single-day move underscored fragility in precious metals: GLD, the flagship gold ETF, posted a $3 billion withdrawal on March 4, the largest daily outflow in more than two years.
- Longer-run macro signals remain mixed, with data suggesting a rotation dynamic between gold and Bitcoin rather than a single clear trend; Fidelity highlighted a historical pattern of leadership rotating between the two assets.
Flow dynamics in March: what they reveal about narrative shifts
The contrast in March ETF flows underscores shifting investor appetites for duration, liquidity, and narrative potential. Gold ETFs in the United States posted net outflows totaling about $2.92 billion in March, signaling renewed challenges for the traditional safe-haven metal in a period of evolving macro cues. In the same month, US spot Bitcoin ETFs drew approximately $1.32 billion in net inflows, illustrating a growing appetite for crypto exposure in diversified portfolios.
The divergence sits against a broader context in which Bitcoin and gold have moved more cohesively in recent weeks despite the divergent flows. The data points to a market that is re-evaluating the roles of these two hedges and growth assets in a landscape of persistent inflation concerns, evolving monetary policy expectations, and expanding acceptance of crypto-based investment products.
Gold’s pullback and retail versus institutional dynamics
Several pressures shaped gold’s March performance. The largest daily outflow in over two years hit GLD on March 4, reflecting sell-side and perhaps macro rotation pressures that have periodically punctured the gold regime. Meanwhile, more broad-based BIS data — cited by Cointelegraph — show retail gold purchases tripling over the past six months, while Wall Street selling has accelerated over the last four months. The juxtaposition implies a nuanced narrative: retail demand remains resilient even as institutional appetite shifts toward crypto exposure and related investment vehicles.
These dynamics sit alongside anecdotal expectations that a growing cadre of investors view Bitcoin as a “growth risk asset,” complementary to its role as a hedge-friendly reserve. The evolving taxonomy — Bitcoin as a stores of value, digital currency with intrinsic scarcity, and liquidity-rich growth asset — contributes to a broader array of reasons to own a Bitcoin ETF beyond simply “digital gold.”
Price action and broader market context
As of publication, Bitcoin traded around $66,918, down about 8% over the prior 30 days, according to CoinMarketCap data. Gold hovered near $4,676 per ounce, down about 8.25% over the same period, per GoldPrice metrics. The near-term move preserves the sense that both assets have faced headwinds in a mixed macro backdrop, yet the flow data suggests that investor interest in Bitcoin ETFs remains persistent and possibly expanding even as gold faces episodic outflows.
The longer-term rotation story received some color from Fidelity Digital Assets analyst Chris Kuiper. In December 2025, Kuiper noted that historically gold and Bitcoin have rotated leadership, with gold performing strongly at times and Bitcoin catching up in others. That framework remains relevant as market participants weigh regulatory clarity, ETF availability, and the evolving ecosystem around Bitcoin-based investment products.
Implications for investors and markets
The potential overtaking of gold ETFs by Bitcoin ETFs in AUM would mark a notable shift in how investors allocate capital in search of diversification, liquidity, and growth exposure. If Bitcoin ETFs continue to capture inflows beyond the “digital gold” narrative, the market could see a broader base of participants embracing crypto exposure through regulated vehicles. This would not only change the composition of ETF portfolios but could also influence liquidity, product development, and the pace at which financial institutions bring more crypto-enabled offerings to retail and high-net-worth investors alike.
From a portfolio-management perspective, the idea of Bitcoin acting as hot sauce in a diversified mix is persuasive for those seeking a growth-oriented, liquidity-rich sleeve within a broader asset allocation. Yet the data also underscores the need for caution and continued monitoring of regulatory developments, product approvals, and market structure changes that shape the appeal and risk profile of spot BTC ETFs.
In practical terms, readers should watch ETF inflow trends in the coming quarters, the rate of new product approvals, and the evolving evidence on how Bitcoin-based funds perform relative to gold during different macro regimes. The March data points demonstrate that the narrative around Bitcoin ETFs is gaining traction in investor discourse, even as gold maintains its own complex set of drivers and vulnerabilities.
Beyond price moves, the debate now centers on whether Bitcoin ETFs can sustain and broaden their appeal to a broader investor universe — from traditional equity and bond strategists to macro hedge funds and retail savers seeking diversified exposure. If inflows continue and more products arrive, the BTC ETF story may transition from a niche crypto offering to a core component of diversified portfolios.
What matters next is the trajectory of ETF approvals and listings, clear and consistent data on inflows across different regimes, and how macro factors like inflation momentum and monetary policy directions shape the risk-reward calculus for these funds. Investors should stay attentive to monthly flow prints, regulatory signals, and the evolving narrative around Bitcoin’s role in modern asset allocation.
As the market awaits further clarity, the ongoing dialogue around Bitcoin’s ETF potential points to a future where crypto exposure becomes an increasingly standard instrument within traditional investment frameworks. The next few quarters will be telling, as inflows, product breadth, and price action converge to reveal whether Bitcoin ETFs can definitively eclipse gold ETFs in practical assets under management.

Spot Bitcoin exchange-traded funds (ETFs) could surpass gold ETFs in total assets under management (AUM) as investor demand expands beyond the traditional “digital gold” narrative, according to ETF analyst James Seyffart.
“There are just more use cases of why somebody would put a Bitcoin ETF in a portfolio,” Seyffart said on the Coin Stories podcast published to YouTube on Friday. He pointed to Bitcoin’s (BTC) role as digital gold, a store of value, a portfolio diversifier, and a form of digital capital and property, adding that the market also views Bitcoin as a “growth risk asset.”
Seyffart explained that Bitcoin has “all these different ways” of being viewed, while gold only has “one of those things.”
“Our view is that Bitcoin ETFs will be larger than gold ETFs,” he added.
Bitcoin ETFs are a “hot sauce” in the portfolio
“There are so many people that could use it. They could be viewing it to put in their portfolio because they want to bet on like a growth and liquidity trade,” he said. “It can be hot sauce in a portfolio in that way,” he added.

Bitcoin is often compared to gold due to its limited supply and perceived role as a hedge against monetary debasement.
US-based gold ETFs recorded net outflows of $2.92 billion in March, while US spot Bitcoin ETFs attracted $1.32 billion in net inflows over the same period.
Gold and BTC have declined over the past 30 days
The largest US gold-backed ETF, GLD, recorded a $3 billion outflow on Mar. 4, the largest daily withdrawal in more than two years.
On Mar. 19, Cointelegraph cited data from the Bank for International Settlements (BIS) showing retail gold purchases have tripled over the last six months, while Wall Street selling has accelerated over the past four months.
Related: Bitcoin ‘done’ with 85% crashes, says Cathie Wood amid new $34K target
Despite the divergence in ETF flows, both assets have moved broadly in tandem in recent weeks.
Bitcoin is trading at $66,918 at the time of publication, down 8.07% over the past 30 days, according to CoinMarketCap. Meanwhile, gold is trading at $4,676, down 8.25% over the past 30 days, according to GoldPrice data.
In December 2025, Fidelity Digital Assets analyst Chris Kuiper said that, “historically, gold and Bitcoin have taken turns outperforming. With gold shining in 2025, it would not be surprising if Bitcoin takes the lead next.”
Magazine: Solana exec trolls crypto gamers, Pixel tackles play-to-earn issues: Web3 Gamer

TLDR:
- The tokenized US Treasury market hit $12B, far below the $6T traditional money market fund sector.
- Regulatory obligations follow the entities managing assets, not the tokens representing them onchain.
- Embedded compliance built into RWA protocols removes costly intermediary layers found in traditional markets.
- Major jurisdictions including the EU, Singapore, Hong Kong, and Japan are actively building RWA frameworks.
RWA regulation is no longer a side conversation in crypto — it has become the central pillar of tokenized asset infrastructure. As real-world assets move onchain, they carry existing legal obligations with them.
The technology to tokenize bonds, private credit, and equities already works well. However, the legal and compliance layer determines whether those assets carry real, enforceable value for investors.
Without regulatory infrastructure, a tokenized bond is simply a token referencing a bond — nothing more.
The Trust Gap Holding Back Institutional Capital in RWA
The tokenized US Treasury market reached roughly $12 billion as of March 2026. By contrast, the traditional US money market fund industry manages over $6 trillion.
That gap is not a technology problem. The blockchain settles transactions faster, and onchain access is broader than in legacy markets.
The barrier is trust, not capability. A pension fund evaluating a tokenized product needs far more than a working smart contract.
Its compliance team, legal counsel, and board must each confirm that the obligations governing the underlying asset are fully met. That confirmation cannot be approximated — it must be complete.
That standard reflects fiduciary responsibility. These allocators manage other people’s money and carry strict legal accountability for each product they hold.
Every tokenized instrument must meet the same legal standards as traditional market instruments alongside it. That is not a preference — it is a legal requirement.
Plume Network addressed this issue through its RWA Academy series. The team noted that regulatory clarity is “the precondition for institutional capital” in the RWA space.
Regulatory obligations do not sit with the asset itself — they sit with the entities that issue, transfer, and facilitate trading in it. RWA infrastructure must allow those entities to discharge their responsibilities clearly.
Embedded Compliance Is Transforming How RWA Infrastructure Is Built
One key shift in RWA is the transition from bolt-on compliance to embedded compliance. In traditional markets, intermediaries handle compliance at every step of a transaction. Each additional layer adds cost, introduces delay, and reduces transparency for all parties.
Onchain systems can instead build compliance directly into the protocol itself. Transaction screening, transfer restrictions, and KYC/AML verification can all operate within the system. That design eliminates the need for separate compliance layers added after the fact.
The result is a network where compliance is an intrinsic property rather than an add-on feature. That distinction matters enormously for regulated institutions evaluating RWA markets. Institutional adoption of RWA depends on this structural credibility, not just smart contract functionality.
Regulators across major jurisdictions are aligning around the same direction. Europe’s MiCA framework took effect in 2024 and covers all 27 member states.
Hong Kong’s Project Ensemble and Singapore’s Project Guardian are both testing tokenized financial markets with regulatory involvement.
South Korea and Japan are each updating their digital asset laws to accommodate onchain flows. Cross-border fragmentation remains a challenge, but shared principles across frameworks are becoming clearer each month.

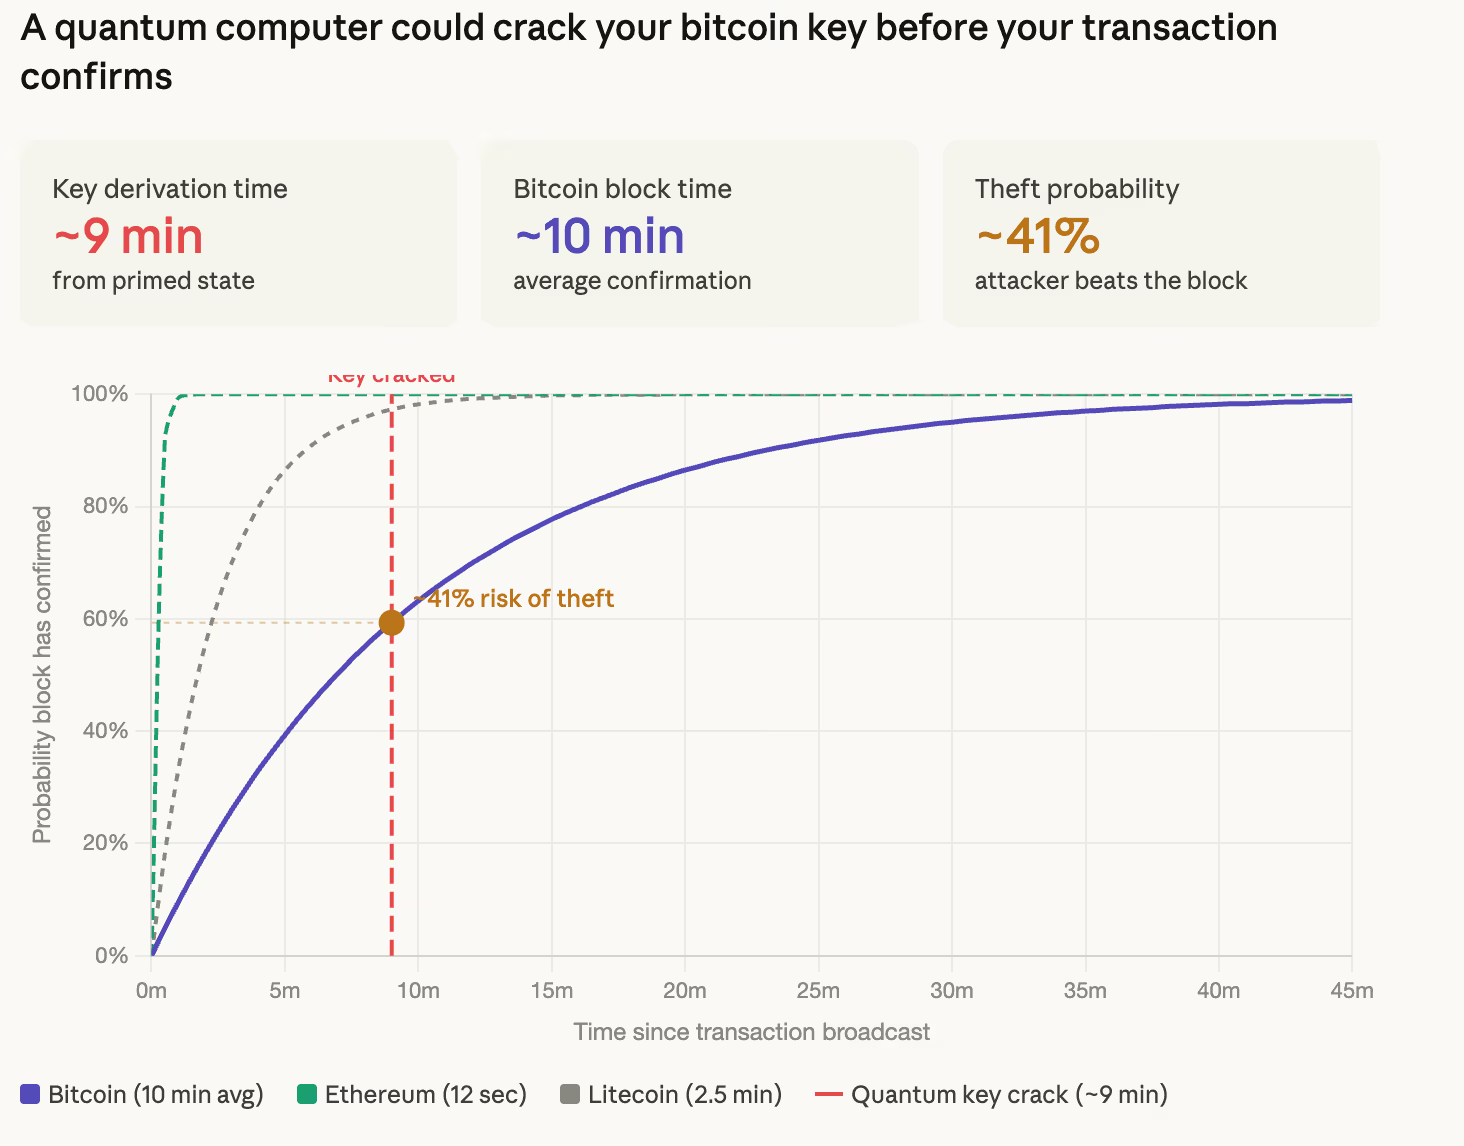
Google’s Quantum AI team said earlier this week that a future quantum computer could derive a bitcoin private key from a public key in roughly nine minutes. The number ricocheted across social media and spooked markets.
But, what does it actually mean in practice?
Let’s start with how bitcoin transactions work. When you send bitcoin, your wallet signs the transaction with a private key, a secret number that proves you own the coins.
That signature also reveals your public key, a shareable address, which gets broadcast to the network and sits in a waiting area called the mempool until a miner includes it in a block. On average, that confirmation takes about 10 minutes.
Your private key and public key are linked by a math problem called the elliptic curve discrete logarithm problem. Classical computers can’t reverse that math in any useful timeframe, while a sufficiently powerful future quantum computer running an algorithm called Shor’s could.
Here’s where the nine minutes part comes in. Google’s paper found that a quantum computer could be “primed” in advance by pre-computing the parts of the attack that don’t depend on any specific public key.
Once your public key appears in the mempool, the machine only needs about nine minutes to finish the job and derive your private key. Bitcoin’s average confirmation time is 10 minutes. That gives the attacker a roughly 41% chance of deriving your key and redirecting your funds before the original transaction confirms.
Think of it like a thief spending hours building a universal safe-cracking machine (pre-computation). The machine works for any safe, but each time a new safe appears, it only needs a few final adjustments — and that last step is what takes about nine minutes.

That’s the mempool attack. It’s alarming but requires a quantum computer that doesn’t exist yet. Google’s paper estimates such a machine would need fewer than 500,000 physical qubits. Today’s largest quantum processors have around 1,000.
The bigger and more immediate concern is the 6.9 million bitcoin, roughly one-third of total supply, that already sit in wallets where the public key has been permanently exposed.
This includes early bitcoin addresses from the network’s first years that used a format called pay-to-public-key, where the public key is visible on the blockchain by default. It also includes any wallet that has reused an address, since spending from an address reveals the public key for all remaining funds.
These coins don’t need the nine-minute race. An attacker with a sufficiently powerful quantum computer could crack them at leisure, working through exposed keys one by one without any time pressure.
Bitcoin’s 2021 Taproot upgrade made this worse, as CoinDesk reported earlier Tuesday. Taproot changed how addresses work so that public keys are visible on-chain by default, inadvertently expanding the pool of wallets that would be vulnerable to a future quantum attack.
The bitcoin network itself would keep running. Mining uses a different algorithm called SHA-256 that quantum computers can’t meaningfully speed up with current approaches. Blocks would still be produced.
The ledger would still exist. But if private keys can be derived from public keys, the ownership guarantees that make bitcoin valuable break down. Anyone with exposed keys is at risk of theft, and institutional trust in the network’s security model collapses.
The fix is post-quantum cryptography, which replaces the vulnerable math with algorithms that quantum computers can’t crack. Ethereum has spent eight years building toward that migration. Bitcoin hasn’t even started.

Coinbase’s bid to build a federally supervised custody and market infrastructure business took a significant step forward when the Office of the Comptroller of the Currency (OCC) granted conditional approval for a national trust bank charter after a six-month review. The decision, however, drew swift pushback from banking groups and reform advocates who argue that the application reveals gaps in risk management, profitability planning, and resolution strategies and that expanding trust powers for crypto activities may exceed the OCC’s statutory remit.
The Independent Community Bankers of America (ICBA) argued that the OCC’s move reflects a broader trend: nonbank entities seeking the benefits of a bank charter without meeting the full regulatory framework that governs traditional lenders. In a statement accompanying its critique, the ICBA warned that the approval could create new safety and soundness risks for consumers and the broader financial system.
The sudden influx of applications demonstrates nonbank entities are seeking the benefits of a US bank charter without satisfying the full scope of US bank regulations.
Coinbase’s bid to broaden its custody and market infrastructure footprint enters a federal regulatory arena that remains unsettled for many crypto activities.
Key takeaways
- OCC grants conditional approval for Coinbase to pursue a national trust bank charter after a six-month review, signaling a potential federal framework for crypto custody and related services.
- Industry and reform groups counter that the application highlights regulatory gaps and could shift risk toward consumers and the financial system if not fully aligned with traditional banking standards.
- Separately, a broad debate over stablecoins and yield-bearing products intensifies scrutiny of how crypto yields fit within or outside existing banking rules, including concerns about potential asset leakage from banks.
- Policy discussions in Washington continue around the US Digital Asset Market Clarity Act, with progress claimed by some lawmakers but key sticking points, such as yield, delaying formal committee action.
Regulatory pushback surrounds Coinbase bank-charter approval
Stablecoins and yield debate intensifies regulatory scrutiny
Bank of America CEO Brian Moynihan estimated that up to trillions of dollars could migrate away from conventional banks if such yields were broadly permitted, potentially constraining banks’ ability to lend and raising borrowing costs for households and businesses.
Policy momentum, investor implications, and what comes next
What to watch next: a clearer alignment on the Digital Asset Market Clarity Act’s key provisions, updates on whether yield-bearing products will be reconciled within traditional banking restrictions, and any further OCC or federal guidance that could define the contours of crypto custody and market infrastructure under a national bank charter.
Crypto World
Chainlink’s $42M LINK Transfer to Binance Sparks Caution as Whale Wallets Hit a One-Year High
TLDR:
- Around 4.9 million LINK tokens worth roughly $42M were transferred to Binance during a low-volume weekend session.
- A single wallet address was responsible for moving 2.5 million LINK directly to Binance in one concentrated transfer.
- Chainlink whale wallets holding 1M or more LINK grew from 100 to 125 between April 2025 and April 2026.
- Analysts remain cautious as large exchange inflows can signal selling pressure, especially during low-liquidity trading periods.
Chainlink has attracted renewed attention following a large on-chain transfer over the weekend. Around $42 million worth of LINK tokens moved to Binance during a period of typically low trading activity.
The movement came alongside fresh data showing a rise in whale wallet accumulation over the past year. Both developments have placed the asset under closer watch from market participants tracking its near-term direction.
The timing has added to growing interest surrounding Chainlink’s current on-chain behavior.
Large LINK Transfers Raise Questions About Exchange Inflows
On-chain analyst Darkfost flagged the transfer on social media this weekend. According to the post, roughly 4.9 million LINK tokens were sent to Binance.
Within that total, 2.5 million LINK came from a single wallet address. The concentration of funds from one source drew added attention to the movement.
The transfers occurred during a weekend, when trading volumes tend to stay lower than usual. Low-liquidity windows can strengthen the price effect of large exchange inflows.
Some participants move large sums during these periods to avoid immediate market disruption. Others may use the timing to position ahead of the regular trading week.
Darkfost outlined two possible explanations for the movement. One is that the Chainlink team relocated funds for custody or under a Binance arrangement.
The other is that a whale or large entity chose Binance for access to its deep order book. The actual reason behind the transfer has not been confirmed.
Large exchange inflows call for a measure of caution from market observers. Funds sent to a trading platform can, under the right conditions, translate into sell-side activity.
Chainlink’s order book is now being watched for any follow-through from these transfers. No major sell event had been reported at the time of publication.
Whale Accumulation in Chainlink Points to Long-Term Confidence
Santiment published data on April 3 showing a notable shift in Chainlink’s whale count. The number of wallets holding one million or more LINK tokens grew from 100 to 125.
That change occurred between April 2025 and April 2026, a period marked by a broader crypto bear market. The data points to quiet accumulation by large holders throughout that time.
Accumulation of this scale often goes unnoticed when price action is flat. On-chain whale metrics, however, offer a longer view of how an asset is being positioned.
Chainlink’s rising whale count reflects steady demand from the top tier of holders. That trend continued even as market conditions remained difficult.
The contrast between exchange inflows and long-term wallet growth presents a layered picture. Near-term transfers to Binance suggest possible selling pressure, while whale accumulation signals continued holding behavior.
These two trends carry different weight depending on one’s investment horizon. Both are expected to remain in focus in the weeks ahead.
Chainlink’s price was recorded at $8.69 at the time of the on-chain activity. Analysts and traders continue to monitor both flows and wallet data for further developments.
Crypto World
Tokenized Real-World Assets Hit $27.65B as Ondo Finance Dominates Equities With 60% Market Share
TLDR:
- The tokenized RWA market reached $27.65B in April 2026, growing 4.07% while most crypto sectors contracted.
- U.S. Treasury debt leads the RWA market at $12.78B, nearly half the total, followed by commodities at $5.4B.
- Tokenized equities hit $941M with a $2.94B monthly transfer volume, marking an 85.78% jump in 30 days.
- Ondo Finance controls 60.07% of the tokenized equity market at $557M, spanning 230 products across 8 asset classes.
Tokenized real-world assets have reached $27.65 billion in total distributed value as of April 2026. The sector grew 4.07% over the past 30 days, standing apart from most crypto verticals.
Capital inflows into RWA remain structurally positive while other segments contract. U.S. Treasuries lead at $12.78 billion, followed by commodities at $5.4 billion and asset-backed credit at $3.19 billion. Tokenized equities are now approaching the $1 billion threshold.
RWA Market Holds Steady as Capital Flows Into Tokenized Instruments
The tokenized RWA market is drawing consistent institutional interest in blockchain-based financial instruments. Investors are moving capital into on-chain versions of Treasuries, commodities, and credit products.
These assets offer dollar-denominated yield without traditional brokerage accounts or wire transfer requirements. Global access without timezone or geographic barriers is a key draw for institutional allocators.
U.S. Treasury debt at $12.78 billion accounts for nearly half the total market value. Commodities follow at $5.4 billion, while asset-backed credit holds $3.19 billion.
Together, these three categories make up the bulk of the $27.65 billion total. The composition reflects a market led by yield-generating and capital-preservation instruments.
The 4.07% monthly growth rate is notable given the current crypto environment. Most sectors are recording outflows, yet RWA continues to attract fresh capital.
That contrast points to a structural shift in how institutional money views on-chain assets. Investors appear to be treating tokenized instruments as a long-term allocation category.
The broader data from rwa.xyz reinforces this trend with consistent upward movement. Monthly figures have held positive across multiple reporting periods.
The market is not being driven by short-term speculation, but by allocation patterns familiar in traditional finance. That behavioral shift separates RWA from most other crypto verticals.
Ondo Finance and xStocks Lead a Concentrated Tokenized Equity Sector
Tokenized equities now sit at $941 million, closing in on the $1 billion mark. Monthly transfer volume reached $2.94 billion, a jump of 85.78% over 30 days.
That creates a 3:1 ratio between transfer volume and total asset value. The ratio points to active trading rather than passive holding behavior among participants.
According to data shared on X, OndoFinance holds 60.07% of the tokenized equity market at $557 million. The platform operates across 230 products and grew 8.28% over the past month.
@xStocksFi holds 26.24% at $243.3 million, making it the second-largest platform. Together, the two platforms control 86% of the entire tokenized equity market.
Securitize, the next closest competitor, holds only $60 million across a single product. That platform declined 38.32% over the same 30-day period.
Every other platform in the space holds under $25 million. The drop-off from the two leaders to the rest of the market is sharp.
Ondo’s growth reflects a portfolio that has evolved well beyond its original design. The platform started with OUSG and USDY as Treasury yield products. It now covers eight asset classes, with U.S. Treasury debt at $2.4 billion making up 76.9% of its total value.
The equity vertical at $557 million has become its second-largest and fastest-growing segment, with top products including S&P 500 ETFs and NVIDIA shares.

No Shortage Of Volatility In Shortened Trading Week

Grand National 2026 tips – Expert’s three picks for Aintree showpiece including 25-1 shot

15 Ryobi DIY Products Users Recommend

Smart energy pays enters the US market, targeting scalable financial infrastructure

Why Israel is blocking foreign journalists from entering

Bitcoin: We’re Entering The Most Dangerous Phase

He Asked His Mom for Money and Still Somehow Tried to Act Unbuyable

Life is expensive enough, stop wasting money, start learning to save money by #couponing instead!

XRP HOLDERS IN DANGER? RIPPLE PRESIDENT EXPOSES DIGITAL ID PLAN (THIS IS SERIOUS)
-

 NewsBeat2 days ago
Steven Gerrard disagrees with Gary Neville over ‘shock’ Chelsea and Arsenal claim | Football
-

 Business1 day ago
No Jackpot Winner and $194 Million Prize Rolls Over
-
Entertainment5 days ago
Fans slam 'heartbreaking' Barbie Dream Fest convention debacle with 'cardboard cutout' experience
-

 Fashion13 hours ago
Weekend Open Thread: Spanx – Corporette.com
-

 Crypto World2 days ago
Gold Price Prediction: Worst Month in 17 Years fo Save Haven Rock
-

 Tech5 days ago
The Pixel 10a doesn’t have a camera bump, and it’s great
-
 Entertainment6 days ago
Lana Del Rey Celebrates Her Husband’s 51st Birthday In New Post
-
Crypto World4 days ago
Dems press CFTC, ethics board on prediction-market insider trades
-

 Tech5 days ago
Avatar Legends: The Fighting Game comes out in July and it looks pretty slick
-

 Sports4 days ago
Tallest college basketball player ever, standing at 7-foot-9, entering transfer portal
-

 Fashion6 days ago
Amazon Sundays: Soft Spring Layers
-

 Tech4 days ago
EE TV is using AI to help you find something to watch
-

 Business2 days ago
Login and Checkout Issues Spark Merchant Frustration
-

 Tech6 days ago
Elon Musk’s last co-founder reportedly leaves xAI
-

 Tech4 days ago
How to back up your iPhone & iPad to your Mac before something goes wrong
-

 Politics4 days ago
Should Trump Be Scared Strait?
-

 Crypto World4 days ago
U.S. rule change may open trillions in 401(k) funds to crypto
-

 Fashion5 days ago
The Best Spring Trends of 2026
-

 Tech5 days ago
Apple will hide your email address from apps and websites, but not cops
-

 Tech4 days ago
Flipsnack and the shift toward motion-first business content with living visuals
You must be logged in to post a comment Login