
Crypto World
Tether Tops 500 Million Users But USDT Peg Concerns Abound

Tether’s USDT has crossed a major milestone, surpassing 534 million users, even as the broader crypto market remains under pressure following a sharp contraction that began in October 2025.
According to the company’s Q4 2025 USD₮ Market Report, the stablecoin added more than 35 million users in the quarter, marking the eighth consecutive quarter of adding over 30 million users.
Sponsored
Sponsored
USDT Expands as a Global Store of Value Even as Crypto Market Cap Contracts
The growth comes during a period of declining risk appetite. Since the October 10 liquidation cascade, the total crypto market capitalization has fallen by more than one-third (30%). Meanwhile, USDT’s supply has continued to expand modestly.
Tether reported that its market capitalization rose to $187.3 billion, up $12.4 billion in Q4, even as some competing stablecoins shrank.
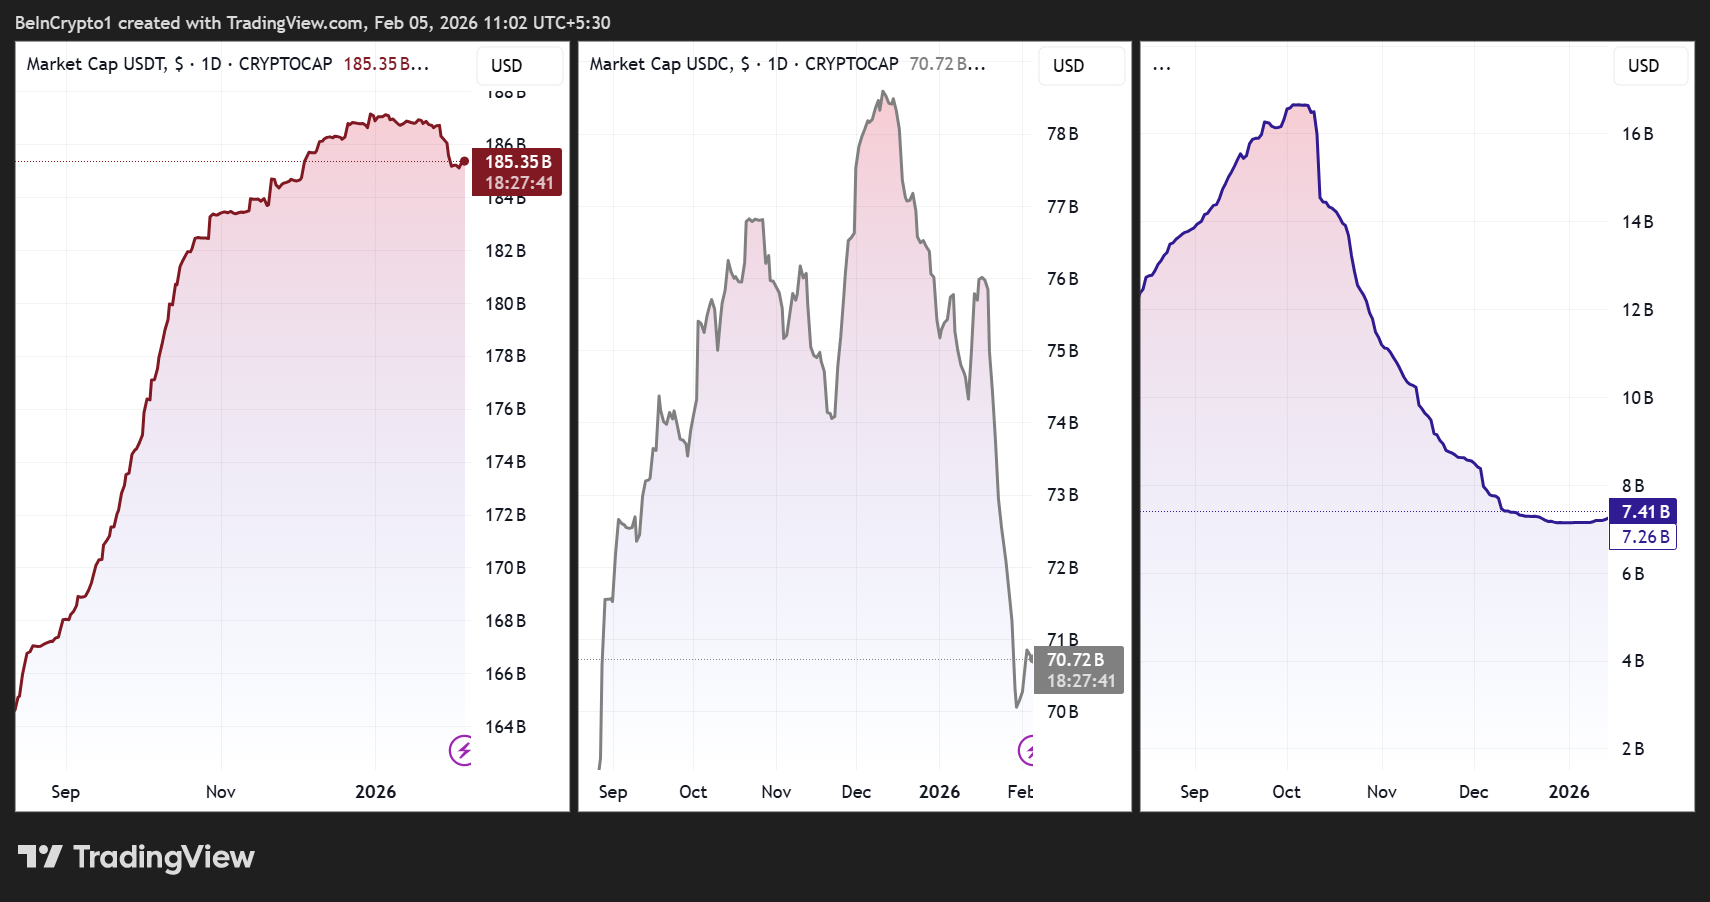
Tether attributes the resilience to demand for savings, payments, and cross-border transfers rather than purely speculative trading.
On-chain metrics cited in the report show rising wallet balances among long-term holders and record transaction volumes.
However, the estimates of total users include both on-chain wallets and approximations of exchange users, making independent verification difficult.
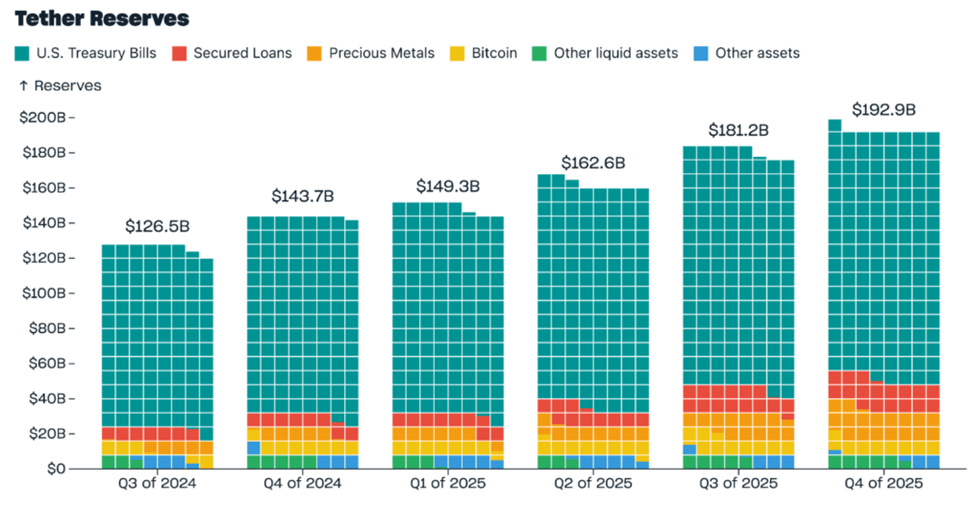
Reserve disclosures also show continued expansion. Total reserves reached $192.9 billion, including $141.6 billion in US Treasuries, a level that would place Tether among the largest Treasury holders globally if it were a country.
Sponsored
Sponsored
The company also increased its Bitcoin holdings to 96,184 BTC and its gold reserves to 127.5 metric tons, reflecting a strategy to diversify collateral beyond cash-equivalent assets.
On-chain activity continued to grow rapidly. The number of USDT holders rose to 139.1 million, while monthly active users reached 24.8 million, both record highs.
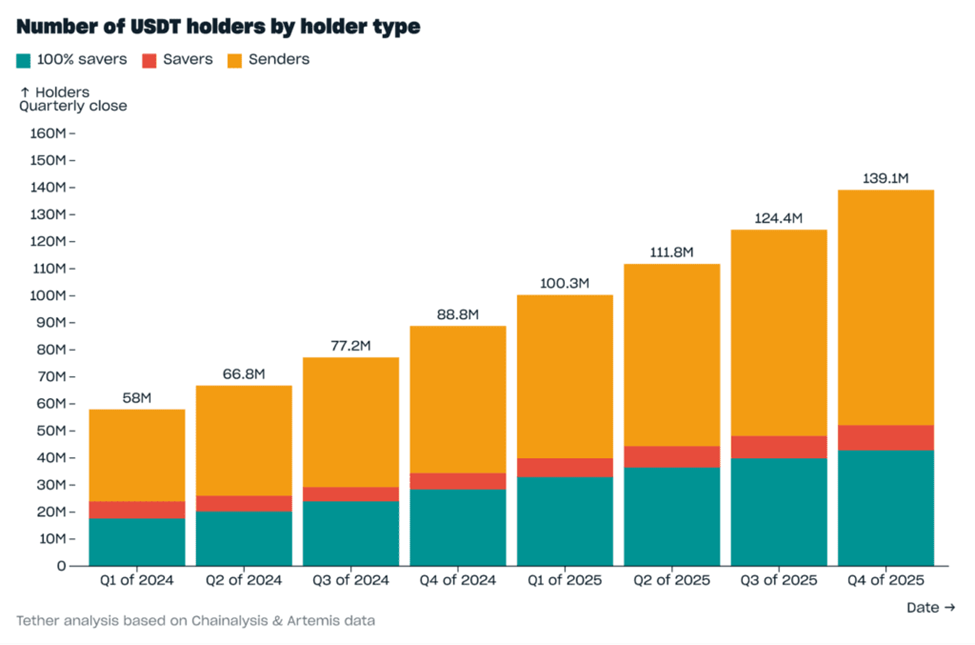
The value transferred on-chain reached $4.4 trillion in Q4, and USDT’s share of spot trading volumes on centralized exchanges climbed to 61.5%. This highlights its role as the dominant settlement asset in crypto markets.
Sponsored
Sponsored
Minting Surge, Peg Wobbles, and Flippening Talk Highlight USDT’s Growing Systemic Role
Recent issuance activity suggests demand has carried into early 2026. On February 4, blockchain analytics account Lookonchain reported that Tether minted $1 billion in USDT, part of roughly $3 billion in stablecoins issued by Tether and Circle over three days.
Large issuances are often interpreted by traders as a signal of incoming liquidity, although newly minted tokens are not always immediately circulated.
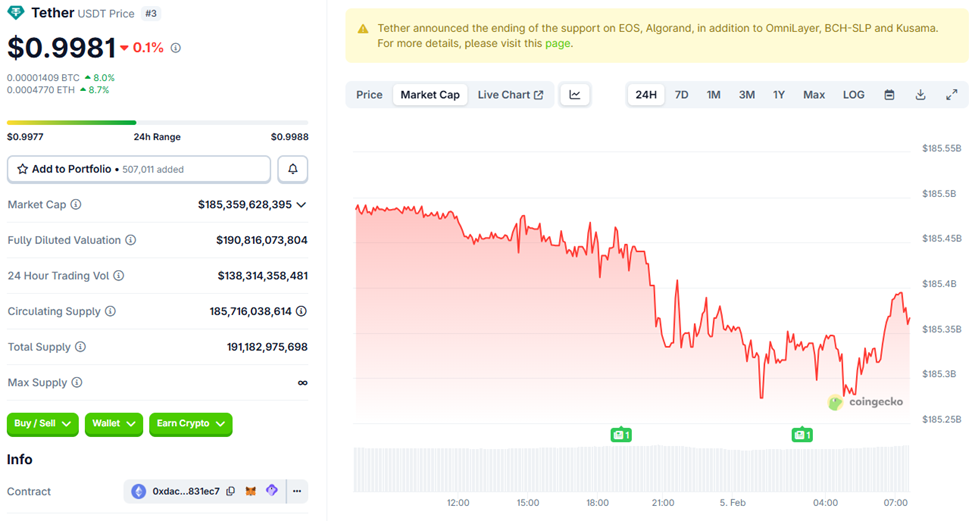
At the same time, Tether’s growing dominance has intensified scrutiny. Market attention briefly turned to USDT’s stability after the token slipped to around $0.9980, its weakest level in more than 5 years.
While the deviation was small and short-lived, any sustained loss of confidence in the peg could have outsized consequences, given the stablecoin’s central role in trading infrastructure.
Sponsored
Sponsored
Market estimates often suggest that most crypto trading volume flows through USDT pairs, making it a critical pillar of liquidity.
The scale of Tether’s expansion has also fueled debate over its place in the crypto hierarchy. Some market observers have speculated that, if current trends continue, USDT could eventually challenge Ethereum’s position as the second-largest cryptocurrency by market capitalization, particularly during prolonged periods of risk aversion when capital rotates into stable assets.
Meanwhile, the latest data shows that USDT is expanding in terms of users, reserves, and transaction volume, even as the broader market contracts.
Yet that same growth is concentrating liquidity and systemic importance in a single instrument. The stability of Tether’s peg is increasingly tied not just to one company, but to the resilience of the crypto market itself.

Hyperliquid price rallied over 20% in the past seven days, reclaiming $40 as support, driven by record commodities trading activity on its perpetual futures markets.
Summary
- Hyperliquid price rose over 20% in a week, reclaiming $40 support amid record trading volumes in commodity perpetual futures like oil and silver.
- Whale activity surged, with over $3.6 billion in leveraged positions boosting liquidity and supporting continued price momentum.
- Bullish technical indicators and strong inflows signal potential upside, with $50 as the next key resistance and all-time highs in focus.
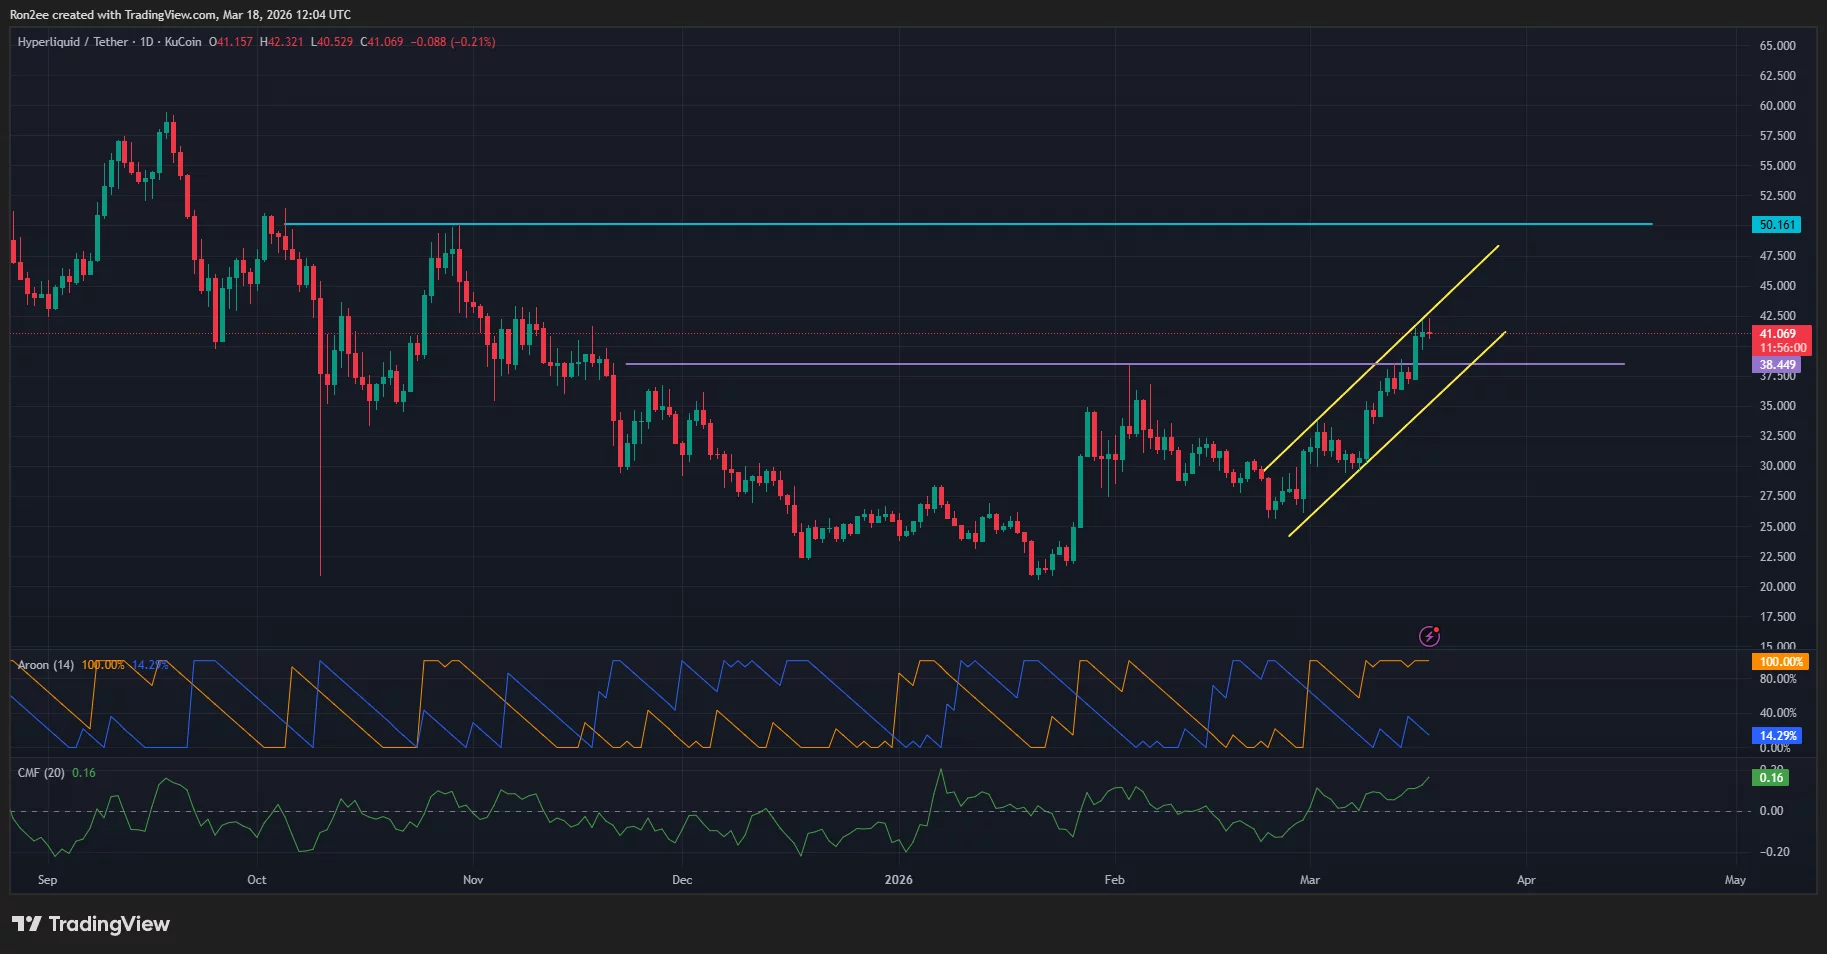
According to data from crypto.news, Hyperliquid (HYPE) price rallied 22% to a four-month high of $42.1 on Wednesday, March 18, before stabilizing around $41.3 at the time of writing. At this price, it remains up over 38% in the past month and 100% above its year-to-date low.
Hyperliquid’s price surge can primarily be attributed to record-breaking activity in commodity perpetual futures, specifically Crude Oil (WTI) and Silver, enabled through its HIP 3 framework.
On-chain data shows that oil-linked perpetual contracts on Hyperliquid surpassed $1.2 billion in 24-hour trading volume, making them the second most traded assets on the platform after Bitcoin.
Another major catalyst supporting HYPE tokens’ gains is the surge in whale activity on the platform. According to recent reports, whales have positioned at least $3.6 billion in positions across its leveraged markets. This, in turn, increased the liquidity and market depth, creating a virtuous cycle for further price appreciation.
Adding another layer of utility, Hyperliquid has become a 24/7 macro barometer for traders seeking to hedge or speculate on oil and metals prices that have soared to record highs amid geopolitical tensions in the Middle East. Traditional markets like the CME and ICE remain closed during weekends and holidays.
Meanwhile, the surge in the platform’s trading fees driven by this commodity frenzy is fueling expectations of increased token buybacks, as the protocol is mandated to use a vast majority of revenue to support the HYPE token via its Assistance Fund.
On the daily chart, Hyperliquid price seems to be rising within an ascending parallel channel pattern, a popular bullish continuation pattern in technical analysis.

Amidst its recent surge, HYPE price has surpassed its Feb. 3 high of $38.4, which had been acting as a stubborn resistance level.
Technical indicators seem to confirm this strength. Notably, the Aroon Up showed a reading of 100% in comparison to a 14.29% reading on its down counterpart, a sign that the uptrend is exceptionally strong and trending toward new highs.
At the same time, the Chaikin Money Flow index showed a positive reading of 0.16. Positive readings on this metric indicate that buying pressure is dominant and that capital is flowing steadily into the asset.
Hence, the path of least resistance for Hyperliquid price suggests a potential rally past the $50 psychological resistance.
A sharp break above this key resistance amid strong bullish momentum could push prices towards its all-time high of $59.30, especially if the ongoing tensions in the Middle East continue to drive traders toward decentralized commodity markets over the coming weeks.
Disclosure: This article does not represent investment advice. The content and materials featured on this page are for educational purposes only.
Crypto World
Solana Price Prediction: DeepSnitch AI Frenzy Takes Over Traders As March 31 Launch Approaches, SOL Challenges $95 and ETH Bulls Eye $2.6K
Two Democratic lawmakers introduced the BETS OFF Act this week, aiming to put an end to insider government information being used in prediction markets related to the US-Iran conflict.
With government officials once again pushing back against prediction markets, the retail sector is primarily focused on the market-wide recovery. The Solana price prediction is gaining a lot of attention as SOL prepares to challenge the $95 resistance, but those looking to achieve higher returns are already rotating into the DeepSnitch AI presale.
Securing $2.2M ahead of its March 31 launch, the DeepSnitch AI community is confident in the project’s 100x-300x potential.

BETS OFF Act to crack down on insider trading
On March 17, Greg Casar and Connecticut Senator Chris Murphy introduced the Banning Event Trading on Sensitive Operations and Federal Functions Act that targets prediction market accounts that place bets that could indicate insider information.
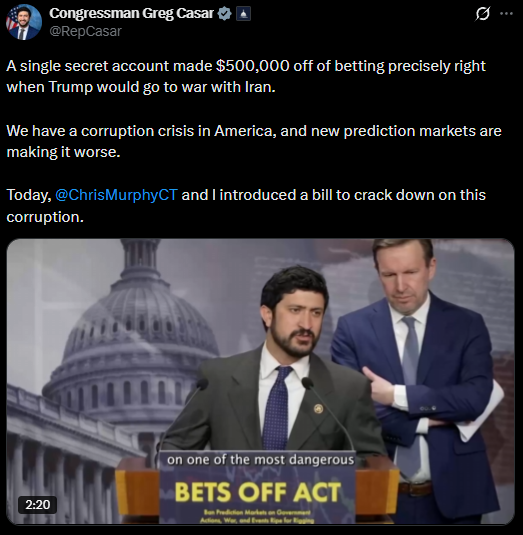
Casar was blunt, saying that decisions about war and peace, life and death, should not be driven by financial positions riding on the outcome.
California Senator Adam Schiff’s DEATH BETS Act, introduced last week (targets event contracts related to war, terrorism, assassination, and individual deaths), which deepened the controversy after a military correspondent received death threats tied to resolving a Polymarket prediction.
Both Polymarket and Kalshi are logging high volumes as they navigate growing regulatory pressure.
Many traders are steering clear of prediction markets, though, and still prefer tracking the Solana price prediction and exploring presale projects like DeepSnitch AI.
Coins you should keep an eye on in March
1. DeepSnitch AI: The highest upside opportunity in 2026?
Although the Solana price prediction is finally showing signs of life, DeepSnitch AI is making rounds due to its unique offering that brings potential gains and solves existing problems for traders.
For starters, the project raised $2.2M at $0.04487, and the trending launch is confirmed for March 31. However, utility is still the star of the show.
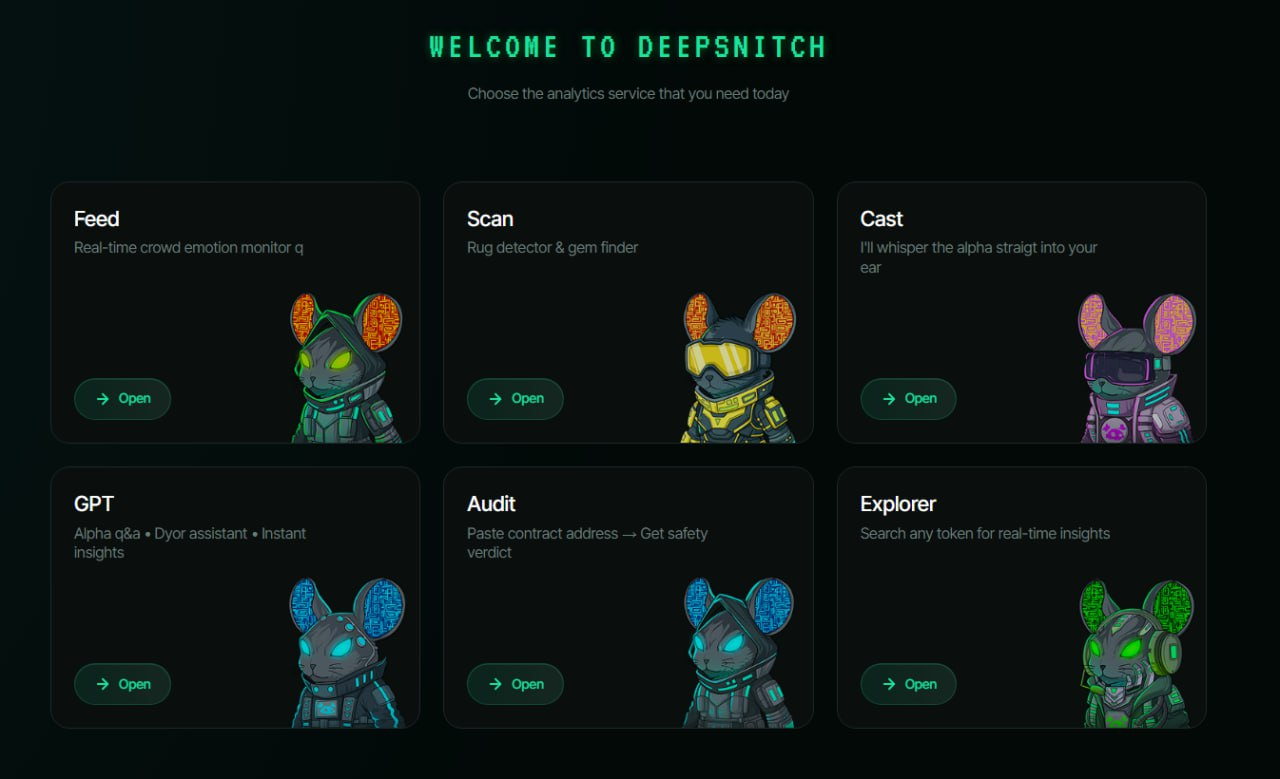
Powered by five AI agents, the analytics platform includes multiple life-saving and advantage-centric features, such as a risk scanner and a real-time sentiment and FUD tracker.
These two alone are worth your time as the risk scanner will help you avoid rug pulls and honeypots, while tracking sentiment assists you in finding the perfect time to exit a position.
Two weeks away from launch, and 41.7 million DSNT tokens have been staked, and with the conviction reaching its pinnacle, traders are convinced the toolset behind the project will lead to mass adoption and ensure the project’s long-term growth.
FOMO for DeepSnitch AI is quickly building as the entry room shrinks and traders continue throwing out 100x-300x predictions, much more than any realistic short-term SOL price target can get you.
2. Solana price prediction: Will SOL close above $95?
According to CoinMarketCap, SOL hovered right below the $95 breakdown level on March 18.
This line will determine the short-term Solana market outlook. Closing above will allow recovery to $117.
Yet, since the bear market has deepened, the Solana forecast 2026 is unlikely to be clear-cut, and SOL will pull back from the test of $117.
If it holds $95 after the breakdown, the bullish case will remain in play, putting the SOL price target at $147.
Those watching the Solana price prediction are also fearing an extended correction, which could happen if SOL plummets below $87.
3. Ethereum price prediction: ETH at $2.4K next?
Ethereum started climbing up from $2.3K on March 18, according to CoinMarketCap.
Similar to the Solana price prediction, ETH is quite close to breaking out, and the consolidation is slowly turning into a bullish crossover.
The path to $2.6K is open, and on the technical level, the $3.45K as the extended target.
Bears could still muck up the chart if the price closes below the 20-day EMA around $2K, as it will likely lead to a decline to $1.9K.
Final words: Maintain the momentum
Despite prediction market warfare deepening on a regulatory level, the last few days were surprisingly bullish for traders. The Solana price showing potential is one of the clearest signs, for instance.
However, volatility could still come back to erase the gains, which is why the best way to maintain the bullish momentum is to capitalize on DeepSnitch AI’s March 31 launch.
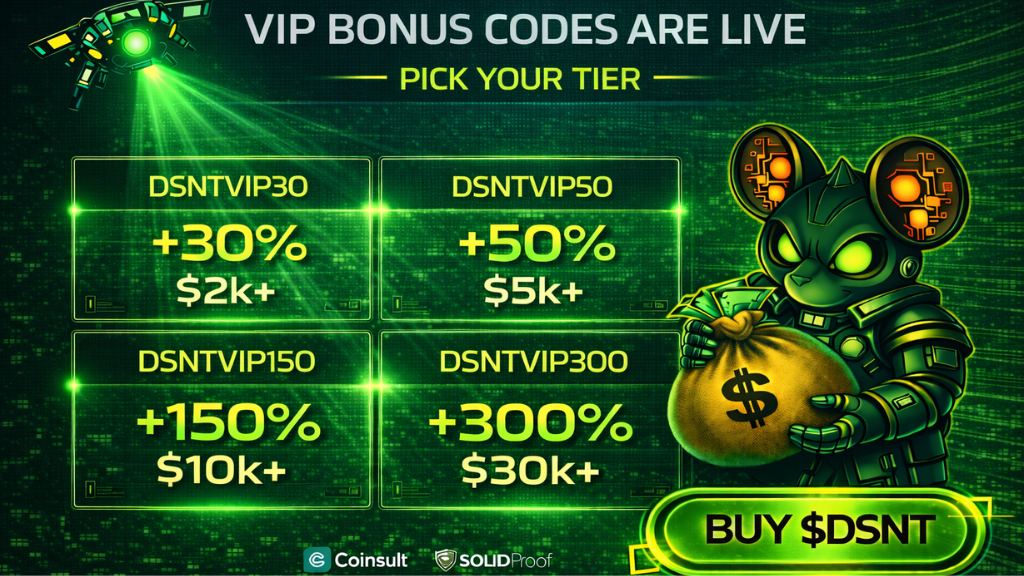
You can even take it a step beyond and go for bullish wins by participating in the exclusive bonus program (applicable until TGE) and apply DSNTVIP300 at your $30K+ allocations to unlock 300% extra tokens.
Make this count – join the DeepSnitch AI presale and become a part of the community discourse on X or Telegram.
FAQs
1. What is the Solana price prediction, and what levels matter most right now?
SOL is pressing the critical $95 resistance level. A clean break above it targets $117 first, then $147 if $95 holds on any pullback.
2. What is the BETS OFF Act, and what does it mean for prediction markets?
The BETS OFF Act is legislation introduced by Representative Greg Casar and Senator Chris Murphy targeting prediction market accounts that allegedly used insider government information to bet on the US-Iran conflict.
3. Why is DeepSnitch AI grabbing attention right now?
DeepSnitch AI has announced a March 31 launch, and since the project offers a unique approach to AI-sourced trading analytics and provides daily usability, traders are anticipating the project to pump by 100x-300x.
The post Solana Price Prediction: DeepSnitch AI Frenzy Takes Over Traders As March 31 Launch Approaches, SOL Challenges $95 and ETH Bulls Eye $2.6K appeared first on Blockonomi.
Crypto World
Dogecoin Price Prediction Turns Bullish, but Smart Money Is Moving to Pepeto for the Returns That DOGE Cannot Deliver, Here is Why
Peter Brandt believes Ethereum might have bottomed out at $2,300, targeting $4,000. The dogecoin price prediction for 2026 has turned bullish as DOGE reclaims its footing after months of correction.
But while the dogecoin price prediction plays out from a $15 billion cap, the wallets building real wealth have moved to early projects with room for exponential growth.
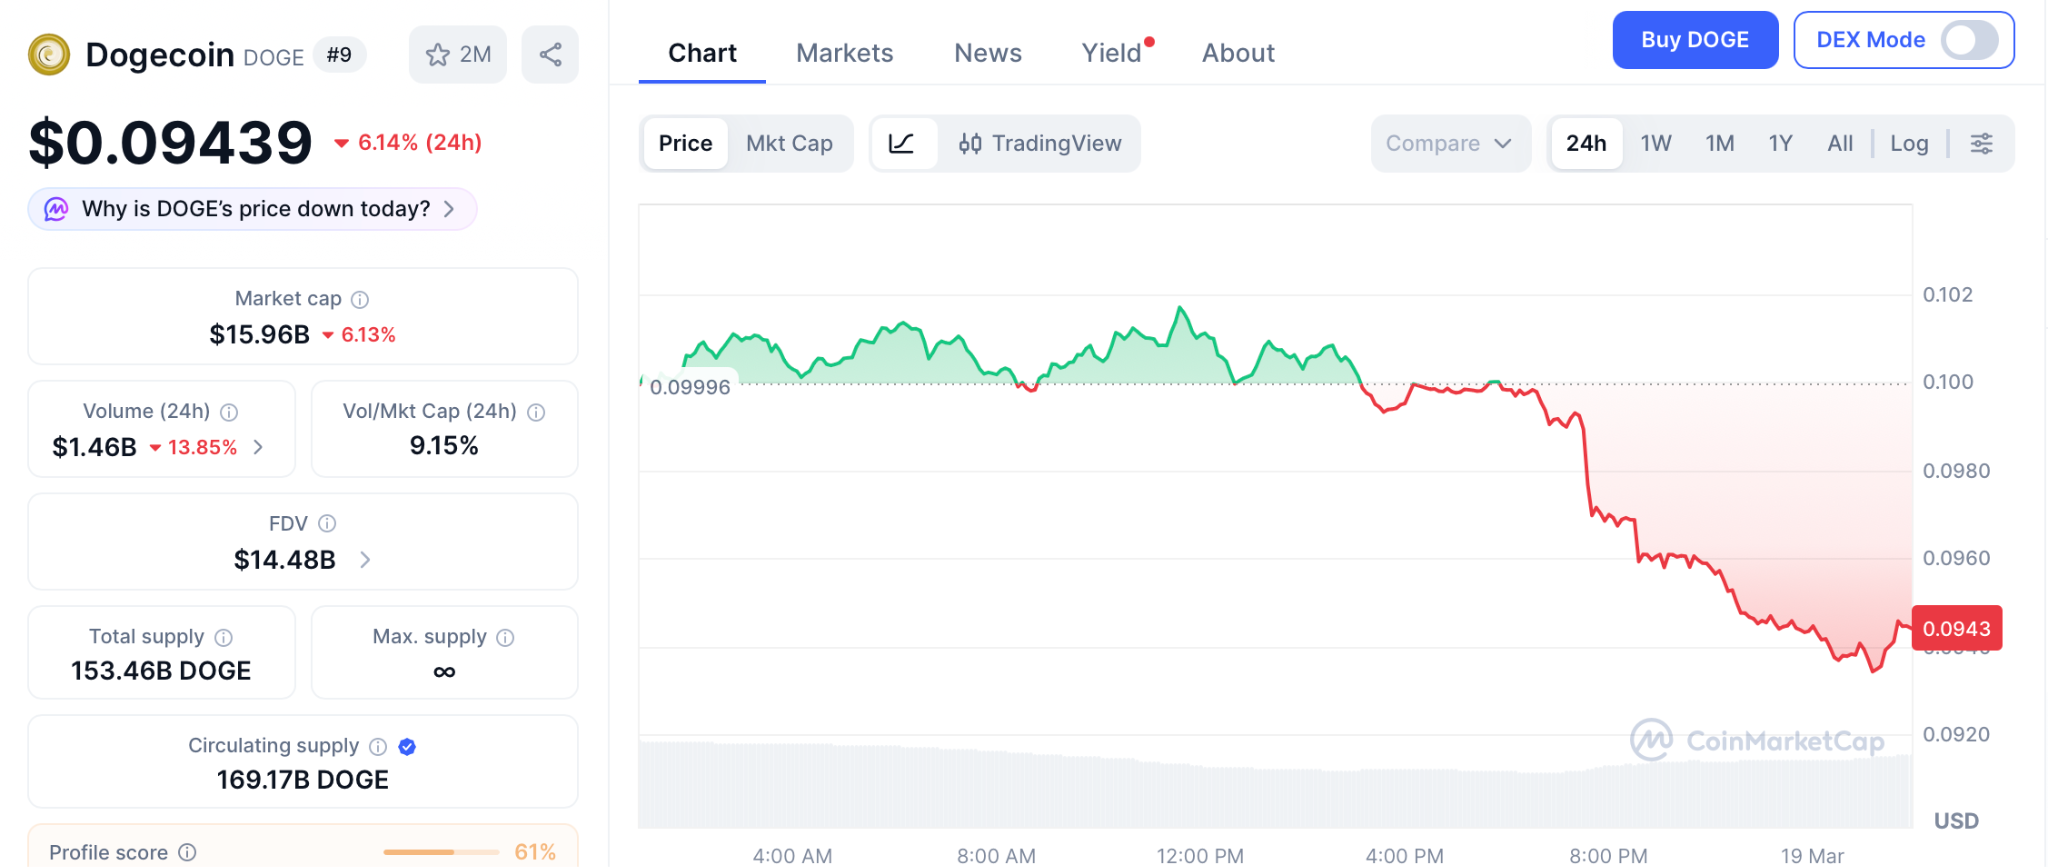
According to analyst ARI ZAIM, the Dogecoin price has been trading inside a descending channel since September, and a breakout could push the price to $0.116 according to CoinGecko.
In the long run, ARI ZAIM expects the Dogecoin price to rally to $0.280. DOGE climbed 5.9% on the weekly timeframe to $0.100, and the 200 SMA at $0.152 is the next major target according to CoinGecko. The dogecoin price prediction is building on real signals, but even the bullish case delivers growth measured in percentages from $15 billion.
Dogecoin Price Prediction and the Early Projects With 100X Potential Before Their Listings Arrive
Smart Money Is Tapping Into Pepeto While the Dogecoin Price Prediction Plays Out Slowly at $15 Billion
While some investors are still watching the dogecoin price prediction move candle by candle, the wallets building real wealth have moved into early projects with room for exponential growth. One project pulling that capital is Pepeto. It has attracted a growing community of holders with its zero fee exchange and cross chain tools, raising more than $8.1 million in presale funding.
The token is priced at $0.000000186, giving every new holder an entry that large cap meme coins stopped offering years ago. The Pepeto token is central to the entire ecosystem. Holders earn 196% APY staking rewards that compound daily, and the token powers every transaction across PepetoSwap. With a 420 trillion supply matching Pepe and three working products built, this token could deliver the kind of returns the dogecoin price prediction simply cannot promise from $15 billion.
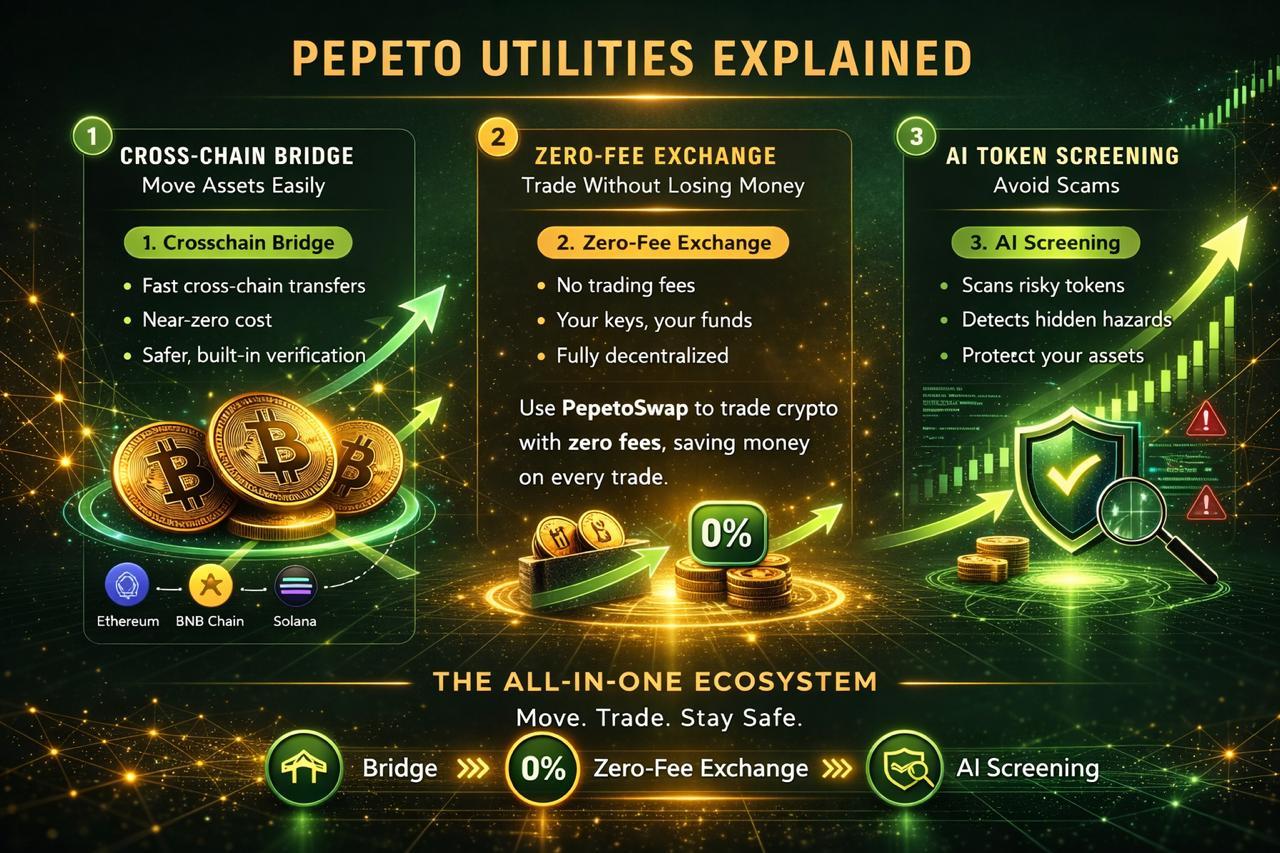
Holders who enter the Pepeto ecosystem get access to three tools that work together. PepetoSwap handles every trade at zero cost, the bridge moves tokens across Ethereum, BNB Chain, and Solana for nothing, and the risk scorer flags dangerous contracts before your capital goes near them. Together, they form a complete trading layer that protects your money, moves it across chains, and scores every new token before you decide to enter.
The SolidProof audit was completed before the presale opened, the cofounder of the original Pepe coin leads the project, and the Binance listing is approaching. Given the working tools, the original team, and an entry that disappears at listing, Pepeto might be the early project that delivers returns Pepeto offers far more than the dogecoin price prediction delivers in 2026.
Dogecoin Price Prediction: DOGE Targets $0.116 Breakout With $0.280 as the Long Term Goal
DOGE trades at $0.094 with a $15.96 billion market cap according to CoinMarketCap. The descending channel breakout targets $0.110, and if buying pressure holds, the long term target sits at $0.280.
Technical analysis shows bulls gaining control with the RSI climbing.
Monad Approaches Two Month Resistance but Needs a Clear Breakout Above $0.025
Monad climbed 10.2% on the weekly chart to $0.024 and now it’s trading around $0.023, approaching a two month resistance at $0.025 according to CoinGecko.
The RSI at 68 shows buying pressure building. A break above could open a path to $0.030, but unproven fundamentals and low liquidity make it speculative.
A Bullish Dogecoin Price Prediction Offers Comfort but Imagine What Pepeto Does After It Actually Lists on Binance
A bullish dogecoin price prediction is comforting after a correction, but the real energy has shifted toward early projects like Pepeto that offer tools DOGE never built and an entry price DOGE can never offer again. Pepeto has raised over $8.1 million while the market corrected, proving that capital flows into real products even when the Fear Index sits at 37.
Imagine how far it goes after the Binance listing puts it in front of millions of traders who have never seen it.
Click To Visit Pepeto Website To Enter The Presale

FAQs
What is the dogecoin price prediction for 2026?
The dogecoin price prediction shows a breakout to $0.110 with a long term target of $0.280 based on the descending channel pattern.
Why are dogecoin price prediction followers looking at Pepeto?
DOGE at $15 billion delivers percentages. Pepeto is still in presale with a Binance listing approaching and 196% APY staking live.
Is Pepeto a good early project to buy before the listing?
More than $8.1 million raised, SolidProof audit, original Pepe coin team, and working tools built. Visit the Pepeto official website.
The post Dogecoin Price Prediction Turns Bullish, but Smart Money Is Moving to Pepeto for the Returns That DOGE Cannot Deliver, Here is Why appeared first on Blockonomi.


Bitcoin slips to $72.3k as the Strait of Hormuz conflict spikes oil, U.S. inflation runs hot, and traders slash Fed cut bets, pressuring crypto and stocks.
Summary
- Strait of Hormuz closure sends oil above $100, adding fresh inflation pressure before it even hits official data.
- Hot U.S. PPI print forces traders to reprice 2026 Fed cuts, pushing equity futures and Bitcoin lower in a correlated risk-off move.
- Elevated energy prices, sticky core inflation and an entrenched Gulf conflict leave the near-term path for crypto and other risk assets highly uncertain.
Cryptocurrency markets came under sharp pressure on Wednesday as two converging macro forces — an escalating military conflict centered on the Strait of Hormuz and a worse-than-expected U.S. inflation print — sent Bitcoin tumbling to approximately $72,300, a 24-hour decline of roughly 2%. Ethereum, Solana, and XRP each fell close to 3%, dragging the broader digital asset market into a broad risk-off retreat that also hit equity futures.
The geopolitical backdrop has been deteriorating since late February, when U.S. and Israeli forces launched coordinated strikes on Iran — killing Supreme Leader Ali Khamenei — triggering retaliatory missile campaigns across Gulf states and an effective closure of the Strait of Hormuz by Iran’s Islamic Revolutionary Guard Corps. As of mid-March, tanker traffic through the strait had dropped by approximately 70%, with over 150 vessels anchored outside the chokepoint. The IRGC has since confirmed more than 21 attacks on merchant ships, and Iran’s new supreme leader, Ayatollah Mojtaba Khamenei, has vowed to maintain the blockade, with the IRGC navy pledging to deliver “the harshest blows” to enforce it.
The disruption of the Strait of Hormuz — through which roughly 15% of global oil supply transits — has sent energy prices soaring. On Wednesday, Brent crude broke above $104 per barrel, rising 3.22% intraday, while WTI crossed $97 per barrel. The spike compounds an already difficult inflation environment.
Data released Wednesday morning by the U.S. Bureau of Labor Statistics showed that the Producer Price Index rose 0.7% month-on-month in February, more than double the consensus forecast of 0.3%. Core PPI — which strips out food and energy — climbed 0.5% MoM against an expected 0.3%, and rose 3.9% year-on-year. Critically, these figures do not yet reflect the surge in oil prices triggered by the Hormuz closure, meaning the inflationary pipeline is likely to worsen in coming months.
The report follows a February CPI reading that held steady at 2.4% year-on-year, but with core PCE — the Federal Reserve’s preferred gauge — estimated at approximately 3.1%, well above the central bank’s 2% target. Capital Economics noted ahead of Wednesday’s PPI release that preliminary estimates already pointed to a “much firmer rise in the core PCE deflator.”
For markets, the implications are stark. Traders have now materially reduced bets on Federal Reserve rate cuts in 2026, and S&P 500 and Nasdaq 100 futures widened their declines to 0.5% following the PPI release. The CBOE Volatility Index (VIX) climbed 1.22 points to 23.59, reflecting rising investor anxiety ahead of the Fed’s rate decision later this week.
Bitcoin, which had been testing resistance near $74,000 in recent sessions, proved unable to hold those levels against the twin headwinds. The asset’s correlation with risk assets such as equities has reasserted itself sharply, undermining near-term narratives around its use as an inflation hedge. The Fed’s policy meeting and Chair Powell’s anticipated remarks on growth risks and price stability will now be closely watched for any signal that could shift the current trajectory.
With oil prices elevated, inflation proving stickier than models anticipated, and a military conflict showing no signs of de-escalation, the path of least resistance for risk assets — crypto included — remains uncertain at best.
The Algorand Foundation, the organization behind the Algorand layer-1 blockchain, said it had made the “difficult decision” to reduce its headcount by 25% on Wednesday, blaming the crypto slump and wider uncertainty.
“This decision was not taken lightly and is in response to the uncertain global macro environment as well as the broader downturn in crypto markets,” the Algorand Foundation said in an X post.
The Algorand Foundation said the affected employees were “best-in-class contributors” and described the decision as “incredibly tough,” adding that it would support staff through the transition.
“We believe that we now have a more sustainable alignment of Algorand Foundation resources with the protocol’s long-term business, technology, and ecosystem priorities,” the foundation added.
Algorand Foundation is gearing up for a big year ahead
The staff cuts come as the Algorand Foundation prepares for several milestones for the year ahead, including the next major release of its developer toolkit AlgoKit, the launch of the user-friendly Rocca Wallet, the development of a more robust commercial toolkit, and a focus on post-quantum security.

The Algorand Foundation said in its roadmap progress report in December 2025 that it made “significant progress” toward greater decentralization, having increased Algorand’s (ALGO) online stake from approximately 1 billion to 2 billion ALGO in just over a year.
The crypto industry has a history of cutting staff during market downturns. Bitcoin (BTC) is trading at $71,067 — 44% below its October all-time high of $126,000 — after falling as low as $60,000 on Feb. 6, according to CoinMarketCap.
Related: SEC Chair explains why NFTs fall outside of securities laws
Bullish CEO Tom Farley recently predicted that the crypto sector could see more projects acquired by larger firms in the coming months, potentially leading to redundancies, layoffs, and internal restructuring.
Meanwhile, on Monday, blockchain data provider Messari announced a series of layoffs while its CEO, Eric Turner, stepped down to make way for the company’s “next phase” as an AI-first company.
During the 2022 bear market, Coinbase reduced its workforce by around 18% as Bitcoin hit two-year lows near $21,000. Around the same time, Gemini, the trading platform founded by the Winklevoss twins, reportedly cut 10% of its staff amid the broader crypto slump.
More layoffs could follow if history repeats, with veteran trader Peter Brandt predicting the crypto market may not reach its bottom until the third quarter of this year.
Magazine: Big Questions: Can Bitcoin save you from the dreaded Cantillon Effect?

Fold, the Bitcoin-focused payments and financial services firm, delivered an 8% sequential revenue gain in Q4, reaching $9 million as it added roughly 2,000 customers and expanded an array of products designed to weave Bitcoin rewards into everyday spending. The company also rolled out its Fold Bitcoin Rewards Credit Card, a Visa– and Stripe-enabled offering that promises Bitcoin-backed cashback to users and points toward broader consumer adoption of crypto-native rewards.
During Fold’s Q4 and 2025 full-year earnings call, CEO Will Reeves framed the results within a longer-term outlook: “Bitcoin rewards will overtake the airline miles as the preferred consumer reward in the US.” He emphasized that for this vision to translate into mass adoption, the card programs must scale to millions of cardholders and be supported by stronger risk and fraud controls before the model can really “open the floodgates.”
Fold’s earnings also underscore the competitive landscape in crypto rewards. With rivals including Coinbase, Gemini, Swan Bitcoin and River Financial already piloting Bitcoin-backed card programs in the US, Fold is betting on scale and product breadth to capture a larger share of a nascent but rapidly evolving market.
Nevertheless, the quarterly improvement did not erase a tough year on the metrics side. Fold reported a 3% year-over-year decline in transaction volume to $215 million, and an operating loss of $6 million for the period. Those figures contributed to a full-year 2025 net loss of $69.6 million, according to Fold’s financial statements. The company said the results reflect ongoing investments to build out a Bitcoin-native financial services ecosystem across multiple product lines, including consumer and enterprise offerings.
In a nod to its evolving capital structure, Reeves noted that Fold had extinguished two outstanding convertible debt instruments, describing the move as removing a structural overhang and directing financing toward growth initiatives rather than debt management. He outlined a plan for 2026 built around customer acquisition, engagement, cross-sell, and retention—the core levers the company believes will scale its Bitcoin-focused platform.
Beyond consumer products, Fold has been building a broader ecosystem around Bitcoin payrolls, bonuses, and corporate financial programs through Fold for Business. One notable partner cited by Fold is Steak ’n Shake, which has explored paying employees in Bitcoin and offering Bitcoin-based bonuses as part of its compensation mix. This line of effort reflects Fold’s strategy to embed Bitcoin more deeply into corporate payroll and benefits workflows, broadening the utility of the token beyond speculative holding into everyday financial operations.
On the balance sheet side, Fold has pursued a strategy of maintaining a Bitcoin treasury as a strategic asset. Yet the company has been reducing its holdings, with its treasury down to 827 BTC as of March 17, from 1,527 BTC at the end of last year. The reduction mirrors a broader trend of concentrated crypto treasuries being deployed for operating needs or risk management, and it adds a layer of complexity for investors watching Fold’s capital efficiency and liquidity alongside its growth ambitions.
Key takeaways
- Q4 revenue rises 8% to $9 million as Fold adds about 2,000 customers and expands Bitcoin-linked products, including a newly launched Bitcoin Rewards Credit Card.
- CEO Will Reeves frames Bitcoin rewards as a potential US consumer reward leader, contingent on scaling to millions of cardholders and tightening risk controls.
- Strategic shifts accompany growth: Fold extinguishes two convertible debt instruments to reduce financial overhang and focuses 2026 on scaling customer engagement and cross-sell opportunities.
- Financials show a divide between growth investments and bottom-line pressure: 2025 saw a 3% YoY drop in transaction volume to $215 million and a net loss of $69.6 million, despite revenue gains.
Fold’s expansion into Bitcoin rewards and enterprise tooling
With the Fold Bitcoin Rewards Credit Card now live, the company is aiming to convert consumer spending into Bitcoin accrual at a scale that could rival existing reward ecosystems. The card’s integration with Visa and Stripe signals an attempt to remove friction for mainstream users who want crypto rewards alongside familiar payment rails. Reeves stressed that a successful rollout hinges on risk and fraud controls that can withstand mass adoption, hinting at a compliance-first approach as a prerequisite to broader consumer rollout.
Fold’s product suite has grown beyond consumer cards. Fold for Business is designed to bring Bitcoin into payrolls, bonuses, and corporate programs, signaling a push to embed Bitcoin rewards into business workflows. Partnerships such as Steak ’n Shake illustrate a real-world test bed for how crypto incentives can translate into employee compensation and consumer engagement, a pattern other operators are watching closely as a potential model for corporate crypto compensation programs.
The competitive backdrop adds urgency. Fold sits among a growing cadre of platforms experimenting with Bitcoin-friendly cards and rewards structures, as consumer interest in crypto-backed perks persists even as the macro environment remains uncertain. The broader market’s willingness to embrace Bitcoin rewards will hinge on the reliability of issuers’ risk controls, the efficacy of KYC/AML processes, and merchants’ willingness to participate in crypto-native cashback arrangements.
Financials in focus: growth, losses, and a restructured balance sheet
On the surface, Fold’s Q4 and full-year results underline a company investing aggressively to build a broader, Bitcoin-native financial services stack. Revenue rose by 8% in the quarter, aided by new customer acquisitions and product expansion. Yet the year delivered pressure on the top line’s profitability. The company reported a 3% YoY decline in transaction volume to $215 million and an operating loss of $6 million for the period, contributing to a full-year net loss of $69.6 million for 2025.
Corporate leadership framed these numbers as the cost of building a platform tuned for scale. The extinguishment of two convertible debt instruments was presented as a turning point, eliminating a structural overhang and steering capital toward operating growth rather than financing costs. In Reeves’ words, the pathway to 2026 centers on “scaling what we’ve built across customer acquisition, engagement, cross-sell, and retention.”
From an investor relations perspective, the balance between growth investments and financial discipline remains a watch item. Fold’s ability to translate product expansion into durable, cross-sell-driven revenue will be critical, particularly as it expands into enterprise services and payroll-related offerings that could yield higher-margin revenue streams if customer adoption aligns with retention targets.
Bitcoin treasury dynamics and market reception
One notable tension in Fold’s narrative is its shrinking Bitcoin treasury. The firm’s holdings declined to 827 BTC by March 17, from 1,527 BTC at year-end, a move that has implications for both liquidity and crypto exposure management. For a company whose value proposition centers on Bitcoin-native financial services, treasury management will remain a focal point for investors who monitor balance sheet discipline alongside growth metrics.
Fold’s stock has experienced significant volatility in 2026. Data from Google Finance shows FLD down 59% year-to-date and 83.8% over the last 12 months. The company reported an after-hours surge of about 13% following earnings, only to retreat and trade around $1.07 in the subsequent session, underscoring the market’s sensitivity to both operational updates and the broader crypto funding environment.
Against this backdrop, Fold’s emphasis on Bitcoin as both an asset and a core enabler of product strategy resonates with a broader market narrative: if consumer demand for crypto rewards can be monetized at scale, a few high-quality, risk-managed programs could begin to shift mainstream consumer behavior toward crypto-augmented spending. Yet the path remains contingent on execution, risk controls, and the pace at which enterprise and consumer adoption outstrip ongoing losses.
Broader implications for crypto rewards and the consumer fintech landscape
Fold’s quarter signals a broader industry testing ground: can Bitcoin-powered rewards move from a niche product to a mainstream consumer feature? Reeves’ assertion that Bitcoin rewards could overtake airline miles points to a potential realignment of reward economics, but it requires durable merchant participation, transparent risk management, and predictable redemption dynamics. The presence of established players in the space suggests that competition will intensify, compelling Fold to demonstrate superior value through cross-sell, retention, and merchant partnerships.
Regulatory and macro factors will also shape the trajectory. As crypto-native financial services mature, issuers will need to navigate evolving oversight around consumer protections, data security, and anti-fraud controls. Fold’s emphasis on building a compliant, scalable backbone could position it favorably if it can align product milestones with rigorous risk management, especially as it expands Fold for Business and enterprise-facing offerings that bring Bitcoin into everyday corporate workflows.
In this evolving landscape, investors will be watching not only the headline revenue gains but also the quality of growth: how quickly Fold can transform user acquisition into durable engagement, how efficiently it can monetize via cross-sell across product lines, and whether treasury management can support a sustainable capital structure during an era of rapid product experimentation in crypto rewards.
For readers, the coming months will reveal how a Bitcoin-native financial services ecosystem can translate ambition into measurable scale. Watch for quarterly updates on customer growth, card activation and spend, enterprise adoption of Fold for Business, and any further refinements to risk and fraud controls that could unlock broader consumer uptake.
What remains uncertain is how quickly the market will normalize around crypto-native rewards as a mainstream consumer feature and how Fold’s strategic pivots translate into profitability. If the company can demonstrate that its product suite yields meaningful cross-sell momentum and improved capital efficiency in 2026, the roadmap may start to look less like a bet on early adopter enthusiasm and more like a blueprint for a durable, Bitcoin-centered fintech platform.
Looking ahead, Fold’s path will hinge on its ability to scale its card program, strengthen risk frameworks, and convert enterprise engagements into recurring revenue while maintaining prudent treasury management. The coming quarters should reveal whether the “Bitcoin-native” advantage can translate into durable, broad-based adoption or remain a defining but contested niche in the crypto rewards landscape.
Nasdaq has been given the regulatory green light to offer some tokenized stocks, which will trade alongside traditional securities on its exchange.
The US Securities and Exchange Commission on Wednesday approved Nasdaq’s pilot proposal to support the trading of tokenized versions of stocks and other securities.
Nasdaq first filed its proposal in September that sought to allow trades on high-volume stocks in either a traditional or tokenized form on the same exchange in a pilot with the key market infrastructure firm, Depository Trust Company.
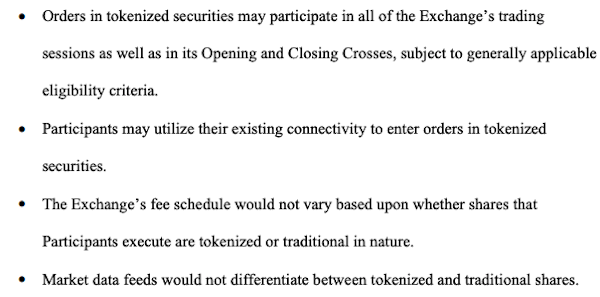
The tokenized stocks would trade alongside their traditional counterparts on the same order book, at the same price, with the same ticker and identifying number and carry the same rights.
Tokenization, where an asset is represented on a blockchain, has seen a recent boom as major financial firms have tested the technology to shrink settlement times and experiment with longer trading hours.
Eligible participants can trade top tokenized stocks
According to the SEC’s approval filing, only “eligible participants” are to take part in the tokenization pilot and can choose whether to trade a traditional or tokenized stock.
The options for tokenized stock are limited to securities that trade in the Russell 1000 Index, which tracks the 1,000 largest publicly-traded companies in the US by market capitalization, along with exchange-traded funds tracking the S&P 500 and Nasdaq-100 indices.

The SEC noted the Nasdaq’s proposal received feedback with concerns around market surveillance and diverging prices, which it said was later allayed by an amendment laying out more details.
Related: SEC’s ‘Crypto Mom’ calls for simpler disclosure rules, flags tokenization debate
The approval comes after the Nasdaq announced earlier this month that it had partnered with crypto exchange Kraken to allow its clients to move securities from its infrastructure to tokenized versions that can be used on blockchains and to allow public companies to create and issue their own tokenized shares.
New York Stock Exchange owner the Intercontinental Exchange has also set its sights on tokenization, and invested in crypto exchange OKX in early March to launch tokenized stocks.
SEC Chair Paul Atkins said on Tuesday that the agency would soon be seeking public comment on a range of crypto-related exemptions, including a “fundraising exemption” to allow some securities involving crypto to raise a set amount in any 12-month period while being exempted from registering under securities laws.
Magazine: Can Robinhood or Kraken’s tokenized stocks ever be truly decentralized?


Stripe and Paradigm launch Tempo’s mainnet and the Machine Payment Protocol, targeting high-speed, stablecoin-based payments for AI agents and global enterprises.
Summary
- Stripe- and Paradigm-incubated Tempo launches its payments-focused Layer 1 mainnet with no native gas token, settling fees in major stablecoins instead.
- The new Machine Payment Protocol aims to standardize machine-to-machine and AI agent payments, positioning Tempo as settlement rail for an “AI-native” economy.
- Tempo targets cross-border payments and B2B flows with ISO 20022 compliance, EVM compatibility, and early interest from firms like Klarna, Visa, Nubank, and Shopify.
After months of anticipation following a public testnet deployment in December 2025, Tempo — the payments-focused Layer 1 blockchain incubated by payments giant Stripe and crypto venture firm Paradigm — officially launched its mainnet on Wednesday. The announcement, made via official channels, was accompanied by the simultaneous release of the Machine Payment Protocol (MPP), an open standard for autonomous machine-to-machine transactions co-developed by Stripe and Tempo. The dual launch marks one of the most significant entries of a traditional fintech heavyweight into blockchain infrastructure to date.
Tempo has been positioned from inception as a purpose-built alternative to general-purpose chains like Ethereum or Solana, targeting the specific demands of high-frequency, real-world payments. According to Paradigm’s own documentation, the chain is designed to process tens of thousands of transactions per second with sub-second deterministic finality — performance comparable to, or exceeding, traditional card networks. Unlike most blockchains, Tempo does not require a native token to pay gas fees; instead, users can settle transaction costs in any major stablecoin via an integrated AMM, using the TIP-20 standard. No token is being issued at launch, with the team citing the need for greater regulatory clarity before any such move.
The MPP’s release is arguably the more forward-looking element of Wednesday’s announcement. Developed jointly with Stripe, the protocol establishes an open standard for payments between machines — software agents, AI systems, and automated processes — without requiring human intermediaries. As AI agents increasingly execute real-world commercial tasks autonomously, proponents argue that a dedicated payment rail becomes essential infrastructure. Tempo’s architecture was explicitly designed with this use case in mind, with Stripe’s CEO previously describing the chain as a “decentralized, internet-scale SWIFT” for next-generation settlement.
The practical scope of Tempo’s ambitions is substantial. Stripe processed $1.9 trillion in total payment volume in 2025, a 34% year-on-year increase, while global stablecoin volumes doubled over the same period to $400 billion, with 60% now attributable to B2B activity. Tempo targets the $190 trillion annual cross-border payment market, where traditional correspondent banking can impose settlement delays of one to three days and unpredictable fees. The chain’s ISO 20022 compliance — the international financial messaging standard used by banks — is designed to allow enterprises to integrate with existing reconciliation systems without wholesale infrastructure overhauls.
Early ecosystem commitments have been notable. Klarna announced plans to launch a stablecoin on Tempo’s mainnet, while Visa, Nubank, and Shopify were cited among early adopters during the testnet phase. Developers can build on Tempo through public RPC endpoints, with the chain’s EVM compatibility lowering the barrier for teams already familiar with Ethereum tooling.
The mainnet launch arrives at a moment of acute market turbulence, with crypto and risk assets broadly under pressure from geopolitical tensions and resurgent inflation. Yet for Tempo, the timing may be immaterial — its proposition is structural rather than speculative, betting that the next wave of blockchain adoption will be driven not by token appreciation, but by settlement infrastructure that actually works at scale.

PI sellers return in force and threaten to reverse most of the recent gains.
PI Network (PI) Price Predictions: Analysis
Key support levels: $0.15
Key resistance levels: $0.20, $0.28
PI Turns Bearish
With the bullish momentum gone, sellers have returned and have been extremely aggressive, pushing the price under 20 cents this week. Since the recent top at around 30 cents, the price has dropped by over 40%!
The spike above the 28-cent resistance was short-lived and turned into a bull trap since the price failed to hold there and quickly reversed course. This was a key weakness signal that encouraged sellers to push harder and the price gave in soon after.
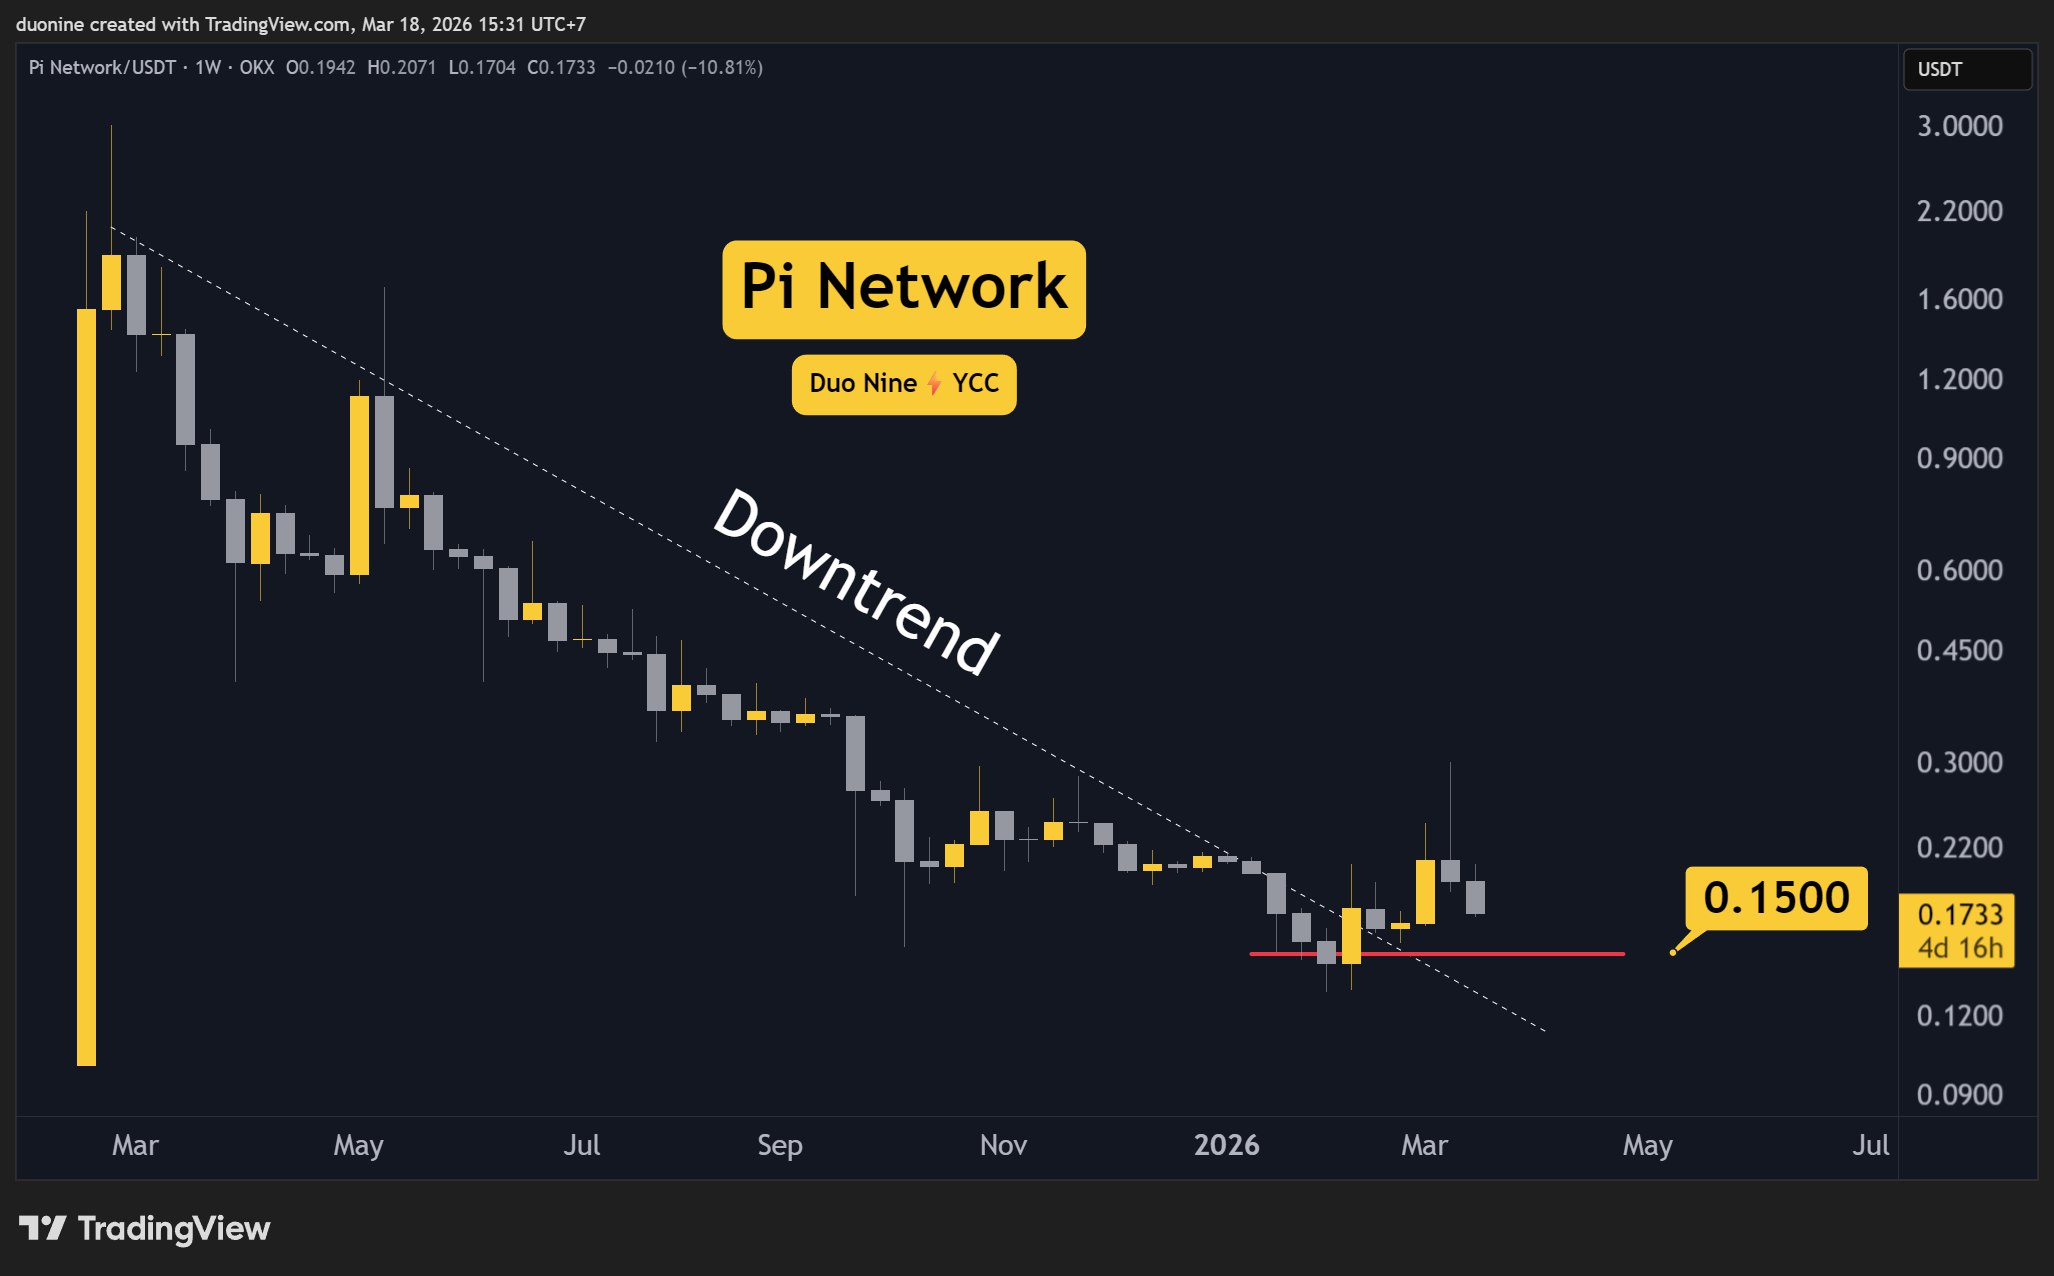
Sell Volume Spiked
During the recent rally, the sell volume spiked, which was a key reversal signal. Since then, the price has been making lower highs and lower lows. The most likely support level to stop this downtrend is at 15 cents.
It is critical for PI bulls to defend the $0.15 support, as any failure there would erase all recent gains and even open the way for new lows later on. In the near future, this support is likely to be tested. Wait for that moment to gain insights into where PI will be headed next.

Daily MACD Turned Bearish
Another key signal that momentum was shifting bearish was seen on the daily MACD, which turned negative last Sunday. Since then, the downtrend has intensified, and there are no signs that it will stop anytime soon.
Keep a close eye on the support at 15 cents for any possible reversal. An early signal would be if the daily MACD histogram stops making lower lows. That would indicate sellers are becoming exhausted, and buyers have an opportunity to return.

Binance Free $600 (CryptoPotato Exclusive): Use this link to register a new account and receive $600 exclusive welcome offer on Binance (full details).
LIMITED OFFER for CryptoPotato readers at Bybit: Use this link to register and open a $500 FREE position on any coin!
Disclaimer: Information found on CryptoPotato is those of writers quoted. It does not represent the opinions of CryptoPotato on whether to buy, sell, or hold any investments. You are advised to conduct your own research before making any investment decisions. Use provided information at your own risk. See Disclaimer for more information.


[PRESS RELEASE – George Town, British Virgin Islands, March 18th, 2026]
Aster, a trading ecosystem backed by YZi Labs, today announced a major expansion of its collaboration with World Liberty Financial (WLFI).
The collaboration introduces USD1-denominated perpetual contracts and new trading incentives, including WLFI token rewards and reduced fees on USD1 pairs, while also allowing users to earn additional rewards on their holdings.
The integration is intended to support USD1 liquidity on the platform, laying the groundwork for Aster Chain, the project’s newly-launched Layer 1 blockchain.
Building a Diverse Foundation for Aster Chain
Adding USD1 as collateral and USD1-denominated perpetual markets reduce Aster’s reliance on any single stablecoin, giving users greater flexibility as the Aster Chain launches.
WLFI’s global community helps support Aster’s efforts to expand access to USD1 markets within DeFi.
“Aster Chain’s success depends on the depth of its underlying liquidity,” said Leonard, CEO at Aster. “By bringing USD1 into our core trading engine during this phase, we’re building the trading foundation for the Aster Chain launch. Our 0-bps maker fees are designed to encourage participation in USD1 markets on Aster as the mainnet launch.”
“Perpetual markets are where a significant portion of trading volume lives. Aster listing USD1 perps pairs and matching USDT collateral ratios means traders can use USD1 in a manner similar to any major stablecoin. That’s the bar we set: functional parity, rather than positioning USD1 a secondary option.” said Zak Folkman, Co-founder & COO of World Liberty Financial.
Establishing the USD1 Trading Hub
Aster supports USD1-denominated perpetual contracts, launching with BTC, ETH, and SOL pairs, with an additional 10+ pairs planned in the coming weeks.
To encourage market participation, Aster is offering zero-bps maker fees and a competitive 0.5-bps taker fee. USD1 is also supported as a core margin asset and collateral, with a collateral ratio on par with USDT – allowing traders to maximize capital efficiency.
Rewards for Early Adopters
This partnership introduces several incentives as part of Aster Chain’s mainnet launch:
- USD1 Perp Trading Rewards: Up to 2.5 million WLFI tokens distributed monthly through the USD1 perpetual trading incentive program based on trading activity, with rewards distributed weekly. WLFI reserves all rights regarding program interpretation and distribution.
- USD1 Holding Incentives: Users holding USD1 on Aster may be eligible to participate in platform incentive programs.
- Reduced Trading Fees: Zero maker fees and 0.5-bps taker fees on all USD1 pairs, a significant reduction compared to USDT pairs.*
Aster will also launch tracking tools including integrated Points Program entry points across web and mobile, allowing users to monitor their progress and participation in early Aster Chain market activity.
*Aster’s standard taker fee on USDT pairs is 4 bps. USD1 taker fee is 0.5 bps, representing an approximate 87.5% reduction. Maker fees on USD1 pairs are 0 bps. All fees are set by Aster and subject to change. See Aster’s fee schedule at Aster fee page for current rates.
About Aster
Aster is a privacy-first onchain trading platform backed by YZi Labs, featuring innovations like Hidden Orders to shield user trading activity. It offers perpetual contracts across crypto, stocks and commodities, as well as crypto spot trading, and is powered by Aster Chain, a Layer 1 blockchain built to power the future of decentralized finance.
Users can learn more about Aster on the official website or follow Aster on X.
About World Liberty Financial (WLFI)
World Liberty Financial (WLFI) operates at the intersection of traditional financial infrastructure with blockchain innovation, creating accessible, transparent, and scalable solutions for a new era of digital finance. This documentation is intended for developers, integrators, researchers, and community members seeking to understand the World Liberty Financial ecosystem.
Binance Free $600 (CryptoPotato Exclusive): Use this link to register a new account and receive $600 exclusive welcome offer on Binance (full details).
LIMITED OFFER for CryptoPotato readers at Bybit: Use this link to register and open a $500 FREE position on any coin!

Spain Emerges as Clear Favorite with Expanded 48-Team Format Looming

Can Hyperliquid price surge past $50 as commodity perps drive record volume?
High School Teacher Arrested for Sexually Assaulting Student


-
 Crypto World5 days ago
HYPE Token Enters Net Deflation as HyperCore Buybacks Outpace Staking Rewards
-

 Tech3 days ago
Your Legally Registered ‘Motorcycle’ Might Not Count Under Proposed US Law
-

 Fashion5 days ago
Weekend Open Thread: Addict Lip Glow
-
Sports5 days ago
Why Duke and Michigan Are Dead Even Entering Selection Sunday
-
 Tech1 day ago
Are Split Spacebars the Next Big Gaming Keyboard Trend?
-

 Business3 days ago
Search for Savannah Guthrie’s Mother Enters Seventh Week with No Arrests
-

 Business5 days ago
US Airports Launch Donation Drives for Unpaid TSA Workers as Partial Government Shutdown Enters Fifth Week
-
Crypto World4 days ago
Coinbase and Bybit in Investment Talks: Could Bybit Finally Enter the US Crypto Market?
-

 Business3 days ago
Australian shares drop as Iran war enters third week
-

 Business5 days ago
Country star Brantley Gilbert enters growing non-alcoholic beer market
-

 Crypto World3 days ago
Crypto Lender BlockFills Enters Chapter 11 with Up to $500M in Liabilities
-

 Sports5 days ago
College Basketball Best Bets: Conference Tournament Semifinal Picks
-

 Politics18 hours ago
The House | The new register to protect children from their abusers shows Parliament at its best
-

 Business6 days ago
Trump demands Powell cut rates as Iran conflict raises energy prices
-

 Fashion3 days ago
25 Celebrities with Curly Hair That Are Naturally Beautiful
-

 Crypto World6 days ago
Senate Votes to Include CBDC Ban in Bipartisan Housing Bill
-

 News Videos10 hours ago
RBA board divided on rate cut, unusually buoyant share market | Finance Report | ABC NEWS
-

 NewsBeat6 days ago
Deane Road crash near Bolton colleges and university
-

 News Videos6 days ago
Tom Lee: The 100x Opportunity EVEN Bigger Than Bitcoin (New Ethereum Prediction 2026)
-

 Crypto World11 hours ago
Canada’s FINTRAC revokes registrations of 23 crypto MSBs in AML crackdown


You must be logged in to post a comment Login