
Crypto World
The Price of Silver Is Recovering After a Two-Day Decline

As can be seen on the XAG/USD chart, the price of silver is recovering after forming yesterday’s low below the $79 level. The price per ounce has already exceeded $86 today (+10% in less than 24 hours!).
Volatility in the silver market is being driven by fluctuations in the US dollar, as well as military action in the Middle East, which is fuelling concerns about a prolonged regional conflict. According to media reports:
→ Yesterday, Israel carried out a strike on a building where religious figures had gathered to elect a new Supreme Leader.
→ Following the death of Ali Khamenei, he was succeeded by his son Mojtaba Khamenei. Although some sources consider him the leading candidate (no official statements have yet been made), this has raised concerns that the new Iranian leadership may continue existing policies — increasing uncertainty over the outcome of the conflict.
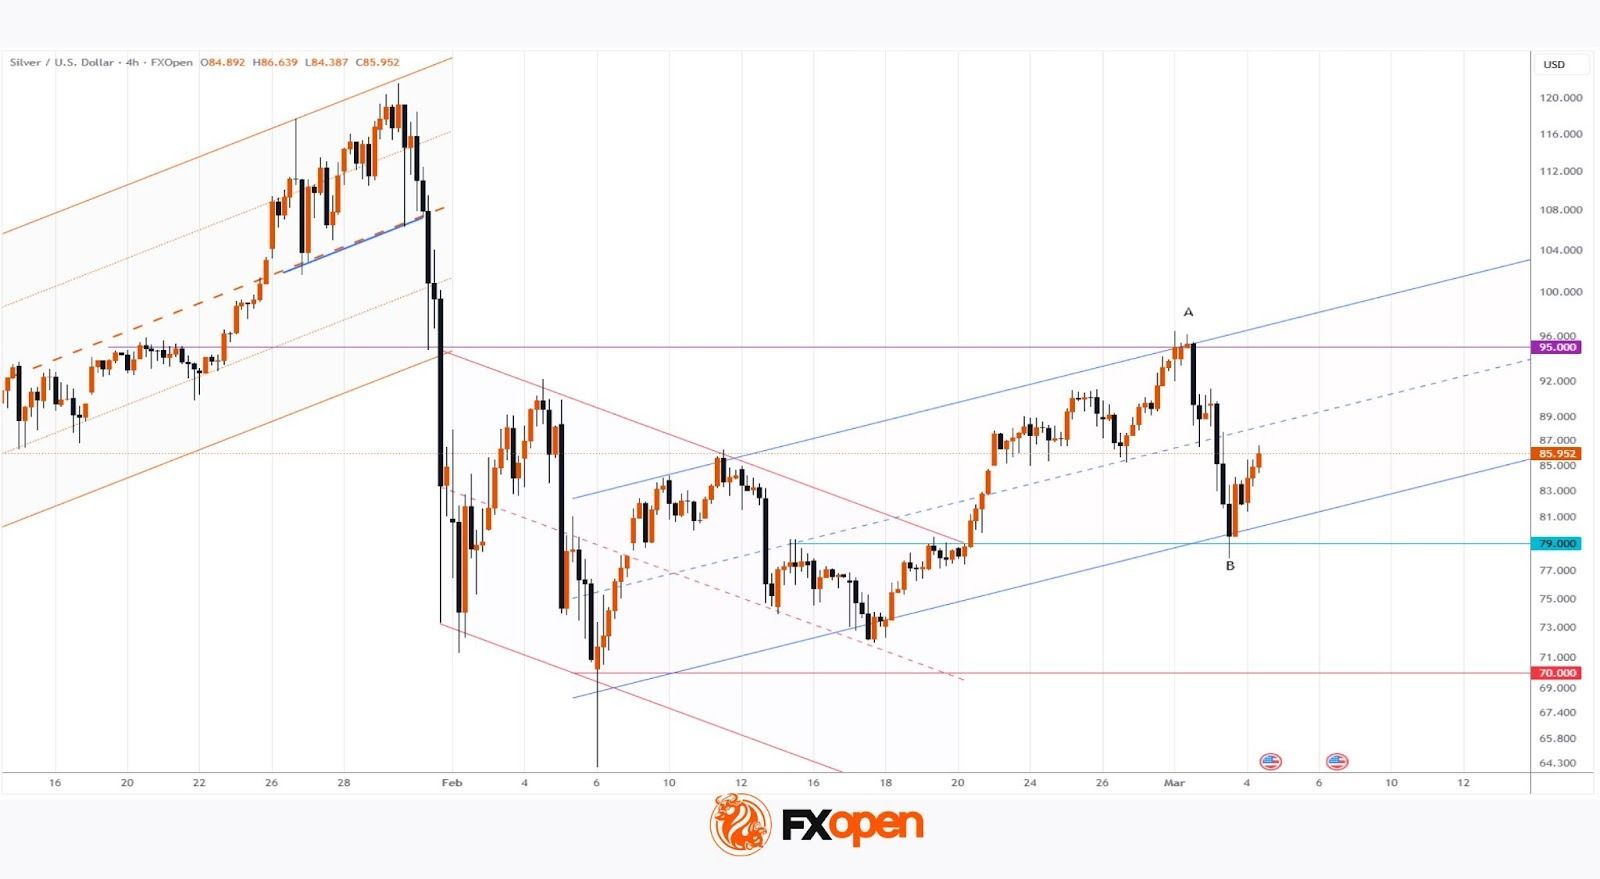
On 20 February, when analysing the XAG/USD chart, we:
→ highlighted the importance of the $95 resistance level;
→ suggested that the price of silver could consolidate above the breakout level of the descending channel around $79 (shown in red), reinforced by the psychological $80 mark.
Indeed, our assumptions were reflected in the formation of a zigzag pattern, with a bearish reversal at the A peak and a bullish reversal at yesterday’s low B. Notably, these and other key extremes make it possible to outline the contours of an upward trajectory (shown in blue).
It is possible that the upward movement observed this morning will continue during the US trading session, allowing XAG/USD to reach the blue median line. Price action at that point may provide important clues — if the median does not show signs of resistance, this may be interpreted as an indication of further upside potential.
Start trading commodity CFDs with tight spreads (additional fees may apply). Open your trading account now or learn more about trading commodity CFDs with FXOpen.
This article represents the opinion of the Companies operating under the FXOpen brand only. It is not to be construed as an offer, solicitation, or recommendation with respect to products and services provided by the Companies operating under the FXOpen brand, nor is it to be considered financial advice.


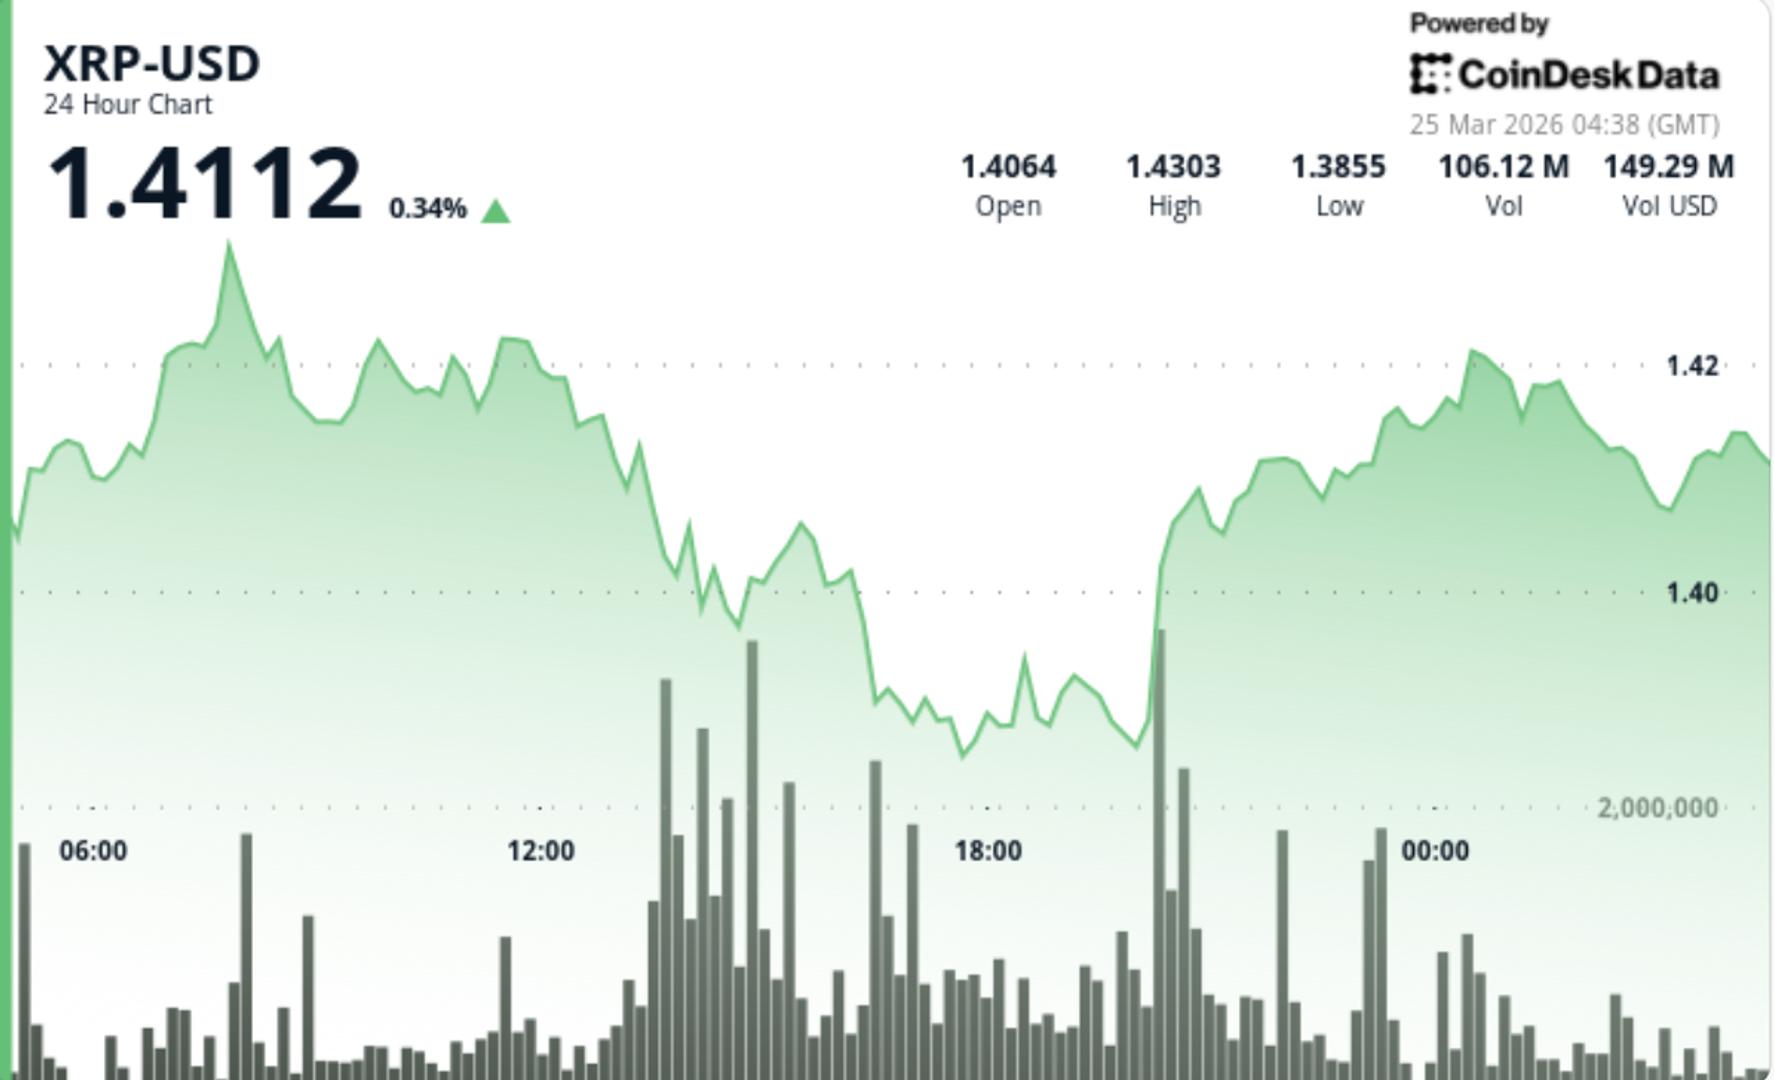
XRP is holding near $1.41 after a steady session, but price is stuck in a tight range, with neither buyers nor sellers taking control. The longer it stays compressed between support and resistance, the more likely a sharper move becomes.
News Background
- XRP traded in line with the broader crypto market, with no major token-specific catalyst driving price action.
- Whale wallets added roughly 40 million XRP over the past week, suggesting accumulation during consolidation.
- Market sentiment remains tied to macro conditions, with crypto reacting cautiously to interest rate expectations.
Price Action Summary
- XRP gained about 0.6%, moving from roughly $1.38 to $1.41
- Price traded within a tight $1.38–$1.43 range
- Repeated rejection near $1.42 capped upside
- Buyers defended dips near $1.38, forming higher lows
Technical Analysis
- XRP is trading in a tightening range, with support near $1.38 and resistance around $1.42.
- Higher lows suggest buyers are slowly stepping in, but lack of strong follow-through keeps momentum muted.
- The structure resembles a compression setup, where price coils before a larger move.
- Volume is slightly elevated but not strong enough yet to confirm a breakout.
What traders say is next?
- Traders are watching a break above $1.42 for a move toward $1.45–$1.50.
- If $1.38 support fails, downside could extend toward $1.30.
- For now, XRP remains range-bound, with the next move likely driven by a break on either side of this tightening range.
Stock and crypto trading platform Robinhood has approved to buy back $1.5 billion worth of its shares.
Robinhood said in a Securities and Exchange Commission filing on Tuesday that the company’s board of directors approved the $1.5 billion share repurchase program, which it will carry out over the next three years.
The program includes $1.1 billion in new incremental capacity, with the remainder rolled over from an older repurchase program.
“Robinhood is a generational company with a massive long-term opportunity,” Robinhood financial chief Shiv Verma said in a statement. “This authorization reflects the confidence of our management team and board in our ability to continue delivering innovative products for customers and creating value for shareholders while returning capital over time.”
The stock buyback, typically seen as signaling that a company believes its stock is undervalued, comes as shares in Robinhood (HOOD) have struggled so far this year amid a broad downturn in stocks and crypto.
Robinhood also said that its subsidiary, Robinhood Securities, entered a $3.25 billion revolving credit facility with JPMorgan Chase, replacing the prior $2.65 billion facility. It can expand by up to $1.62 billion, bringing the maximum credit to $4.87 billion.
Robinhood stock tanks nearly 5%
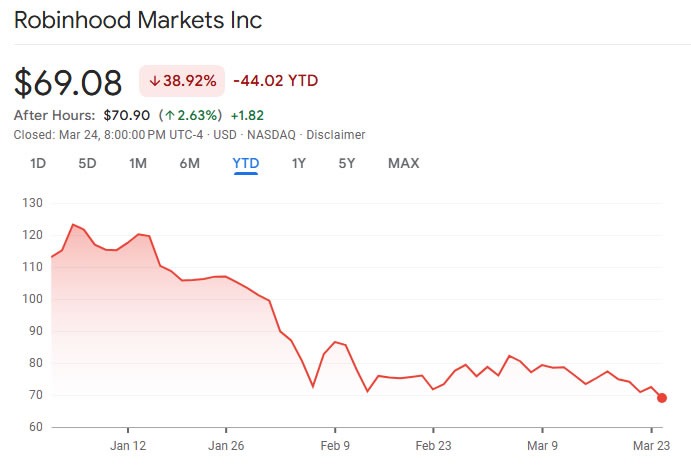
Shares in Robinhood ended trading on Tuesday, down 4.7% to $69.08, closing at the lowest level this year. The stock slightly recovered to $70.90 after hours.
Robinhood’s stock is down almost 39% so far this year and has lost 54.7% since its October all-time high of $152.46, as broader macroeconomic concerns and the Iran war impact stocks.

However, Robinhood’s share price over the past 12 months has seen it gain nearly 43% as its expanded into other products such as prediction markets and banking.
Analyst sentiment aggregator TipRanks puts the 12-month average Robinhood stock price forecast at $123.85 and agrees that the stock is a “strong buy” based on 16 Wall Street analysts.
Related: SEC gives go-ahead to Nasdaq for tokenized trading trial
Robinhood Chain to launch this year
Despite its share price woes, Robinhood remains committed to crypto and real-world asset tokenization, launching its own Ethereum layer-2 network to testnet in February.
CEO Vlad Tenev said that the network processed 4 million transactions in its first week of public testnet activity.
Robinhood Chain is designed to support tokenized equities, exchange-traded funds (ETFs) and other traditional financial instruments, and the mainnet launch is planned for later this year.
Magazine: Banks want to run Vietnam’s crypto exchanges, Boyaa’s $70M BTC plan: Asia Express
Tokenized deposits and stablecoins need tokenized central bank money as a public settlement anchor if Europe’s tokenized financial markets are to scale, Piero Cipollone, a member of the European Central Bank’s Executive Board, said on Monday.
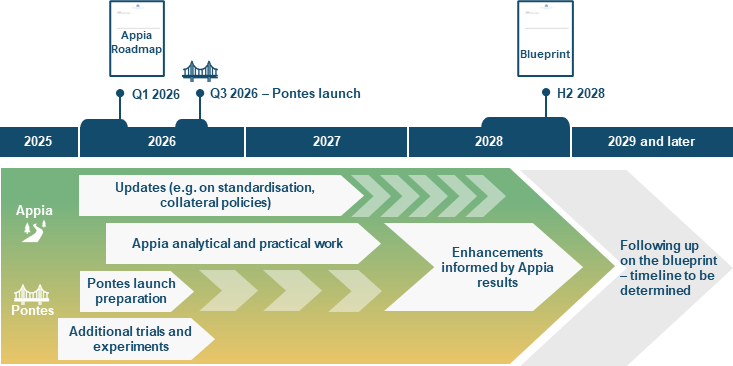
Cipollone pointed to Pontes, the Eurosystem’s distributed ledger technology (DLT) settlement initiative, which is designed to connect market DLT platforms with the Eurosystem’s TARGET Services and provide settlement in central bank money.
“Without tokenised central bank money, a seller of a tokenised security may receive payment in an asset they are not comfortable holding – one exposed to price volatility or credit risk – which limits the market’s ability to scale,” Cipollone said in a speech at the House of the Euro in Brussels on Monday.
The ECB said Pontes is due for an initial launch in the third quarter of 2026, allowing market participants to settle DLT-based transactions in central bank money. The comments build on the ECB’s broader Appia initiative, published on March 11, which is intended to produce a blueprint for a future European tokenized financial ecosystem by 2028.
Related: ECB opens digital euro work on ATMs and payment terminals
Europe’s tokenized markets need legal clarity
Beyond settlement in central bank money, Cipollone said Europe also needs closer public-private cooperation and a legal framework that matches the technology.
One of Appia’s building blocks serves as an interoperability standard for assets, ensuring that tokenized assets can be transferred across different DLT platforms via a compatible data format and smart contract standards.

Cipollone urged market infrastructure operators, banks, custodians and technology providers to explore and submit feedback related to the Appia roadmap, seeking to foster more public-private partnerships.
Related: Sweden’s H100 eyes Europe’s No. 2 Bitcoin treasury with 3,500 BTC deal
Cipollone also said Europe may ultimately need a dedicated legal framework to support the seamless issuance and transfer of tokenized assets across the bloc.
He called the European Commission’s proposal to extend the DLT Pilot Regime an “important development,” but cautioned that the absence of a holistic tokenization framework introduces the risk of “building advanced settlement infrastructure on a patchwork of regulations, leaving us unable to fully reap the benefits.”
The comments come days after stablecoin issuer Circle submitted feedback to the European Commission’s Market Integration Package on March 20, urging lawmakers to expand the existing DLT Pilot Regime and provide e-money token (EMT) cash account services to authorized crypto-asset service providers.
Magazine: How crypto laws changed in 2025 — and how they’ll change in 2026
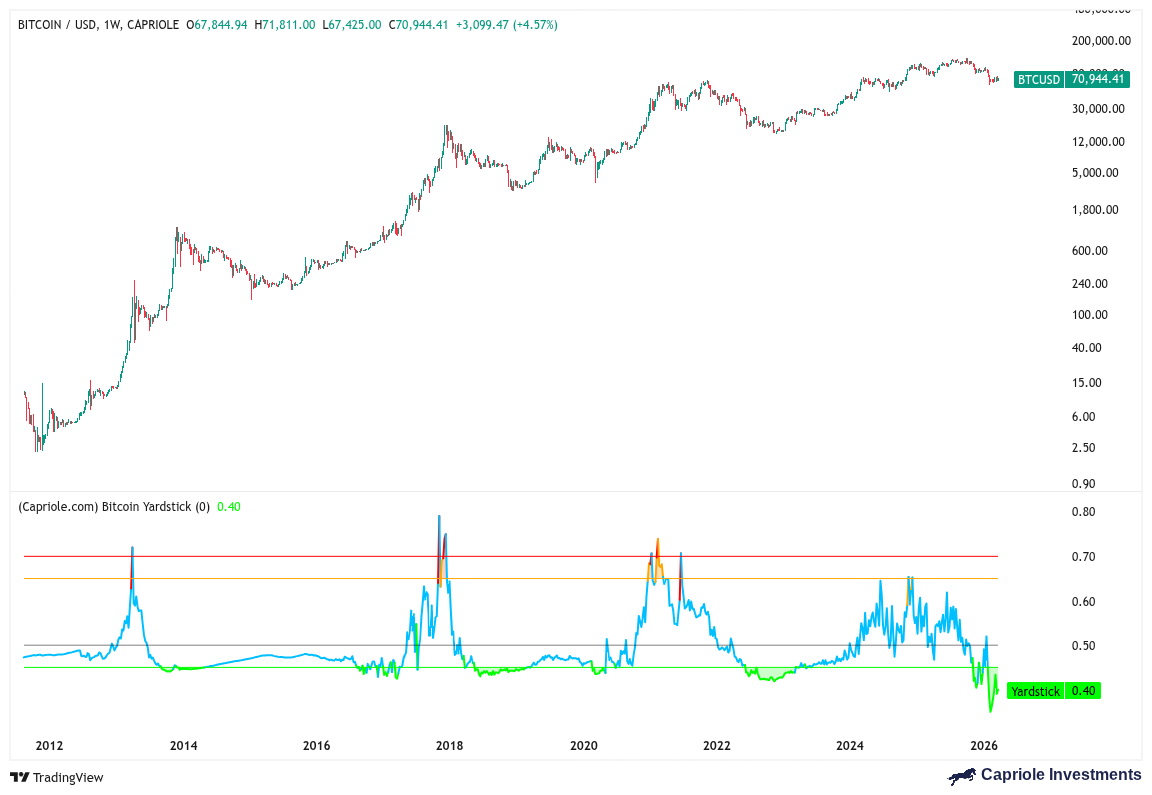
Bitcoin Yardstick data confirmed a new record for BTC price “deep value” in February as miners battled the lowest price levels in 15 months.
Bitcoin (BTC) is “off the chart” in terms of value-for-money as price diverges from hash rate, a market analyst says.
Key points:
-
Bitcoin price action is diverging from hash rate to an extent never seen before.
-
The Bitcoin Yardstick metric shows that price is in its “deep value” range.
-
Hash rate continues to circle its historical highs despite a 40% BTC price drawdown.
Bitcoin Yardstick shows record “deep value”
Updating X followers on his Bitcoin Yardstick metric, Charles Edwards, founder of Bitcoin and digital asset hedge fund Capriole Investments, confirmed that it was in new territory.
The Bitcoin Yardstick divides market cap by hash rate, normalized over a two-year period. The result is an expression of Bitcoin’s “value” at a given price point and hash rate level.
“Similar in concept to a ‘PE Ratio,’ except instead of stock earnings, the Bitcoin Yardstick is taking the ratio of energy work done to secure the Bitcoin network in relation to price,” Edwards explained while introducing the metric in 2022.
“Lower readings = cheaper Bitcoin = better value.”

In February this year, Bitcoin generated its lowest Yardstick numbers on record, going far beyond the lows of the 2022 bear market.
After hitting 15-month lows near $59,000 earlier that month, the Yardstick fell to 0.35 — below the one standard deviation of its mean, the level Edwards describes as a prerequisite for Bitcoin being “cheap.”
The Yardstick currently measures 0.40, still well within “cheap” territory relative to hash rate.
“Bitcoin yardstick is literally off the chart in deep value,” Edwards told X followers this week.

Hash rate weathers 40% price decline
Bitcoin miners have struggled this year as price has fallen, but hash rate remains around the one zettahash per second (ZH/s) level, per data from BitInfoCharts.
Related: Gold slides as traders eye sub-$50K BTC: Five things to know in Bitcoin this week

The result is a lower hash rate decline compared to price, which is currently more than 40% below its all-time highs from October 2025.
Earlier in March, Edwards noted a “measured collapse” in miners’ BTC selling as price recovered from the lows, something that historically has always been “bullish.”
Measured collapse in Bitcoin miner selling after a price drop are ALL BULLISH pic.twitter.com/2OGI65zi8l
— Charles Edwards (@caprioleio) March 13, 2026
Previously, Cointelegraph reported on declining miner influence over price in the era of institutional investment.
This article does not contain investment advice or recommendations. Every investment and trading move involves risk, and readers should conduct their own research when making a decision. While we strive to provide accurate and timely information, Cointelegraph does not guarantee the accuracy, completeness, or reliability of any information in this article. This article may contain forward-looking statements that are subject to risks and uncertainties. Cointelegraph will not be liable for any loss or damage arising from your reliance on this information.
Bitcoin (BTC) has been among the best-performing assets amid the US–Iran war, but signs of upside exhaustion are emerging due to an “out-of-control” bond market.
Key takeaways:
-
US benchmark yields may rise by 200 basis points if the US–Iran war drags on further.
-
Past oil-linked conflicts boosted inflation and reduced risk appetite, hinting BTC price may decline below $50,000 in 2026.
Oil shock may send US yields soaring over 5%
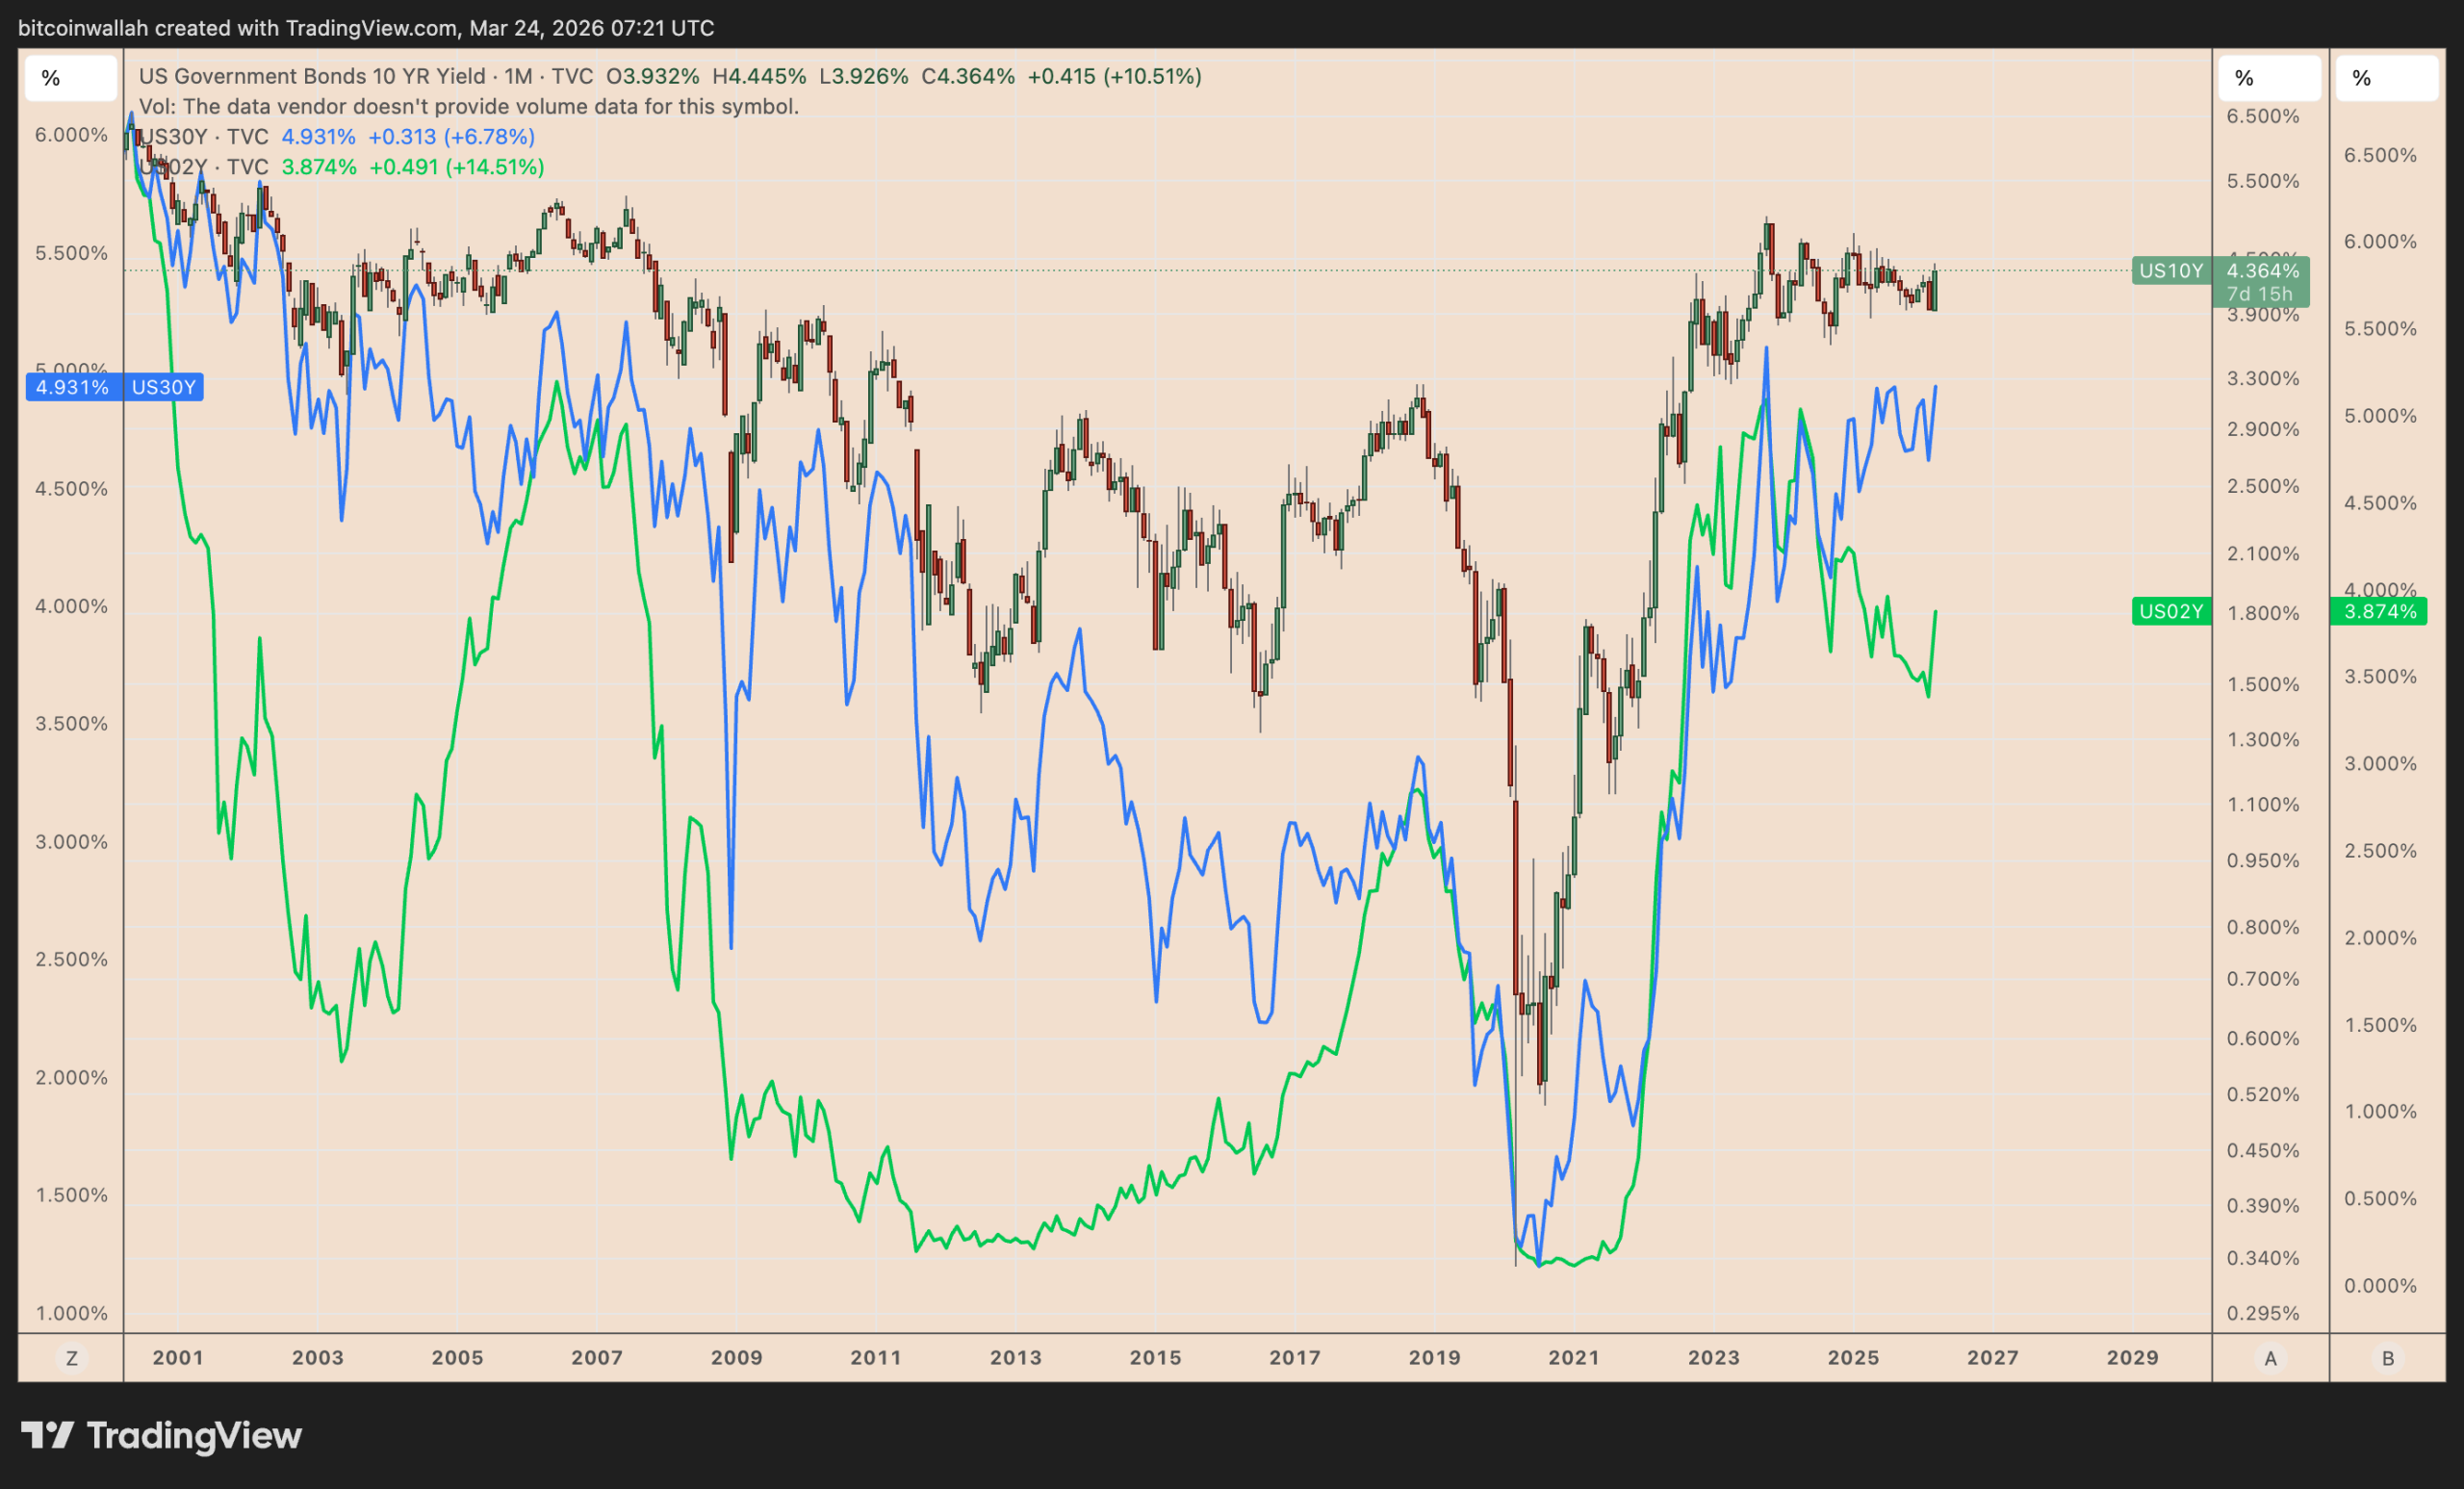
Since Feb. 28, when the US and Israel attacked Iran, the benchmark 10-year Treasury yield has climbed to about 4.42%, its highest in nine months.

The 30-year yield rose to roughly 4.97%, while the 2-year yield pushed up toward 3.95%–3.98%.
Treasury yields have climbed as the war-driven oil spike fuels fears of higher inflation, which, in turn, increases odds of zero rate cuts in 2026.
President Donald Trump’s five-day pause has eased immediate fears of strikes on Iran’s energy sites. But the war remains far from contained since Iran has denied any negotiations and cross-border attacks were ongoing as of Tuesday.

That is prompting fears of further rises in US bond yields among market watchers, with technical chartists further anticipating the 10-year yield to reach 6.4%, a 200 basis point jump, if it breaks out from its symmetrical triangle pattern.

Higher yields reduce the opportunity cost of holding risk assets like stocks and Bitcoin. A US 10-year yield jump above 5% may trigger sell-offs in the BTC market if it continues to behave like a risk asset.
Oil shocks in the past
In the past, short oil-linked conflicts triggered sharp but brief moves in yields and stocks, while prolonged supply shocks pushed yields higher and kept pressure on equities.
During the 1973 Yom Kippur War and Arab oil embargo, yields rose modestly at first before climbing as inflation took hold, while the S&P 500 fell about 41%–48% during “stagflation.”

The 1979 Iranian Revolution saw a stronger bond-market reaction, with the 10-year yield rising roughly 150–200 basis points over the following year, while stocks saw a milder drawdown.
In the 1990–91 Gulf War, the 10-year yield rose about 50–70 basis points and the S&P 500 fell roughly 16%–20% before rebounding once the conflict was contained.
The 2022 Russia–Ukraine war also coincided with higher yields and an initial 5%–10% drop in the S&P 500.
Related: What happens to Bitcoin if oil price hits $180 per barrel?
The current US and Israel–Iran war appears to fit the early stage of that pattern. If the conflict drags on and oil stays high, yields could rise further and risk assets could face another leg lower.
For Bitcoin, which remains tightly correlated to S&P 500, that would likely mean deeper downside pressure unless the war de-escalates quickly.
How low can the Bitcoin price go?
From a technical perspective, Bitcoin price may drop to $50,000 or lower in the coming months if it breaks out of its prevailing bear flag pattern.

These projections broadly align with prediction market bets, where traders currently set a 70% probability that Bitcoin falls below $55,000 in 2026 and a 46% chance of a drop below $45,000.
BitMEX co-founder Arthur Hayes said that an extended US–Iran war may force the Federal Reserve to loosen its monetary policy, which will be bullish for Bitcoin.
“The longer this conflict goes on, the higher the likelihood that the Fed has to print money to support the American war machine,” he said, adding:
“That’s when I’m going to buy Bitcoin when the central banks start printing money.”
This article does not contain investment advice or recommendations. Every investment and trading move involves risk, and readers should conduct their own research when making a decision. While we strive to provide accurate and timely information, Cointelegraph does not guarantee the accuracy, completeness, or reliability of any information in this article. This article may contain forward-looking statements that are subject to risks and uncertainties. Cointelegraph will not be liable for any loss or damage arising from your reliance on this information.

A coalition of Ethereum developers has unveiled a dedicated resource hub focused on shielding the blockchain from quantum computing threats and the vast value the network secures. The Post-Quantum Ethereum project, hosted at pq.ethereum.org and launched this week by members of the Ethereum Foundation, signals a concerted effort to introduce quantum‑resistant measures at the protocol level within the next decade, followed by execution-layer updates.
Despite a lack of an immediate quantum danger to cryptography-secured blockchains, the team argues that action must begin early. Migrating a decentralized, global protocol requires years of coordination, engineering, and formal verification, and the work should start long before any threat materializes.
Key takeaways
- Ethereum aims to implement post-quantum solutions at the protocol layer by 2029, with execution-layer changes to come afterward.
- The initiative prioritizes protecting standard wallets first, then high-value operational wallets tied to exchanges, bridges, and custody providers.
- SNARK-based (zero-knowledge) signatures are central to the plan, aiming to bolster security without breaking the network’s verification properties.
- Deploying post-quantum upgrades will require careful orchestration to avoid new bugs, attack surfaces, and performance regressions while upgrading hundreds of millions of accounts.
- Industry voices highlight a spectrum of views on quantum risk—ranging from vulnerability limited to exposed public keys to claims that all coins could be at risk.
Post-Quantum Ethereum: a roadmap for resilience
The Post-Quantum Ethereum initiative frames its mission around building a defense-in-depth against quantum threats. The team outlines a multi-layer strategy that spans the network’s consensus, execution, and data layers, with the explicit aim of protecting the largest pools of value in the ecosystem—primarily standard wallets and the custodial and exchange infrastructure that interacts with them.
A core element of the plan is the integration of post-quantum cryptographic techniques into Ethereum’s signature schemes. While several approaches exist, the team underscored that a complete transition is not simply a matter of selecting a quantum-resistant algorithm. The harder challenge lies in safely upgrading hundreds of millions of accounts, preventing migration-induced bugs, avoiding the introduction of new attack vectors, maintaining performance, and coordinating ecosystem-wide adoption.
To this end, the project emphasizes the potential role of SNARKs—zero-knowledge proofs that enable compact verification of complex statements without revealing underlying data. By embedding SNARK-based signatures into the security stack, the team hopes to mitigate risks associated with quantum-era cryptography while managing the computational overhead that such proofs can impose. The overarching goal is to preserve user experience and throughput as the protocol evolves.
Early work will concentrate on wallet security, given the concentration of value in everyday user funds. Beyond individual wallets, the plan also targets high-value operational wallets associated with exchanges, cross-chain bridges, and custody solutions—areas deemed critical to ecosystem continuity during a transition period.
As with any fundamental upgrade of a global blockchain, the Post-Quantum team acknowledges that the main hurdle is deployment. The team’s rhetoric centers on a cautious but deliberate approach: choosing a robust post-quantum algorithm is only part of the equation. Safely upgrading hundreds of millions of accounts, moving through formal verification, and ensuring seamless interoperability across diverse client implementations will require extensive coordination and testing.
Choosing a post-quantum algorithm is only part of the challenge. The harder parts include safely upgrading hundreds of millions of accounts, preventing the migration from introducing new bugs, avoiding new attack surfaces, maintaining performance, and coordinating ecosystem-wide adoption.
The effort sits within a broader conversation about how the crypto space should prepare as quantum capabilities advance. Industry observers have debated whether the risk is narrowly scoped to wallets with exposed public keys or whether a full-system risk exists across all digital assets. Some analysts argue that only a subset of wallets may be immediately vulnerable, while others warn that every asset could face exposure if standard cryptographic assumptions are invalidated by quantum breakthroughs.
Context: where quantum concerns stand today
Quantum risk has long been a topic of discussion as researchers explore practical quantum computers. In the crypto space, the debate often centers on wallet security and the longevity of cryptographic keys. Analysts have stressed that the moment quantum capabilities threaten the generalized security of digital signatures will depend on breakthroughs in hardware, algorithms, and the ability to coordinate network-wide upgrades without service interruption.
Within Ethereum’s ecosystem, the stakes are especially high because the network’s value is secured by a vast and active user base, a broad set of decentralized applications, and a sprawling array of custodial services. The Post-Quantum Ethereum project is positioned as a proactive blueprint to navigate the trade-offs between security and performance while preserving a seamless user experience during a transition.
What to watch next
As 2029 approaches, observers will be looking for concrete milestones on the Post-Quantum Ethereum path: concrete algorithm candidates, testnet experiments for post-quantum signatures, performance benchmarks, and progress on the governance and tooling needed to coordinate the upgrade across clients and ecosystems. The balance between robust security and network efficiency will likely shape how quickly and widely post-quantum solutions gain traction.
In the near term, the focus remains on building resilient foundations—community consensus, rigorous verification, and a staged rollout plan that minimizes disruption to users while laying the groundwork for a quantum-resistant Ethereum.
Readers should keep an eye on updates from the Ethereum Foundation and the Post-Quantum Ethereum team, including any published milestones, proposed standards, and testnet exercises that will illustrate how the network adapts to a potentially quantum-powered future.
OpenAI has announced it is shutting down its video generation platform Sora after just six months, with CEO Sam Altman reportedly telling staff the company is winding down all of its video products.
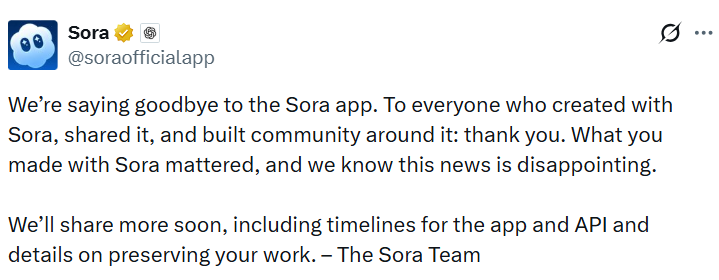
“We’re saying goodbye to the Sora app,” Sora posted to X on Tuesday. “We know this news is disappointing. We’ll share more soon, including timelines for the app and API and details on preserving your work.”
Sora was released in September to a buzzy reception as the ChatGPT maker sought to make inroads on short-form video content popular across TikTok and Meta’s Instagram.
However, the app also faced backlash over concerns that it would further the proliferation of realistic deepfakes. OpenAI cracked down on some deepfakes generated by its platform after pressure from celebrities.

Products using video models on the chopping block
Altman told staff the company was winding down products that used video models, including the developer version of Sora and the app’s video functionality in its generative AI chatbot ChatGPT, The Wall Street Journal reported on Tuesday.
Altman also said the Sora team will shift its focus to longer-term bets such as robotics, amid a company-wide redirect to concentrate on productivity tools for enterprises and individual users.
Related: OpenAI wins defense contract hours after government ditches Anthropic
OpenAI launched Sora last year as a text-to-video generator, and it racked up 1 million downloads in just five days. Data analytics firm Sensor Tower estimates that last month, Sora was downloaded around 600,000 times.
Disney deal not moving forward
In December, the Walt Disney Co. signed a three-year licensing agreement to become Sora’s first major content partner, giving users access to more than 200 characters from franchises including Marvel, Pixar and Star Wars.
A Disney spokeswoman told The Wall Street Journal that the deal, which included a $1 billion equity investment in OpenAI, will not move forward.
Cointelegraph contacted OpenAI and Disney for comment.
The AI market has been the subject of significant hype. It’s projected to be worth more than $4.8 trillion by 2033, affect 40% of jobs and emerge as a dominant frontier technology.
Magazine: Google flags crypto malware, retiree loses $840K in ‘expert’ scam: Hodler’s Digest, Mar. 15 – 21
The Siren (SIREN) token plunged nearly 70% on Tuesday, reversing a rapid rally as onchain analysts warned that a small cluster of wallets may control a large share of the token’s supply.
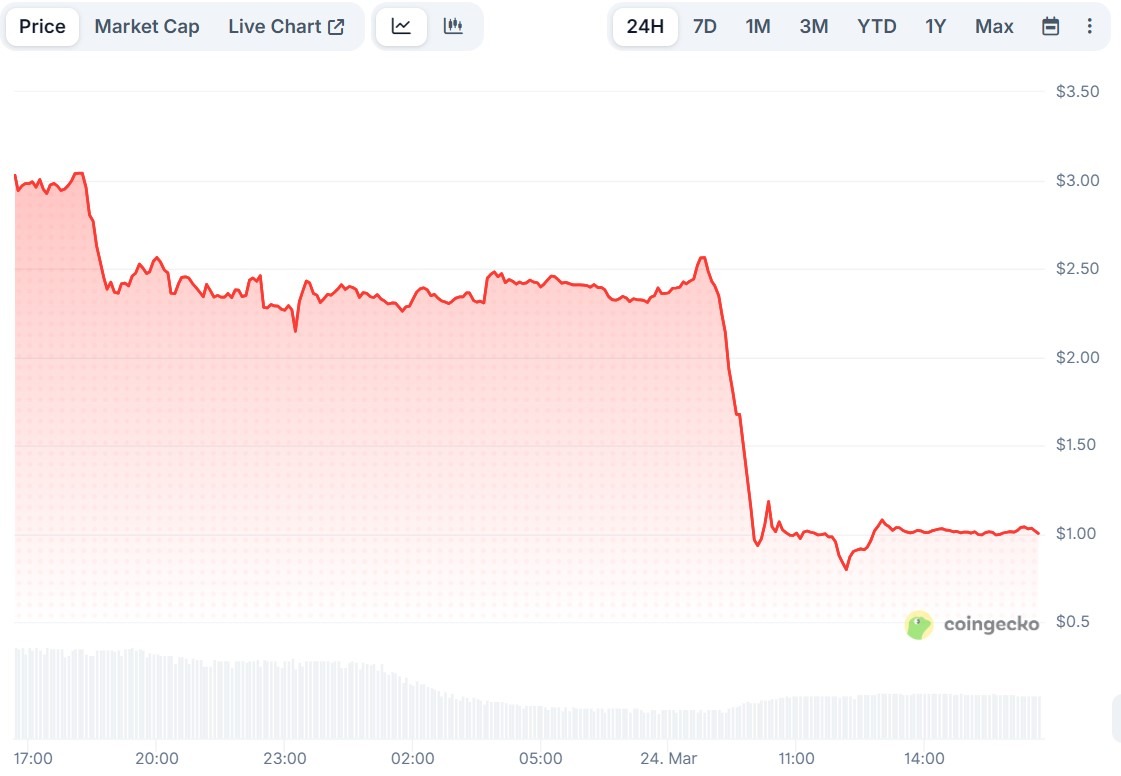
According to CoinGecko data, the token dropped nearly 70% from a high of $2.56 early Tuesday to a low of $0.79 on the same day. At the time of writing, Siren hovered around $1.
The sell-off followed a steep run-up in SIREN, a BNB Chain token marketed as an AI analyst agent. Analysts at Bubblemaps and the pseudonymous researcher EmberCN said Monday that wallet data suggested the token’s holdings were highly concentrated.
While the relationship between the claims and the price move remains unclear, the volatility highlights risks tied to thin liquidity and concentrated holdings.

Siren’s 70% drop follows wallet concentration warnings
SIREN rallied to $2.81 on Monday, up 340% from its price of $0.63 on March 16. CoinGecko data showed that in the last month, the token rose by nearly 1,300% from $0.22.
On Monday, a pseudonymous onchain analyst, EmberCN, warned traders that the token’s surge was due to a party cornering nearly all spot supply to profit from contracts.
Related: ‘Hawk Tuah’ girl Haliey Welch says memecoin implosion ‘traumatized’ her
Citing an unverified custom entity created by Arkham Intelligence, EmberCN pointed out that a single entity may be in control of 644 million SIREN, worth about $1.8 billion at the time. This amount accounts for 88% of the entire circulating supply of 728 million tokens.
On Tuesday, blockchain analytics company Bubblemaps shared a visual representation of wallet clusters surrounding Siren. According to the company, one entity controls about 50% of the circulating supply of tokens worth about $1 billion.

According to Bubblemaps, Siren was “largely abandoned” after its launch back in February 2025. The company said that a cluster of over 200 wallets was funded via PancakeSwap and purchased the token in two batches before dispersing them into 47 wallets.
“This only ends one way,” Bubblemaps wrote, implying that if a single party controls the supply, a sharp sell-off may follow.
Magazine: Banks want to run Vietnam’s crypto exchanges, Boyaa’s $70M BTC plan: Asia Express
The Financial Stability Board (FSB), a global financial watchdog hosted by the Bank for International Settlements, warned on Tuesday that foreign currency-denominated stablecoins can pose financial stability and macroeconomic risks for emerging market and developing economies.
In its annual report for 2025, the FSB said that US dollar-denominated stablecoins circulating across multiple jurisdictions pose “potentially more acute” risks to the financial stability of emerging economies.
The report said those risks can include currency substitution, reduced use of domestic payment systems, lower effectiveness of domestic monetary policy, strains on fiscal resources and the circumvention of capital flow measures.
The FSB said it remains necessary for lawmakers to assess how the stablecoin sector develops in order to understand and respond to vulnerabilities related to liquidity, operational risk and interlinkages with the broader financial system.
The report builds on the FSB’s 2023 global regulatory framework for crypto-asset activities and global stablecoin arrangements, which the board reviewed in 2025 and said still shows significant gaps and inconsistencies in implementation.

The FSB was established in April 2009 as a successor to the Financial Stability Forum. It was created by G20 economies after the 2008 financial crisis to strengthen global financial systems.
Related: FSB warns crypto nearing ‘tipping point’ as ties to TradFi deepen
Stablecoins still have limited real use
Crypto assets and stablecoins still lack adoption in real economic use cases such as payments, the FSB said in the report.
“Despite growth in these markets in recent years, crypto-assets and stablecoins are not widely used in financial services supporting the real economy.”
The report said stablecoins can provide benefits, but added that authorities should continue monitoring vulnerabilities tied to interlinkages, liquidity and operational risks as linkages with core financial markets and institutions increase.

The FSB also outlined other key areas of focus in 2026, including digital innovation related to crypto assets and monitoring stablecoin vulnerabilities.
Other focal points included monitoring vulnerabilities tied to private credit, nonbank financial intermediation, cross-border payments, and the implementation of additional measures tied to crisis preparedness and regulatory modernization.
Related: FSB calls for stricter oversight against AI vulnerabilities
Magazine: Can privacy survive in US crypto policy after Roman Storm’s conviction?
AI and stablecoin segments have outperformed the broader crypto market in 2026, with data pointing to continued usage growth despite declining prices elsewhere.
Key takeaways:
-
AI sector posts smallest loss in Q1/2026, down just 14%.
-
Stablecoin market cap hits a record $320 billion, with monthly transaction volumes at a record $1.8 trillion.
AI and stablecoin sectors buck the trend
Bitcoin (BTC) trades 18.5% lower in 2026, the total crypto market capitalization has slipped to $2.42 trillion, while most altcoins are lagging, as fear and uncertainty surrounding the US and Israel-Iran war and the Fed’s hawkishness grip the market.
Meanwhile, AI and stablecoin businesses continue to defy the trend, recording significant growth and strong fundamentals that highlight a rotation toward infrastructure over speculation.
Related: Circle asks EU to ease crypto thresholds in proposed markets framework
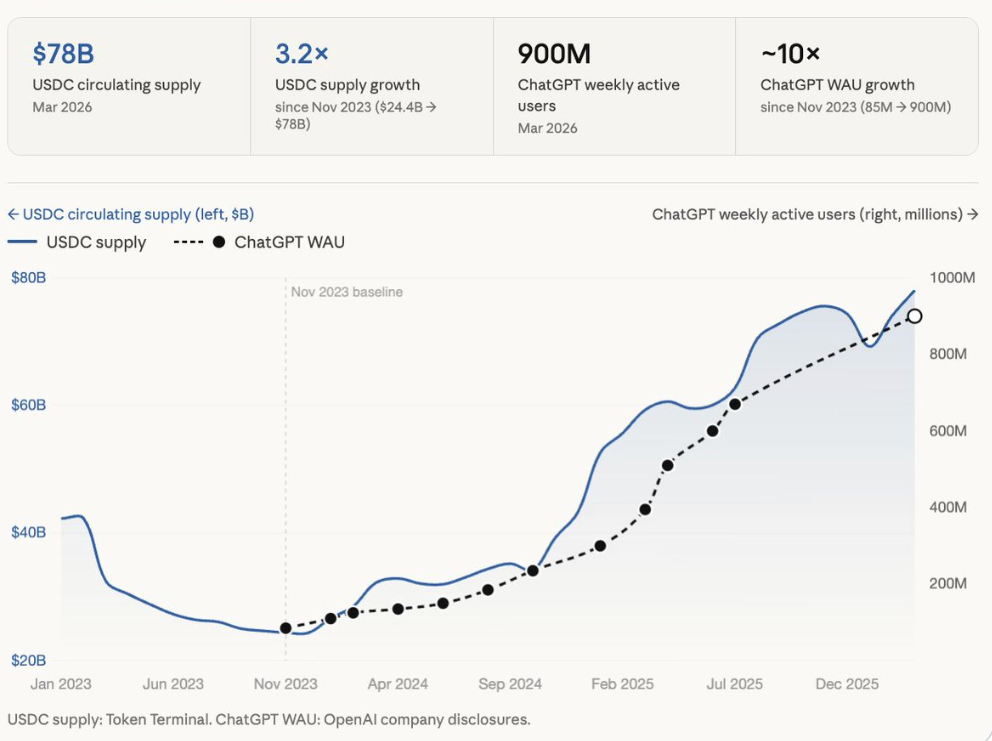
For example, Circle’s USDC (USDC) supply is at $78 billion, a 220% increase since November 2023, data from Token Terminal shows.
ChatGPT’s weekly active users have also grown to 900 million in March 2026 from 85 million in November 2023, a roughly 10x increase over the same period.

Grayscale’s Q1/2026 report reinforces this observation, revealing that the AI sector recorded the smallest loss at 14% during the first three months of the year, compared to Consumer and Culture at 31%, Smart Contract Platforms at 21%, and Currencies at 21%.
This indicates that “investor appetite shifted away from momentum-driven and more speculative segments,” the digital-asset investment manager said, adding:
“Despite subdued overall sentiment, capital appeared to rotate toward projects with stronger fundamentals and those aligned with key themes such as AI and tokenization.”

The market capitalization of AI tokens now stands at $17.4 billion, up 30% over the last 30 days. Bittensor (TAO) and NEAR Protocol (NEAR) lead the growth, with 75% and 30% price increases, respectively, over the same period

Similarly, stablecoins continue to grow, with the total market capitalization hitting a record $320 billion on March 23. Tether’s USDt (USDT) maintains dominance around $184 billion, representing 57% of the total stablecoin supply.
Monthly transaction volumes hit a record $1.8 trillion in February, rivaling traditional payment rails. USDC led supply growth with an 80% month-to-month increase to a $1.26 trillion all-time high last month.

Stablecoins are cryptocurrencies designed to maintain a stable value, typically pegged to fiat currencies like the US dollar, and can be hosted on multiple blockchains.
In a bear market, stablecoins serve as buying power and settlement rails, dominating trading pairs, supporting tokenized real-world assets, and enabling yield-bearing products.
Ethereum and other chains see high transfer volumes, while institutional products from banks and fintechs integrate them for yield and treasury management. This infrastructural role persists even as speculative assets bleed.
“Structural tailwinds” drive growth convergence
The two sectors thrive because they deliver measurable value even after speculation fades.
“AI labs and stablecoin issuers are among the businesses with the strongest structural tailwinds of the 2020s,” Token Terminal said.
They sit at the “intersection of three distinct forces: technology, finance, and geopolitics,” with each of these drivers independently driving demand for these sectors, the crypto data provider said, adding:
“AI drives productivity and defense capabilities, while stablecoins provide financial infrastructure for global dollar distribution.”
In an X post on Monday, Crypto trader Mando CT said AI and stablecoins are among the four dominant sectors in 2026.
Explaining the convergence, the trader said that AI needs instant and low-fees payment systems to operate, while stablecoins are the “internet money” needed to make this happen.
“These trends are connected,” Mando CT said, adding:
“2026 isn’t just another cycle. It’s the transition from: Speculation to Infrastructure.”
Cointelegraph reported that stablecoins could benefit from AI-driven payments by enabling easy, automatic, and rule-based transactions between entities, further driving long-term growth for both sectors.
This article does not contain investment advice or recommendations. Every investment and trading move involves risk, and readers should conduct their own research when making a decision. While we strive to provide accurate and timely information, Cointelegraph does not guarantee the accuracy, completeness, or reliability of any information in this article. This article may contain forward-looking statements that are subject to risks and uncertainties. Cointelegraph will not be liable for any loss or damage arising from your reliance on this information.

Unser Gehalt #katharinamalia #gehalt #Geld #teuer
‘He was a newborn, he should have felt love but instead he was inflicted with pain’

A Pharmacist Who Helped Shape Community Care


-
 Crypto World4 days ago
NIO (NIO) Stock Plunges 6.5% as Shelf Registration Sparks Dilution Worries
-

 Fashion4 days ago
Weekend Open Thread: Adidas – Corporette.com
-

 Politics4 days ago
Jenni Murray, Long-Serving Woman’s Hour Presenter, Dies Aged 75
-

 Crypto World3 days ago
Best Crypto to Buy Now: Strategy Just Spent $1.57 Billion on Bitcoin During Fear While Early Investors Quietly Enter Pepeto for 150x Potential
-

 News Videos6 days ago
RBA board divided on rate cut, unusually buoyant share market | Finance Report | ABC NEWS
-

 Crypto World3 days ago
Bitcoin Price News: Bhutan Sells $72 Million in BTC Under Fiscal Pressure, but the Smart Money Entering Pepeto Sees What the Market Does Not
-

 Politics7 days ago
The House | The new register to protect children from their abusers shows Parliament at its best
-

 Tech5 days ago
inKONBINI Lets You Spend Summer Days Behind the Register
-

 Crypto World6 days ago
Canada’s FINTRAC revokes registrations of 23 crypto MSBs in AML crackdown
-

 Sports2 days ago
Remo Stars and Kano Pillars Strengthen Survival Hopes in NPFL
-
 NewsBeat6 days ago
Residents in North Lanarkshire reminded to register to vote in Scottish Parliament Election
-

 News Videos7 days ago
PARLIAMENT OF MALAWI – PAC MEETING WITH REGISTRAR OF FINANCIAL ON AMARYLLIS HOTEL – INQUIRY LIVE
-

 Politics5 days ago
Gender equality discussions at UN face pushbacks and US resistance
-

 Business3 days ago
No Winner in March 21 Drawing as Prize Rolls to $133 Million for Next
-

 Business6 days ago
Who Was Alex Pretti? 5 Key Facts About the ICU Nurse Killed by Federal Agents in Minneapolis
-

 Sports2 days ago
Gary Kirsten Accuses Pakistan Cricket Board Of ‘Interference’, Mohsin Naqvi Responds
-

 Tech2 days ago
Give Your Phone a Huge (and Free) Upgrade by Switching to Another Keyboard
-
Sports6 days ago
Vikings Free Agency Enters Phase 2 with Key Questions
-

 Sports4 days ago
2026 Kentucky Derby horses, odds, futures, preview, date: Expert who nailed 12 Derby-Oaks Doubles enters picks
-

 Tech6 days ago
Inventec’s bizarre VeilBook laptop hides its touchpad under a sliding keyboard just to give cooling fans a little breathing room
You must be logged in to post a comment Login