
Crypto World
Trading Techniques of the Inside Bar Pattern

Candlestick patterns are an important part of a comprehensive trading strategy. However, it may be difficult to choose the pattern you can rely on. In this case, traders focus on the most popular setups that have proven to work across various markets and timeframes. One of such patterns is the inside bar pattern.
In price action trading, the inside bar is often analysed as a pause in market structure, reflecting short-term volatility compression that may lead to either trend continuation or trend reversal.
In this article, we will break down the basics of the inside bar pattern, examine examples of this formation on real-market price charts, and discuss how to interpret its signals for trading purposes.
What Is an Inside Bar Candle Pattern?
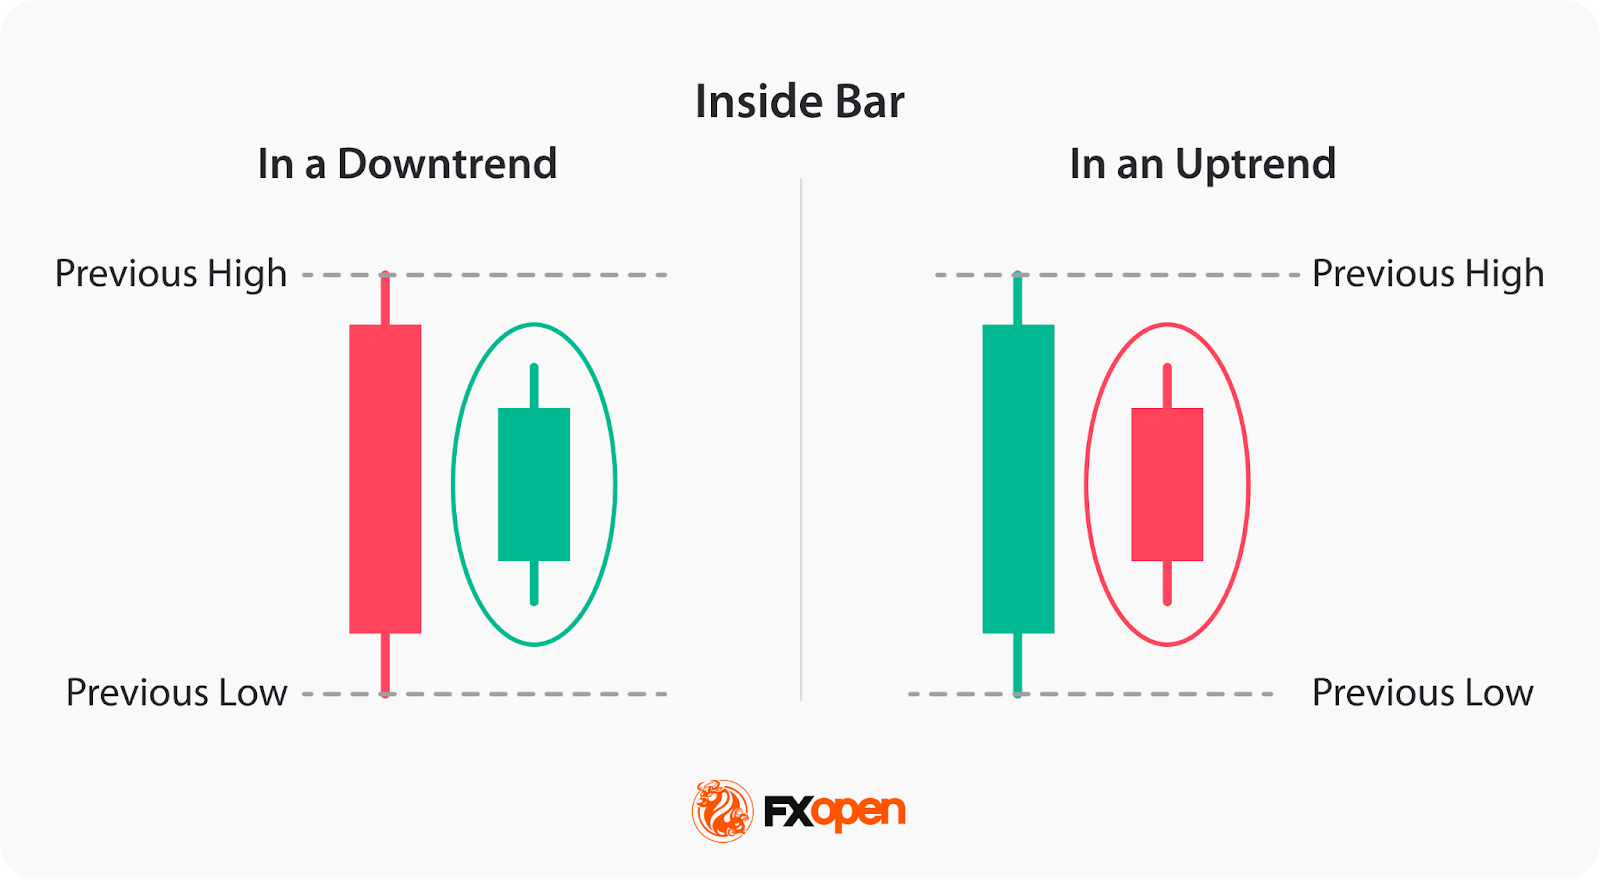
An inside bar is a two-candlestick formation that appears on a price chart when a candlestick’s high and low range is contained within the high and low range of the preceding candle. In other words, the entire price action of one candle is confined within the previous candlestick’s price range.
The preceding candle is commonly referred to as the mother bar, while the following candle is the inside bar itself. This formation highlights range contraction and a brief consolidation phase, where buying and selling pressure temporarily reach equilibrium.
Still, the pattern doesn’t signal a trend reversal or a trend continuation. The price may continue moving in the prevailing trend or turn around. Also, the pattern may appear in both an uptrend and a downtrend.
The inside bar can be observed across different financial instruments such as stocks, cryptocurrencies*, ETFs, indices, and forex currency pairs and can be traded using contracts for difference (CFDs) provided by FXOpen. In the forex market, traders most often apply the inside bar pattern to liquid currency pairs, where higher trading volume may support trade execution.
Identifying the Inside Bar on Trading Charts
To identify this formation on trading charts, traders follow these steps:
- Look for two candlesticks: Traders start by identifying two candlesticks that look like the inside bar.
- Compare the high and low range: After that, they check if the high and low range of the subsequent candle, inside bar, is entirely contained within the high and low range of the preceding candlestick, mother bar.
- Confirm the pattern: Once they identify that the subsequent candle meets the criteria, traders confirm it as an inside bar.
The reliability of the pattern’s signals may vary by timeframe, with many traders favouring the H1, H4, or daily charts, as higher timeframes tend to filter out market noise and reduce the risk of false breakouts.
In the forex market, inside bars tend to form more frequently during lower-liquidity periods, such as the Asian session, while breakouts are more commonly observed during high-liquidity phases like the London and New York session overlap.
Many traders incorporate multi-timeframe analysis when evaluating inside bar setups. A formation that appears on a lower timeframe but aligns with a higher-timeframe trend or key level may carry more significance than a pattern that develops in isolation. For example, an inside bar forming on an hourly chart within a daily uptrend may be interpreted as a continuation signal rather than a reversal attempt, particularly when supported by broader market structure.
Inside Bar vs Outside Bar
The inside candle pattern occurs when the high and low of a candle are contained within the range of the preceding candlestick, indicating consolidation or indecision in the market. It suggests a potential reversal or continuation of the current trend.
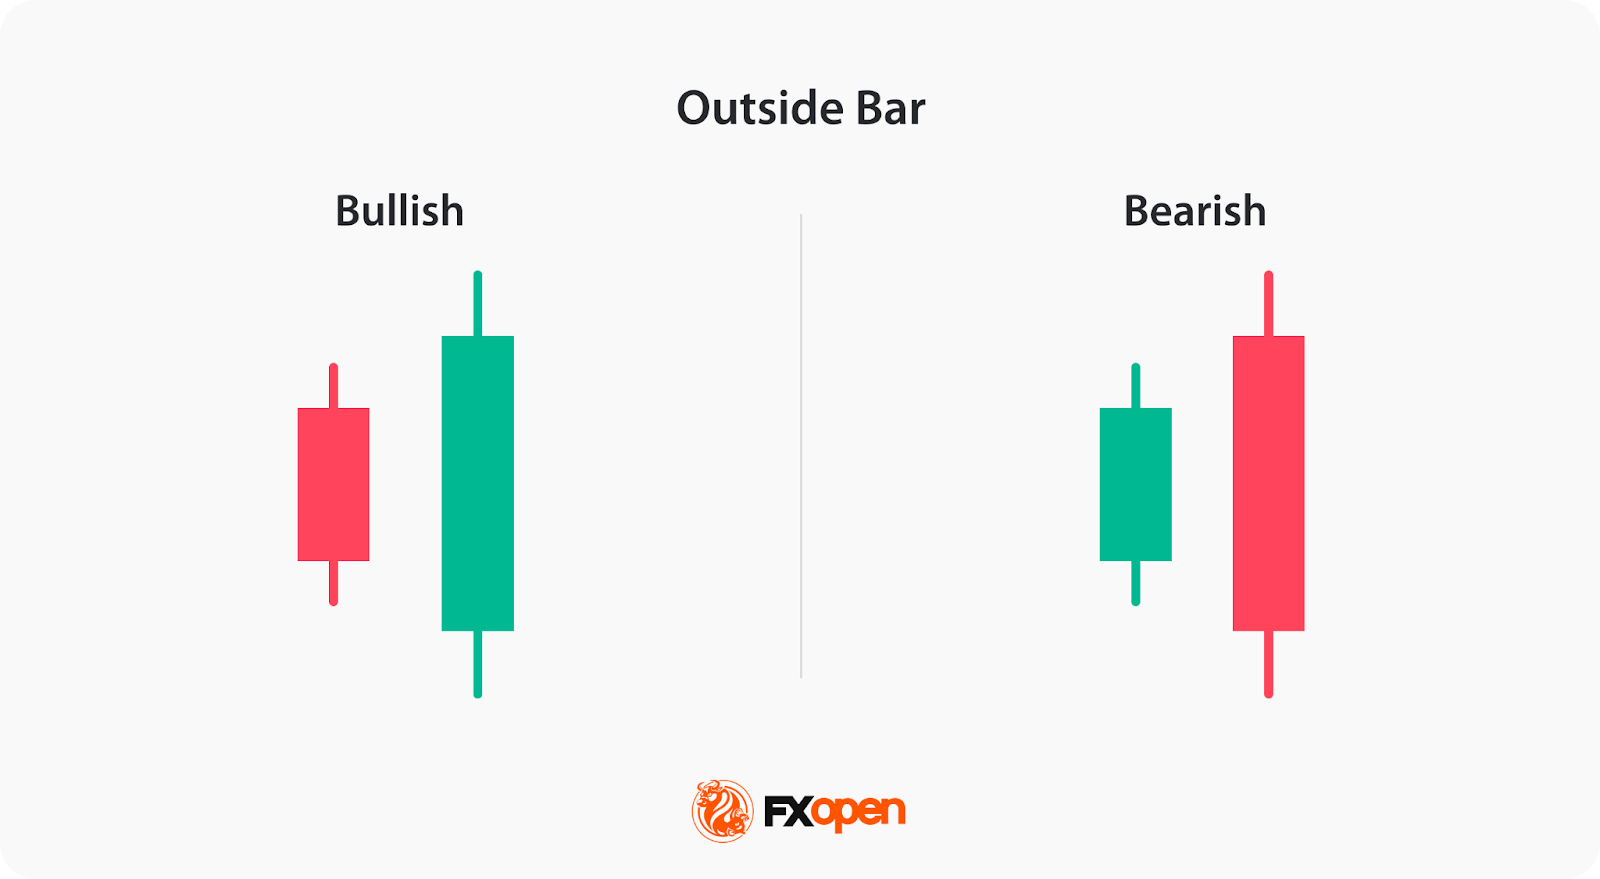
On the other hand, an outside bar—often considered a form of engulfing pattern—appears when a candlestick completely exceeds the previous candle’s high–low range. As Al Brooks defines it in his Trading Price Action Trends, an outside bar occurs when “the high of the current bar is above the high of the previous bar and the low is below the low of the previous bar,” reflecting increased participation from both buyers and sellers. A bearish outside setup typically forms near the top of an uptrend and may signal a downward reversal, while a bullish outside setup forms near the bottom of a downtrend and may suggest an upward reversal.
While the inside bar reflects volatility compression and consolidation, the outside bar typically signals volatility expansion and a stronger momentum shift in price action. Both are widely used by traders for technical analysis and identifying potential trades.
Traders can analyse outside and inside bars on forex, stocks, and other markets using the FXOpen TickTrader platform.
Trading the Inside Bar Pattern
Trading with the inside bar candlestick pattern involves using it as a signal for potential breakouts or continuation of the prevailing trend. Here are the steps traders usually follow when trading with the pattern:
Determine the Direction of the Preceding Trend
Traders may use trendlines or moving averages (EMA or SMA) to define overall market bias and confirm trend direction.
When the formation develops within a strong, established trend and aligns with that trend’s direction, it is typically interpreted as a continuation setup. However, when the same structure appears after an extended directional move and forms at significant technical levels such as higher-timeframe support, resistance, or supply and demand zones, it may instead reflect trend exhaustion and potential reversal conditions. For this reason, traders evaluate both trend context and location before assigning directional bias to the pattern.
In some cases, several inside bars may form consecutively, creating a coiling pattern that reflects extended price compression and can precede a stronger volatility expansion.
Wait for a Breakout
The formation indicates consolidation and potential price compression. Traders often wait for a breakout from the setup’s range to initiate a trade. A breakout above the high of the formation suggests a bullish signal, while a breakout below the low indicates a bearish signal.
However, failed or false breakouts—sometimes referred to as fakey setups—can occur when price briefly breaks the mother bar range before reversing, often due to low liquidity or weak momentum.
Breakouts that occur near key support and resistance levels confirmed by additional tools are often considered stronger. John Murphy’s Technical Analysis of the Financial Markets highlights the value of indicators such as RSI and MACD in confirming breakout strength. Low-volume moves carry a higher risk of false breakouts.
Some traders monitor these false breaks as potential reversal signals, particularly when they occur against an extended trend.
Consider Additional Confirmation
Many traders wait for 2-3 candlesticks to form in a breakout direction. Also, to avoid false breakouts, traders may look for additional confirmation indicators to support their trading decisions. An increasing volume at the breakout or a signal from a trend indicator may provide additional confluence. Common confirmation tools include Average True Range (ATR) and volume indicators, which may help assess volume and volatility conditions.
Set Their Entry Points
Traders typically apply several entry models when trading an inside bar setup. The most common approach is a breakout entry using stop orders placed beyond the high or low of the mother bar.
In trend-continuation conditions, traders may also use a break-and-retest model, entering after price closes beyond the formation and then retests the breakout level as support or resistance.
Set Stop-Loss and Take-Profit Orders
Although there are no strict rules, traders typically set stop-loss orders above the bearish and below the bullish pattern, considering the timeframe and the entry point, so they aren’t too wide. Some traders trail stops below swing highs or lows during strong trends. Monitoring volatility through tools such as ATR may also help traders determine whether to widen or tighten stops as the market transitions from consolidation to expansion.
For take-profit targets, traders might consider significant swing points or key support/resistance levels. As part of risk management, traders often apply predefined risk-to-reward ratios (such as 1:2 or 1:3) and adjust position sizing.
Live Market Example
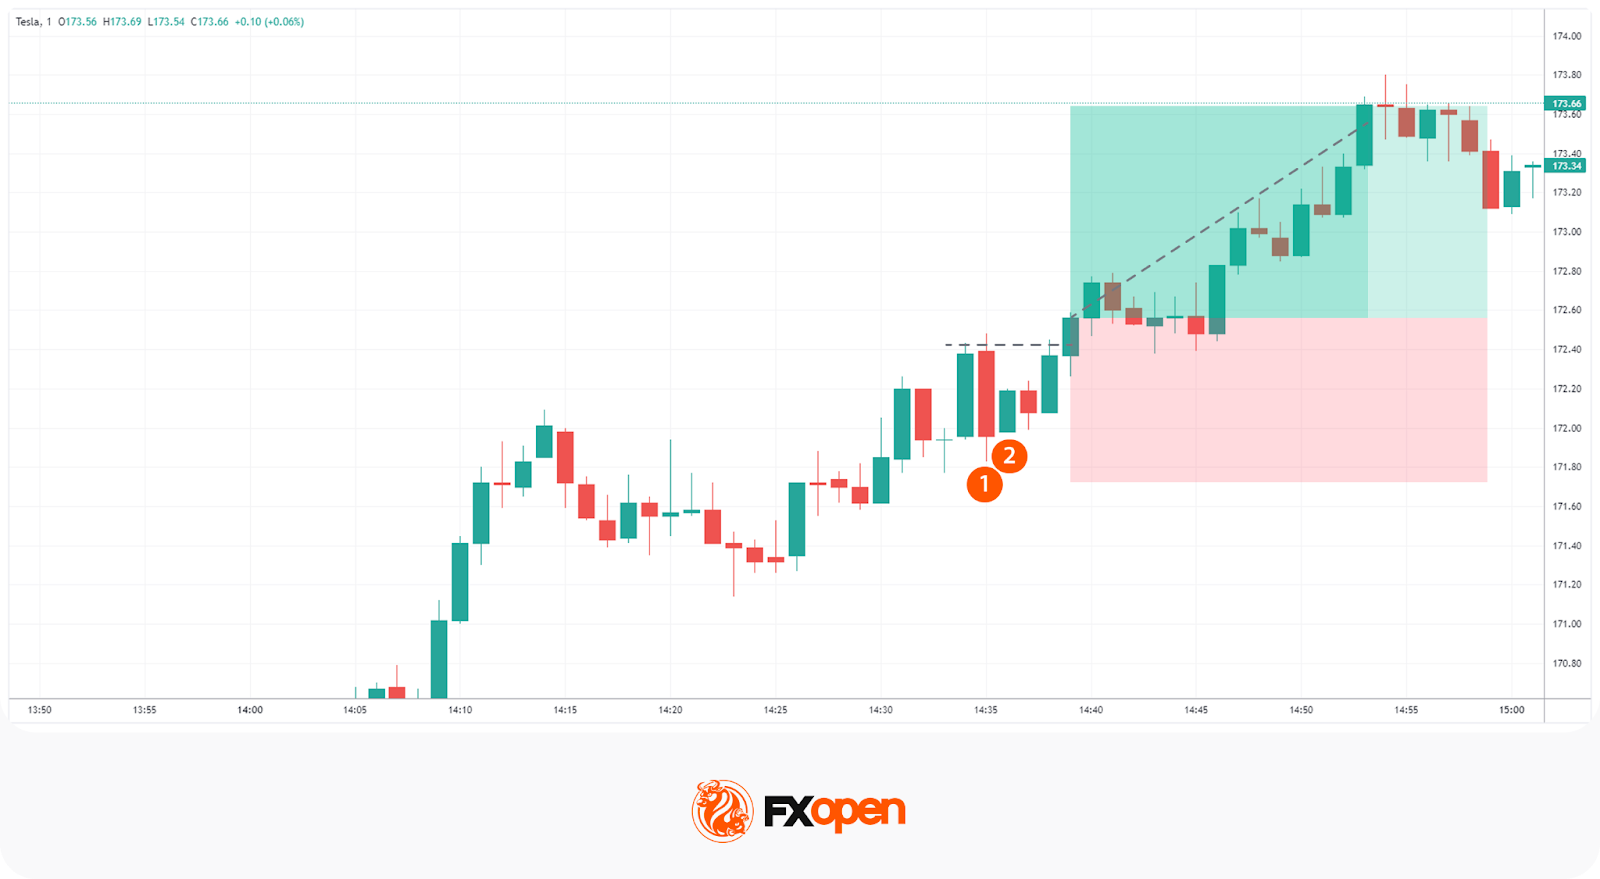
Below, we provide an example of an inside bar breakout strategy with a bullish inside bar stock pattern on a Tesla chart. This setup represents a typical bullish continuation pattern, where the breakout is confirmed by candles closing above the mother bar’s high and holding above a nearby resistance level.
Following the inside bar breakout trading strategy, the trader waits for the breakout above the high of the mother bar marked by a horizontal line. The stop loss is set below the candle’s low, and the take profit is at the next resistance level.
Final Thoughts
While the inside bar pattern can be a useful tool for identifying trend reversals and continuations, it’s important not to rely solely on this pattern for your trading decisions. In practice, traders often combine the inside bar with technical indicators, broader market context, and structured risk management tools to form a complete trading strategy.
If you want to develop your own trading strategy, you can use FXOpen’s TickTrader trading platform. If you have a strategy and you would like to trade it across over 700 instruments with tight spreads and low commissions (additional fees may apply), you can consider opening an FXOpen account.
FAQ
Is an Inside Bar Bullish or Bearish?
The inside bar setup does not inherently indicate a bullish or bearish bias. It simply represents a period of consolidation or market indecision. Thus, a formation in an uptrend can be bullish and signal a continuation of the trend, or bearish and signal a trend reversal. The same concept applies to a downtrend, where the indicator may be bearish and the trend will continue, or bullish and the trend will reverse.
What Does a Bullish Inside Bar Mean?
The meaning of an inside bar candle pattern that is bullish refers to the pattern, after which the price moves upwards. When this pattern forms during an uptrend, it suggests a temporary pause or consolidation before the uptrend potentially resumes. When it is formed in a downtrend, it signals a trend reversal.
What Is the Inside Bar Strategy?
In the inside bar strategy, traders wait for the pattern to form and look for a breakout above the high of the formation to enter a long position or below the low to enter a short trade. A stop-loss order might be placed below the low of the pattern in a long trade and above the high of the pattern in a short trade. Profit targets can be determined based on the trader’s trading plan, technical indicators, or key support and resistance levels.
How May You Confirm an Inside Bar Signal?
As the inside bar provides both continuation and reversal signals, it is critical to confirm them. First, traders wait for the pattern to form and the following candles to close above or below it. Second, traders use volume or momentum indicators to identify the strength of the price movements. Another option is to use chart patterns that also provide continuation or reversal signals. Confirmation may also come from alignment with support and resistance or volatility conditions measured by ATR.
Are Inside Bars More Popular in Downtrends?
No, the inside bar pattern can be used in both uptrends and downtrends. No statistics can confirm that the pattern is more preferable in a downtrend. Traders can use it in their trading strategies regardless of the trend they trade in.
Which Timeframe Is Most Popular for Inside Bar Trading?
The inside bar pattern can form on any timeframe, but many traders consider it more reliable on higher timeframes, such as the H1, H4, and daily charts. Higher timeframes tend to reduce market noise and filter out minor price fluctuations, which may lower the risk of false breakouts. Lower timeframes, such as 5-minute or 15-minute charts, can also be used, but they often require stricter confirmation and more active risk management.
Is the Inside Bar a Breakout or Continuation Pattern?
The inside bar is described as a neutral consolidation pattern rather than a strictly breakout or continuation setup. It reflects a pause in price action caused by range contraction and reduced volatility. Depending on market context, an inside bar may lead to a breakout, signal a trend continuation, or occasionally precede a trend reversal. Traders usually rely on the prevailing trend, support and resistance levels, and confirmation tools, such as momentum readings from RSI or MACD, increased volume, or volatility conditions measured by ATR, to determine how to trade the setup. However, in the Encyclopedia of Chart Patterns, Bulkowski presents that the pattern provides continuation signals in 62% of cases.
How Reliable Is the Inside Bar in Forex Trading?
The reliability of the inside bar in forex trading depends largely on market conditions and confirmation. The common required conditions for any trade are liquid currency pairs and active trading sessions, such as the London or New York sessions. When combined with tools like support and resistance, momentum indicators, and clear risk management rules, the inside bar can be a useful component of a broader trading strategy. On its own, however, it should not be treated as a guaranteed signal.
*Important: At FXOpen UK, Cryptocurrency trading via CFDs is only available to our Professional clients. They are not available for trading by Retail clients. To find out more information about how this may affect you, please get in touch with our team.
This article represents the opinion of the Companies operating under the FXOpen brand only. It is not to be construed as an offer, solicitation, or recommendation with respect to products and services provided by the Companies operating under the FXOpen brand, nor is it to be considered financial advice.

Crypto World
Galaxy Digital’s (GLXY) testnet suffers hack but no client funds or information were compromised

Galaxy Digital (GLXY), the digital asset financial services firm founded by Mike Novogratz, said it recently contained a cybersecurity incident involving unauthorized access to an isolated development workspace, according to a statement from a company spokesperson.
“An immaterial amount of company funds used for testing within the isolated development workspace was impacted,” the spokesperson said in emailed comments. The loss was less than $10,000, according to a person with knowledge of the matter.
The firm emphasized that the affected environment was used solely for research and development and was not connected to its core infrastructure, production systems, trading platforms or client accounts.
Galaxy said it detected the intrusion and moved quickly to contain it, secure the compromised workspace and implement additional precautionary measures across its on-chain infrastructure.
“No client funds or client account information were accessed or at risk at any point based on our review to date,” Galaxy said, adding that all platforms and services remain fully operational and secure for clients.
Hacks and exploits remain a persistent risk in the crypto industry, where the combination of open-source code, large pools of onchain liquidity and uneven security practices creates an attractive target for attackers.
Billions of dollars are lost to smart contract exploits, phishing schemes and infrastructure breaches, with industry estimates often exceeding $1–2 billion annually in recent years.
Even when incidents are contained, and client assets are not impacted, breaches can erode trust, trigger heightened regulatory scrutiny and underscore the operational risks facing firms operating in largely irreversible, always-on financial systems.
Galaxy is a diversified financial services and investment firm focused on the digital asset and blockchain sector, providing institutional clients with trading, asset management, lending, advisory and custody services.
The firm operates across several core business lines, including global markets, asset management and digital infrastructure, while also running businesses in areas like crypto mining, staking and data center operations.
Positioned as a bridge between traditional finance and crypto, Galaxy offers institutional-grade access to digital assets and related technologies, alongside investments in blockchain ventures and emerging areas such as AI-powered infrastructure.
The company said it is continuing to review the incident and will provide updates as appropriate.
Read more: Bitcoin’s quantum threat is real, but far from an existential crisis, Galaxy says
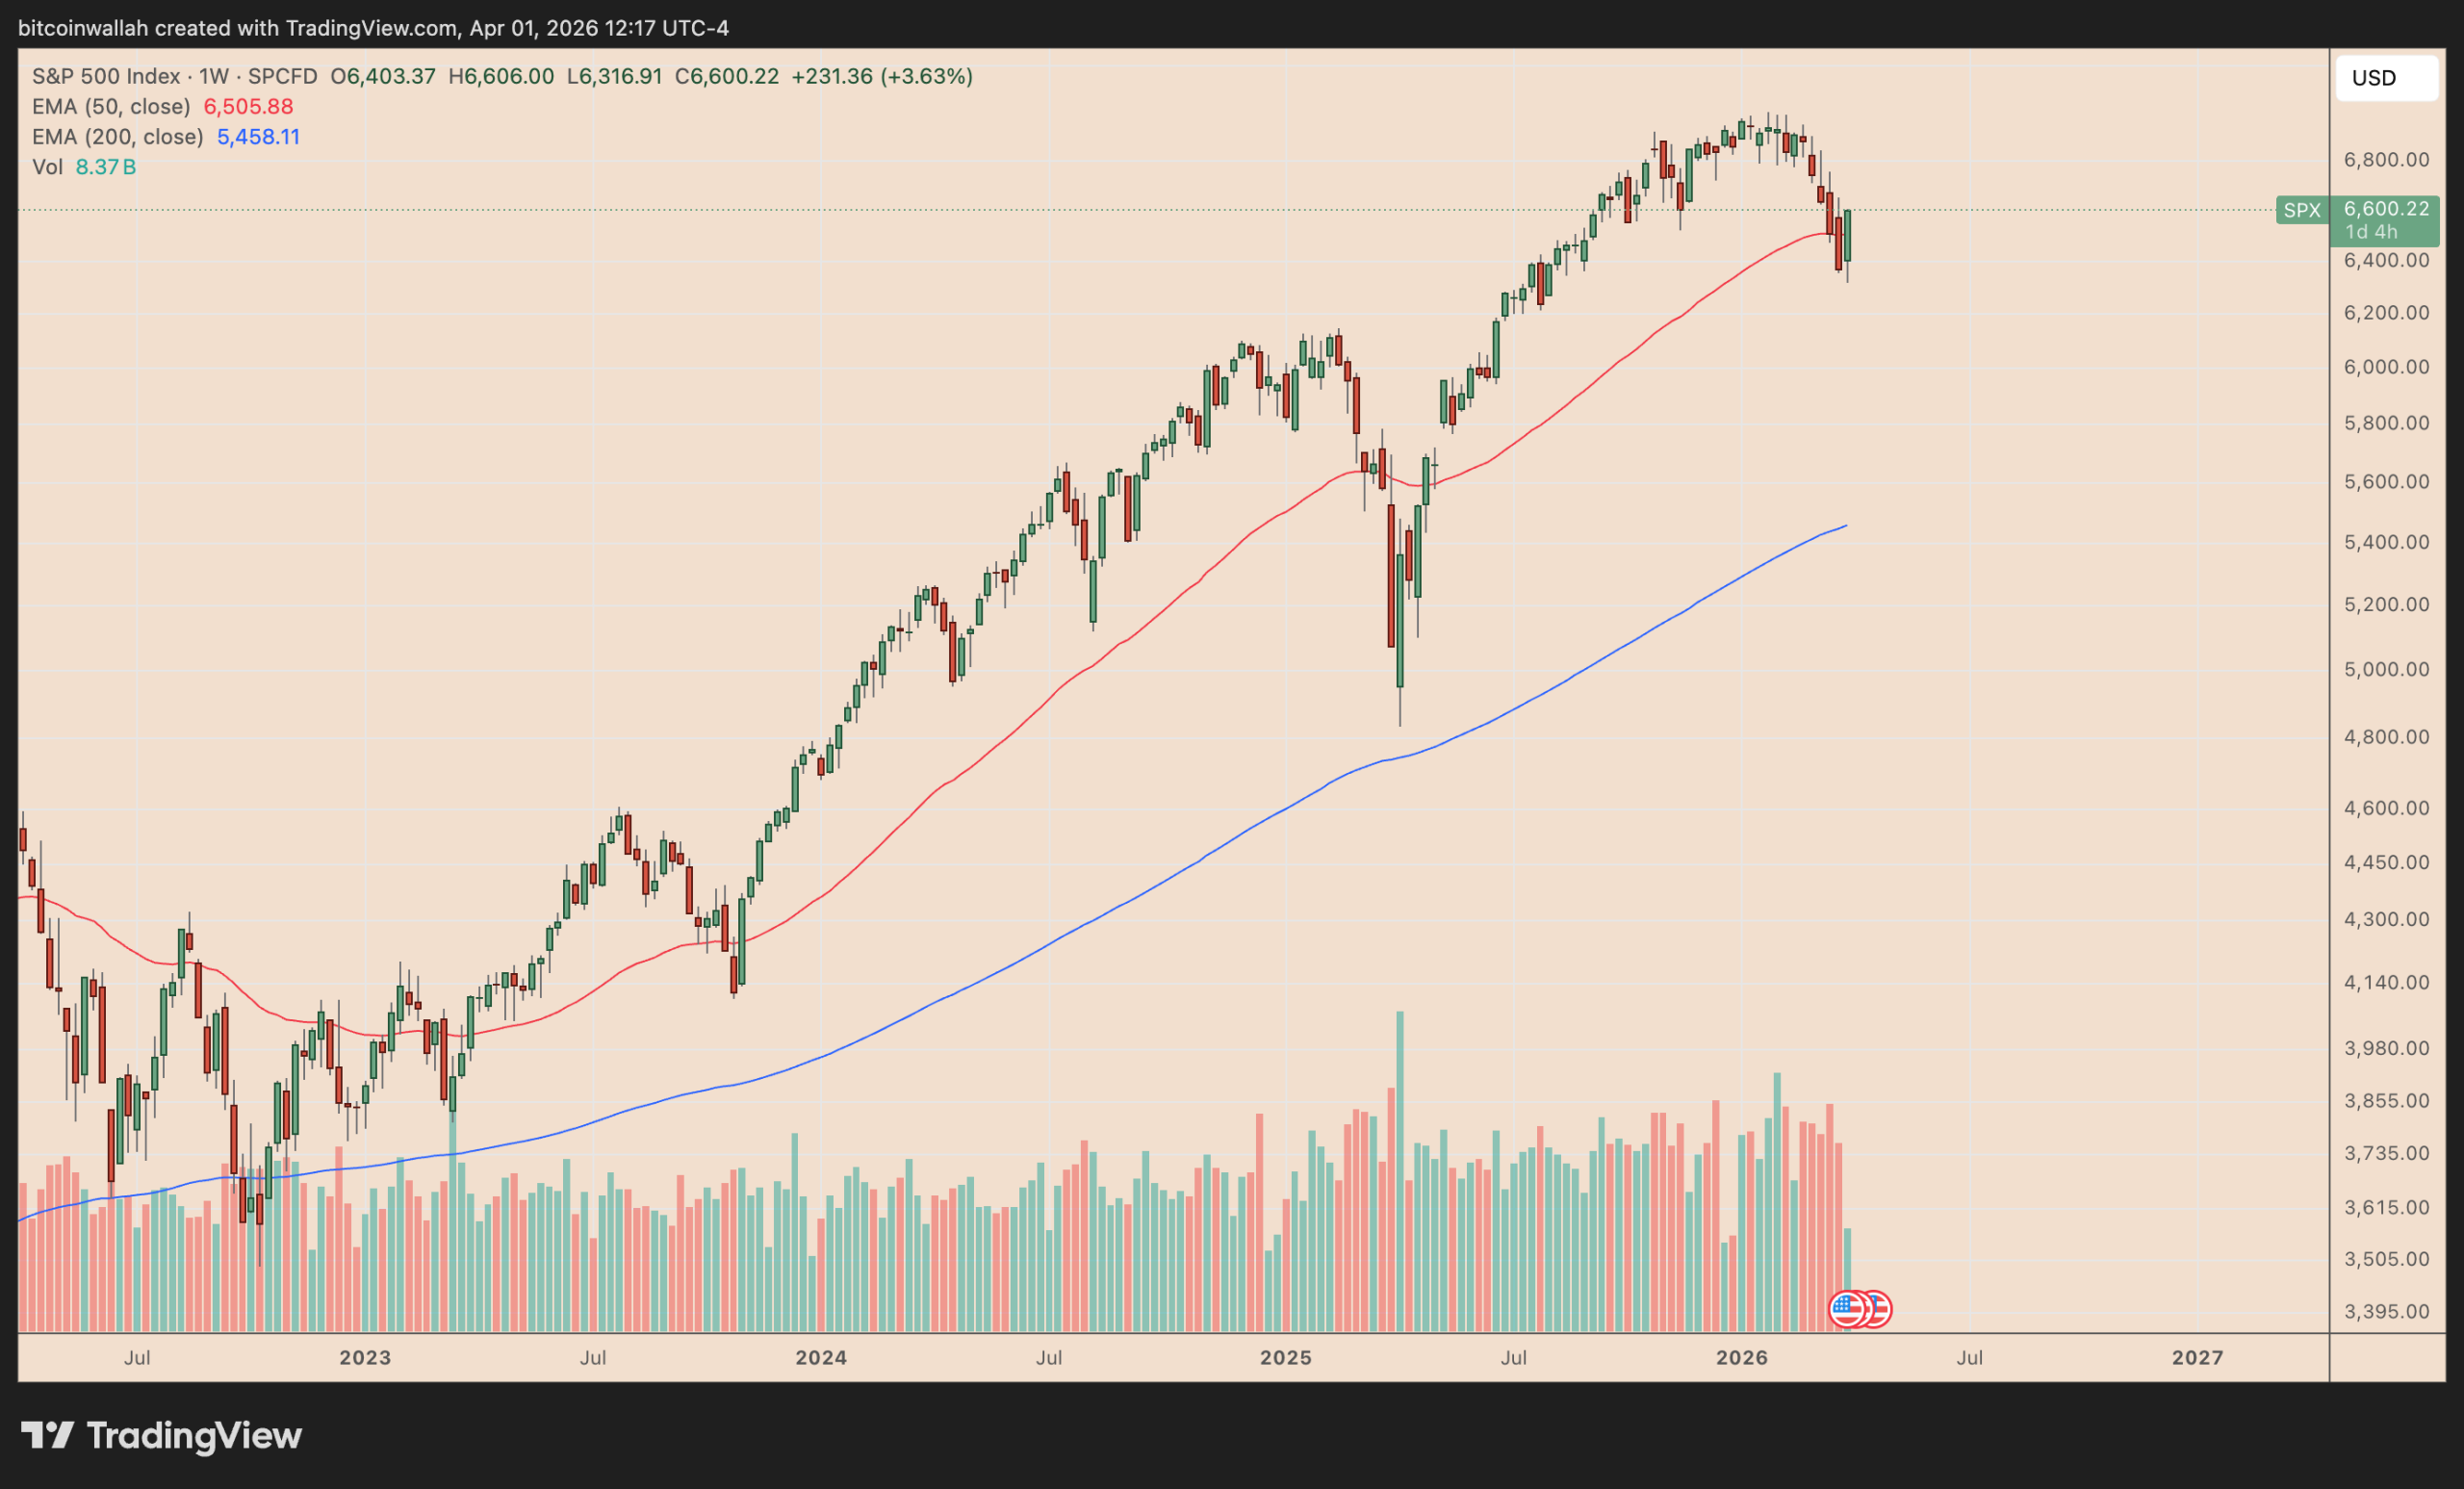
Warren Buffett, the legendary investor and chairman of Berkshire Hathaway, revealed on CNBC this week that his firm purchased approximately $17 billion in US Treasury bills at the latest auction. Is a stock market crash coming and what does it mean for Bitcoin (BTC)?
Key takeaways:
-
Berkshire held $373 billion in cash or cash equivalents as of 2025’s close, more than double the levels in 2023.
-
The firm’s rising cash reserves typically precede major stock market crashes, a bad sign for Bitcoin.
Buffett still sees better value in cash than in stocks
Buffett’s message is straightforward: Berkshire does not see the recent equity pullback as a sufficiently attractive buying opportunity.
For context, the S&P 500 has fallen about 5.75% since reaching a record high in January.

Buffett said stocks are not “substantially” cheaper after the decline and described the sell-off as “nothing” compared with earlier downturns in which markets fell more than 50%.
That helps explain Berkshire’s latest Treasury-bill purchase. The company ended 2025 with about $373 billion in cash and equivalents, up from a record $334.2 billion a year earlier and more than double its level at the end of 2023.
Buffett, who famously called Bitcoin “rat poison,” typically gets into cash before major stock crashes, historical data shows.
In 1998, for instance, Buffett began trimming Berkshire’s stock exposure and raising cash, pushing the company’s cash and cash-equivalents holdings to $13.1 billion, or about 23% of total assets.

By mid-2000, that figure had climbed to nearly $15 billion, or roughly 25% of assets, before Berkshire started deploying capital into bargains as the Dot-com bubble burst.
Bitcoin’s positive correlation with stocks may hurt prices
Bitcoin has traded more like a stock than a traditional safe haven for much of the post-2020 period, often moving in the same direction as US equities, especially the tech-heavy Nasdaq.
As of Wednesday, the 20-week rolling correlation coefficient between the two markets was positive at 0.47.

If Buffett’s risk-off strategy is correct, then Bitcoin should see another crash alongside stocks. Fresh quantum-security concerns, war-driven inflation risks, and nearly 50% US recession odds are putting pressure on the BTC price.
Berkshire’s portfolio decisions have also leaned away from crypto-adjacent finance.
In the first quarter of 2025, the firm fully exited Nu Holdings, a crypto-friendly fintech company, after building its position in 2021 and 2022. It secured about $250 million in profits from these investments.
Multiple analysts predict BTC’s price to drop to as low as $30,000 in 2026.
This article is produced in accordance with Cointelegraph’s Editorial Policy and is intended for informational purposes only. It does not constitute investment advice or recommendations. All investments and trades carry risk; readers are encouraged to conduct independent research before making any decisions. Cointelegraph makes no guarantees regarding the accuracy or completeness of the information presented, including forward-looking statements, and will not be liable for any loss or damage arising from reliance on this content.

Onchain data shows more than a dozen asset types drained from the Solana perp DEX’s main vault address in a rapid burst of transactions.

TLDR
- EDX Markets has applied for a national trust bank charter with the Office of the Comptroller of the Currency.
- The charter would allow the company to offer regulated custody, asset management, and principal trading services.
- The exchange plans to separate custody and settlement functions from its trading operations.
- Chief executive Tony Acuña-Rohter said the trust charter would help serve institutional clients.
- The move follows conditional trust charter approvals granted to Circle and Ripple in December.
EDX Markets has filed for a national trust bank charter with the Office of the Comptroller of the Currency. The application would allow the crypto exchange to expand custody and settlement services under federal oversight. The move marks a direct step toward deeper integration with the US banking system.
Citadel-Backed Platform Seeks Federal Trust Status
EDX Markets submitted its application on April 1, according to public filings. The company seeks approval to operate as a national trust bank under OCC supervision. The charter would permit custody, asset management, and principal trading within a regulated structure.
The exchange stated that the new structure would separate custody and settlement from trading functions. It argued that combining brokerage, exchange, and custody roles creates conflicts and operational risk. Therefore, it aims to align its operations with traditional financial market models.
EDX Markets operates an institutional crypto platform backed by Citadel Securities and other financial firms. The company said the trust charter would strengthen safeguards for client assets. It added that federal supervision would support secure custody and settlement systems.
Chief executive Tony Acuña-Rohter said large banks will shape the next stage of digital asset adoption. He stated, “Obtaining a trust charter positions us to meet institutional demand for regulated custody.” He added that the structure supports clients requiring compliant asset management services.
The company maintained that the trust model reflects established practices in equities and derivatives markets. In those markets, exchanges, brokers, custodians, and market makers operate separately. EDX Markets said this separation limits conflicts between trade execution and asset custody.
Application Reflects Policy Shift Toward Digital Assets
The filing comes as federal regulators show greater openness to crypto firms entering the banking system. Several companies have sought national trust charters in recent months. Regulators have reviewed these applications under existing banking laws.
In December, regulators granted conditional approvals to Circle Internet Group and Ripple. Those approvals allowed both firms to pursue trust bank operations under federal supervision. The decisions placed custody and asset management within the regulatory perimeter.
EDX Markets stated that its proposed structure would reduce systemic risk across crypto platforms. It said separating custody and trading functions strengthens protections for client funds. The firm emphasized that regulated settlement systems improve operational transparency.
Founded in 2022, EDX Markets built its platform for institutional investors entering digital assets. Backers include Citadel Securities, Virtu Financial, Fidelity Digital Assets, and Hudson River Trading. The exchange designed its order-matching system to mirror traditional market infrastructure.
National trust banks can hold client assets and manage portfolios under OCC oversight. They can also provide fiduciary and custody services within federal rules. EDX Markets confirmed that it will continue operating its existing order-matching platform during the review process.


Block co-founder Jack Dorsey and the company’s lead independent director, Roelof Botha, have laid out a forward-looking vision in which artificial intelligence could fundamentally change how work is coordinated. In a blog post published this week, they describe a model where AI would take on the tasks typically handled by middle managers—tracking projects, flagging issues, assigning work, and sharing critical information faster than human processes allow.
The post comes on the heels of Block’s previously reported workforce restructuring, part of a broader wave of AI-driven cost-cutting across the tech sector. Block disclosed that it cut roughly 4,000 jobs in February, an action Dorsey attributed to the rapid pace of AI adoption and the need to stay competitive. In March, some of the employees who had been laid off were quietly rehired, illustrating a cautionary approach to the current wave of optimization. The blog authors emphasize that AI’s role in the new model is evolving, not yet fully realized, and that Block remains in the “early stages” of testing how an intelligence-centric structure could function in practice.
“We’re questioning the underlying assumption: that organizations have to be hierarchically organized with humans as the coordination mechanism. Instead, we intend to replace what the hierarchy does. Most companies using AI today are giving everyone a copilot, which makes the existing structure work slightly better without changing it. We’re after something different: a company built as an intelligence, or mini-AGI.”
Key takeaways
- Block’s leadership proposes replacing traditional hierarchical management with an intelligence-driven framework that leverages AI to coordinate work and decision-making.
- The envisioned structure redefines roles around three pillars: individual contributors, directly responsible individuals, and player-coaches who mentor while continuing to contribute technically.
- AI would enable real-time visibility into what’s being built, what’s blocked, resource allocation, and overall product performance, potentially speeding up information flow beyond conventional managerial channels.
- Despite the AI emphasis, human involvement remains central to strategic and ethical decisions, signaling a blended governance approach rather than a pure automation model.
From hierarchy to intelligence: Block’s strategic shift
The core idea articulated by Dorsey and Botha is a pivot away from the familiar pyramid where instructions travel up and down through layers of management. In a remote-first, machine-readable environment, AI would continuously build and maintain a live picture of organizational activity: what’s in development, what’s blocked, where resources are needed, and what outcomes are proving effective or failing. The authors describe the aim as moving beyond “copilot” enhancements to a more transformative design—an organization that operates as an intelligence rather than a traditional hierarchy.
They emphasize that the pattern could reshape corporate operation across sectors, not just within Block. The argument rests on a simple premise: information flow drives speed and adaptability. If AI can handle the coordination overhead more efficiently than humans, the bottlenecks created by layers of management could recede, enabling faster iteration and more responsive leadership decisions.
To illustrate the proposed shift, Block outlines a three-tier talent model. Individual contributors would be responsible for building and maintaining the operating systems that power the company’s workflows. Directly responsible individuals would tackle specific problems and be empowered to marshal any resources necessary to resolve them. Between these layers, player-coaches would assume manager-like duties—mentoring and supporting others—while continuing to contribute code and substantive work themselves. In this arrangement, the traditional gatekeeping function of middle management would be distributed and augmented by AI-enabled visibility and automation.
People still in the driver’s seat
Even as AI takes on coordination tasks, Dorsey and Botha stress that human judgment remains indispensable. They acknowledge that AI can process information at a scale and speed far beyond human capability, but key business and ethical decisions will continue to require human insight. The blog notes that while AI can present a continuously updated view of operations, it cannot substitute for the values, prudence, and accountability that guide corporate governance.
This stance sits at an important crossroads for investors and workers alike. The acceleration of AI-driven restructuring has historically raised questions about job security, morale, and the long-term viability of new organizational paradigms. Block’s own experience—balancing a major layoff with later rehiring of some affected employees—illustrates a cautious, iterative approach rather than a speculative leap into a fully automated future. The authors’ framing suggests a model where AI acts as a force multiplier for human capabilities, rather than replacing people wholesale.
Why it matters for crypto-adjacent ventures
The broader crypto and fintech sectors have watched Block (the company behind the Cash App and a notable crypto-friendly stance) as a bellwether for technology-enabled financial services. If an AI-first, intelligence-driven corporate structure gains traction, it could influence how other blockchain and payments firms think about product development cycles, regulatory compliance, and governance practices. The potential impact extends to how quickly teams can respond to security risks, how product roadmaps are validated in real time, and how cross-functional collaboration is organized in a hybrid or fully remote environment.
From an investor perspective, the shift raises questions about how governance, risk controls, and performance metrics would be managed in an AI-augmented organization. Real-time visibility into development pipelines and resource allocation could improve transparency, but it also heightens sensitivity to data quality, AI oversight, and ethical considerations in automated decision-making. As with any large-scale adoption of AI in corporate governance, the outcomes will hinge on guardrails, accountability, and the ongoing calibration of human-in-the-loop processes.
Block’s announcement aligns with a wider industry conversation about whether AI can augment, or even replace, certain managerial functions. While the blog presents a staged, experimental path toward an intelligent enterprise, observers will be watching to see whether early pilots yield tangible improvements in productivity, risk management, and employee engagement. The balance between speed and governance will be particularly telling in sectors where regulatory scrutiny and customer trust are paramount.
What to watch next
The immediate questions center on execution and governance. How quickly will Block move from a conceptual framework to concrete organizational changes? What criteria will the company use to assess the success of its AI-driven coordination model? And how will Block address potential pitfalls, such as algorithmic bias, data silos, or accountability for automated decisions?
As AI continues to redefine work patterns across the technology landscape, Block’s approach could foreshadow a broader shift in corporate design. If the model proves adaptable and beneficial, it may prompt other firms to experiment with similar intelligence-driven structures, especially in environments that prize rapid iteration and remote collaboration.
Readers should monitor Block’s forthcoming updates and pilot implementations to gauge whether the vision moves from theory to practice and how those developments influence investor confidence, employee experience, and the broader discourse around AI-enabled governance.

XRP is trading near $1.36 with modest 24-hour gains of up +2.6% in price, but the real story is regulatory, and it could reshape Ripple’s long-term value prediction entirely. The Office of the Comptroller of the Currency’s landmark final rule takes effect April 1, and Ripple is positioned squarely in its crosshairs.
The OCC’s final rule revises chartering regulations to allow national trust banks to conduct non-fiduciary activities alongside fiduciary ones, a structural change that opens the U.S. banking system to crypto-native operators at a federal level.
— JackTheRippler © (@RippleXrpie) March 31, 2026
 RUMORS: @Ripple will officially receive the approval to become a National Trust Bank tomorrow, April 1st. #XRP pic.twitter.com/pDpLpg70jG
Ripple’s conditional approval as a National Trust Bank was granted alongside approvals for BitGo, Fidelity, and Paxos, signaling this isn’t a one-off concession but a systemic policy shift. The full charter remains pending, but conditional approval already allows Ripple to custody client assets under federal oversight as a direct boost to institutional confidence in both XRP and the RLUSD stablecoin.
This development lands as U.S. regulators push crypto deeper into traditional financial infrastructure, making the timing anything but coincidental. The price, however, tells a more complicated story.
Discover: The best pre-launch token sales
XRP Price Prediction: Ripple to Reclaim $2.00 Amid Regulatory Tailwinds?
XRP 24-hour trading volume surging to $2.1 billion, even if conviction is mixed, it is still a notable volume spike. Support still clusters at $1.30 – $1.35, the range that has held through recent consolidation. Resistance begins at $2.20 and extends toward $3.30, the upper bound of recent 24-hour highs recorded on Binance.
XRP remains -63% off its 2025 all-time high of $3.65, with Standard Chartered having revised its 2026 XRP forecast down to $2.80 from an earlier $8.00 target, citing deteriorating market conditions.
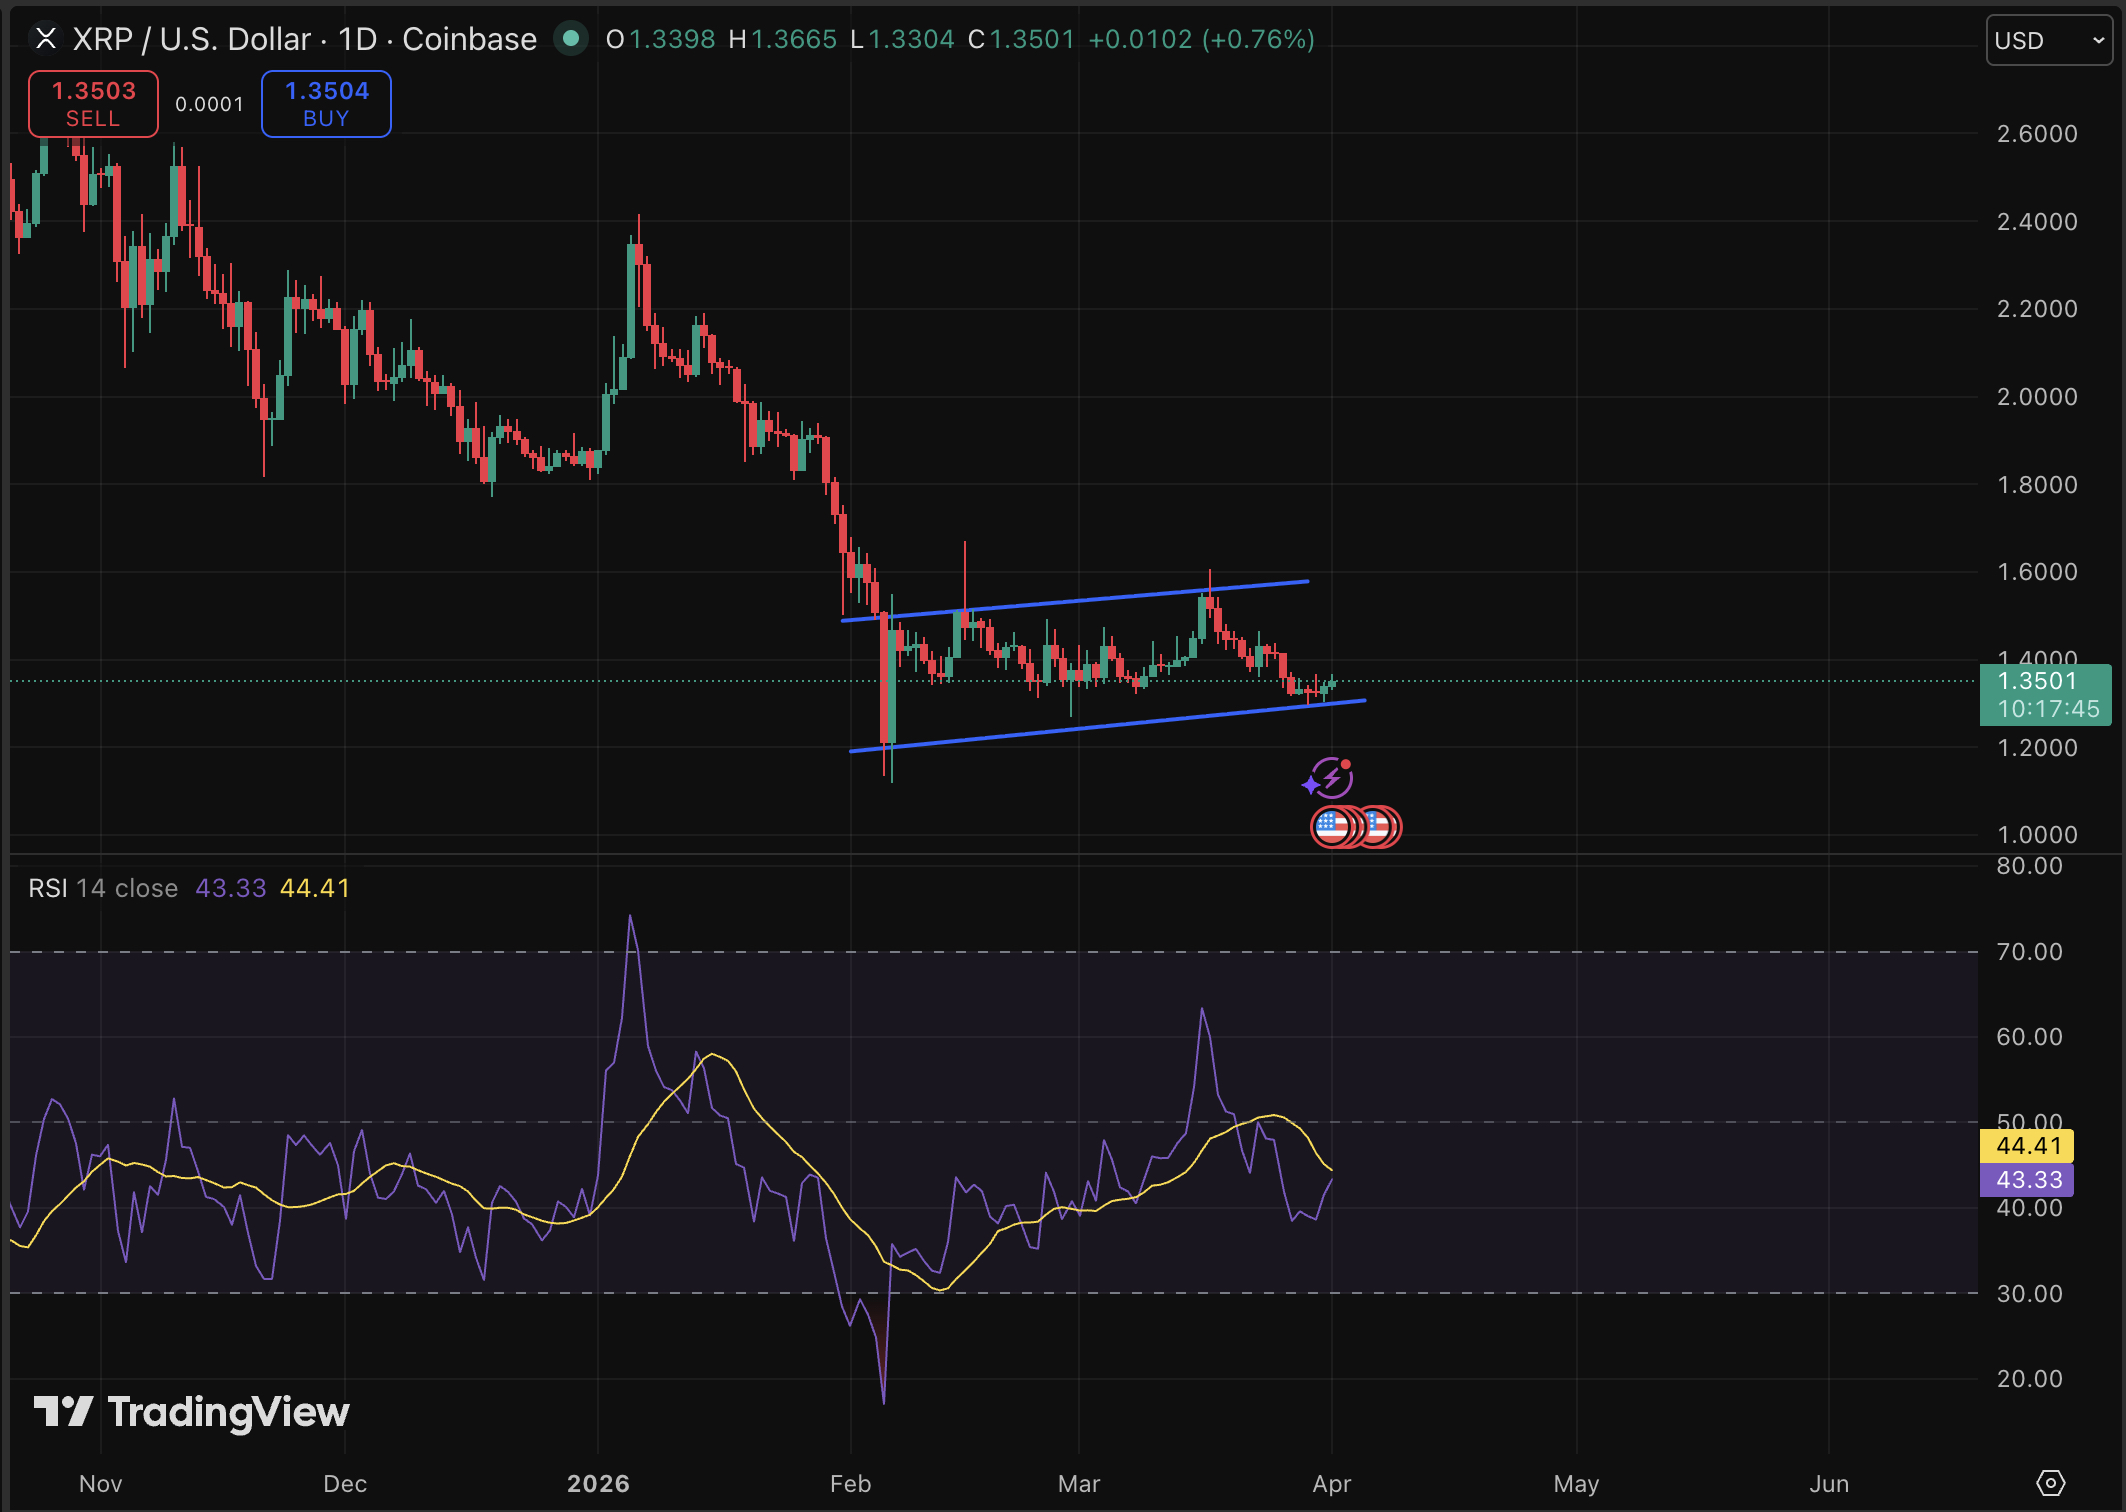
April 1 OCC rule, however, can trigger institutional inflows with XRP reclaiming $2.20 resistance within 30 days as custody clarity drives TradFi adoption. But most likely, XRP price consolidates in the $1.35–$1.80 range through Q2 2026, with the full trust bank charter serving as the next catalyst.
The OCC news is structurally bullish for XRP long-term. Near-term price action, though, appears hostage to broader market sentiment until the full charter lands.
Discover: The best crypto to diversify your portfolio with
Bitcoin Hyper Eyes Infrastructure Upside as XRP Tests Critical Support
XRP’s regulatory breakthrough is real, but at a $83B+ market cap, the ceiling on percentage returns requires a specific kind of optimism. Traders hunting asymmetric upside in the current cycle are increasingly rotating toward earlier-stage infrastructure plays where the valuation gap is wider, and the catalyst timeline is front-loaded.
Bitcoin Hyper ($HYPER) is one project absorbing that attention. It positions itself as the first-ever Bitcoin Layer 2 with Solana Virtual Machine (SVM) integration, bringing sub-second smart contract execution to Bitcoin’s ecosystem without compromising the underlying security model. Bitcoin’s trust, Solana’s speed.
The presale has raised $32 million at a current token price of $0.0136, with 36% APY staking rewards available for early participants. Features include a Decentralized Canonical Bridge for BTC transfers, extremely low-latency Layer 2 processing, and high-speed, low-cost transaction execution that outperforms Solana itself on throughput metrics.
Research Bitcoin Hyper before the presale closes.
This article is for informational purposes only and does not constitute financial advice. Crypto assets are highly volatile. Always conduct your own research before investing.
The post XRP Price Prediction: Ripple to Become National Bank? appeared first on Cryptonews.
Crypto World
Solana (SOL) DeFi platform Drift investigates suspicious activity, tells users to halt deposits


Solana-based decentralized finance (DeFi) platform Drift said it is investigating “unusual activity” on its protocol, prompting concerns that the platform may have been exploited.
“We are observing unusual activity on the protocol. We are currently investigating. Please do not deposit funds into the protocol while we investigate,” Drift wrote in a post on X. “This is not an April Fools joke. Proceed with caution until further notice. We’ll provide additional updates from this account.”
The warning triggered speculation across the crypto community, with some users reporting irregular behavior tied to their positions.
Helius CEO Mert Mumtaz added to the concern in a separate X post, writing, “not 100% fully certain yet, but it seems drift might be getting exploited.” Helius is a key infrastructure provider on Solana, offering APIs and node services that developers and platforms rely on to access blockchain data.
If confirmed, an exploit could affect user funds and add pressure on Solana’s DeFi ecosystem, which has seen renewed growth in recent months.
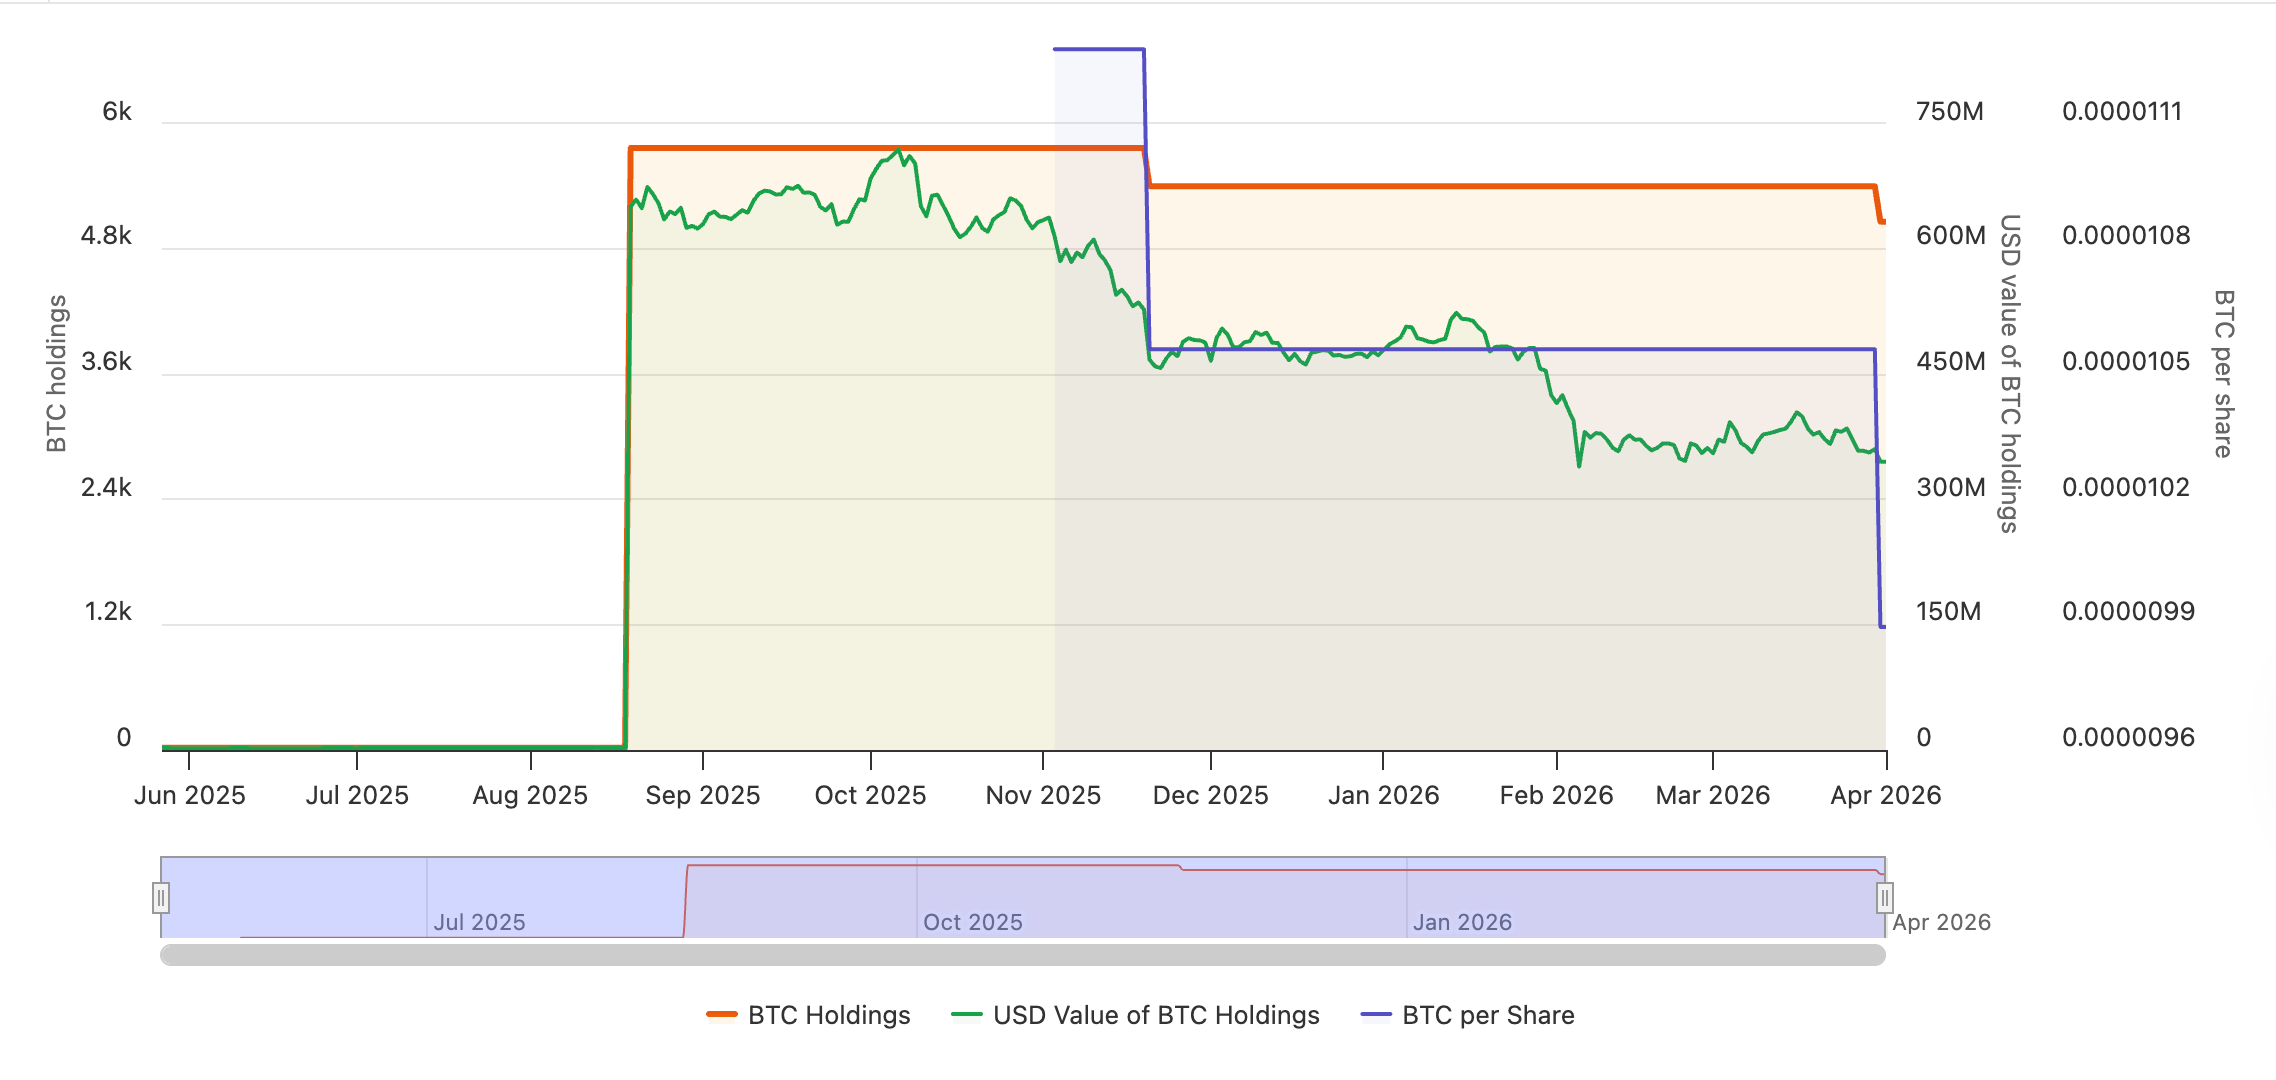
The value of the Bitcoin treasury company’s holdings peaked at over $711 million in October 2025, when BTC hit an all-time high of about $126,000.
Bitcoin (BTC) treasury company Nakamoto (NAKA) selling its BTC at a loss could signal capitulation of more crypto treasury companies and the start of a “contagion” that could spark a wave of forced selling, according to market analyst Nic Puckrin.
“Cracks are beginning to show in the digital asset treasury (DAT) market,” Puckrin said, adding that the war in the Middle East will likely place further pressure on Bitcoin’s price and treasury companies in a reinforcing cycle. He said:
“Price is likely to remain below $70,000 for some time and could fall further to a range around $55,700-$58,200 in the coming weeks. This ongoing weakness would put further pressure on DATs, which could in turn exacerbate the sell-off.”
Nakamoto sold 284 BTC in March for $20 million, implying a price of about $70,000 per coin; the company also reduced its stake in the publicly traded Bitcoin treasury company Metaplanet, selling shares at a loss.

At the end of 2025, the company valued its 5,342 BTC treasury at $467.5 million and recorded a $166.1 million loss on the fair value of its digital asset holdings in the fourth quarter, according to the company’s 10-K filing with the Securities and Exchange Commission (SEC).
The crypto treasury sector saw a collapse in net asset value premiums during Q3 2025, and stock prices declined even before the crypto market crash in October 2025, which sparked a prolonged bear market and a decline in digital asset prices.
Related: Bitcoin miners offload 15K BTC since October, with more sales expected
MARA also sells BTC in March as market rout continues
Bitcoin mining company MARA also sold 15,133 Bitcoin in March, valued at over $1 billion, to repurchase and retire about $1 billion in convertible debt.

MARA’s vice president for investor relations, Robert Samuels, said the sale does not signal a core shift in the company’s BTC treasury strategy, but is a short-term tactical move.
“We may buy or sell from time to time, subject to market conditions and our capital allocation priorities. It does not mean we intend to liquidate the majority of our reserves,” Samuels said.
Magazine: Bitcoin’s ‘biggest bull catalyst’ would be Saylor’s liquidation: Santiment founder
TLDR
- Arizona advanced Senate Bill 1649 to a full House floor vote after clearing the House Rules Committee.
- The bill would allow the state to create a Digital Assets Strategic Reserve Fund.
- The proposal permits Arizona to retain seized cryptocurrencies instead of auctioning them.
- The legislation names XRP, Bitcoin, Monero, NEAR Protocol, and Nano as eligible assets.
- Lawmakers set criteria to assess adoption levels and transaction activity for reserve assets.
Arizona lawmakers advanced Senate Bill 1649 to a full House vote after clearing the House Rules Committee. The proposal would allow Arizona to retain seized digital assets in a state-managed fund. The measure names XRP, Bitcoin, and Monero as eligible assets under defined standards.
Arizona Crypto Reserve Plan Names XRP as Eligible Asset
The House Rules Committee approved SB1649 with eight votes in favor. As a result, the bill now heads to the full House for consideration. Lawmakers introduced the measure to create a Digital Assets Strategic Reserve Fund. The proposal allows the state to keep digital assets obtained through forfeiture or surrender. Currently, agencies auction most seized cryptocurrencies.
State Senator Mark Finchem introduced SB1649 earlier this session. The Senate Finance Committee passed the bill with a 4–2–1 vote. Lawmakers set criteria to determine which assets qualify for the reserve. The criteria review adoption rates, annual transaction volume, and ecosystem development. The bill lists XRP, Bitcoin, Monero, NEAR Protocol, and Nano as eligible assets.
The proposal authorizes the State Treasurer to manage the reserve fund. The Treasurer may invest holdings to generate returns for the state. However, the bill requires that investment actions do not increase financial risk. Lawmakers included this provision to guide fund management practices.
If the House approves SB1649, the bill will move to the governor’s desk. The governor may sign the measure into law or veto it. Lawmakers placed the bill on the House calendar following the committee vote.
Bitcoin and Monero Included in Arizona Reserve Framework
SB1649 identifies Bitcoin as a primary digital asset for the reserve. Lawmakers also included Monero under the eligibility framework. The bill groups these assets with XRP under a defined fair value threshold. This threshold evaluates economic strength and technical performance.
Under the measure, Arizona may retain cryptocurrencies received through legal processes. Agencies would transfer those assets to the reserve fund instead of auctioning them. The Treasurer would then oversee storage and management of the holdings. Lawmakers structured the bill to formalize how the state handles digital assets.
The legislation forms part of broader digital asset discussions in Arizona. Lawmakers are also considering Senate Bill 1042. That proposal would allow the state to invest up to 10% of public funds in cryptocurrencies. SB1042 remains under review in the state legislature.
At the federal level, digital asset reserves have also entered policy debates. President Donald Trump signed an executive order establishing a Strategic Bitcoin Reserve. The order also created a broader digital asset stockpile framework. Lawmakers referenced these developments during state discussions.
The House will now determine the fate of SB1649 in a floor vote. If members approve the measure, it will proceed to final executive consideration. The legislative process continues as scheduled in the current session.
TLDR
- Cango received a notice from the New York Stock Exchange after its shares traded below $1 for 30 consecutive days.
- The company has six months to regain compliance and avoid suspension or delisting proceedings.
- Cango secured a $10 million convertible note agreement with DL Holdings to strengthen its balance sheet.
- The financing includes warrants that allow share purchases at $2.70 per share.
- Cango recently closed a $65 million strategic investment settled in USDT and issued over 49 million Class A shares.
Cango faces a potential New York Stock Exchange (NYSE) delisting after its shares traded below $1 for 30 consecutive days. The exchange issued a compliance notice and granted a six-month cure period. Meanwhile, Cango secured fresh funding to support operations and expansion plans.
Cango Receives NYSE Compliance Notice Over Share Price
The New York Stock Exchange notified Cango on March 10 about non-compliance with its minimum price rule. The exchange requires an average closing price above $1 over 30 trading days. Cango’s shares fell below that threshold and triggered the notice.
The company now has six months to restore compliance and avoid suspension proceedings. Cango stated that it will monitor market conditions and assess available options. It also confirmed that its shares will continue trading during the cure period.
Cango’s stock has declined more than 70% this year. The shares recently traded near $0.39 after starting January above $1.40. Sustained selling pressure pushed the stock under the exchange’s minimum listing standard.
Cango Secures $10 Million Convertible Note to Support Expansion
Cango entered a $10 million convertible note agreement with Hong Kong-listed DL Holdings. The company also issued warrants allowing share purchases at $2.70 per share. Cango paired the financing with a non-binding cooperation framework.
The framework outlines potential joint investments in crypto mining and AI infrastructure. Cango said it will allocate proceeds toward upstream acquisitions and computing infrastructure expansion. The company continues shifting focus beyond bitcoin mining operations.
Management has positioned its global mining footprint as a base for high-performance computing services. The company plans to repurpose or expand power capacity for AI-driven workloads. This strategy supports revenue diversification within computing infrastructure.
Cango recently closed a $65 million strategic investment round. Entities controlled by Chairman Xin Jin and Director Chang-Wei Chiu led the transaction. The deal was settled in USDT and concluded on March 31.
The company issued more than 49 million Class A shares under that agreement. Cango said the capital strengthens its balance sheet. It aims to support operations during ongoing market pressure.
Management stated that it seeks to stabilize finances while executing long-term plans. The company continues evaluating measures to regain compliance with NYSE rules. Cango confirmed that it remains focused on meeting the $1 minimum requirement.
The recent fundraising activity reflects immediate capital needs. Cango continues trading on the NYSE under existing ticker terms. The company has not announced a reverse split or other corporate action.
Cango confirmed that it will provide updates regarding compliance efforts. The company emphasized that the notice does not immediately affect trading. Shares last changed hands near $0.39, reflecting year-to-date losses above 70%.
Scott Mills releases statement over ‘allegation’ after shock BBC termination

A Rough March For Gold As The Leading Precious Metal Searches For A Bottom (NYSEARCA:GLD)

Galaxy Digital’s (GLXY) testnet suffers hack but no client funds or information were compromised


-

 News Videos7 days ago
Parliament publishes latest register of MPs’ financial interests
-

 Business6 days ago
Instagram, YouTube Found Responsible for Teen’s Mental Health Struggle in Historic Ruling
-
 Tech6 days ago
Intercom’s new post-trained Fin Apex 1.0 beats GPT-5.4 and Claude Sonnet 4.6 at customer service resolutions
-

 NewsBeat5 days ago
The Story hosts event on Durham’s historic registers
-

 Sports5 days ago
Sweet Sixteen Game Thread: Tide vs Michigan
-
Entertainment2 days ago
Fans slam 'heartbreaking' Barbie Dream Fest convention debacle with 'cardboard cutout' experience
-
 Entertainment4 days ago
Lana Del Rey Celebrates Her Husband’s 51st Birthday In New Post
-
Crypto World1 day ago
Dems press CFTC, ethics board on prediction-market insider trades
-

 Sports1 day ago
Tallest college basketball player ever, standing at 7-foot-9, entering transfer portal
-

 Tech3 days ago
The Pixel 10a doesn’t have a camera bump, and it’s great
-

 Entertainment7 days ago
HBO’s Harry Potter Series Will Definitely Fail For One Big Reason, And It’s Not J.K. Rowling Or Snape
-

 Crypto World2 days ago
U.S. rule change may open trillions in 401(k) funds to crypto
-

 Tech1 day ago
EE TV is using AI to help you find something to watch
-

 Tech1 day ago
How to back up your iPhone & iPad to your Mac before something goes wrong
-

 Fashion6 days ago
En Vogue in Brown Leather and Tailored Neutrals by Atelier Savoir, Styled by J Bolin
-

 Politics2 days ago
Should Trump Be Scared Strait?
-

 Tech2 days ago
Flipsnack and the shift toward motion-first business content with living visuals
-

 Fashion6 days ago
What Are Your Favorite T-Shirts for the Weekend?
-

 Fashion5 days ago
Weekly News Update, 3.27.26 – Corporette.com
-

 Tech2 days ago
Apple will hide your email address from apps and websites, but not cops
You must be logged in to post a comment Login