
Crypto World
Trump extends Iran strike pause, trimming price decline


Bitcoin pared earlier losses Thursday afternoon after U.S. President Donald Trump said he would extend a pause on attacks against Iran’s energy infrastructure.
In a Truth Social post, Trump said the pause will now be 10 days, citing ongoing diplomatic talks.
“As per Iranian Government request… I am pausing the period of Energy Plant destruction by 10 Days,” Trump wrote, adding that the “talks are ongoing” and “they are going very well.”
The news helped stabilize markets after an ugly Thursday that saw bitcoin slide 3% and the Nasdaq 2.4%, with that tech-heavy index now lower by about 10% since peaking for the year in late January.
The surge in oil prices since the breakout of hostilities has garnered most of the headlines, but the selloff in Western bond markets is growing more troublesome.
The U.S. 10-year Treasury yield — below 4% just weeks ago — jumped to as high as 4.43% on Thursday, before pulling back to the current 4.41%. Alongside that sharp rise has been not just the vanishing of expectations for Federal Reserve interest rate cuts, but also serious bets that the U.S. central bank will soon hike rates.
Similar moves in bond yields and central bank expectations are taking place across Western Europe as well.
Nevertheless, the Trump comments sent bitcoin higher by about 1% from its worst levels, and it is now trading just above $69,000. Ether (ETH), XRP (XRP), Solana (SOL) and all also rebounded from session lows, though they remained 3%-5% lower over the past 24 hours.

Disclosure: The views and opinions expressed here belong solely to the author and do not represent the views and opinions of crypto.news’ editorial.
We began our new Outset Data Pulse analysis expecting 12 years of headline data to confirm a familiar belief in crypto: that news moves markets, and that faster headlines give you an edge.
But what the findings showed instead was more unsettling: most of the time, price seems to move first, and the headline comes later to explain it.
That’s not to say that “news doesn’t matter.” It’s closer to saying we’ve been treating it as the trigger when it often behaves more like the explanation after the move. And it’s easy to see why that belief survived for so long.
Anyone who spends enough time around crypto starts to notice the same thing: something moves, the news feed lights up, and then the dots get connected. When Bitcoin dumps or soars, coverage multiplies. When a major decision hits, whether it’s an ETF approval, an exchange collapse, or a legal victory, headlines also explode.
But the part of that belief which really matters – the part that turns news into a tradable edge – is directional. If headlines genuinely cause price movement, then reading faster makes you earlier. If price movement causes headlines, then reading faster mostly just makes you better informed about what already happened.
That was the real question here: not whether news exists in the sequence, but whether it consistently comes early enough to matter in the way traders often assume.
The part where the data got harder to argue with
The core dataset powering this Outset Data Pulse report includes 63,926 CoinDesk headlines spanning January 1, 2014 through December 30, 2025, matched to daily Bitcoin closing prices from the TradingView composite index.
That gave us 4,381 days where both a closing price and a headline count were available – enough to test the relationship from several angles, including causality, price behavior around major news spikes, headline sentiment, and topic clustering on the busiest coverage days.
It is also broad enough to cover nearly every “surely news mattered there” event worth testing, including bull and bear cycles, the FTX implosion, the COVID crash, and the start of the spot Bitcoin ETF era.
News volume didn’t forecast price
One of the first things we looked at was whether yesterday’s information helps forecast today’s movement.
We inspected five time horizons, from one day out through five days out. What kept standing out was that the news did not predict Bitcoin’s price across those lags.
Then there’s the kind of number you can’t really argue with because it’s too small to appear important: the correlation between daily changes in article volume and daily Bitcoin returns was 0.019, which means only 0.04% of daily price action was explained. For practical purposes, this is effectively zero.
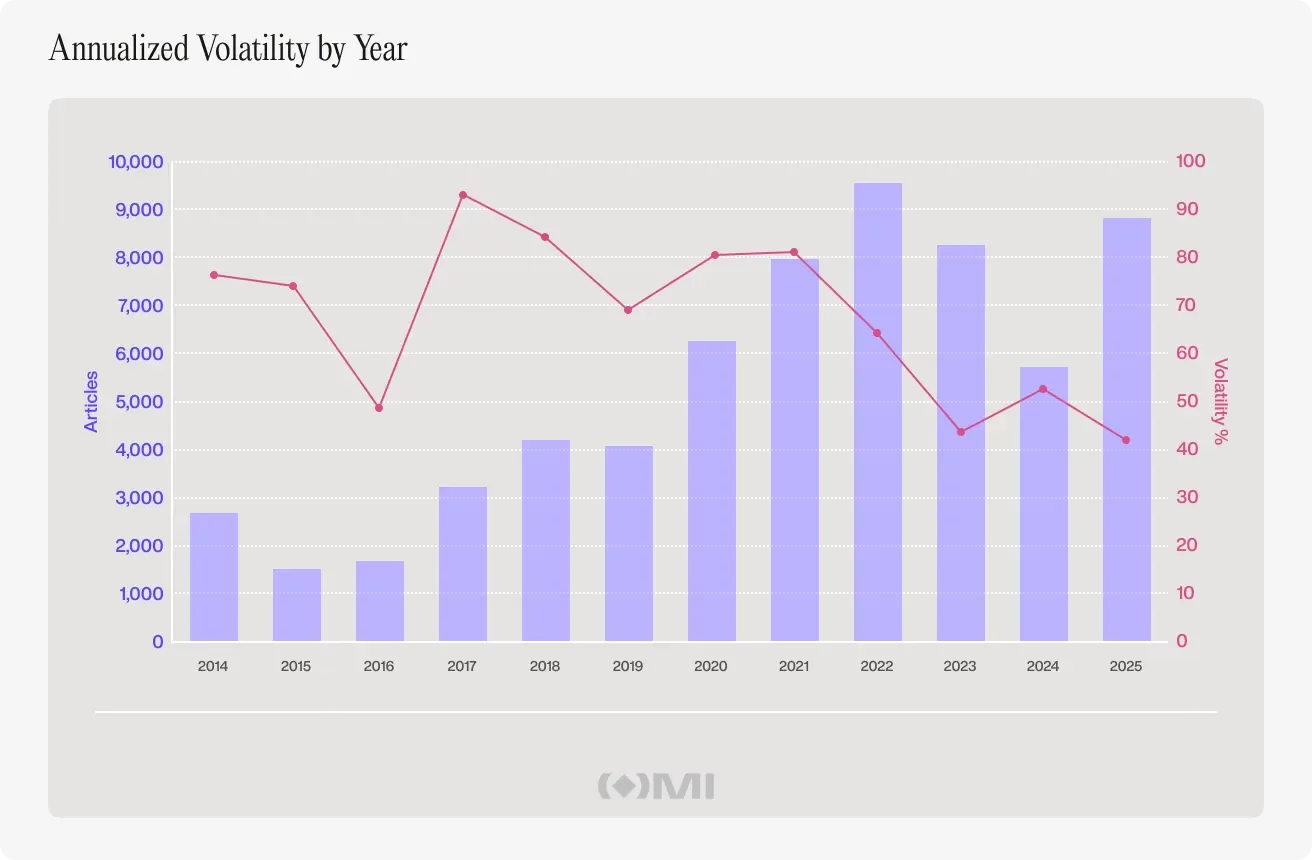
The longer-term picture points in the same direction. Year by year, article volume and Bitcoin volatility moved on very different rhythms, with no stable relationship between heavier coverage and more explosive price behavior.

That doesn’t mean news and volatility never overlap. They obviously do. But over time, the relationship stays too loose and inconsistent to treat headline volume as a dependable signal on its own.
Price started showing up before the coverage
We also looked in the reverse direction: whether price moves tended to show up before headline volume did, and the most interesting pattern appeared around a two-day lag.
But the part that felt closest to actual market experience was looking at the 50 biggest news days and tracking Bitcoin’s price three days before and three days after each spike.
What stood out was the shape of the move. In the three days before a major coverage spike, Bitcoin’s price was already elevated, around 1% above the event-day baseline. Then after the spike, price drifted down by roughly 0.8% by day three.
That is not a “news moves markets” narrative. It’s a “markets move, then news catches up” story. And once you see that shape, you start noticing how many famous crypto moments feel like they rhyme with it.
Even the biggest headlines didn’t behave like clean signals
These are the kinds of moments we all remember because they felt like turning points for crypto. For example, the U.S. Securities and Exchange Commission approved the spot Bitcoin ETF on January 11, 2024. CoinDesk published 51 articles that day while Bitcoin dropped 7.67% the next day and was down 10% by day three.
Compare that with December 4, 2023, when speculation was running hot but nothing had been confirmed. CoinDesk published 81 articles, and Bitcoin rose 5% the next day.
The same inconsistency showed up elsewhere: after the FTX collapse produced the busiest news day in the dataset, Bitcoin barely moved, while the January 2017 break back above $1,000 was followed by an 11% drop the next day and nearly 20% within three.
Across the ten biggest news events in the dataset, price reactions never settled into a usable pattern – some produced strong gains, others sharp losses, and many no clear follow-through at all.
That inconsistency matters because it’s what breaks the tradability story. If “news moves markets” were a stable indicator at the daily level, the largest news spikes would be where you’d expect the relationship to show up most clearly, certainly not where it dissolves into randomness.
We tried sentiment too
At that point, the obvious pushback is that volume is noisy, but sentiment might still hold the edge. Surely, bullish vs bearish headlines should matter, right?
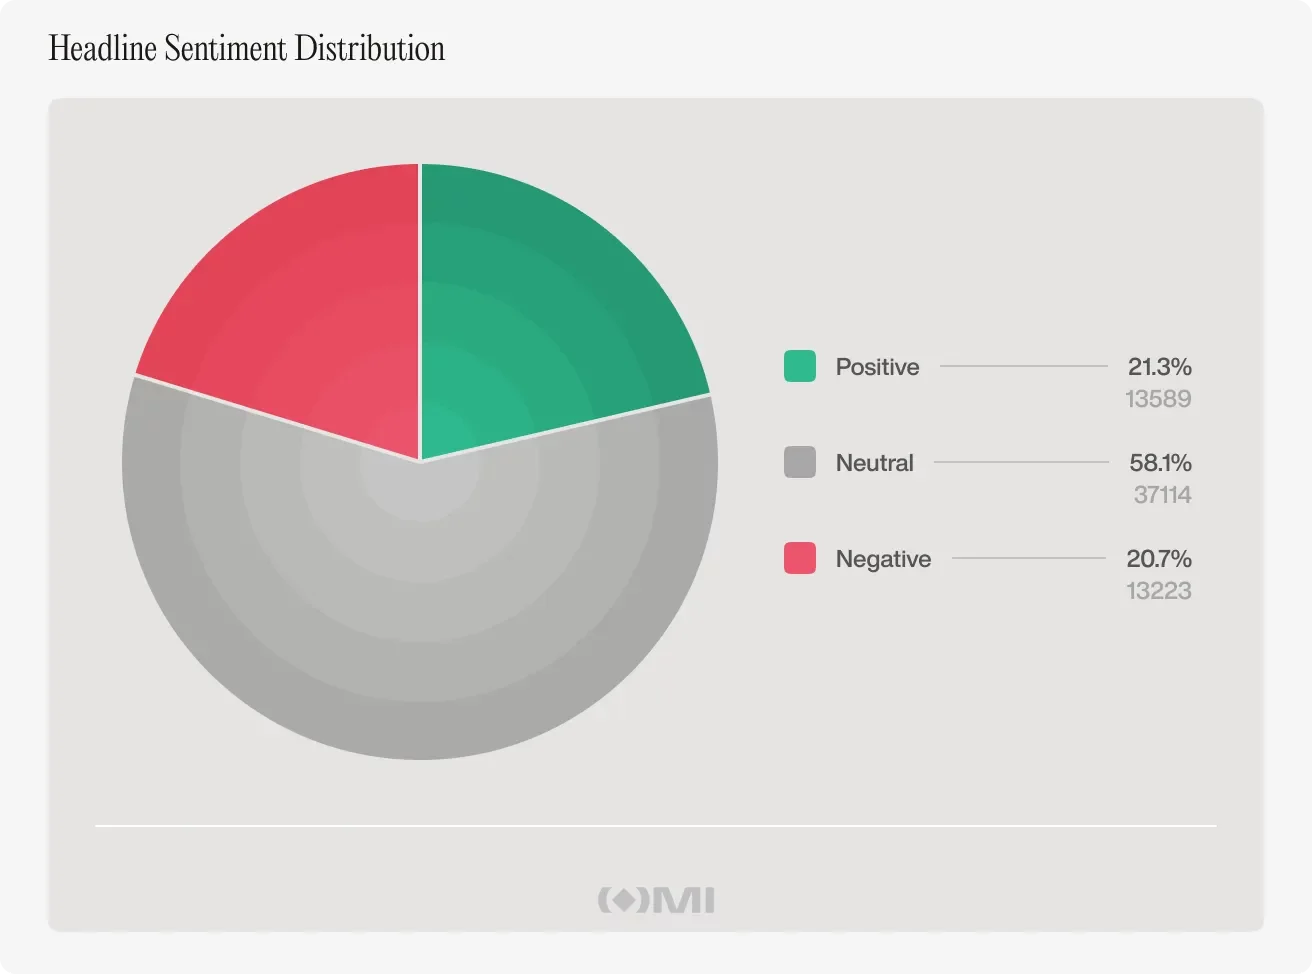
So every headline was run through FinBERT, a financial-language sentiment model. It labeled each headline as positive, negative, or neutral. It also averaged sentiment across each day.
The dataset’s distribution was nearly perfectly balanced, with 58% neutral, 21% positive, and 21% negative. The part that matters for trading is the next step: did daily headline tone correlate with daily returns?
The reported correlation was 0.07, with sentiment explaining about 0.5% of price movement. Again, this is close to nothing for anyone trying to systemically time entries. Worse (or maybe more revealing), the relationship wasn’t stable. In rolling three-month windows, the correlation flipped between positive and negative with no consistent pattern.
There’s also something that feels obvious once you say it out loud: headline sentiment can end up ‘grading’ language that is already racing to price. A headline like “Bitcoin falls below $70,000” gets a negative score, but the fall is already in the same day’s price data.
So we’re back in the same place: the headline is describing the move, not front-running it.
The reframing that made everything make sense
None of what we have seen so far lands in the “ignore news” category. That’s not true, and it’s not useful.
The more hopeful shift is this: by the time a headline hits a major publication, the information has often already moved through faster channels. This includes order flow, on-chain data, social layers, insider networks, and other forms of positioning and interpretation that don’t wait for editorial cycles.
That’s the line that changes how we read the market. The media isn’t where the signal starts. It’s where the signal becomes legible. Headlines are pretty much the “last mile,” representing the moment when a move that has already begun gets named, packaged, debated, and turned into a story people can repeat.
What this changes
Reading faster doesn’t necessarily make you earlier. The market absorbs information before the newsroom has even agreed on the framing. Headlines are often better at telling us what just happened than what happens next. That’s not an insult to journalism. It’s a statement about timing.
And using media as a timing tool can put you behind the market, because the thing you’re reacting to may already be reflected in flows and positioning by the time you are ready to move.
Even the report puts it plainly: headlines are not a clean signal feed. On peak-coverage days, about 61% of headlines fell into broad industry noise – partnerships, fundraising, product launches, stablecoin developments, NFT and gaming updates – with no obvious link to Bitcoin’s next move. Even regulation, the strongest plausible category, still failed to produce a reliable signal at the daily level.
One of the stranger findings was that even Bitcoin halving did not emerge as a distinct cluster on extreme-news days, suggesting that some of Bitcoin’s most important forces do not operate through the daily headline cycle at all.
Where we have to be honest about the exceptions
News could matter at much shorter timeframes, specifically minutes rather than days. A breaking headline can still move the market in the moment, even if that effect gets muted once you zoom out to daily closing prices.
At the same time, longer and slower narrative shifts, the kind that build over weeks, may still influence price in ways this approach can’t fully capture.
There are limits to this too: one publication, even a highly trusted one, does not represent the whole information universe. Crypto’s fastest information often travels through social platforms and private channels that this dataset can’t track. Also, some patterns may only show up in specific conditions, not in the cleaner daily relationships these tests can pick up.
So we’re not left with a simple “news is useless” mantra. Rather, we’re left with something more actionable: most of the time, the headline is the market becoming explainable, not the market beginning to move.
Bitcoin’s on-chain picture remains centered on profitability dynamics, with the total supply in profit holding near a historically significant zone. As of Thursday, CryptoQuant data show about 60.6% of BTC supply in profit, placing the market in a band (roughly 50% to 60%) that has repeatedly framed cycles and potential accumulation phases. The metric briefly dipped to 50.8% on Feb. 5—the lowest since Jan. 2, 2023—leaving a sizable portion of holders at or near breakeven and at a potential loss.
Historical echoes are often cited by traders when profitability enters this range. In January 2023, BTC traded around $16,682 with profitability near 51%, just before a pronounced rally that CryptoQuant’s analysis notes as mirroring a pattern later seen in a multi-hundred percent upmove. A separate moment in March 2020 saw the total supply in profit slip below 50% as BTC hovered near $6,500, ahead of a bull run that pushed prices toward $69,000 in 2021. While past patterns can offer context, they do not guarantee future outcomes; profitability alone does not pinpoint price bottoms, but it does sketch zones where long-term accrual has been strong and selling pressure historically eased.
Key takeaways
- Bitcoin’s supply in profit stands around 60.6%, a level within the 50–60% zone historically linked to market-cycle resets and renewed accumulation.
- Long-term holder profitability remains meaningful: the long-term holder net unrealized profit/loss (LTH-NUPL) sits near 0.40, suggesting holders remain in profit even as overall profitability tightens.
- Institutional and corporate participation has grown, with entities holding roughly 15.8% of circulating BTC (about 3,319,677 BTC), potentially dampening short-term price sensitivity to swings.
- Short-term holder (STH) inflows to Binance have fallen to about 25,000 BTC on March 25, indicating less reactive selling from newer market participants.
- Valuation-based on-chain signals (MVRV, NUPL, Puell) are flashing zones associated with stress for retail demand but not definitive bottoms, highlighting a balance of risk and upside potential ahead.
Profitability baselines and market structure
The 50–60% profitability corridor has been a recurring feature across several cycles. When a large share of supply sits in profit, unrealized gains on the network compress, which can reduce the incentive for holders to sell into weakness. In this framework, the market’s current 60.6% profitability suggests a still-robust share of the supply that could weather minor downturns without triggering acute downside selling pressure. Yet the same metric also shows that a meaningful number of investors remain in the red or near break-even, underscoring the persistence of volatility and the potential for renewed demand when risk appetite shifts.
Crucially, the composition of who owns BTC is shifting. The rise of corporate entities and exchange-traded products (ETFs) as significant holders means a portion of the market is increasingly dominated by entities with longer time horizons and lower sensitivity to short-term price swings. In aggregate, these participants are estimated to control around 15.8% of the circulating supply, or roughly 3.32 million BTC. This dynamic tends to flatten peak-forcing selloffs that can accompany prolonged drawdowns, contributing to a market where profitability compression does not necessarily translate into a wave of distressed selling from veteran investors alike.
On-chain signals and market stress zones
Beyond aggregate profitability, on-chain flow metrics add nuance to the picture. Short-term holder activity has shown a meaningful contraction in selling pressure on BTC. CryptoQuant data indicate STH inflows to Binance dropped to near 25,000 BTC on March 25, a low not seen during the February sell-off, according to comments from market analysts. Such a drop points to a cooling in reactive selling from newer market participants and a potential for steadier price action if selling pressure remains subdued.
Meanwhile, traditional valuation models that analysts watch—market-value to realized-value (MVRV), NUPL, and Puell Multiple—continue to illuminate where stress is most likely to surface. Analysts have observed that when MVRV falls below 1, NUPL slips under -0.2, or Puell Multiple approaches 0.35, those periods have historically coincided with heightened retail stress or undervalued conditions. While these indicators do not guarantee a local bottom, they map out zones where downside risk has often been bounded by prior upside potential, offering traders a probabilistic framework for assessing risk-reward dynamics in the near term.
Taken together, the current on-chain configuration suggests a market moving away from the kind of acute, long-term holder distress that punctuated bear markets in 2015, 2018, and 2022. The divergence between a modestly higher supply-in-profit reading and steady LTH-NUPL points to a market that could see renewed accumulation without triggering uniform, forceful capitulation among long-term investors. In other words, the landscape is shifting toward an ownership mix that may support more measured corrections rather than sharp, cyclical lows.
Related: Bitcoin in ‘later stages’ of bear market: Watch these BTC price levels
What readers should watch next
For traders and investors, the key questions revolve around whether the current on-chain balance can sustain a move higher without retesting lows. The persistence of a sizable profit pool coupled with a growing share of BTC held by institutions could support a gradual re-accumulation narrative, even if price swings remain volatile. Markets will likely respond to macro developments, policy signals, and shifts in risk appetite as much as to on-chain metrics.
Next steps to monitor include: the trajectory of MVRV, NUPL, and Puell readings as BTC moves through key price zones; any shifts in the distribution of BTC held by corporates and ETFs; and observed changes in STH and overall exchange flows that could presage larger moves in supply held by retail participants. While on-chain data cannot predict exact bottoms, it continues to offer a granular view of where investors are positioned and how that positioning might shape the path of least resistance for Bitcoin in the months ahead.
Nasdaq’s push to bring tokenization into capital markets could lead to a dual-market structure in which traditional US exchanges operate alongside blockchain-based trading venues, according to TD Securities — a shift that could split trading activity and lead to price differences across platforms.
In a recent note, Reid Noch, vice president of US equity market structure at TD Securities, pointed to plans by Nasdaq and the New York Stock Exchange to introduce tokenization into alternative trading systems (ATS), a type of venue that matches buyers and sellers outside traditional exchanges.
While both exchanges are exploring tokenization, Noch said Nasdaq is pursuing three parallel initiatives: upgrading how trades are settled after execution, enabling companies to issue tokenized shares and supporting trading on offshore platforms such as Kraken.
Together, these efforts could result in two distinct systems — one within the regulated US market, and another operating through offshore, blockchain-based platforms.
However, TD Securities warns the expansion into offshore platforms could introduce a separate venue for trading the same underlying assets. These tokenized shares would be backed by real stocks but operate outside the US regulatory framework, with potential differences compared to traditional holdings.
For investors, that could mean the same stock trading in different places at different prices, making markets harder to follow and potentially shifting activity away from traditional exchanges.
Cointelegraph reached out to TD Securities for additional insights but did not receive a response in time for publication.

Related: Crypto Biz: Kraken plugs into the Fed
Tokenized trading moves into the mainstream
The market for tokenized assets has grown quickly in recent years, with equities emerging as the next major focus.
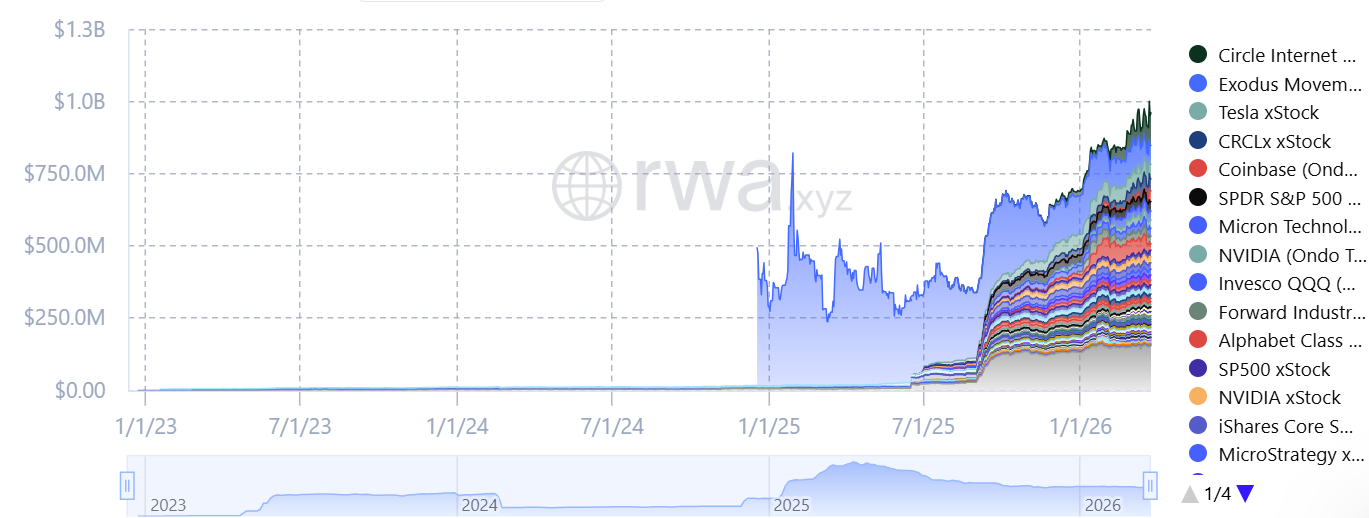
As Cointelegraph recently reported, Kraken’s xStocks platform, which offers tokenized versions of publicly traded shares that can be bought on blockchain-based venues, has surpassed $25 billion in cumulative trading volume, reflecting roughly 150% growth since November.

For traders, this points to a shift toward round-the-clock markets, where stocks can be traded outside regular hours. However, it could also bring new risks, including lower trading activity and price differences across platforms.
Coinbase has also expanded into tokenized stocks as part of its push to build an “everything exchange,” signaling growing competition between crypto platforms and traditional exchanges for equity trading.
NYSE, for its part, has also been exploring other tokenization initiatives through a partnership with Securitize, aimed at developing a platform for tokenized securities that could support extended or round-the-clock trading.
Related: VersaBank expands tokenized deposits with cross-border FX use case


The UK has sanctioned crypto marketplace Xinbi and Cambodia’s #8 Park scam compound over a $19.9b fraud and trafficking network, freezing London assets ahead of June’s Illicit Finance Summit.
Summary
- The UK sanctioned Xinbi — the first country to do so — after Chainalysis data showed it processed over $19.9 billion in illicit transactions between 2021 and 2025.
- Sanctions also target the operator of Cambodia’s “#8 Park” scam compound, believed to house up to 20,000 trafficked workers, along with multiple frozen London properties.
- The action precedes the UK’s Illicit Finance Summit in June, where officials plan to push for greater international coordination against crypto-enabled scam networks.
The UK government on March 26 sanctioned Xinbi, a Chinese-language cryptocurrency marketplace, making it the first country in the world to take such action against the platform. The measures, jointly announced by the Foreign, Commonwealth & Development Office and the Home Office, target what officials described as a key financial pillar of large-scale scam and human trafficking operations across Southeast Asia.
According to Chainalysis, Xinbi processed more than $19.9 billion in transactions between 2021 and 2025. The platform facilitated money laundering, unlicensed over-the-counter crypto trading, and the sale of stolen personal data, while also supplying communications infrastructure — including satellite internet equipment — used to target fraud victims. Crypto.news previously reported on Xinbi’s connection to the broader Telegram-based criminal marketplace ecosystem, where it operated alongside Haowang Guarantee, the largest darknet market ever recorded.
The sanctions extend beyond Xinbi itself to Legend Innovation Co., the operator of Cambodia’s “#8 Park” compound — a scam center believed to hold up to 20,000 trafficked workers — and its director Eang Soklim. The designated individuals are also linked to the Prince Group’s financial network, which the UK and U.S. sanctioned last year in an action that triggered asset freezes and seizures exceeding £1 billion ($1.3 billion).
London properties frozen, infrastructure dismantled
Several London properties will be frozen under the new measures, adding to previously seized UK assets. Those earlier seizures included a £100 million ($133 million) office building, two multi-million-pound mansions, and a helicopter. Officials say the latest action will immediately restrict access to financial channels used by the network.
“Our sanctions today send a clear message: We will not allow British people to become victims of these dreadful scams or tolerate the awful human rights abuses perpetrated in these scam centres,” said Stephen Doughty MP, the UK’s Minister of State for Europe, North America and Overseas Territories, in the official government announcement.
The UK said its goal is to sever Xinbi from the legitimate crypto ecosystem entirely — cutting off its ability to process transactions and eroding the financial backbone that enables scam networks to recruit, sustain, and conceal their operations.
Broader crackdown on crypto-enabled trafficking
The action comes amid rising global alarm about crypto’s role in financing human trafficking and forced labor. A February 2026 Chainalysis report found that crypto flows to suspected trafficking services surged 85% in 2025, with stablecoin-heavy, Telegram-linked networks operating across Southeast Asia at increasing scale. Just six days before the Xinbi sanctions, the FBI and Thai police froze $580 million in crypto linked to organized scam gangs targeting Americans.
The UK’s move is part of what officials describe as a broader strategy targeting not just individual perpetrators but the infrastructure that underpins global fraud. Authorities said the Xinbi sanctions will feed into the UK’s Illicit Finance Summit in June, where they plan to accelerate international coordination to counter the laundering and movement of illicit funds across borders.
As reported by The Block, the sanctions took immediate effect on March 26.
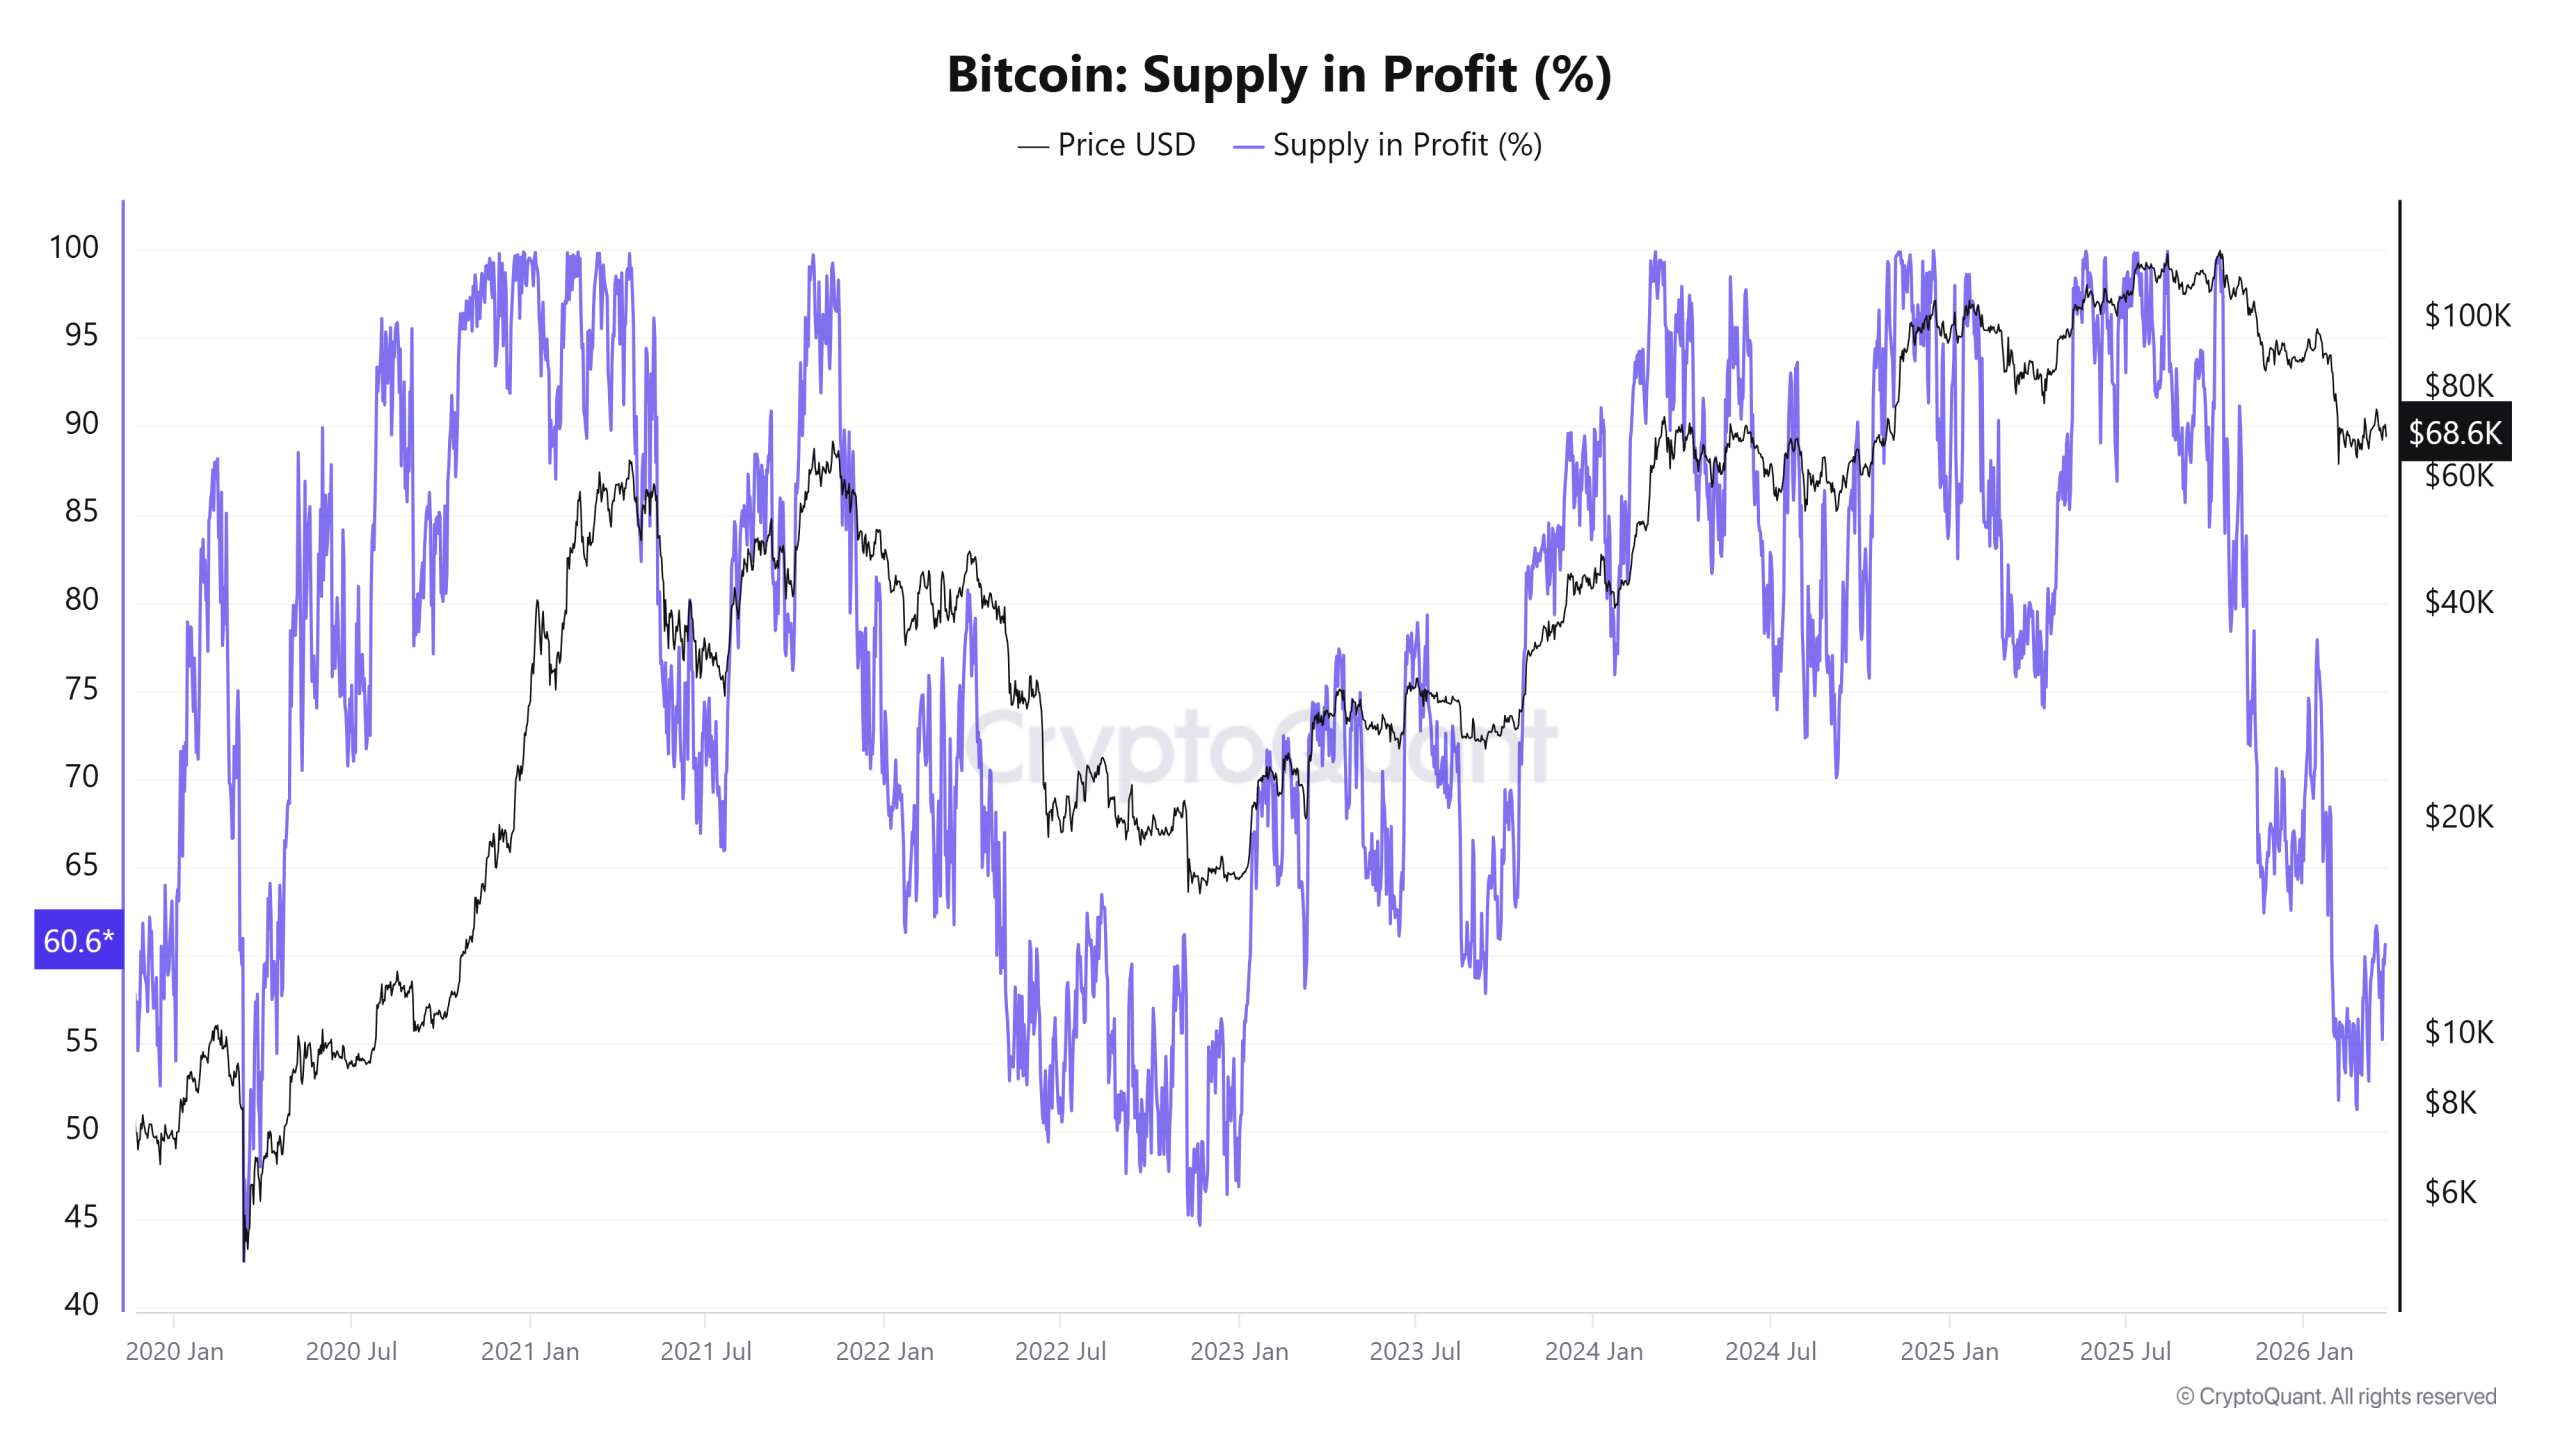
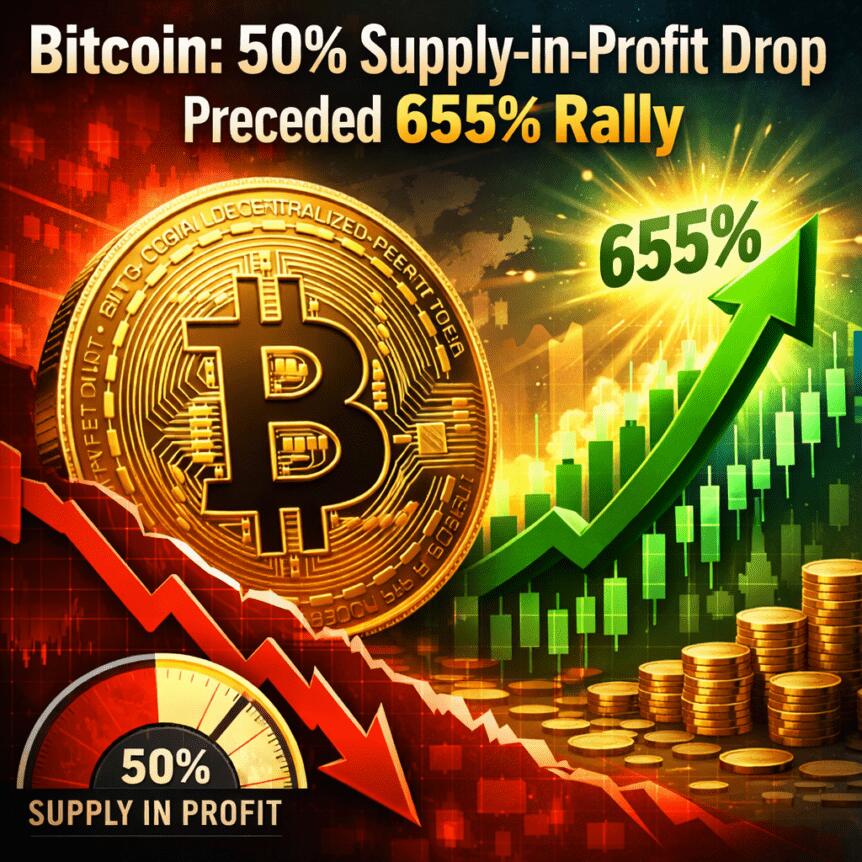
The total Bitcoin (BTC) supply in profit stands at 60.6% on Thursday, continuing to move within a range historically associated with market cycle resets. The metric previously dropped to 50.8% on Feb. 5, its lowest level since January 2, 2023, leaving a large share of holders at breakeven or at a loss.
Similar conditions in the past cycles have preceded strong upside moves. In January 2023, BTC traded at $16,682 when profitability levels were comparable at 51%, before rallying 655% to $126,000 in 2025.
A similar setup occurred in March 2020, when the total supply in profit fell below 50% as BTC traded at $6,500, ahead of a move to $69,000 in 2021.
Bitcoin profitability returns to prior market cycle base levels
Over the past five years, the 50–60% profitability range has repeatedly marked periods where a large portion of holders sat near the BTC cost basis. That compresses unrealized gains across the network and reduces the incentive to sell into weakness.

It is important to note that the metric does not pinpoint a price bottom. It outlines a zone where long-term accumulation has led to high returns while the downside sell pressure has eased.
In past cycles, Bitcoin price bottoms were formed when the long-term holder net unrealized profit/loss (LTH-NUPL) turned negative, as seen during the 2015, 2018, and 2022 bear markets. This phase marked a period where the long-term investors were holding at a loss.
However, the current LTH-NUPL reading is near 0.40, which means that the long-term holders are still comfortably in profit, even as the overall supply profitability has dropped near market cycle lows.

This gap highlights a shift in the market environment. A growing share of Bitcoin supply is now held by corporate entities and spot exchange-traded funds (ETFs), which collectively control close to 15.8% of the circulating supply, i.e., 3,319,677 BTC.
These participants typically operate with a longer holding period and lower sensitivity to short-term price swings.
As a result, the profitability compression across the BTC market does not translate into the same level of forced selling from long-term holders seen in previous cycles in 2015, 2018, and 2022.
This change helps explain why the total supply in profit may revisit historical accumulation zones while the long-term holder profitability stays elevated.
Related: Bitcoin in ‘later stages’ of bear market: Watch these BTC price levels
BTC exchange flows align with valuation models
The short-term holder BTC flows to Binance fell to 25,000 BTC on March 25. Crypto analyst Darkfost said it is a new market low, down from roughly 100,000 BTC during the early February sell-off. This decline shows a clear reduction in reactive selling from the newer market participants.

Meanwhile, crypto analyst GugaOnChain noted that the valuation models can help identify where the deeper market stress may emerge for BTC. Metrics such as market-value to realized-value (MVRV) below 1, NUPL under -0.2, and a Puell Multiple near 0.35 have historically appeared during periods of heavy retail pressure and undervalued conditions.
While these indicators do not predict the exact market bottoms, they highlight zones where downside risk has historically been limited relative to long-term upside, offering a clearer view of overall market positioning.
Related: Bitcoin dips 3% as analysis says $70K BTC price ‘not obviously bearish’
This article does not contain investment advice or recommendations. Every investment and trading move involves risk, and readers should conduct their own research when making a decision. While we strive to provide accurate and timely information, Cointelegraph does not guarantee the accuracy, completeness, or reliability of any information in this article. This article may contain forward-looking statements that are subject to risks and uncertainties. Cointelegraph will not be liable for any loss or damage arising from your reliance on this information.


Tether has launched XAU₮ on BNB Chain and Binance, extending its 60% share of a $4b tokenized gold market across 12+ networks via the USDt0 cross-chain system.
Summary
- Tether’s gold-backed token XAU₮ is now live on BNB Chain, bringing the product to the world’s largest cryptocurrency exchange ecosystem and expanding its cross-chain reach to over 12 blockchains via the USDt0 network.
- The gold-backed stablecoin market grew from roughly $1.3 billion to over $4 billion in 2025, with XAU₮ commanding approximately 60% of total supply.
- Binance simultaneously listed XAUt on March 26, offering spot trading, 1–50x USDT perpetual contracts, VIP borrowing, and one-click purchases via card and mobile pay.
Tether on March 26 announced that Tether Gold (XAU₮) is now live on BNB Chain, placing the dominant tokenized gold product directly into the ecosystem of the world’s largest cryptocurrency exchange and its hundreds of millions of users. Each XAU₮ token represents one fine troy ounce of physical gold — London Good Delivery standard — held in Swiss vaults and independently attested on a 1:1 basis.
The launch is timed to a market that has moved sharply in tokenized gold’s favor. Gold surged 64% in 2025 — its largest annual gain in 40 years — setting more than 50 all-time highs as geopolitical tensions and trade uncertainty pushed investors toward safe-haven assets. The gold-backed stablecoin market nearly tripled over the same period, climbing from roughly $1.3 billion to over $4 billion, with XAU₮ holding approximately 60% of total supply.
The BNB Chain deployment is backed by Tether’s USDt0 cross-chain network, which gives XAU₮ unified liquidity across more than 12 blockchains. The architecture is designed to improve the efficiency of issuance, transfer, and settlement, and eliminates the need for users to navigate traditional custody logistics, counterparty premiums, or settlement delays associated with physical gold markets.
What Tether and BNB Chain executives said
“With XAU₮, we are not changing what gold is; we are making it usable in a modern financial system,” said Paolo Ardoino, CEO of Tether, in the official announcement. “You still have direct exposure to physical gold, but now it can move instantly, settle globally, and integrate seamlessly with digital markets. Listing on BNB Chain expands that access to hundreds of millions of users, bringing gold into a system where it can actually be used, not just held.”
Nina Rong, Executive Director of Growth at BNB Chain, added: “XAU₮ on BNB Chain extends what is already the second-largest RWA ecosystem by TVL. It gives users a trusted, gold-backed asset they can use across DeFi without friction.”
BNB Chain doubles down on real-world assets
The Tether Gold deployment deepens BNB Chain’s position in tokenized real-world assets. As reported in a previous crypto.news story, the network’s RWA value surged 555% year over year in Q4 2024, making it the second-largest RWA blockchain behind Ethereum. The addition of XAU₮ — already the largest gold-backed token by market cap — reinforces that trajectory as institutions accelerate tokenized commodity adoption.
XAU₮ is issued by TG Commodities, S.A. de C.V., a registered Digital Asset Service Provider under El Salvador’s Digital Asset Issuance Law. Reserve details and vault attestation reports are publicly accessible at gold.tether.to. Binance also listed XAUt on March 26 with perpetual futures, leveraged trading pairs, and principal-protected yield products — though the launch was briefly delayed from 21:30 to 22:00 UTC+8.
The move follows Tether’s January launch of Scudo, a fractional unit for XAU₮ equal to one-thousandth of a troy ounce, detailed in a previous crypto.news story, which was aimed at making tokenized gold viable for payments and everyday on-chain use.

TLDR
- BlackRock has integrated Chronicle’s Proof of Asset system for its tokenized BUIDL fund.
- The system provides independently verified holdings-level data through an onchain dashboard.
- The tokenized BUIDL fund manages about $1.7 billion in U.S. Treasuries, repos, and cash.
- Securitize issues and manage the BlackRock USD Institutional Digital Liquidity Fund onchain.
- Chronicle sources data directly from custodians and administrators to verify asset composition.
BlackRock has integrated Chronicle as a verification provider for its tokenized BUIDL fund. The firm will use Chronicle’s Proof of Asset system to publish independently verified holdings data. The update strengthens transparency for the $1.7 billion onchain U.S. Treasuries vehicle.
BlackRock and Tokenized BUIDL Add Independent Asset Verification
BlackRock confirmed that its BlackRock USD Institutional Digital Liquidity Fund will use Chronicle’s Proof of Asset system. The system delivers independently verified holdings-level data for the tokenized BUIDL fund. It continuously attests to asset availability, freshness, and integrity through the Chronicle dashboard.
Securitize issues and manages the tokenized BUIDL fund onchain. Carlos Domingo, CEO of Securitize, said, “Tokenization becomes meaningful when investors and protocols can independently verify what’s actually backing the product.” He added that Chronicle’s support shows tokenized funds are evolving into transparent, data-driven instruments for institutions and global markets.
Chronicle Protocol built Proof of Asset as an institutional-grade oracle layer. The system sources data directly from custodians and fund administrators. It then publishes attestations covering valuation, composition, custody, and asset existence.
Niklas Kunkel, founder of Chronicle, described the product as an “integrity layer” for tokenized finance. He said the tool delivers granular data for asset managers, allocators, and risk teams. He stated, “We’re building a layer that didn’t exist until now.”
Robert Mitchnik, BlackRock’s head of digital assets, addressed the integration. He said the system gives platforms and allocators greater visibility into tokenized asset evaluation and usage. He explained that institutions require deeper verification standards for digital products.
Chronicle Expands Data Infrastructure Across Tokenized Funds
Chronicle reported that Proof of Asset secures about $5 billion in total value. The system supports funds, including the Janus Henderson Anemoy Treasury Fund (JTRSY). It also covers Superstate’s Short Duration US Government Securities Fund (USTB).
Securitize has also implemented Chronicle’s system for its Tokenized AAA CLO Fund (STAC). Chronicle said Proof of Asset differs from price or NAV relays because it verifies underlying holdings data. Kunkel stated that the infrastructure introduces a new verification standard for tokenized funds.
The tokenized BUIDL fund currently holds about $1.7 billion in assets. The portfolio includes U.S. Treasuries, overnight repurchase agreements, and cash. BlackRock manages the fund as the largest onchain Treasuries investment vehicle.
The announcement follows recent efforts to publish off-chain financial data on blockchain networks. Coinbase recently said it would push order book, equities, and futures data onchain through ChainLink’s DataLink tool. Firms such as S&P Global and FTSE Russell have also moved to provide market data directly onchain.

Crypto World
Stragegy’s (MSTR) STRC shares rebound to par value faster than historical average to enable more BTC buying


Stretch (STRC), the perpetual preferred equity issued by Strategy (MSTR), the world’s largest corporate holder of bitcoin, reclaimed its $100 par value during Thursday’s trading session, giving the company the leeway to raise funds to add to its stash of the largest cryptocurrency.
The recovery took nine trading days following the March 13 ex-dividend date, when buyers of the stock no longer qualify for the next payout. Prices of ex-dividend stocks typically drop to reflect the cash being distributed to the previous shareholders.
At its core, STRC works by adjusting yield to steer price. If shares trade above $100, the company can trim the dividend to cool demand. If shares fall below that level, it can raise dividends to attract buyers. Keeping the price anchored lets the firm issue new shares near par, bringing in capital that is then deployed to buy bitcoin.
The return to par, this time, was slightly faster than the historical average of around 10 trading days for STRC, according to STRC.live.
STRC functions as a short-duration, high-yield credit instrument, offering an 11.5% annual dividend paid monthly. This structure helps incentivise trading near its $100 par value, enabling the company to utilise at-the-market (ATM) share issuance to raise capital for additional bitcoin acquisitions.
In comparison, SATA, the equivalent tool issued by bitcoin treasury company Strive (ASST), offers a higher 12.75% dividend. Currently priced at $99.25, it is also approaching par value.
Strategy bought 1,031 bitcoin last week for a total cost of $76.6 million, or $74,326 per coin. However, the magnitude of that buy was far lower than that of recent acquisitions, and STRC wasn’t at par during last week’s bitcoin purchase.
The firm’s holdings now stand at 762,099 bitcoin, bought for approximately $57.69 billion, at an average price of $75,694 per bitcoin.
Read more: Michael Saylor’s Strategy dominates DAT bitcoin buying as treasury demand collapses
Bitcoin’s (BTC) consolidation continued into Thursday as bulls struggled to keep hold of $70,000, and competing narratives on BTC’s market structure versus its increasing institutional adoption clashed with the bearish overarching factors negatively impacting US equity markets.
Citing Bernstein’s $150,000 by the end of 2026 price estimate, Bloomberg analysts said that data shows institutional investors returning to the Bitcoin markets in droves, reinforcing the view that BTC had “reached a floor.”
In early March, a week-long stretch of inflows to the spot Bitcoin ETFs nearly topped $1 billion, while Strategy purchased 22,237 BTC for $1.6 billion through its new perpetual preferred equity, Stretch (STRC). In addition to the success of STRC, Strategy also unveiled plans to raise capital to buy $44.1 billion in additional Bitcoin.
Further proof of institutions stepping back into the crypto market came from $10 trillion asset manager Morgan Stanley filing documents to launch its own spot Bitcoin ETF. Morgan Stanley recommends investors maintain a 2% to 4% allocation to cryptocurrencies, and on March 26, a proposed Labor Department rule, which would permit brokerages that manage and offer services in the $10 trillion 401(k) retirement plan market to invest in Bitcoin, progressed through the White House’s regulatory review process.
On Thursday, Coinbase also launched token-backed down payments for Fannie Mae loans, essentially permitting Bitcoin holders to use BTC and USDC to fund home mortgages. The offering allows investors holding Bitcoin to unlock the trapped liquidity of BTC without selling or generating a taxable event.
Related: US Bitcoin ETFs post 6-day inflow streak as crypto rallies
How important is Bitcoin’s $70,000 support?
While institutional investors’ renewed interest in buying Bitcoin has clearly returned, BTC’s price volatility and its inability to break out of a near 6-month price downtrend remain clear hurdles. The ongoing US-Israel and Iran war, along with President Trump’s threat to send ground troops to Iran continues to negatively impact stock markets and cryptocurrencies.
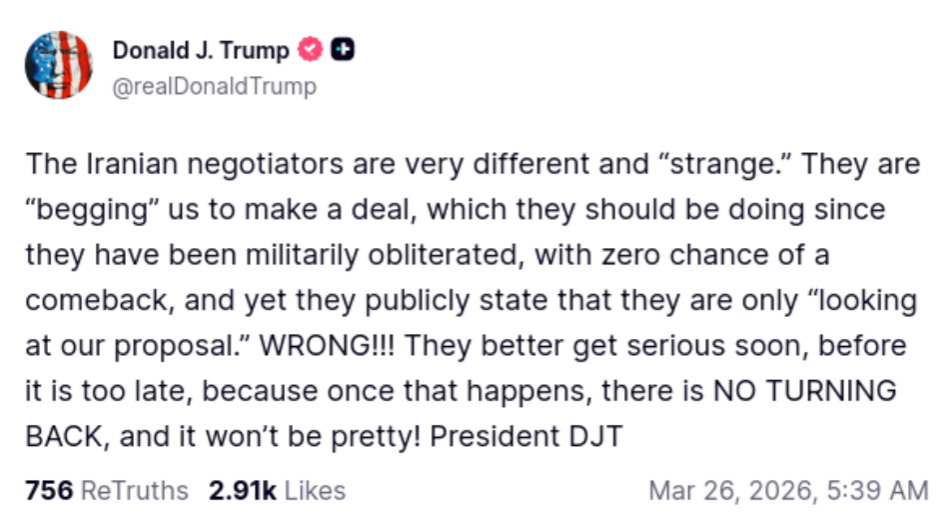
On Thursday, in a Truth Social post, President Trump said Iran’s negotiators had “better get serious soon, before it is too late, because once that happens there is NO TURNING BACK, and it won’t be pretty!” The clear buildup of US military assets deployed to the Middle East has markets worried that a ground operation could begin as early as this weekend.

Following a series of comments from the President, US markets sold off, with the DOW shedding 400 points, while the S&P 500 and Nasdaq saw 1.49% and 2.07% respective losses. On the other hand, WTI crude oil and Brent Crude rallied, with each seeing gains of over 4%.
With growing uncertainty on which direction the US-Israel and Iran war takes and the longer-term impact of record-high oil prices on US inflation and the wider economy, investors are electing to decrease their exposure to volatility.

This explains Bitcoin’s frequent re-visits to prices below $70,000 along with the short-lived nature of rallies in the $71,000 to $76,000 range. That said, one positive is that institutional and retail investors appear to view $70,000 and below as an optimal buying zone, thus reinforcing the level as support.
This article does not contain investment advice or recommendations. Every investment and trading move involves risk, and readers should conduct their own research when making a decision. While we strive to provide accurate and timely information, Cointelegraph does not guarantee the accuracy, completeness, or reliability of any information in this article. This article may contain forward-looking statements that are subject to risks and uncertainties. Cointelegraph will not be liable for any loss or damage arising from your reliance on this information.


BNB price is down, dropping by 3% in 24 hours to under $630, but the technical prediction tells a more complicated story than the red candle suggests. A pullback from the March 17 peak of $675 has rattled short-term holders, yet longer-dated moving averages are quietly trending upward.
BNB is still holding the third-largest market cap among non-stablecoin cryptocurrencies, sitting above $85 billion, ahead of XRP’s $84 billion and Solana’s $50 billion. That ranking reflects the combined weight of Binance’s centralized exchange dominance and BNB Chain’s expanding DeFi footprint.
No major protocol announcements or regulatory catalysts have emerged yet, meaning price action here is largely technical.
With consolidation tightening and April seasonality historically favorable, broader crypto market conditions could accelerate BNB’s next directional move faster than most expect.
Discover: The best crypto to diversify your portfolio with
BNB Price Prediction: Can Binance Coin Reclaim $725 This Month?
BNB opened March 26 at a $600 area, hit an intraday high of $629 a tight range, signaling indecision. However, the seven-day picture shows a decline from $645, a consolidation phase following the spike to $685 on March 16. Support appears to be building around the $620 zone and resistance clusters between $650 and $675.
The moving average picture offers the bullish counterargument. Both the 50-day and 200-day MAs are sloping upward as of March 21, a structural positive. The 4-hour frame remains bearish relative to its MAs (that’s the friction point right now), creating a classic higher-timeframe bull, lower-timeframe bear setup.
BNB’s all-time high of $1,370 in October last year remains a longer-term reference point. At $630, it’s trading at less than half that peak, which either means deep value or a structurally weakened asset, depending on your time horizon.
Discover: The best pre-launch token sales
Bitcoin Hyper Targets Early Mover Upside as BNB Tests Key Levels
BNB upside target sounds compelling, until you account for its $88 billion market cap. Large-cap altcoins face a size problem: the capital required to move the needle is enormous, and the percentage gains that defined 2024 cycles are structurally harder to replicate. That math is exactly why early-stage infrastructure plays attract traders who’ve already captured large-cap exposure.
Bitcoin Hyper ($HYPER) is one presale drawing attention in that context. It’s positioned as the first-ever Bitcoin Layer 2 with Solana Virtual Machine (SVM) integration, targeting the three core limitations that have defined Bitcoin for years: slow transactions, high fees, and the near-absence of programmable smart contracts.
The architecture claims to deliver faster performance than Solana itself, while preserving Bitcoin’s underlying security. The project has already raised more than $32 million at a current price of $0.0136776, with staking rewards of 36% APY for early participants.
For those who’ve done the research: explore Bitcoin Hyper here.
This article is not financial advice. Cryptocurrency investments are highly volatile. Always conduct your own research before making any investment decisions.
The post BNB Price Prediction: Price Drops, But Bullish Signals Flashing appeared first on Cryptonews.

Former F1 champion Max Verstappen tells journalist to ‘get out’ of Japanese Grand Prix press conference | UK News

How Cruise Tourism Supports Global Port Economies

The more we watch crypto, the more it feels like the news comes last


-
 Crypto World6 days ago
NIO (NIO) Stock Plunges 6.5% as Shelf Registration Sparks Dilution Worries
-
 NewsBeat2 days ago
Manchester United reach agreement with Casemiro over contract clause amid transfer speculation
-

 Fashion6 days ago
Weekend Open Thread: Adidas – Corporette.com
-

 Politics6 days ago
Jenni Murray, Long-Serving Woman’s Hour Presenter, Dies Aged 75
-

 Crypto World5 days ago
Best Crypto to Buy Now: Strategy Just Spent $1.57 Billion on Bitcoin During Fear While Early Investors Quietly Enter Pepeto for 150x Potential
-

 Crypto World5 days ago
Bitcoin Price News: Bhutan Sells $72 Million in BTC Under Fiscal Pressure, but the Smart Money Entering Pepeto Sees What the Market Does Not
-

 Tech7 days ago
inKONBINI Lets You Spend Summer Days Behind the Register
-

 News Videos20 hours ago
Parliament publishes latest register of MPs’ financial interests
-

 Sports3 days ago
Remo Stars and Kano Pillars Strengthen Survival Hopes in NPFL
-

 Business4 days ago
No Winner in March 21 Drawing as Prize Rolls to $133 Million for Next
-

 Sports3 days ago
Gary Kirsten Accuses Pakistan Cricket Board Of ‘Interference’, Mohsin Naqvi Responds
-

 Tech4 days ago
Give Your Phone a Huge (and Free) Upgrade by Switching to Another Keyboard
-

 Sports6 days ago
2026 Kentucky Derby horses, odds, futures, preview, date: Expert who nailed 12 Derby-Oaks Doubles enters picks
-

 Tech4 days ago
AI enters the chat: New Seattle dating app relies on tech to facilitate meaningful human connections
-
Business6 days ago
Columbia Sportswear enters $500 million credit agreement with JPMorgan Chase
-

 Tech5 days ago
Today’s NYT Connections Hints, Answers for March 22 #1015
-

 News Videos3 days ago
Ch 9 Financial Management Part 1 | Detailed One Shot | Class 12 Business Studies Boards 2026
-

 Business5 days ago
Will Duke Basketball Win It All? Duke Basketball Enters Second Round as Third Favorite to Claim NCAA Title
-

 Sports4 days ago
2026 Kentucky Derby horses, odds, futures, preview, date: Expert who hit 12 Derby-Oaks Doubles enters picks
-
 Crypto World6 days ago
Small-cap Russell 2000 enters correction territory
You must be logged in to post a comment Login