
CryptoCurrency
Uniswap price at risk as bearish double top forms and key metric decline

Uniswap price fell for the fourth straight day as on-chain metrics such as TVL and chain fees continued to decline. It has formed a double top pattern which if confirmed could mean more pain ahead for the token.
Summary
- Uniswap price has fallen 12.5% form its weekly high.
- The network’s TVL has dropped sharply since October last year.
- A double-top pattern casts a bearish shadow on the UNI price over the upcoming days.
According to data from crypto.news, Uniswap (UNI) was trading at $5.64 last check Thursday, Jan. 1, down 12.5% from its Sunday high and 53% below its highest point in August.
It’s been a rough stretch for Uniswap. Like most of the crypto market, Uniswap price has been struggling to find its footing as crypto investors have taken a risk-averse stance. Bitcoin’s lackluster performance over the past months has ended up dragging most altcoins down with it.
At the same time, Uniswap has faced increased competition from other DEXs such as PancakeSwap and Raydium, which have squeezed trading volumes and thinned out protocol fees, ultimately weighing on investor sentiment.
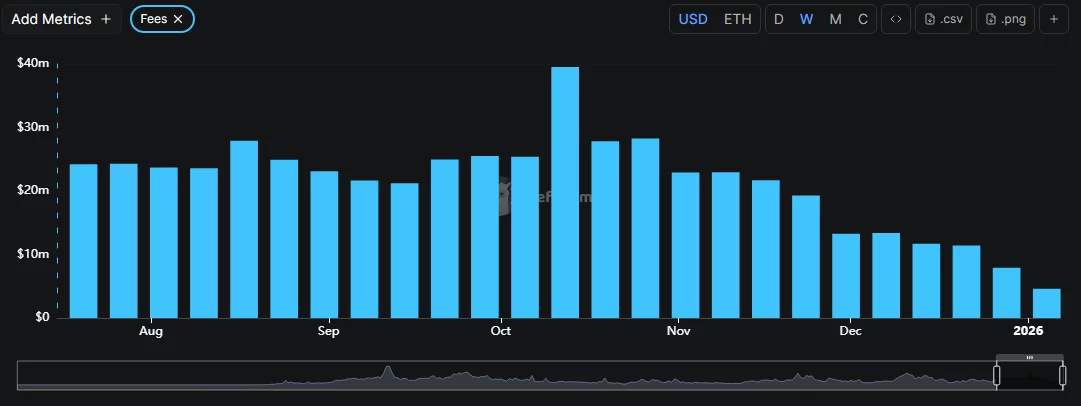
Data from DeFiLlama shows that the total value locked across all DeFi protocols based on the network has dropped from $6.9 billion recorded in early October 2025 to around $4 billion when writing. Meanwhile, weekly fees generated have significantly declined over the period.
Together, these negative trends could continue to pressure prices unless fundamentals improve.
However, even with the recent downturn, a significant breakthrough for the Uniswap ecosystem emerged this weekend that could alter UNI’s long-term trajectory.
Uniswap has officially gone deflationary. Following the activation of the UNIfication proposal this weekend, the protocol implemented its fee switch and burned $596 million worth of UNI. The proposal also introduced a permanent token-burning mechanism to the ecosystem.
Token burns effectively remove the total amount of tokens from the circulating supply, which tends to increase the token’s value if investor demand remains constant or grows.
On the 4-hour chart, Uniswap price has been forming a double top pattern over the past two weeks. It is a bearish reversal pattern formed when an asset’s price reaches a peak twice with a moderate decline in between.

For UNI, the tops have formed around the $6.5 level while the neckline lies at $5.59, just a little below its price as of press time.
Technical indicators largely point to a bearish outlook for the token. Notably, UNI price remains below the 50-day Simple Moving Average at $5.93, which means the bears are currently in control of the trend. The Aroon down also stands at 85.71% while the Aroon Up is at 7.14%, confirming the prevailing downward momentum.
Hence, a drop below the neckline at $5.59, which serves as the most important support level to watch now, could push prices down to as low as $4.70. It is calculated by subtracting the height of the double tops formed from the neckline level. The target lies nearly 16% below the current price.
However, it should be noted that if Uniswap manages to recover above the 50-day SMA, the bearish setup would be invalidated.
Disclosure: This article does not represent investment advice. The content and materials featured on this page are for educational purposes only.


