
Crypto World
US Liquidity Is the Real Culprit


Raoul Pal said that Bitcoin’s collapse reflects a temporary US liquidity drain, not a broken crypto cycle or failed market.
Bitcoin has plunged almost 40% from its peak of $126,000. While it currently trades a little above $77,000, prices remain fragile, and investors are positioning for a deeper drawdown.
Amidst intense bearish sentiment, Raoul Pal, founder and CEO of Global Macro Investor, said that widely circulating claims that BTC and the broader crypto market are “broken” represent a false narrative driven by temporary liquidity conditions rather than a failed cycle.
Bitcoin and SaaS
Pal said the dominant market story indicates the crypto cycle is over, and prices are collapsing due to factors such as exchange issues, institutional actions, or structural flaws. But he described this view as an “alluring narrative trap” which has been reinforced by continued daily price declines. Analysis showed that the UBS SaaS Index and Bitcoin have followed nearly identical price patterns, which essentially indicates a common underlying factor rather than asset-specific problems.
According to Pal, that factor is US liquidity, which has been constrained as a result of several technical and fiscal factors. He pointed to the completion of the US Reverse Repo drain in 2024, followed by Treasury General Account (TGA) rebuilds in July and August that lacked an offsetting liquidity injection, which ended up resulting in a liquidity withdrawal.
Pal stated this liquidity shortage has also contributed to weak ISM readings. While Global Total Liquidity typically has the strongest long-term correlation with Bitcoin and US equities, he argued that US Total Liquidity is currently more influential because the US is the primary source of global liquidity. The GMI founder added that global liquidity has led US liquidity this cycle and is beginning to turn higher, which is expected to feed through to US liquidity and economic indicators.
Bitcoin and SaaS have been particularly affected because they are among the longest-duration assets and therefore most sensitive to liquidity conditions. The rally in gold absorbed marginal liquidity that might otherwise have flowed into riskier assets such as Bitcoin and SaaS, leaving insufficient liquidity to support all asset classes at the same time, he said.
The current US government shutdown has intensified the liquidity drain, as the Treasury did not draw down the TGA after the previous shutdown and instead added to it. He called the resulting environment a temporary “air pocket,” which has caused severe price pressure.
You may also like:
However, Pal said signs indicate the shutdown could be resolved soon, and characterized it as the final major liquidity obstacle. He reiterated that additional liquidity factors, such as adjustments to the enhanced supplementary leverage ratio (eSLR), partial TGA drawdowns, fiscal stimulus, and eventual rate cuts, remain ahead.
Hawkish Fed Fears
Some market commentators have hinted that expectations of a more cautious pace of rate cuts under incoming Fed chair Kevin Warsh have also weighed on markets. But Pal rejected claims that Warsh represents a hawkish policy stance, and instead called the narrative incorrect and rooted in outdated comments. He believes Warsh’s approach aligns with policies favoring rate cuts and economic expansion, while maintaining balance sheet stability due to reserve constraints.
Despite the recent turmoil in the market, Pal said that he remains strongly bullish on 2026.
SECRET PARTNERSHIP BONUS for CryptoPotato readers: Use this link to register and unlock $1,500 in exclusive BingX Exchange rewards (limited time offer).

Zcash price shot up over 21% today, extending its gains over the past week to over 60% as privacy coins see renewed demand from investors.
Summary
- Zcash surged over 20% to a three-month high as strong retail demand and rising futures open interest fueled momentum.
- Growth in shielded liquidity pools, now holding over 60% of supply, alongside a broader rally in privacy coins like Monero, boosted investor interest.
- A breakout from a descending triangle and bullish indicators signal further upside potential, with key resistance near $419 and support at $332.
According to data from crypto.news, Zcash (ZEC) price rose nearly 23% to a three-month high of $383 on Friday, April 10. At this price, the token remains nearly 86% higher than its year to date low. The token’s gains have made it the best-performing crypto asset in the daily and weekly timeframes, largely outpacing the others that followed.
Zcash’s rally came amid strong interest from retail investors for the asset over the past couple of days. Notably, data from CoinGlass shows that this demand has driven its futures open interest to $818 million on Friday, up nearly 26% from levels recorded the previous day.
As such, if investor demand continues to build for the token, it could likely continue its uptrend as bulls try to push its price above $400 for the first time since January.
A major catalyst driving investor interest has been growing attention towards its shielded liquidity pools, one of the core features of the network that ensures transaction confidentiality. The Zcash dashboard shows that over 31% of all ZEC coins are now held in shielded pools. This represents nearly $1.96 billion in protected value.
Zcash price also gained momentum from a broader rally among privacy-focused cryptocurrencies today, as the total market cap of these assets rose over 11%, bringing its market cap to over $13 billion. Notably, Monero (XMR), currently the market leader in the privacy sector, has risen 4.3% in the past 24 hours. Other privacy tokens, such as Dash (DASH) and Decred (DCR), also recorded significant gains.
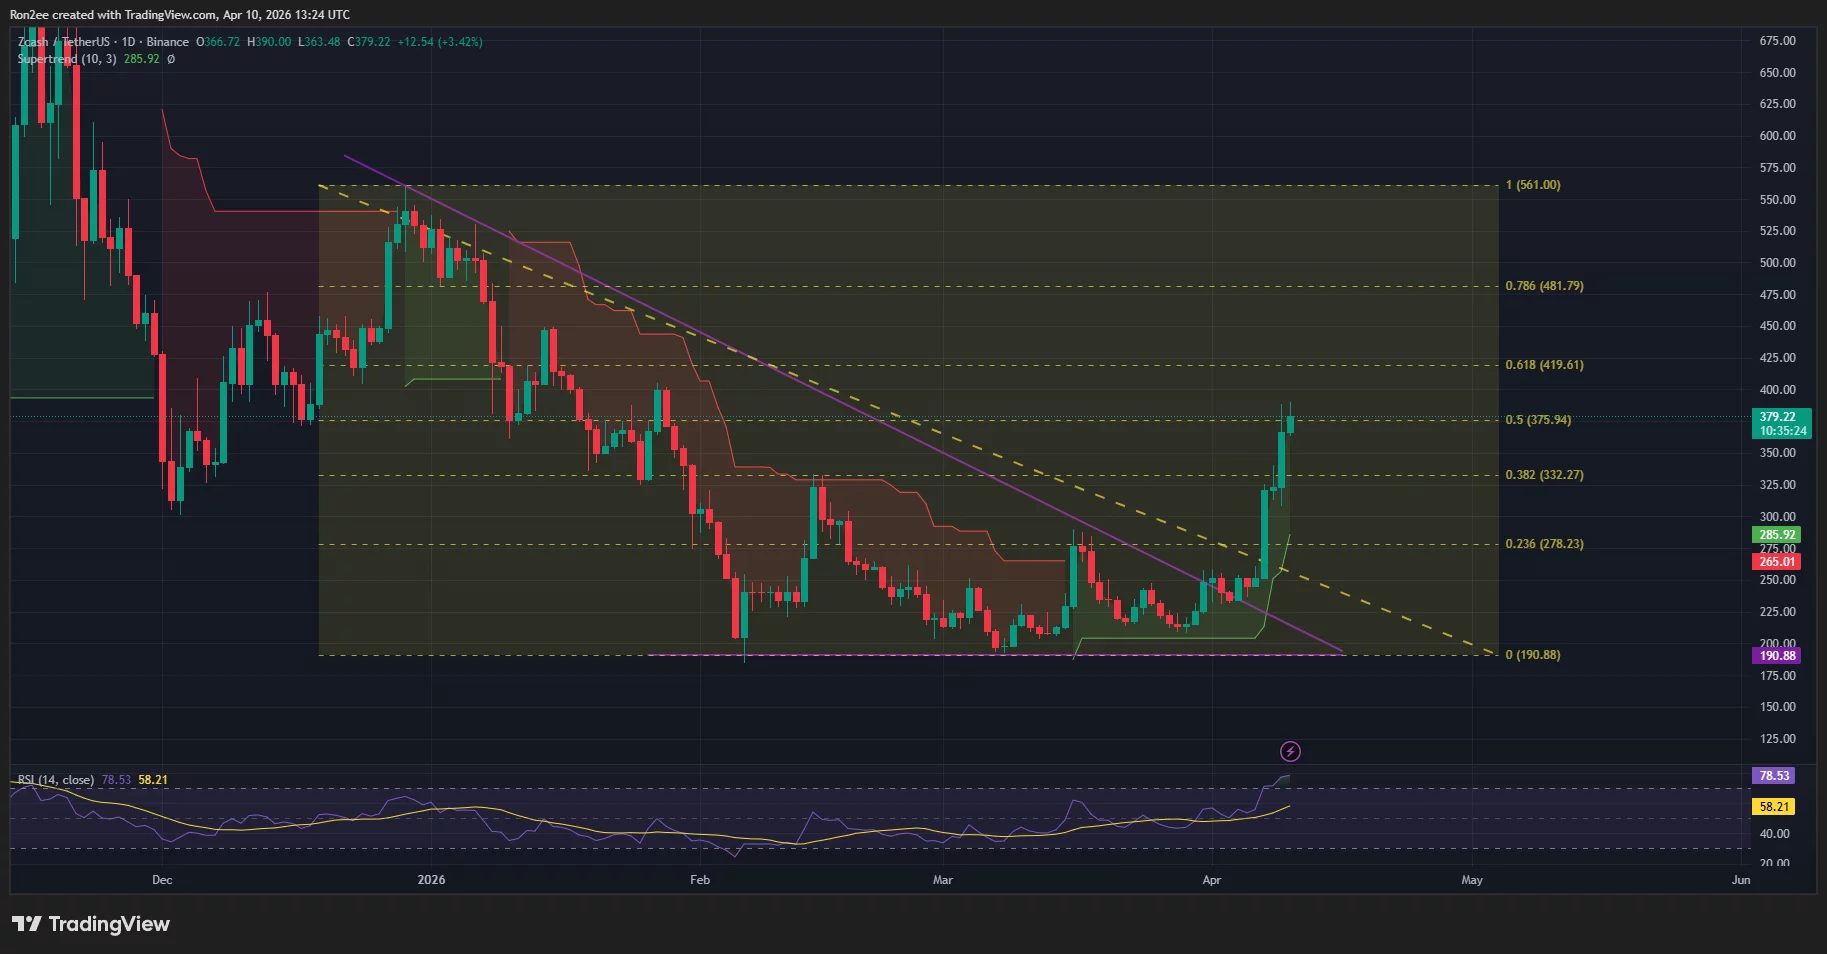
On the daily chart, Zcash price has broken out of a descending triangle, a major bullish reversal signal in technical analysis.

The Supertrend indicator has flipped green, a sign that the bulls are now firmly in control of the market. At the same time, the RSI has crossed above overbought levels, lying at 78, which means the token is seeing massive buying pressure, though it may face a brief cooling off period.
For now, the key overhead resistance level for Zcash next lies at $419, the 61.8% Fibonacci retracement level. A break above the resistance could spur a rally toward the $450 psychological mark.
On the contrary, if Zcash price falls below $332, where the 38.2% Fibonacci support level lies, the bullish thesis could be invalidated, leading to a deeper correction toward $300.
Disclosure: This article does not represent investment advice. The content and materials featured on this page are for educational purposes only.

Bitcoin is surfacing as a potential mechanism for toll payments in one of the world’s most strategic chokepoints, as Iran maintains tight control over the Strait of Hormuz amid a fragile ceasefire with the United States. The region’s security dynamic has long intertwined with oil markets, and the latest development would push crypto onto a stage where sanctions and transit fees intersect with global energy supply.
Iran reportedly plans to manage transit through Hormuz alongside Oman, effectively acting as a toll gate for vessels navigating the strait. The plan would involve collecting fees from ships seeking safe passage, a move that, if implemented, could leverage digital currencies to bypass traditional financial channels in a tense geopolitical environment. Hamid Hosseini, a spokesperson for Iran’s Oil, Gas and Petrochemical Products Exporters’ Union, told the Financial Times that certain ships could be required to pay in Bitcoin for their oil cargo transit, a claim that underscores how crypto could become part of state-level logistics and sanctions calculus.
According to Hosseini, once Iran completes its assessment, vessels would be given only seconds to complete a BTC payment, with the aim of making tracing or confiscation difficult under sanctions regimes. If verified, the move would mark a notable shift for Iran, which has previously signaled a willingness to accept the Chinese yuan as toll payment for Hormuz, signaling a broader exploration of non-traditional payment rails in critical commerce corridors.
These reports arrive amid ongoing conflict and a fragile ceasefire, with Hormuz policymakers using their leverage over a route that channels roughly one-fifth of global oil flows. The potential adoption of cryptocurrency payments would highlight how digital assets could be deployed to navigate geopolitical frictions and possibly sidestep conventional financial controls in high-stakes trade corridors. For context, coverage of the topic has circulated in multiple outlets, including a Bloomberg report that framed the Hormuz toll discussion in the context of yuan and crypto payments for safe passage.
Key takeaways
- Iran’s reported plan to charge Hormuz tolls in cryptocurrency could position Bitcoin as a trans-border payment tool in a geopolitically sensitive shipping lane, with enforcement reportedly led by the Revolutionary Guard Corps.
- Earlier signals suggested Iran might also accept the Chinese yuan for Hormuz tolls; the crypto option would represent a broader experiment with non-traditional currencies in state logistics.
- In parallel, JPMorgan CEO Jamie Dimon warned that blockchain-enabled infrastructure and artificial intelligence are reshaping banking, signaling incumbents must adapt to new competitive dynamics and evolving payment rails.
- Analysts at Bernstein view Figure Technologies’ tokenized lending as a sign that blockchain-enabled finance could unlock meaningful value, arguing the stock could re-rate as tokenization scales.
- Policy discussions around stablecoins persist. The White House Council of Economic Advisers estimated that banning stablecoin yield-bearing products would have a negligible impact on bank lending—roughly 0.02%—though the broader regulatory trade-offs continue to be debated.
- The stablecoin market continues to expand, with a first-quarter size around $315 billion, underscoring the growing footprint of yield-bearing digital assets in mainstream finance.
The Hormuz development: crypto tortoises or speedboats for sanctions evasion?
Iran’s reported use of cryptocurrency for Hormuz tolls would place a bold experiment at the intersection of geopolitics and digital finance. The Financial Times account, corroborated by subsequent reporting, depicts a system where ships—especially oil tankers—could face multi-million-dollar fees paid in BTC or other cryptographic forms. The Revolutionary Guard Corps is described as enforcing governance over who passes and how payments are settled, a role that would elevate crypto from a speculative instrument to a policy tool in a critical energy artery.
What makes this development consequential for markets is not just the potential for crypto to facilitate faster, less trackable payments, but the signal it sends about how governments may experiment with alternative settlement rails under sanctions pressure. If a state actor can leverage quasi-anonymous transactions to extract tolls without conventional banking channels, it could alter how traders price and approach risk in energy markets, as well as how counterparties assess sanctions exposure and regulatory risk.
While initial reports are centered on Iran’s tolling scheme, observers will be watching whether any pilot becomes formal policy and how actors in other corridors respond. The cryptocurrency angle also tests the resilience of existing sanction enforcement frameworks and prompts questions about routing, compliance, and traceability in maritime payments.
Dimon’s warning: banks must adapt to blockchain and AI disruption
In another strand of the week’s crypto-business narrative, Jamie Dimon warned that a new wave of technology-driven competition is reshaping financial services. In discussions around his latest shareholder letter and public remarks, Dimon pointed to fintechs and nonbank players deploying blockchain and other emerging technologies to build faster, lower-cost systems. He also hinted that stablecoins could be part of this broader shift in how payments and liquidity are managed.
JPMorgan has already built out its own blockchain toolkit, including the Kinexys platform, as the bank positions itself to compete in fast-moving areas such as cross-border payments and asset tokenization. The emphasis on in-house infrastructure signals that the era of simply holding a dominant balance sheet is over; the real differentiator may be how quickly incumbents can deploy technology-driven, interoperable networks that rival nimble fintechs and crypto-native entrants.
Tokenization, lending, and the case for a higher multiple
Analysts at Bernstein have spotlighted Figure Technologies as a bellwether for how tokenization could transform traditional lending. Figure, which runs its lending platform on the Provenance blockchain, has reported rapid originations—surpassing $1 billion in monthly loan activity in recent periods, according to Bernstein’s note. The analysts argued that the efficiency gains from on-chain data and smart contract-enabled processes could bolster margins for lenders as volumes grow, potentially supporting a higher equity multiple for Figure’s stock. Bernstein assigned an “Outperform” rating with a target around $67, roughly double its then-current level.
Figure’s model—where loan origination, underwriting, and securitization leverage a dedicated blockchain—illustrates a broader thesis: tokenization could compress costs and speed, unlocking a path to scale in consumer and enterprise lending that has historically been cost-constrained by legacy systems. Investors watching blockchain-enabled lending will want to monitor not just originations, but capital efficiency, default performance, and regulatory clarity around tokenized debt markets.
Stablecoins and the policy balance: little impact on banks, significant debate ahead
A separate thread in the policy debate concerns the yield on stablecoins and how its regulation could ripple through the broader banking system. Economists at the White House argued that prohibiting yield-bearing stablecoins would have only a marginal effect on bank lending, estimating an increase of about 0.02%. The assessment, part of ongoing market-structure discussions, underscores the tension between consumer benefits from higher-yield crypto products and the perceived stability and safety of the traditional banking system.
The analysis also highlighted potential trade-offs: tightly constraining yields could limit consumer access to higher returns and reduce the perceived advantages of stablecoins for everyday payments, while leaving depositors exposed to new forms of risk if yields rot within a non-regulated space. The debate continues as policymakers weigh consumer protection, financial stability, and innovation incentives in a rapidly evolving ecosystem.
In parallel, the broader market for stablecoins remains expansive. A recent industry snapshot noted stablecoins reached about $315 billion in market size in the first quarter, illustrating the growing role of these tokens in payments, liquidity provisioning, and on-chain finance. The data point, drawn from the industry research cited by Cointelegraph and linked sources, frames why regulators and financial institutions are paying close attention to yield dynamics and reserve standards as the sector expands.
Crypto Biz is your weekly briefing on the business of blockchain and crypto, highlighting developments that matter for traders, investors, and builders. Watch for further updates as these narratives unfold and policy responses take shape.
For readers seeking more context, coverage on Hormuz tolls and crypto payments has been explored in related reporting from Cointelegraph, including a piece detailing Iran’s approach to crypto-enabled transit arrangements, and Bloomberg’s analysis of yuan and crypto tolls as a separate dimension of Hormuz policy.


ECB backs shifting supervision of systemic crypto firms and venues from national regulators to esma as part of a wider eu capital markets integration push.
Summary
- ECB supports putting systemic crypto providers and key trading venues under ESMA.
- Move is part of the EU’s broader push to integrate capital markets and strengthen supervision.
- Proposed law could take months to negotiate, with ESMA needing more staff and funding for the new remit.
The European Central Bank (ECB) has endorsed an EU plan to shift supervision of systemically important crypto asset service providers, major trading venues, and central counterparties away from national regulators and into the hands of the European Securities and Markets Authority (ESMA). In an opinion backing the European Commission’s “market integration and supervision” package, the ECB said centralizing oversight would “ensure consistent, high‑quality supervision of cross‑border market players” and reduce the risk of regulatory blind spots across the bloc.
The legislative proposal is now with EU governments and the European Parliament, with negotiations expected to last several months before any law is finalized.
According to a report from Reuters, the ECB argued that large crypto service providers and trading venues can be “systemically relevant” for the EU’s financial system, warranting supervision at the European rather than national level. “Direct supervision by ESMA of certain market players is warranted to address risks stemming from their cross‑border activities,” the central bank said, calling the current patchwork of national oversight “insufficient” for integrated markets. The plan would give ESMA a lead role on top of its existing responsibilities under the EU’s Markets in Crypto‑Assets (MiCA) framework, which already tasks the Paris‑based watchdog with drafting technical standards and coordinating supervision.
Brussels has framed the overhaul as part of its long‑running Capital Markets Union agenda, which aims to deepen and harmonize financial markets across the EU. The European Commission’s package, presented in February, would expand ESMA’s direct oversight not just of systemic crypto platforms but also of key clearing houses and trading venues in traditional markets. “A more integrated capital market requires more integrated supervision,” the Commission said when unveiling the reforms.
The ECB also warned that ESMA must be properly equipped for its expanded crypto mandate, stressing that the authority should receive “adequate staffing and financial resources” to avoid stretching its existing teams. ESMA has previously cautioned that some crypto firms were giving “misleading impressions” about their regulatory status under MiCA, and urged national watchdogs to step up enforcement. Under the new proposal, firms deemed systemically important could face a single, tougher supervisor in Paris rather than navigating 27 different regimes, a shift that may raise compliance costs but also clarify expectations for large exchanges and custodians operating across the bloc.


Coinbase Asset Management and MarketVector’s COINSOV index uses inverse volatility weights to blend Bitcoin and gold, targeting better risk‑adjusted ‘store‑of‑value’ returns than static mixes.
Summary
- COINSOV dynamically tilts between Bitcoin and gold each quarter based on realized volatility, aiming to capture Bitcoin’s upside while keeping drawdowns closer to gold.
- MarketVector’s backtests from 2017–2025 show the index beating simple Bitcoin‑gold splits and several benchmarks on a risk‑adjusted basis, with smaller maximum drawdowns than a 50/50 mix.
- The index holds Bitcoin and Pax Gold (PAXG), letting institutions track the blend onchain while tapping existing crypto and commodity infrastructure.
Coinbase Asset Management and global index provider MarketVector have launched the Coinbase Store of Value Index (COINSOV), a rules‑based benchmark that dynamically allocates between Bitcoin and gold to offer what they describe as a more resilient “store‑of‑value” mix for institutions. Announced on April 8 via BusinessWire and the Financial Times’ market announcements page, the index is designed to capture Bitcoin’s upside while keeping drawdowns closer to traditional gold exposures, a trade‑off that has become increasingly relevant as Bitcoin’s market capitalization has climbed above $1 trillion in recent cycles.
According to MarketVector, COINSOV is “a rules‑based benchmark that combines Bitcoin and gold in a volatility‑aware framework designed to help preserve purchasing power across market cycles.” The index uses an inverse volatility weighting model, meaning it tilts toward the asset with lower realized volatility over the look‑back period and away from the more volatile one, and then rebalances quarterly to keep the mix aligned with those risk signals.markets.
In practical terms, COINSOV allocates between Bitcoin and tokenized gold, currently represented by Pax Gold (PAXG), an asset‑backed token tied to vaulted bullion, allowing the entire exposure to be held onchain or via digital‑asset infrastructure. MarketVector’s backtests indicate that from 2017 to 2025, this approach outperformed simple static Bitcoin‑gold allocations and several traditional portfolio benchmarks on a risk‑adjusted basis, while experiencing materially smaller maximum drawdowns than a naive 50/50 split between the two assets.
“The Coinbase Store of Value Index reflects our ability to combine Bitcoin and gold through transparent, rules‑based construction, offering a modern approach to a store‑of‑value allocation,” MarketVector said in its launch statement, positioning the index as a benchmark for asset managers building hybrid products. Martin Leinweber, Director of Digital Asset Research and Strategy at MarketVector, added that COINSOV “bridges digital and traditional assets within an institutional framework,” underlining the aim to make Bitcoin‑gold mixes more accessible to regulated investors.
For Coinbase Asset Management, the product is another way to deepen its role in institutional crypto. In a market where Bitcoin has been pitched as “digital gold” and gold remains a multi‑trillion‑dollar reserve asset, the index formalizes what research from firms such as MarketVector and Coinbase has suggested for some time: that modest Bitcoin exposure alongside gold can raise risk‑adjusted returns versus gold alone, but that volatility needs to be actively managed.
The launch also lands against a broader backdrop where so‑called store‑of‑value assets compete for flows with large dollar stablecoins and tokenized treasuries, a trend tracked in crypto.news reporting on the $280 billion stablecoin market and the growth of tokenized government debt past $7.4 billion. For now, COINSOV gives institutions a live benchmark that sits between the volatility of Bitcoin and the defensiveness of gold, and one that can be paired with spot exposure via Bitcoin and Pax Gold price pages on platforms such as crypto.news.


Federal RICO suits say Lime chair Brad Bao helped give Cere Network cover as insiders allegedly dumped $41.78m in CERE tokens and left investors with a 99.8% price collapse.
Summary
- Two federal lawsuits in California seek $157m in damages, accusing Cere CEO Fred Jin of hiring convicted market maker Gotbit for wash trading and diverting funds to DeFi gambles and family accounts.
- Cere raised about $42.96m from 5,000+ investors; its CERE token spiked to roughly $0.47 in November 2021 and now trades near $0.00061, according to price data.
- Bao is accused of acting as an “enabler” whose Lime pedigree helped attract capital, with one complaint adding Section 20(a) control‑person claims under U.S. securities law.
Federal prosecutors’ years‑long pursuit of a crypto wash‑trading ring has spilled into Silicon Valley, with Lime executive chairman Brad Bao now facing two federal racketeering lawsuits totaling $157 million over alleged fraud at Cere Network. The civil cases build on a U.S. crackdown that has already seen Gotbit Ltd. founder Aleksei Andryunin plead guilty to wire‑fraud conspiracy, serve eight months in prison and forfeit $23 million in cryptocurrency after admitting to faking trading volume to pump token prices.
Court filings reviewed by outlets including International Business Times say investors have brought two separate RICO complaints in the Northern District of California, naming Bao, Cere CEO Fred Jin and other insiders. The first case, brought by Hong Kong‑linked investor group Goopal Digital Limited, seeks $100 million in damages, while a second suit by San Francisco investor Josef Qu demands $57 million, bringing combined claims to $157 million.
Both complaints allege Jin used market‑maker Gotbit to orchestrate wash trades on the November 2021 launch day of Cere’s CERE token, generating fake volume to mask a massive insider sell‑off. Cere is said to have raised about $42.96 million from more than 5,000 investors, many via token sales on Republic under Regulation D, before Jin and his associates allegedly dumped roughly $41.78 million worth of CERE on exchanges while promising that insider holdings were locked under vesting schedules.
According to price data from services such as CoinMarketCap and CryptoRank, CERE briefly traded near an all‑time high around $0.47 in early November 2021 but has since collapsed to roughly $0.00061, a drawdown of more than 99.8%. Qu says he invested in Cere through a Simple Agreement for Future Tokens in 2019, entitling him to 27,777,778 CERE tokens, but never received any allocation even as insiders allegedly moved their own tokens to exchanges “within hours” of launch.
Bao, who co‑founded scooter company Lime in 2017 and helped expand it to more than 280 cities worldwide, joined Cere’s board and, according to the complaints, lent his Silicon Valley credentials to help raise capital. The suits allege he received director’s fees and an early CERE allocation, approved financial transfers into accounts controlled by Jin, and used his reputation to reassure investors that Cere was a legitimate Web3 infrastructure project.
The Qu complaint adds so‑called “control person” claims under Section 20(a) of the Securities Exchange Act, seeking to hold Bao liable as someone who exercised authority over an entity alleged to have violated federal securities laws, even if he did not personally execute every part of the scheme. Both suits also detail about $16.6 million in Cere treasury funds allegedly lost in high‑risk DeFi bets, including approximately $6.51 million on Mochi Protocol, $3.27 million in a CVX/ETH liquidity pool, $780,000 on Maple Finance and $345,000 in the failed Neutrino USDN system, all without investor consent.binance+1
The filings portray Jin as a serial founder who “established a pattern” of launching ventures, raising capital “under false pretenses,” extracting value and then moving on, tracing a line from mobile‑gaming firm Funler in 2016 to education‑blockchain venture Bitlearn in 2018 and finally Cere in 2019. Plaintiffs say he has already launched a new AI company, CEF AI Inc., allegedly funded with proceeds from the Cere scheme and now targeted by asset‑freeze requests covering corporate accounts, personal wallets and real estate in Germany and Florida.
For regulators, the Cere cases sit at the intersection of securities enforcement and criminal market‑manipulation work already familiar from the Gotbit prosecutions, where employees have been arrested at U.S. airports, extradited from Singapore and the firm ordered shut down. As the SEC continues to treat many token offerings as potential unregistered securities and the Department of Justice follows the wash‑trading trail, a token that has lost more than 99.8% of its value and spawned overlapping civil and criminal narratives is likely to remain on their radar.
Relevant crypto.news stories that can be linked as single words in the body include prior reporting on the $280 billion stablecoin market, a story on tokenised treasuries reaching $7.4 billion, and an analysis of institutional real‑world asset tokenization as a new market “backbone,” which together sketch the enforcement and market backdrop for the Cere litigation.

Disclosure: This article does not represent investment advice. The content and materials featured on this page are for educational purposes only.
As traditional assets move on-chain, investors turn to decentralized finance and utility-driven tokens like BlockchainFX (BFX) amid rising global market volatility.
Summary
- Institutional liquidity flows into DeFi as traders seek high-yield opportunities in volatile global markets
- BlockchainFX (BFX) positions as a multi-asset Super App bridging crypto, stocks, forex, and ETFs
- BFX has introduced a revenue-sharing model with staking rewards, buybacks, and token burns to support value growth
Global market volatility remains high today as institutional liquidity flows into decentralized finance at record speeds. Traditional assets are moving on-chain while traders seek high-yield opportunities in emerging utility sectors. Smart participants are now looking at the next 100x crypto, BlockchainFX (BFX).

BlockchainFX (BFX) recently entered the spotlight with a robust debut, aiming to solve the liquidity gap between traditional and digital markets. Major assets like Cardano (ADA) continue to dominate headlines as the community prepares for the discussed market shift.
Cardano price prediction: Detailed forecast for 2026
Cardano news highlights a steady growth path for this academic blockchain giant. Based on technical analysis, the Cardano price prediction for 2026 suggests a yearly low of $0.35 and a potential high of $1.15. This indicates significant upside if the ecosystem maintains its current development trajectory.
Looking further ahead, the Cardano price remains a point of interest for long-term early adopters. Estimates for 2027 project a range between $0.39 and $0.83, while the 2030 forecast shows a potential peak of $1.02. This makes the coin a solid choice for those seeking stability over rapid volatility.
BlockchainFX: The next 100x crypto redefining trade
BlockchainFX (BFX) is the ultimate licensed Super App that bridges the $7.5 Trillion daily Forex market with the growing world of crypto. While most exchanges ignore traditional assets, BFX allows trading of over 500 assets, including Stocks, Gold, and ETFs, from one web3 interface. This project solves the fragmentation problem by giving early adopters a single point of entry for all financial needs.
The unique selling point is the massive 70% revenue-sharing model. Instead of the platform keeping all the profit, 50% of trading fees go back to stakers in daily USDT and BFX. Another 20% is used for market buybacks, with half of those tokens burned to keep the supply low and the value high.
Feature
BlockchainFX Benefits
Current Price
$0.035
Confirmed Launch Price
$0.05
Daily Rewards
Paid in USDT and $BFX
Compliance
CertiK Audited and Fully Licensed
Early buyers are rushing to secure tokens before the supply hits the open market. With 22,950+ participants already onboard, the momentum is undeniable. This is the chance to get in at the floor price before the official listing.
- 18-Karat Gold Visa Cards: Exclusive to high-tier BFX crypto presale 2026 participants for global spending.
- Massive Trading Credits: Up to $25,000 in credits for the Legend tier to use on the Super App.
- Daily Passive Income: Immediate staking starts the moment you join the crypto presale.
Big announcement: The 15 million launch trigger is near
The energy is reaching a boiling point because the finish line is in sight. BlockchainFX has already raised over 14.18 million. The core team officially announced that the moment the presale hits the 15M mark, BFX will launch on major exchanges. There is very little time left to grab the BFX crypto presale 2026 at these entry levels.
To celebrate this milestone, the bonus code LAUNCH50 is active, giving participants 50% extra tokens on their purchase. This crypto presale is moving at lightning speed, and the 15M goal is just around the corner.

Can BlockchainFX become the next 100x crypto?
Every cycle produces a breakout star that changes the game for early adopters. Cardano provides steady utility according to its price prediction, but the massive growth potential of the BlockchainFX presale offers a different level of opportunity. Its unique revenue-sharing and multi-asset trading model make it a standout choice for any diversified portfolio.
The current BlockchainFX presale price of $0.035 is a rare entry point before the $0.05 launch. Use code LAUNCH50 for a 50% bonus and start earning daily USDT rewards immediately. With 14.18 million raised, the 15 million launch trigger is imminent. This could be the next 100x crypto investors wouldn’t want to miss.
For more information, visit the official website, X, and Telegram.
Disclosure: This content is provided by a third party. Neither crypto.news nor the author of this article endorses any product mentioned on this page. Users should conduct their own research before taking any action related to the company.
Crypto World
Zcash price cools after parabolic run as derivatives froth flashes risk, is $400 in range?


Zcash price is trading around $378 after a parabolic 60% weekly rally, with volume and leverage surging to levels that signal a late‑stage momentum blow‑off rather than calm accumulation.
Summary
- ZEC is up roughly 21% in 24 hours and about 60% over the past week, making it one of the strongest‑performing large‑caps on major trackers.
- 24‑hour spot volume has jumped above $1.0b while futures open interest sits near $3.39b, pointing to aggressive leveraged longs and short squeezes.
- RSI on ZECUSDT is firmly overbought near 73 and MACD remains bullish, a combination that supports the uptrend but raises the risk of a sharp mean‑reversion if leverage unwinds
Zcash (ZEC) price is trading around $378 after a parabolic move that left it up roughly 21% in 24 hours and about 60% over the past week, putting it among the most explosive large‑caps in the market. 24‑hour spot volume has surged above $1.0 billion against a significantly smaller market capitalization, while open interest in ZEC futures stands near $3.39 billion, signaling aggressive leveraged positioning rather than slow spot accumulation.
RSI on major timeframes sits firmly above 70 with a ZECUSDT reading near 73, and momentum indicators such as MACD remain bullish, setting up a late‑stage trend regime where upside is possible but the risk of a sharp mean‑reversion spike lower is high if leverage unwinds.
Zcash is trading near $378 on April 10, 2026, extending a vertical surge that has pushed the privacy coin up roughly 21% in 24 hours and about 60% over the past seven days, according to TradingView and other price trackers. The current level marks one of the strongest weekly performances among large‑cap altcoins, with ZEC reclaiming territory last seen during prior speculative spikes.
Spot volume has jumped to more than $1.0 billion in the last 24 hours, a figure that is extremely elevated relative to ZEC’s market capitalization and consistent with aggressive chase rather than quiet institutional accumulation. On the derivatives side, data from CoinGlass shows ZEC open interest at roughly $3.39 billion, a level that indicates heavy use of leverage, with earlier episodes of the rally already associated with tens of millions of dollars in short liquidations over 24‑hour windows.
Technically, multiple momentum dashboards flag ZEC as overbought. TradingView’s ZECUSDT technical summary shows a 14‑period RSI reading near 73, in the sell/overbought zone, while the Commodity Channel Index prints around 179 and the Momentum (10) indicator is elevated, all pointing to a stretched move. At the same time, the MACD level remains positive, confirming that the trend is still up even as risk builds.
This combination—a strong, intact uptrend but increasingly overheated oscillators and heavy derivatives exposure—is typical of a momentum blow‑off phase. Price, volume and open interest are all pointing in the same direction, suggesting that recent gains have been fueled by fresh long leverage and forced short covering rather than fundamental re‑rating. If open interest begins to roll over or funding spikes, the setup favors a sharp mean‑reversion move back toward prior consolidation zones.
In that context, traders looking at ZEC around $378 face an asymmetric choice. Trend‑followers may still see room for continuation as long as price holds recent higher lows and momentum remains positive, but any clear break of short‑term support levels on rising volume would likely trigger a cascade of long liquidations after such a steep run. With ZEC now trading well above levels highlighted in earlier TradingView studies and derivatives positioning near local extremes, the next major move is likely to be defined less by new buyers and more by how quickly leveraged positions are forced to unwind.
Crypto World
Best Crypto Portfolio for April 2026 Misses One Presale That ETH and BNB Alone Cannot Replace
Stablecoin inflows to exchanges just hit $778 million in a single week, confirming capital is pouring back into crypto at a pace not seen since the last bull run started. But the best crypto portfolio for April 2026 is not built from large caps alone.
The wallets that caught the biggest returns every cycle held one presale entry alongside their blue chips.
Pepeto crossed $8.87 million raised during extreme fear with the cofounder who built the original Pepe coin, a SolidProof audit, and a Binance listing that turns the presale floor into history.
Stablecoin Inflows Hit $778 Million as Recovery Capital Floods Back Into Crypto
Stablecoin inflows to exchanges reached $778 million this week per CoinGecko. The spike follows the Iran ceasefire that sent BTC above $72,000 and wiped $600 million in shorts.
Morgan Stanley’s spot Bitcoin ETF pulled $34 million on day one per CoinDesk, and the best crypto portfolio for this recovery phase needs presale exposure where the gap between entry and listing carries the highest return.
How ETH, BNB, and Pepeto Fit Into the Best Crypto Portfolio This Cycle
Pepeto: The Presale Piece That Turns a Good Portfolio Into a Great One
ETH and BNB give a portfolio its foundation, but every cycle the portfolios that actually changed lives had one presale entry that outweighed everything else combined. That is the role Pepeto fills right now, and no large cap at current prices can replace what a presale to listing gap delivers.
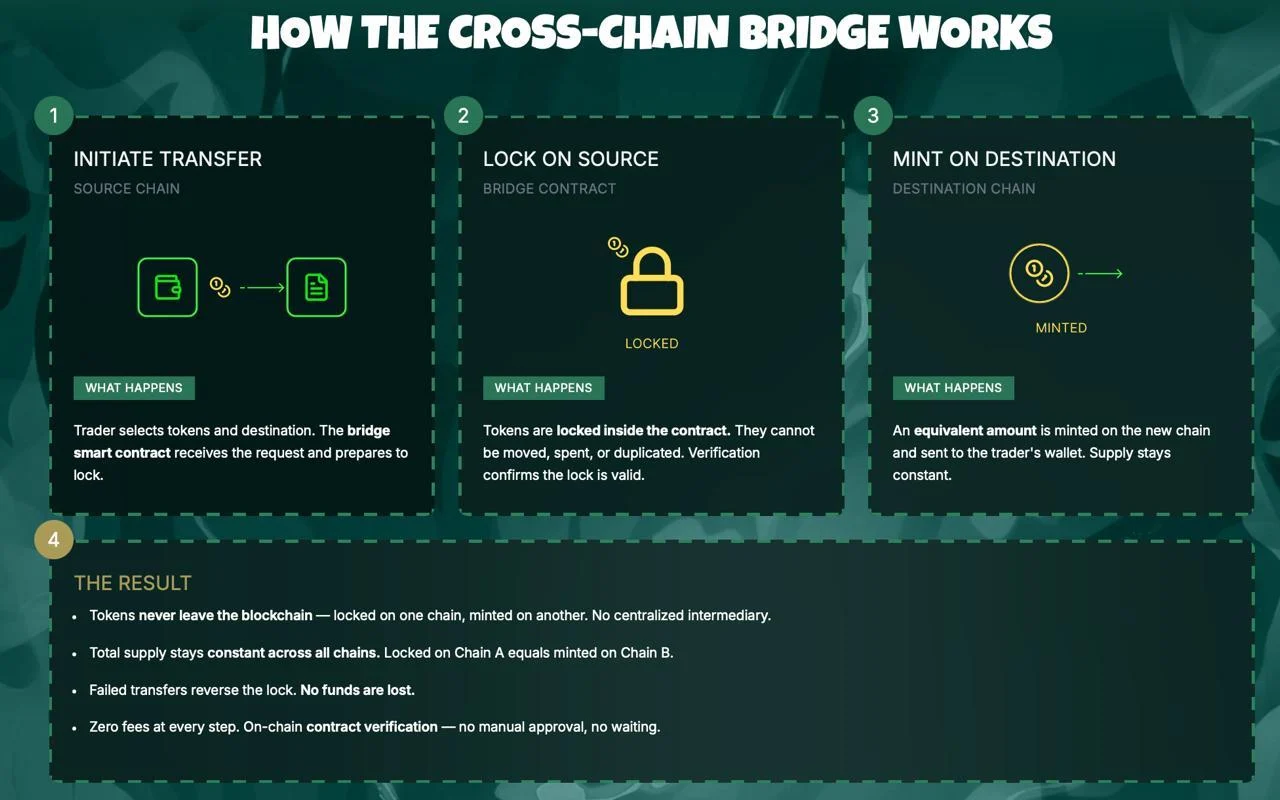
The exchange is already live. Zero fee swaps, a cross chain bridge at zero cost, and a contract scanner that flags scams before money moves are all running and handling real activity. That separates Pepeto from every presale still stuck at the whitepaper stage.
The presale reached $8.87 million while fear gripped the market and most tokens were bleeding, proving the capital flowing in is smart money, not hype chasers. The builder behind the first Pepe token who took 420 trillion coins to $11 billion with zero products is now doing it with a full exchange behind it, a SolidProof audit covers every contract, and 186% APY staking quietly builds positions while the listing gets closer.
At $0.0000001863, analysts model 100x to 300x, and the pace keeps picking up because the wallets inside know the listing wipes this entry off the table permanently. The best crypto portfolio in 2026 is the one that added Pepeto before that moment, and waiting means watching the return from the outside.
Ethereum: ETH Anchors Portfolios but Growth Stays Limited
ETH holds near $2,206 with institutional buying continuing after the ceasefire bounce per CoinMarketCap. 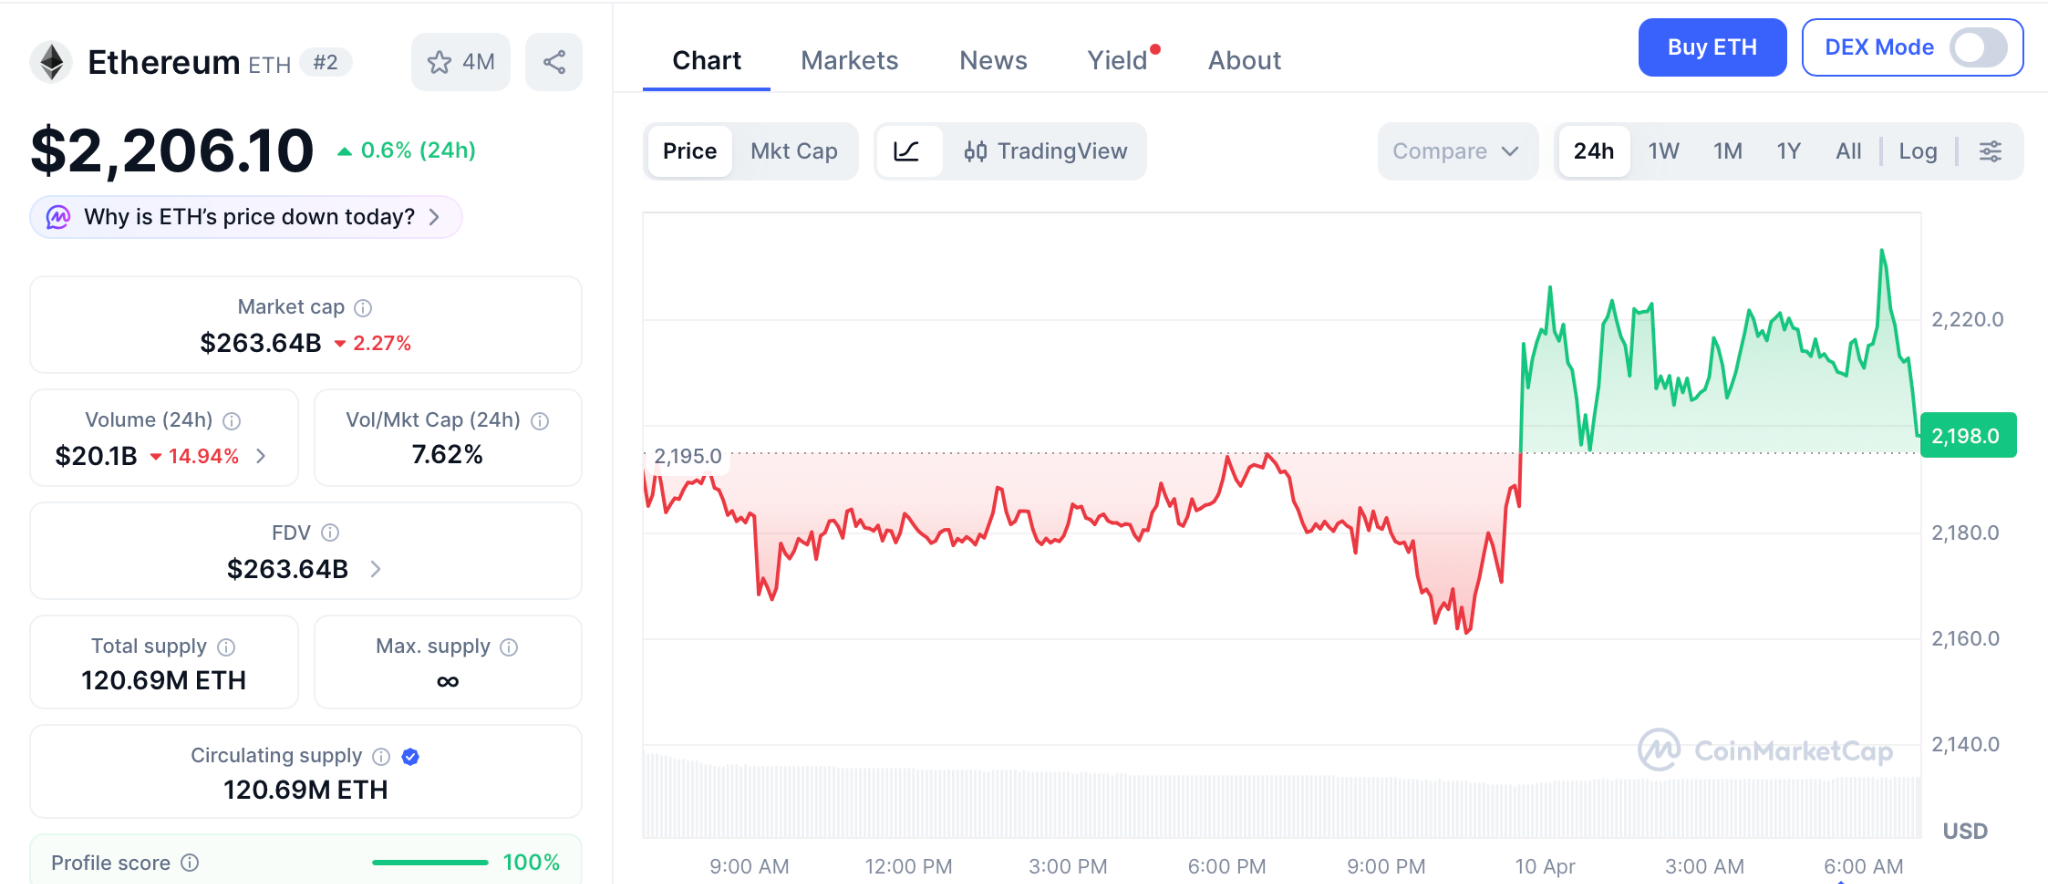
Trend Research now holds over 580,000 ETH, the MVRV ratio signals a historic buying zone, and the Ethereum Foundation staked 70,000 ETH worth $143 million this month to reduce sell pressure.
ETH belongs in every best crypto portfolio as the base layer, but from $2,206 the percentage gains that reshape a position need years while presale entries hold the presale to listing spread where the biggest returns live.
BNB: Stable Foundation but the Ceiling Is Clear
BNB trades near $604 supported by quarterly burns and exchange volume per CoinMarketCap. New listings on Binance historically lift BNB demand as traders move capital onto the platform, and the upcoming Pepeto listing adds another event to the calendar.
BNB adds stability to any best crypto portfolio, but from $604 the path to $900 delivers roughly 50%, far below what a presale entry at floor price produces when the listing opens the full gap between entry and market price.
Conclusion
$778 million in stablecoin inflows proves the recovery is building, and the wallets putting together the best crypto portfolio are looking past large caps toward the presale entry that carries the widest return. Pepeto has the live exchange, the audit, the Pepe cofounder, and $8.87 million in capital to back it.
The presale floor gets replaced permanently on listing day, and the portfolios that added Pepeto before that moment are the ones that outperform everything else this cycle. The entry exists right now, and every hour closer to the listing is one hour less before it disappears.
Click To Visit Pepeto Website To Enter The Presale

FAQs
What belongs in the best crypto portfolio for 2026?
ETH and BNB form the foundation, but Pepeto at $0.0000001863 with a confirmed Binance listing adds the presale to listing gap where the largest returns every cycle get built. The project raised $8.87 million with a live exchange.
How do stablecoin inflows affect the best crypto portfolio?
$778 million flowing into exchanges confirms recovery capital is arriving at scale. Presale entries like Pepeto capture more of that wave than large caps already priced near their recovery targets.
Disclaimer: This is a Press Release provided by a third party who is responsible for the content. Please conduct your own research before taking any action based on the content.


Bitcoin moved from $72,000 to $72,400 on April 10 after March core CPI printed below expectations, giving crypto bulls a short-lived reprieve from months of sustained macro pressure.
Summary
- March core CPI rose just 0.2%, below the 0.3% consensus forecast, while headline CPI climbed 0.9% on war-driven oil prices.
- Bitcoin ticked up to $72,400 within minutes of the 8:30 AM ET release before pulling back near $72,000.
- The soft core print eased immediate rate hike fears but did not shift the broader Federal Reserve policy outlook.
Bitcoin (BTC) price update: BTC climbed from roughly $72,000 to $72,400 on April 10 after the Bureau of Labor Statistics reported that March core CPI rose just 0.2%, coming in below the 0.3% consensus forecast, according to CoinDesk. Headline CPI rose 0.9% on the month, driven by a roughly 10.9% surge in energy costs tied to the ongoing Middle East conflict, keeping annual inflation at 3.3%. Core CPI came in at 2.6% year-on-year, slightly below the 2.7% economists had forecast.
The below-forecast reading gave crypto traders a short-lived reason to add exposure. Bitcoin rose in the minutes following the release, with FXLeaders noting that BTC “reclaimed $72,000 as macro fears fuel appetite for digital scarcity.” The move was measured rather than explosive, reflecting a market still navigating sticky headline inflation against a softer underlying trend. As crypto.news noted, the inflation print “came in line with expectations” at the headline level, easing fears of an even hotter surprise while confirming that price pressures remain elevated but stable.
The distinction matters for traders. A softer core number reduces the probability of an aggressive Fed pivot toward tightening. But with annual headline CPI running at 3.3%, the highest reading since May 2025, the Fed has little political or economic space to move toward cuts.
Fed Stays Cautious as Oil Keeps Headline Inflation Elevated
The soft core figure did not meaningfully shift Federal Reserve rate expectations. With the Strait of Hormuz still constrained by the ongoing conflict, energy prices remain a structural upward force on monthly CPI readings, complicating the Fed’s near-term calculus. Markets currently price near-zero odds of a rate reduction in the coming months.
As crypto.news tracked ahead of the release, analysts had outlined a directional framework: a cooler core print could open a path toward $74,000 to $76,000, while a hotter reading risked a retest of the $68,000 support zone. The actual print landed in the middle, producing a modest rally that stalled short of $73,000.
What Traders Are Watching Next
Bitcoin remains range-bound near $72,000, with $73,000 acting as the immediate ceiling. The level has capped every rally since the ceasefire was announced six weeks ago. Analysts broadly agree that a sustained break above $75,000 is needed before the market can enter a genuine new leg higher. Attention now shifts to weekend US-Iran negotiations in Islamabad and whether progress toward a durable peace deal could remove the geopolitical overhang that has weighed on prices across all risk assets.


Bitcoin institutions are betting on both sides of the market at $72,000, buying $80,000 call options while simultaneously purchasing downside protection, as Friday’s CPI data and US-Iran peace talks in Islamabad leave direction entirely unclear.
Summary
- Institutional traders are buying $80,000 call options while also loading downside protection.
- Bitcoin has stalled at $72,000 as investors await clarity from the CPI print and Iran ceasefire talks.
- US-Iran peace negotiations in Islamabad this weekend could provide the next decisive directional catalyst.
Bitcoin has been range-bound near $72,000 on April 10, with institutional positioning reflecting deep uncertainty about the next major move. Investors are not choosing a direction; they are hedging both sides simultaneously.
According to CoinDesk, institutions are buying call options targeting $80,000 while simultaneously purchasing puts for downside protection. That dual positioning reflects hesitation rather than conviction, with neither bulls nor bears willing to fully commit ahead of this weekend’s geopolitical and economic catalysts.
Trump said he was “in deep negotiations” with Tehran heading into the Islamabad talks, and the gap between a deal and a breakdown has left institutional traders unwilling to pick a side. Bitcoin has traded in a range of roughly $65,000 to $73,000 since the Iran war began.
CPI and Iran Talks Are the Two Key Catalysts
Friday’s US inflation report came in softer than expected on core measures, with core CPI rising just 0.2% against a 0.3% forecast. The print eased some short-term rate fears but did not provide enough clarity to break Bitcoin out of its established range.
The more consequential event may be the Islamabad talks. As crypto.news reported, a fragile two-week ceasefire was agreed last Wednesday, but investor caution has persisted as the Strait of Hormuz remains only partially reopened and Iran has proposed a $1 per barrel crypto toll on tanker passage.
What a Resolution Could Mean for Price
As crypto.news noted, a confirmed agreement could open the door for a move toward the $75,000 region, as easing tensions would support risk appetite across financial markets. Failure to reach a deal could shift sentiment in the opposite direction, with Bitcoin retesting lower support levels and altcoins bearing the heavier losses.

No Suspect, New Ransom Notes Surface as Guthrie’s Mother Enters 70th Day

Here’s why Zcash price rallied over 20% today

Celtics sink record-tying 29 treys, rip Pelicans to seal No. 2 in East


-

 Business5 days ago
Three Gulf funds agree to back Paramount’s $81 billion takeover of Warner, WSJ reports
-

 Sports6 days ago
India men’s 4x400m and mixed 4x100m relay teams register big progress | Other Sports News
-

 Politics9 hours ago
US brings back mandatory military draft registration
-

 Fashion9 hours ago
Weekend Open Thread: Veronica Beard
-

 Business7 days ago
Expert Picks for Every Need
-

 Tech3 days ago
How Long Can You Drive With Expired Registration? What Florida Law Says
-

 Business6 days ago
No Jackpot Winner, Prize to Climb to $231 Million
-

 Fashion5 days ago
Massimo Dutti Offers Inspiration for Your Summer Mood Board
-
 Sports10 hours ago
Man United discover Nico Schlotterbeck transfer fee as defender reaches Dortmund agreement
-

 Fashion3 days ago
Let’s Discuss: DEI in 2026
-

 Crypto World3 days ago
Bitcoin recovers as US and Iran Agree a Ceasefire Deal
-

 Business6 hours ago
Tesla Model Y Tops China Auto Sales in March 2026 With 39,827 Registrations, Beating Cheaper EVs and Gas Cars
-

 Crypto World2 days ago
Canary Capital Files SEC Registration for PEPE ETF
-

 Business6 days ago
Akebia Therapeutics, Inc. (AKBA) Discusses Pipeline Progress and Strategic Focus on Kidney Disease Treatments at R&D Day – Slideshow
-

 Business15 hours ago
OpenAI Halts Stargate UK Data Centre Project Over Energy Costs and Copyright Row
-

 Tech5 days ago
Haier is betting big that your next TV purchase will be one of these
-

 Politics7 days ago
The UK should not pay a penny in slavery reparations
-

 Tech5 days ago
The Xiaomi 17 Ultra has some impressive add-ons that make snapping photos really fun
-

 Tech5 days ago
Samsung just gave up on its own Messages app
-

 Tech5 days ago
Gamer Restores the Original PlayStation Portal From Two Decades Ago
You must be logged in to post a comment Login