
Crypto World
US margin debt reached all-time highs as crypto lost $2 trillion
The highest level of margin utilization by US traders in history has, unfortunately, led to historic underperformance in crypto prices as speculators re-learned timeless wisdom: leverage works both ways.
After spending 2025 through January 2026 building their largest leveraged positions in history, bets on digital assets have unraveled with unnerving speed.
In January 2026, US margin debt had surged to a record $1.28 trillion — its ninth consecutive monthly increase and a 50% rise from April 2025. That financial leverage added bids to crypto assets which made new all-time highs in May, July, August, and October 2025.
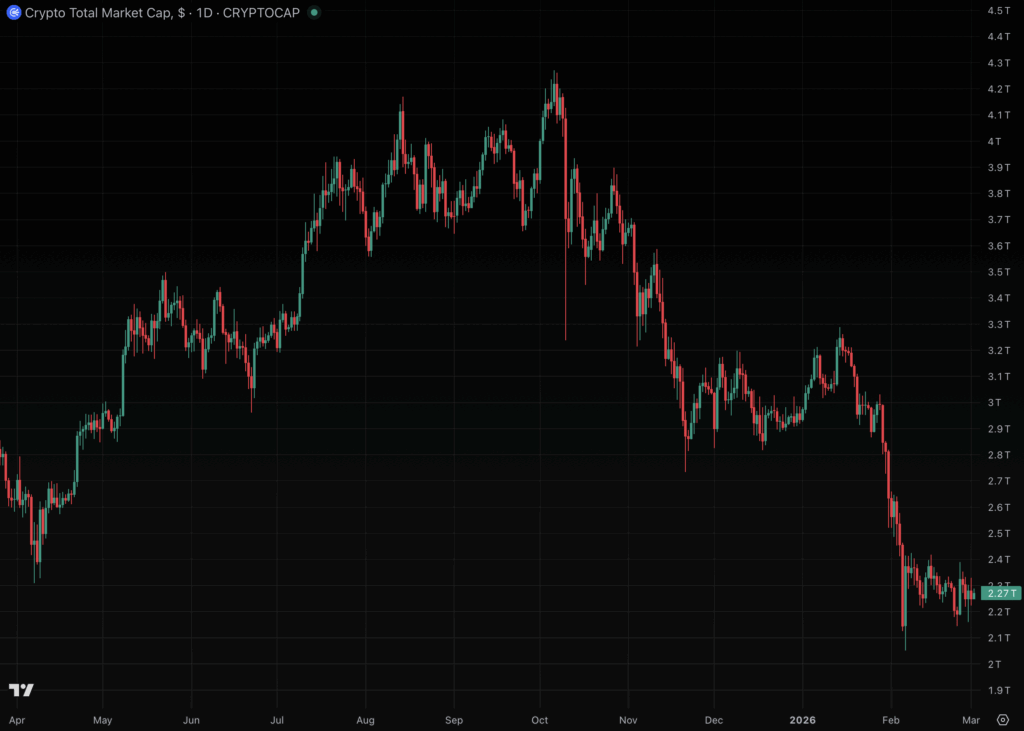
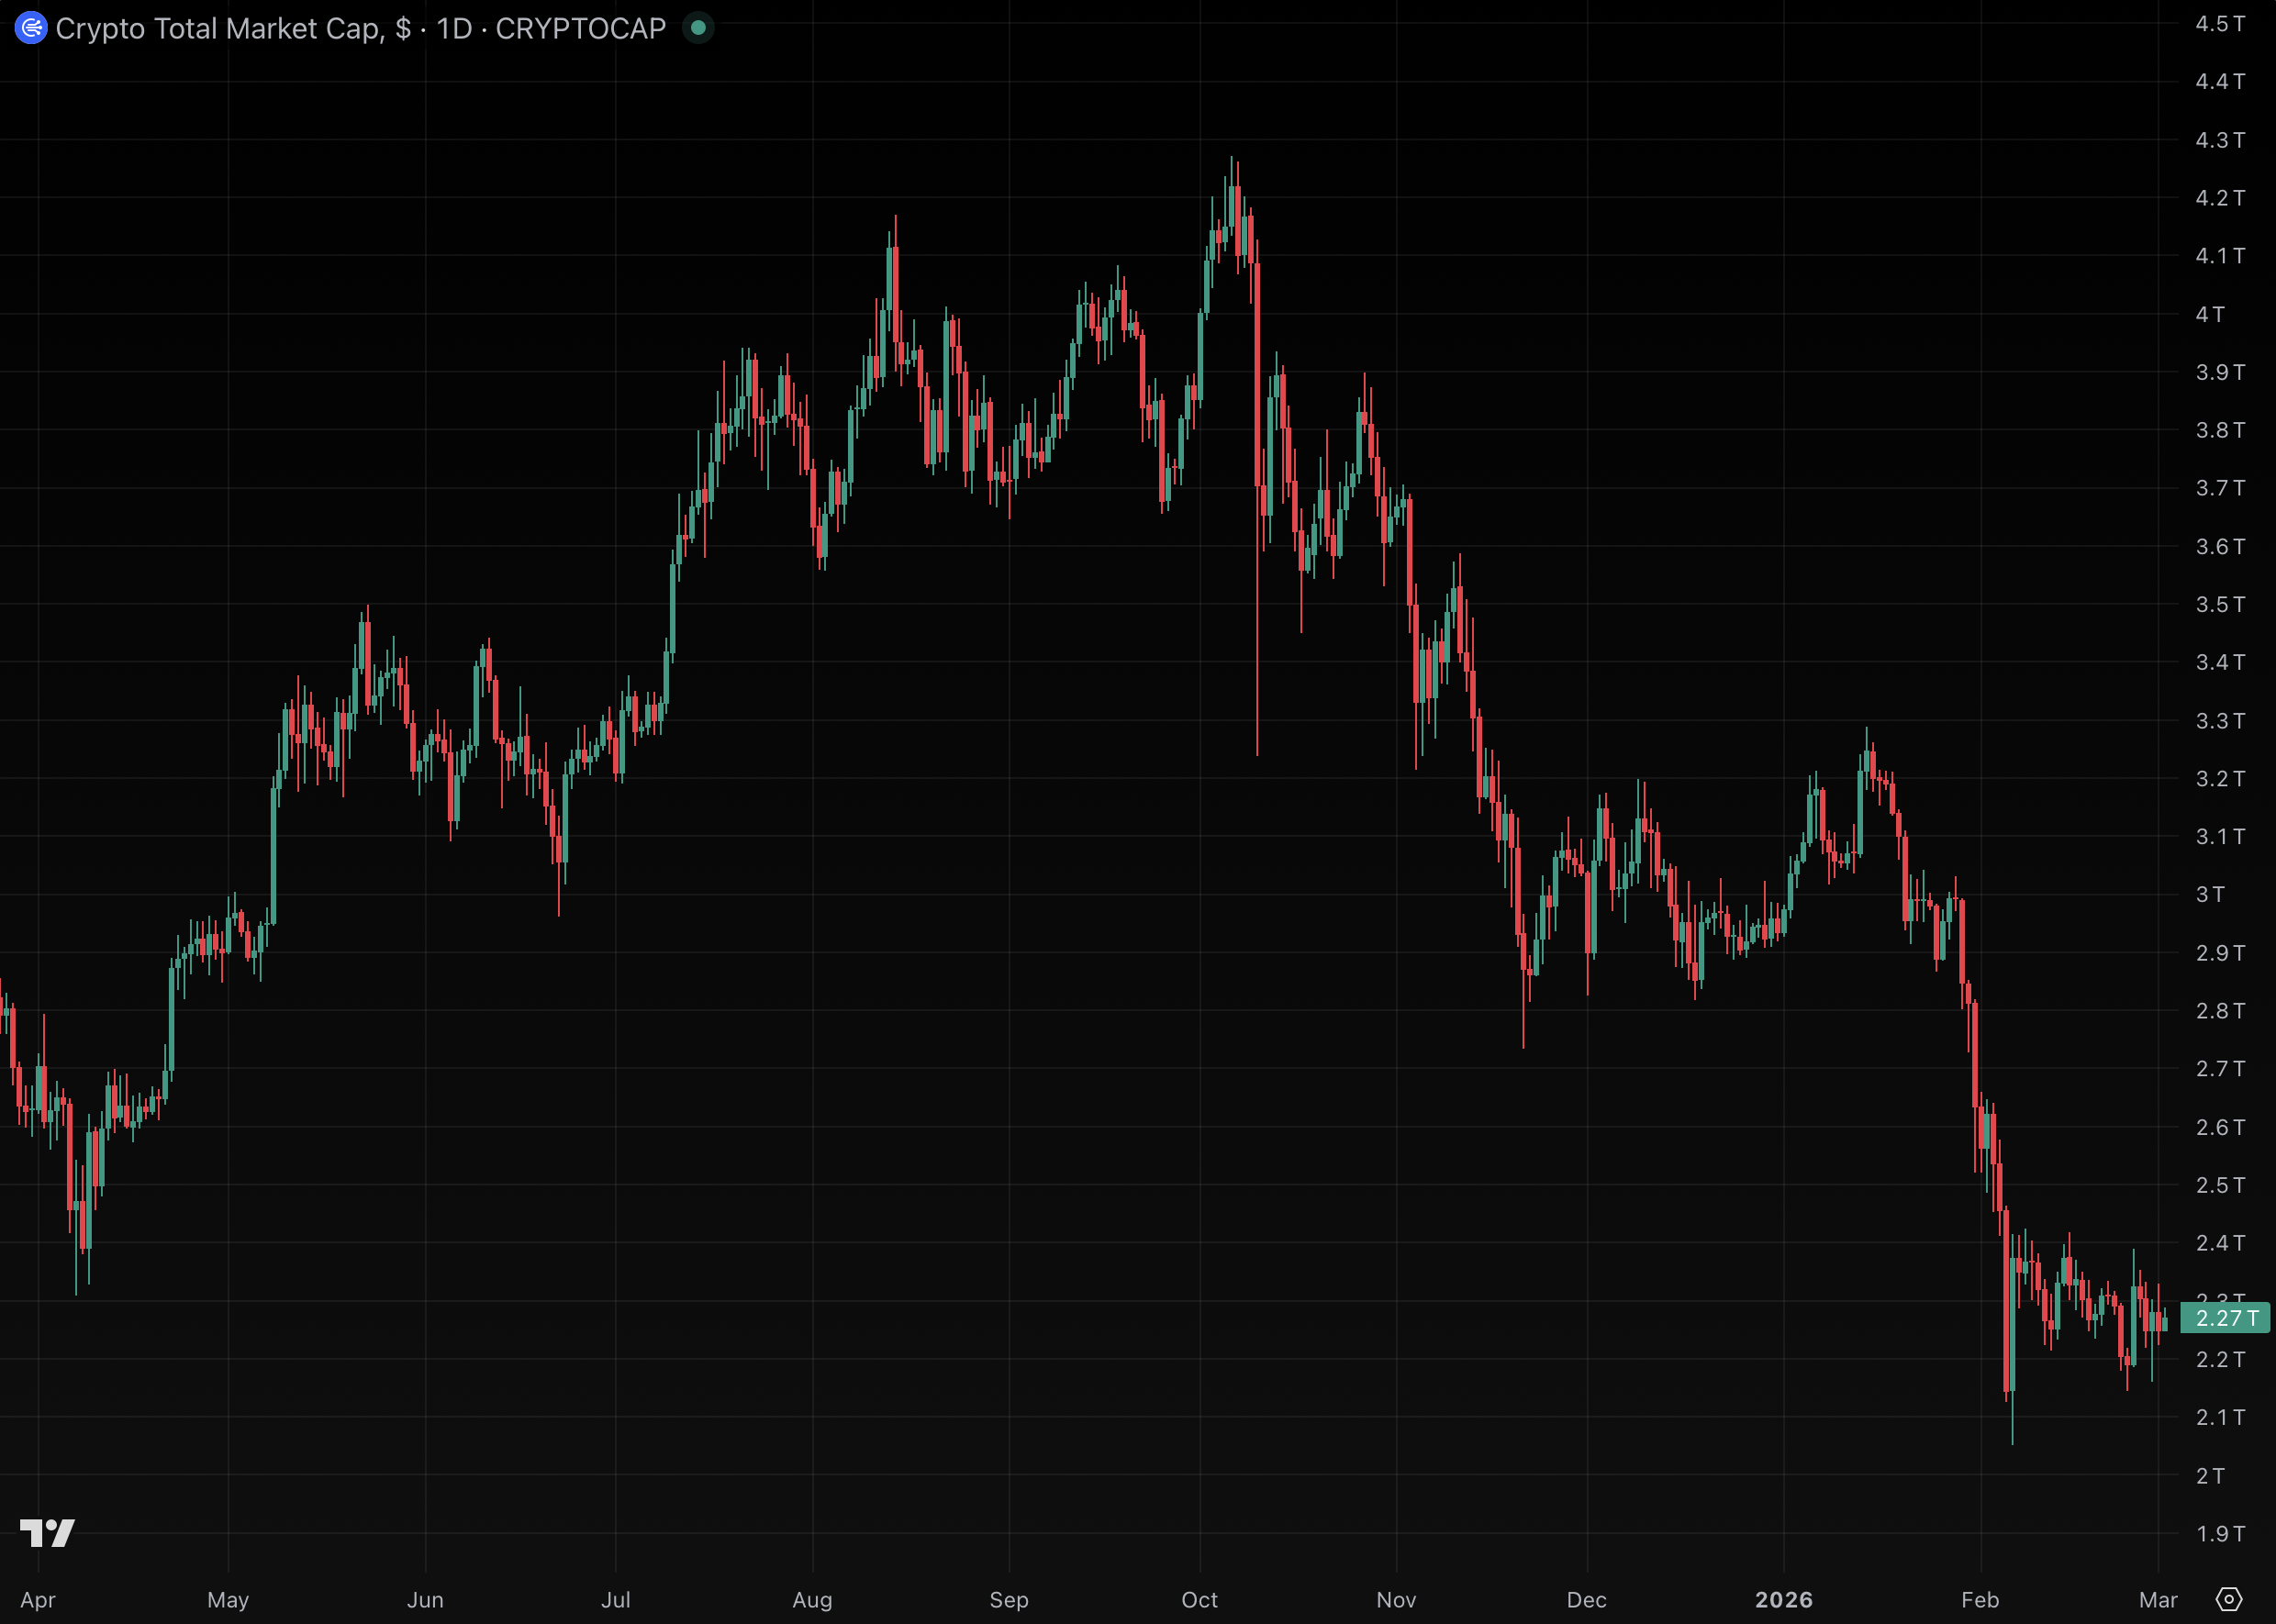
Then, despite investors continuing to pile on more margin debt than ever, prices collapsed 47% and shed $2 trillion in combined market capitalization as a sector rotation to AI and precious metals ensued.
Crypto losses since October are staggering.
US margin debt increased $53 billion from December to January alone. Worse, the ratio of margin to real disposable personal income exceeded 6.0% in January for the first time on record.
That ratio measures more financial leverage in January 2026 relative to income than the dot-com mania.
Leverage-fueled demand flows into crypto instruments like bitcoin (BTC) futures, spot and leveraged ETFs, call options, and publicly traded crypto companies. Although more leverage can amplify gains, it also amplifies crashes.
Although traditional margin statistics are an incomplete measure of total systemic risk on crypto, which has vast quantities of opaque exchanges and trade data APIs controlled by offshore entities with little to no regulatory oversight, it can nonetheless inform some analysis about the causes of crypto volatility.
A supernova of crypto leverage that wiped out $2 trillion
Some crypto derivatives traders spent mid-2025 building their largest leveraged positions in history, then watched all of their paper gains evaporate.
Aggregate crypto futures open interest peaked above $220 billion on October 6, 2025. Within a week, the industry began to crash and never looked back.
October 10 produced more than $19 billion in total liquidations across exchanges, according to CoinGlass data — the single largest day of forced closures in crypto history.
Many saw Binance as a convenient scapegoat.
Read more: Crypto traders consider lawsuits after $600B market meltdown
Record-setting volatility continued amid record-setting margin levels. On February 5, 2026, another flash-crash drove BTC from $73,000 to $62,000 and wiped out 10-figure position values within a single day.
Worst day of realized losses from BTC liquidations
Glassnode estimated that February 5’s crash produced $3.2 billion in realized losses from liquidated BTC trades — the largest single-day realized loss in Glassnode’s recorded history that surpassed even October 10, 2025, the FTX bankruptcy in November 2022, or the May 2022 collapse of Terra/Luna.
By late February, crypto’s margin trading hangover had set in.
CoinGlass’ Crypto Fear & Greed Index fell to five out of 100 — a never-before-seen rating that exceeded its Three Arrows Capital bankruptcy low of six in June 2022, and its COVID-19 low of seven in March 2020.
As of writing, the index still remains near historic lows at nine, or “extreme fear.”
Losses amid record margin levels have also drawn out spot BTC from US ETFs. Specifically, spot BTC ETFs lost $4.5 billion in net outflows through the first eight weeks of 2026, according to Investing.com.
The leveraged unwind of Strategy
Adding insult to injury, software company-turned-leveraged BTC acquirer Strategy became the most-shorted large cap stock in the US last month, according to data from FactSet cited by multiple outlets.
The company held 717,722 BTC over this weekend, purchased at an average cost near $76,020 per coin. With BTC trading in the mid-$60,000s, the company faces unrealized losses in the billions.
Margined short-sales against Strategy and its BTC, in this case, have actually stood out as a rare success story amid crypto’s margin mania of January 2026.
Leverage always works both ways. Although US margin debt at $1.28 trillion is an incredible headline, the real story is that leverage has seeped into every layer of crypto valuations — from listed securities in brokerage accounts to perpetual swap venues in tax havens.
With losses liquidating collateral and forcing cascading sales, each layer’s losses have been feeding the next since October.
Got a tip? Send us an email securely via Protos Leaks. For more informed news, follow us on X, Bluesky, and Google News, or subscribe to our YouTube channel.

Bitcoin (BTC) starts a new week facing fresh macro risks as gold plummets and traders wait for $50,000.
-
BTC price action ends the week below a key trend line, and traders see little more than an early-week bounce for bulls.
-
Price looks more and more like it is repeating January’s bear flag — and targets now call for new multiyear lows.
-
Gold enters a technical bear market and oil returns to $100 as Iran tensions continue.
-
Traders start to consider Fed rate hikes in 2026, but history could still offer risk assets some relief.
-
Bitcoin’s long-term holders have been selling at a loss throughout March.
Bitcoin weekly close loses 200-week trend line
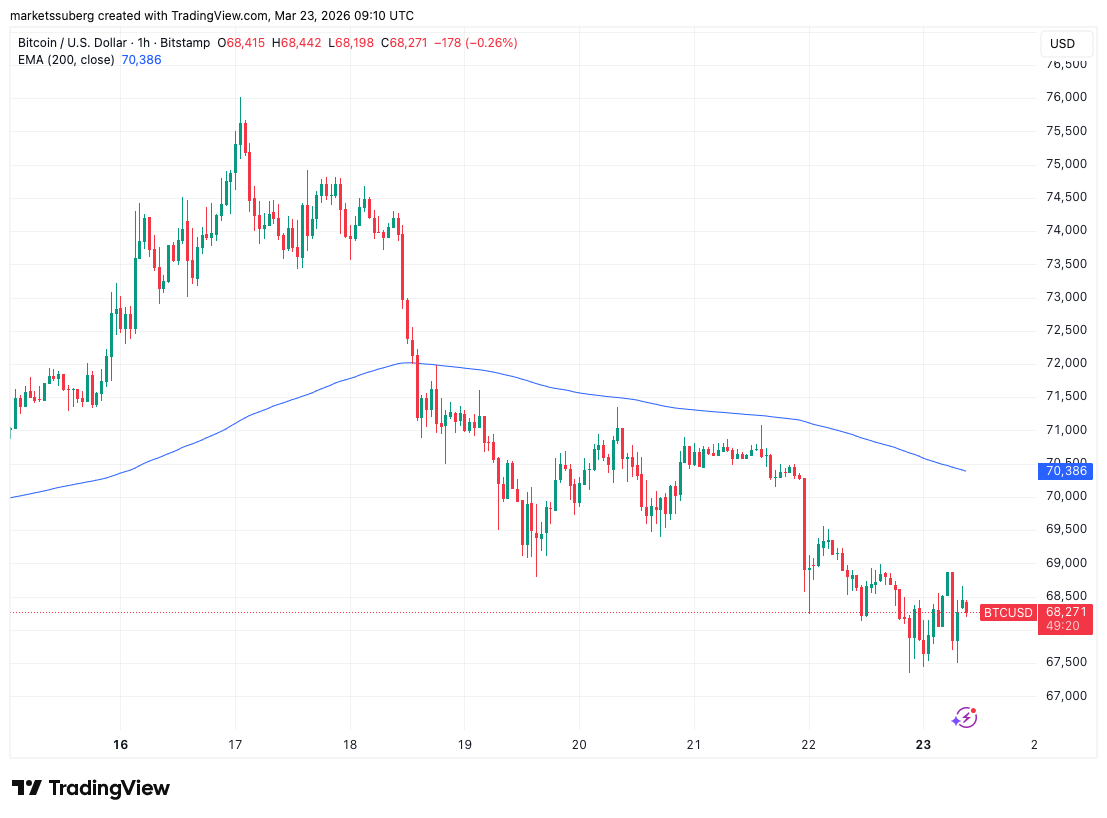
After a rough weekend, Bitcoin struggled to reclaim support as TradFi traders returned to start the week.
Data from TradingView shows price dipping to near $67,400 into the weekly close, which lost control of the key 200-week exponential moving average (EMA) trend line.
Analysis previously saw a close above the 200-week EMA, currently at $68,300, as key to protecting bulls going forward.

In his latest X analysis on BTC price action released on Sunday, trader CrypNuevo forecast that the market would continue to hinge on geopolitics.
“It feels like we’ll be stuck in this range for the next month too,” he summarized.
“We could see some conflict escalation (uncertainty) next week that could trigger a new visit to the range lows where an interesting 4h long wick still sits there.”

CrypNuevo referred to Bitcoin’s sub-$60,000 swing low seen in early February.
“In LTF, I’ll be favoring a potential price rotation to $65k next week,” he continued about low time frames.
“I’d like to position for this around $70k if we see a short-lived push to the upside at the start of the week. But with caution, because acceptance above $71k would invalidate it and I’d long to $73k-$74k.”

Liquidations stayed high into Monday, with over $400 million erased over 24 hours, per data from CoinGlass.
With liquidity stacked above price, trader Castillo Trading eyed a potential short squeeze to take it.
Still think the R/R to the upside from here on $BTC Just makes sense. Maybe a little lower below $67,200 but still seems like it’s worth the punt.#Bitcoin pic.twitter.com/5209rwtdlp
— Castillo Trading (@CastilloTrading) March 23, 2026
Commenting on the latest price moves, meanwhile, onchain analytics platform CryptoQuant hinted that the weekend’s downside volatility was nothing out of the ordinary.
“During weekends, institutional participation declines significantly, and spot-driven demand—especially from ETF flows—effectively pauses. As a result, the market becomes more dependent on derivatives positioning and short-term liquidity conditions,” contributor XWIN Research Japan wrote in a “QuickTake” blog post.
“Lower liquidity also amplifies price sensitivity. With thinner order books, relatively small sell orders can trigger larger price movements, often leading to cascading effects such as stop-loss activation or liquidation events.”

XWIN stressed that weekend price action “should not be interpreted as a signal of trend continuation or reversal.”
Traders eye January bear flag breakdown repeat
For Bitcoin bulls, history risks repeating itself already this week — and just like before, bears appear to be in the driving seat.
Concerns revolve around another bear flag pattern currently playing out on the daily chart.
Here, a macro downtrend is punctuated by a period of relief, giving some the impression that the trend has reversed. Price then drops through the bottom of the flag and the downtrend continues to new lows.
As Cointelegraph reported, traders have long warned about a second bear flag and its consequences after the first completed in January.
$BTC is compressing inside a rising wedge.
Price is coiling between $66K support and $76K resistance, a breakout from this range decides the next major move. pic.twitter.com/NZG3lrJ9qw
— Gerla (@CryptoGerla) March 20, 2026
“It looks almost exactly the same. Bear Flag Breakdown & Retest with low volume on the upward move,” trader Roman told X followers last week after BTC/USD hit six-week highs of $76,000.
After the weekend, trader Jelle went further, suggesting that price had already broken support.
“Not a great way to start the week if you’re a bull. Consolidate here for a day or two and those untapped lows look ripe for the taking,” he warned.

On Saturday, Keith Alan, cofounder of trading resource Material Indicators, suggested that the bear-flag breakdown target could be below $50,000.
That’s consistent with the target a measured move down from this bear flag would deliver. pic.twitter.com/oWI7NvbeZ5
— Material Indicators (@MI_Algos) March 21, 2026
Gold hits bear market on Iran oil woes
The worsening global energy crisis focused on the Middle East is already taking a fresh toll on risk assets and safe havens this week.
Asian stock markets tumbled during their first session, while gold and silver also came under heavy selling pressure. Bitcoin joined them, hitting two-week lows into Sunday’s weekly close.
Commenting, trading resource The Kobeissi Letter even suggested that the downside in gold could have claimed a large-volume market participant.
“The sporadic moves in price could signal that a potential large player in the space is being liquidated,” it told X followers.
Kobeissi added that rising US 10-year treasury note yields were “beginning to weigh on various asset classes.”
“Combine this with headline fatigue and ‘pockets’ of illiquidity in the market, and the massive gaps to both directions are only growing,” it added.
“Something big is happening metals markets right now.”

Now down over 20% since its all-time high, XAU/USD officially entered bear-market territory, hitting local lows of $4,099 per ounce — a level not seen since November 2025.
Oil, meanwhile, increasingly sought to stay above the $100 mark as uncertainty over flows through the Strait of Hormuz continued.
In the latest edition of its regular newsletter, “The Market Mosaic,” trading resource Mosaic Asset Company stressed the potential impact on future US inflation readings.
“Oil prices are directly correlated to headline inflation, where a $10 increase per barrel can push inflation higher by 0.20% or more. And even before the outbreak of conflict in the Middle East, there are growing signs that inflation is already inflecting higher,” it noted.

Risk-asset hope remains despite hawkish Fed
This week has little by way of key inflation reports, with jobless claims and S&P Flash Purchasing Managers Index (PMI) data taking center stage.
Crypto has shown sensitivity to PMI releases in recent months, with US manufacturing finally on the up after several years of retraction.
At the same time, headwinds from the Iran war are mounting, as shown by the hawkish tone from the US Federal Reserve at last week’s meeting.
After leaving interest rates unchanged, Chair Jerome Powell said that any loosening of policy would now depend on “progress” being made on inflation.
“As a result, the market is quickly repricing the outlook for rate cuts,” Mosaic Asset Company commented.
“While market-implied odds don’t point to another rate cut for over a year, another key indicator is suggesting that rate hikes could be in store.”

The conservative stance came despite weakening US labor-market conditions — traditionally cause to reassess restrictive policy measures.
A silver lining, however, could lie in store for risk assets in the form of historical patterns repeating. As Cointelegraph reported, crypto’s positive stocks correlation has recently grown.
“Conditions across breadth and sentiment are evolving to support a rally in the S&P 500. At the same time, historic precedent for market movements around major geopolitical events also hint that a rebound could be in store for the stock market,” Mosaic continued.
Kobeissi had similar ideas, reporting “skyrocketing” trading activity across stocks and last week’s giant options expiry event freeing up capital.
“Friday’s volume was also amplified by ~$5.7 trillion in options tied to US stocks, indexes, and ETFs expiring in the largest March triple-witching in at least 30 years,” it wrote on X.
“The massive volume of expired options has released billions in capital, which could drive significant market swings this week. Brace for more market volatility.”

Bitcoin old hands sell at a loss
Bitcoin long-term holders (LTHs) are feeling the pressure at current levels — even without a rematch with range lows.
Related: Bitcoin RSI signals potential bottom as analysts flag key setup
CryptoQuant research reveals “capitulation” signals from the Spent Output Profit Ratio (SOPR) metric, which measures whether coins moving onchain are doing so at a higher or lower price than during their previous transaction.
SOPR readings below 1 mean that the observed supply — in this case that owned by LTHs — is on aggregate moving at a loss.
“On March 11, the Bitcoin Long-Term Holder SOPR dropped to 0.64, meaning long-term holders were selling their coins at a 36% loss relative to their cost basis. This is one of the most extreme LTH capitulation readings in recent months,” contributor The Enigma Trader commented.
“A value this far below 1.0 indicates that even patient, conviction holders were being shaken out, a sign of genuine fear in the market.”

The 30-day moving average of LTH-SOPR is still below 1 — even as large tranches of BTC leave exchanges in a potential emerging accumulation trend.
“One possible interpretation: while long-term holders were capitulating between March 10–20, a separate cohort was quietly absorbing supply and moving coins off exchanges,” it continued.
“Distribution and accumulation happening simultaneously, a classic phase transition setup.”
This article does not contain investment advice or recommendations. Every investment and trading move involves risk, and readers should conduct their own research when making a decision. While we strive to provide accurate and timely information, Cointelegraph does not guarantee the accuracy, completeness, or reliability of any information in this article. This article may contain forward-looking statements that are subject to risks and uncertainties. Cointelegraph will not be liable for any loss or damage arising from your reliance on this information.

Tellor (TRB crypto) is set to upgrade its Palmito testnet to version 6.1.4 on Monday, March 23, 2026, at approximately 11:30 AM EST. The update introduces TokenBridge V2, a major architectural overhaul designed to harden cross-chain data transmission and improve upgrade resilience. This release follows a rapid sequence of four testnet iterations since January, underscoring the team’s focus on securing decentralized oracle infrastructure.
The upgrade represents a critical checkpoint for the protocol. It moves the network closer to a mainnet implementation that can handle bridging events without disruptive token changes. The focus here is continuity.
- Upgrade Date: The Palmito testnet upgrade v6.1.4 executes on March 23 at 11:30 AM EST (16:30 UTC).
- What’s New: TokenBridge V2 introduces isolated bridge activity and improved pause mechanics for safer cross-chain operations.
- Development Pace: This marks the fourth major testnet release in Q1 2026, signaling high development velocity for the oracle provider.
The Mechanics of Tellor Crypto TokenBridge V2 Explained
Tellor’s v6.1.4 upgrade hits at block height 18783000 on the Palmito chain. The headline change is the transition from the legacy bridge to TokenBridge V2.
The separation matters. New bridge activity runs independently from older contract interactions, which means Tellor can isolate risks and push future upgrades without freezing the entire network.
— Tellor (@WeAreTellor) March 20, 2026
 We will be upgrading Tellor Palmito Testnet on Monday, March 23rd at approximately 11:30am EST!
Read more:https://t.co/uTKlp95Cgk pic.twitter.com/nlP6RFgsmD
The migration itself is handled automatically. Tellor Layer executes a single synthetic withdrawal to move locked TRB from V1 to V2. Because the legacy bridge caps withdrawals at 5%, the migration happens gradually. Users on the testnet do not need to touch anything.
TokenBridge V2 also introduces stronger pause mechanics, letting the protocol freeze bridge operations fast if a security threat emerges. The one thing users need to do is stop TRB deposits 12 hours before the upgrade. Withdrawals submitted before that window process normally once it completes.
Four testnet upgrades in under 3 months. Most protocols separate these phases by quarters. Tellor is doing it in weeks.
The pace signals something. This is not routine maintenance. The team is stress-testing infrastructure aggressively, hardening the oracle stack to compete in a sector where reliability is everything. A robust bridge is not optional for a protocol trying to be a trusted data source across multiple chains.
If Palmito holds, mainnet TokenBridge V2 is the next move.
Discover: The best new crypto in the world
The post Tellor Upgrades Palmito Testnet to v6.1.4 With TokenBridge V2 Launch appeared first on Cryptonews.


Crypto investment products posted another week of net inflows, but the pace slowed as markets reacted to the latest US Federal Reserve meeting.
Summary
- Crypto ETPs extended their inflow streak to four weeks, though momentum dropped sharply after FOMC.
- Bitcoin funds added $219.2 million, while Ether products saw $27.5 million in weekly outflows.
- US spot Bitcoin ETFs stayed positive, but spot Ether ETFs recorded fresh weekly outflows.
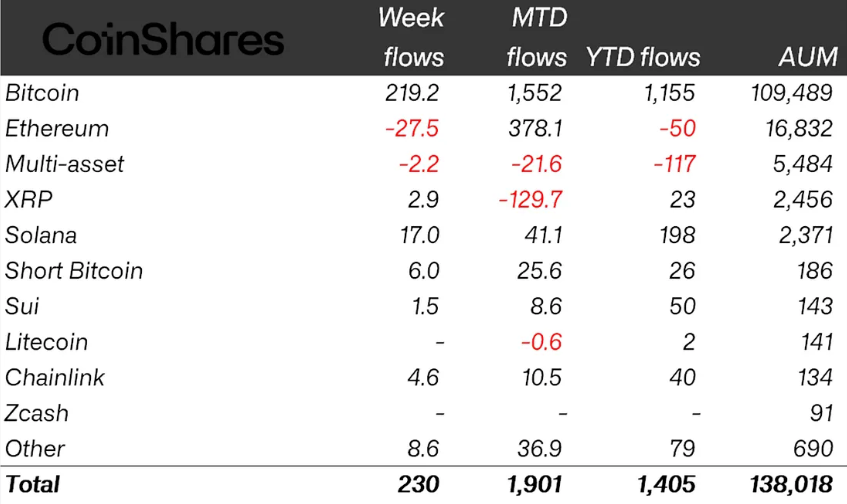
Data from CoinShares showed that digital asset exchange-traded products brought in $230 million last week, extending the positive run to four straight weeks.
CoinShares reported that crypto ETPs recorded $230 million in net inflows during the week. That figure was well below the $1.06 billion posted a week earlier, showing that investor demand cooled as the week progressed.
James Butterfill, head of research at CoinShares, linked the slowdown to a “hawkish pause” reading of the Federal Open Market Committee meeting. He said the weekly pattern supported that view, as products saw solid inflows early in the week before flows turned lower after the Fed decision.
Bitcoin (BTC) investment products drew the largest share of last week’s inflows. CoinShares data showed that Bitcoin funds added $219.2 million, accounting for nearly all of the week’s net gains across the digital asset product market.
Ether products moved in the opposite direction. They posted $27.5 million in outflows, ending a three-week inflow streak. The reversal came as investors reduced exposure after the Fed meeting and a broader change in risk appetite.
In addition, Solana continued to stand out among altcoin-focused products. Solana ETPs brought in $17 million last week, marking the seventh straight week of inflows. That pushed the total for the streak to $136 million.
Other digital assets also posted gains. Chainlink products recorded $4.6 million in inflows, while Hyperliquid products added $4.5 million. These numbers showed that interest in selected altcoins remained in place even as broader market momentum slowed.
US spot Bitcoin ETFs stay positive for the week
US spot Bitcoin ETFs contributed a large share of Bitcoin-related inflows. SoSoValue data showed that these funds brought in $95.2 million last week, helping extend their winning run to four consecutive weeks.
The four-week stretch lifted total gains for US spot Bitcoin ETFs to $2.2 billion over that period. Even so, the funds still showed about $400 million in net outflows for the year. US spot Ether ETFs also lost momentum, recording about $60 million in weekly outflows and $599 million in outflows year to date.
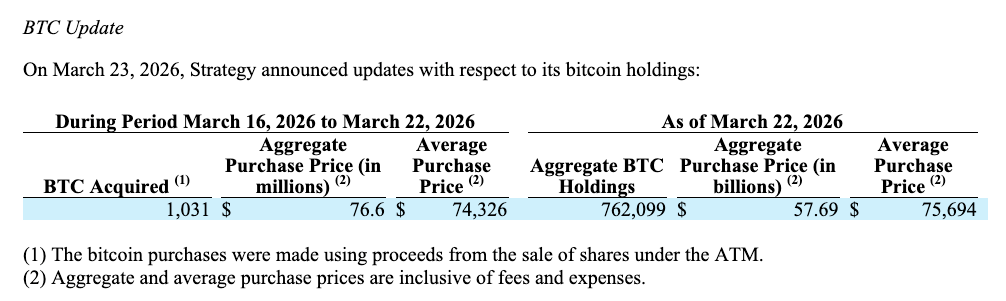
Michael Saylor’s Strategy, the world’s largest public holder of Bitcoin (BTC), bought another 1,031 Bitcoin last week in a much smaller purchase than its previous two weekly buys, funding the acquisition with sales of Class A common stock.
Strategy acquired 1,031 Bitcoin for $76.6 million last week, according to an 8-K filing with the US Securities and Exchange Commission on Monday.
The purchases were made at an average price of $74,326 per coin, below the company’s overall average acquisition price of $75,694. Bitcoin averaged around $70,871 for the week of March 16-22, based on daily closing prices.
The new acquisitions bring Strategy’s holdings to 762,099 BTC, acquired for a total cost of roughly $57.69 billion, the company said.

Common stock funded the latest buy
Strategy’s relatively modest purchase follows larger Bitcoin acquisitions recently, including a 22,337 BTC buy reported last Monday and a 17,994 BTC buy a week earlier.
The 22,337 BTC ($1.6 billion) purchase ranks among Strategy’s largest on record and was largely funded through sales of its perpetual preferred equity, Stretch (STRC). The stock generated approximately $1.2 billion, accounting for about 75% of the total purchase.
Related: Strategy records biggest STRC issuance day with estimated 1,420 BTC buy
Unlike the prior week’s funding mix, the latest purchase appears to have been funded through sales of Strategy’s Class A common stock rather than preferred equity.

Strategy has bought 41,362 Bitcoin for around $2.93 billion in March. With Bitcoin trading at $70,430 at the time of writing, the company is down around 7% on its BTC holdings, now worth around $54 billion, according to data from CoinGecko.
Related: Strategy halts Bitcoin buying via STRC: Will BTC price dip again?
Strategy’s holdings are roughly 3% below the Bitcoin holdings of BlackRock’s iShares Bitcoin Trust ETF (IBIT), which held about 785,300 BTC on behalf of its clients after the close of trading on Friday.
US spot Bitcoin ETFs collectively held nearly 1.3 million BTC as of March 20, representing roughly 6.1% of the 21 million maximum Bitcoin supply, according to data from WalletPilot.
Magazine: Metaplanet’s Japan Bitcoin bet, Bithumb ordered suspension: Asia Express
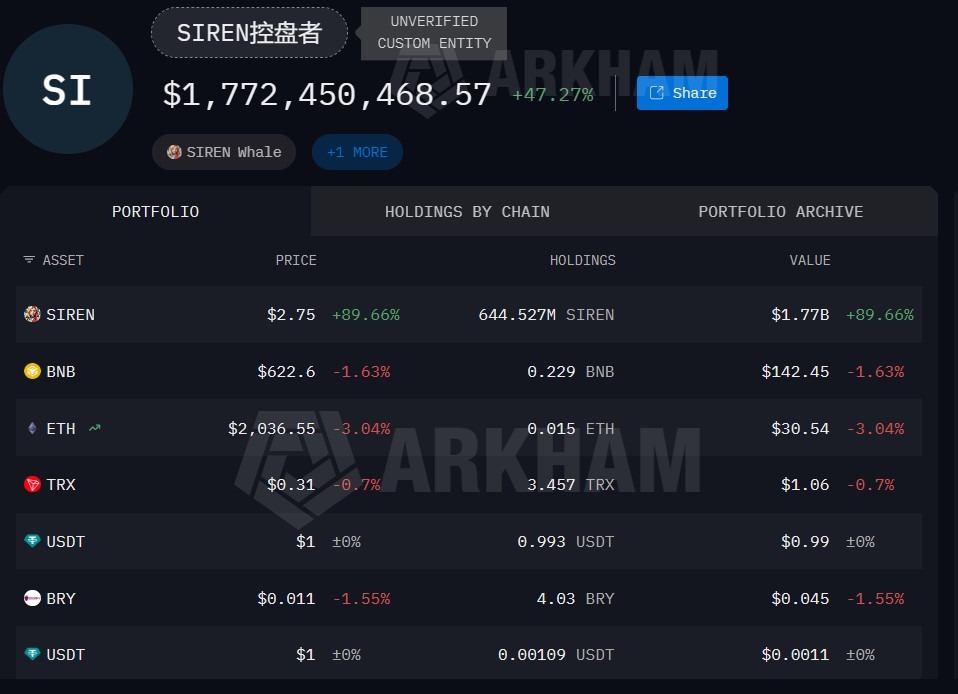
Arkham data shows a wallet cluster holding 644 million SIREN, about 88% of the 728 million circulating supply, raising manipulation concerns.
Crypto token Siren surged 340% in the last week, amid claims that a large portion of the circulating supply may be concentrated among a small group of wallets.
Siren markets itself as the “first AI analyst agent deployed on BNB Chain.” At the time of writing, CoinGecko data shows SIREN trading at $2.81, up over 340% from $0.63 on March 16. In the past month, the token exploded by nearly 1,300% from $0.22. The rally drew scrutiny after analysts said a large share of the token’s supply may be concentrated in a small group of wallets, a dynamic that could amplify volatility if confirmed.
Citing an unverified custom entity created by Arkham Intelligence, onchain analyst EmberCN said the party cornered nearly all spot supply to profit off contracts. He said this was the secret behind the token’s surge in the past month.
According to the Arkham Intelligence page, the entity holds 644 million SIREN (worth around $1.8 billion). The amount accounts for 88% of the entire circulating supply of 728 million tokens.

Crypto analysts point to wallet clustering
On X, pseudonymous crypto analyst Mlmabc warned his followers on Sunday to be careful trading the token, adding that “supply is heavily cornered.” Mlmabc said a cluster of wallets is currently sitting on $950 million in unrealized profit, implying that it could dump the tokens on potential buyers.
Citing his own Dune Analytics dashboard, Bitcoin Strategy analyst Gerhard Kuschnik said most of the Siren token trading activity over the last month, when SIREN surged, was not from new users. Kuschnik said these were trading activities by existing holders, arguing that the token is not gaining new interest.
Related: ‘Hawk Tuah’ girl Haliey Welch says memecoin implosion ‘traumatized’ her
“The vast majority of trading happens by returning users,” adding that the average new user that bought into the token during its surge averaged between 100 and 200.

Magazine: Sex robots, agent contracts a hitman, artificial vaginas: AI Eye goes wild

Key takeaways
-
This $3.4 million scam shows how modern crypto fraud increasingly relies on social engineering rather than technical exploits.
-
Scammers used a gradual grooming process, engaging victims in friendly conversations over time to build emotional trust before introducing any financial discussion. It closely resembled the pig-butchering model.
-
The investment pitch combined Ether’s growth potential with the perceived stability of gold. This created a compelling but fraudulent narrative that convinced victims they were gaining access to an exclusive, low-risk opportunity.
-
Victims were told to buy Ether themselves on legitimate platforms and transfer it to provided wallets. This gave them a false sense of control and legitimacy.
This scam did not begin with a phishing link or hacked wallet. It started with a simple message: “Sorry, wrong number.”
According to US prosecutors, the interaction evolved into a social engineering scheme that defrauded victims of millions and led to the seizure of $3.4 million in USDt (USDT).
From innocent messages to multimillion-dollar fraud
Federal prosecutors in Boston have initiated a civil forfeiture proceeding to recover approximately $3.44 million in USDt linked to a suspected online investment fraud.
According to authorities, the funds were seized in early 2025 as part of an investigation launched in late 2024 after complaints from victims in multiple US states who reported significant financial losses.

The operation did not involve sophisticated technical exploits. Instead, it relied on a well-known yet remarkably effective tactic: social engineering. Fraudsters used ordinary, everyday interactions to deceive unsuspecting victims.
Victims received texts or chat messages that appeared to have been sent by mistake. Fraudsters used apps like WhatsApp and Telegram to send these messages.
On the surface, the communication appeared completely ordinary. There was no pressure, no immediate request and no clear warning signs.
This lack of an obvious threat is one reason the method can be so effective.
Unlike crypto scams that trigger immediate suspicion, the “wrong number” approach:
-
Appears natural and socially appropriate
-
Encourages polite replies
-
Creates an opportunity for ongoing dialogue
In this case, as in similar ones, what begins as an apparent mistake soon evolves into an opening for further contact.
The grooming stage: Gradually establishing trust
Following the initial exchange, scammers avoid rushing the process. They cultivate trust gradually through friendly conversations, the sharing of seemingly personal information and the maintenance of a consistent, reliable persona.
Rather than introducing financial topics too early, the scammers:
-
Create a sense of emotional ease
-
Make regular communication feel normal
-
Foster the appearance of a genuine personal connection
This strategy aligns with a broader category of fraud commonly known as pig-butchering, in which victims are methodically “groomed” before being targeted for financial gain.
By the time money becomes part of the discussion, victims often believe they are interacting with someone familiar rather than an unknown fraudster.
Did you know? The “wrong number” scam technique evolved from earlier email scams in which fraudsters pretended to contact the wrong person. Messaging apps have made this tactic more effective by enabling real-time, casual conversations that feel more authentic.
The pitch: A fake Ether investment tied to gold
After building initial trust, scammers subtly shifted the discussion toward lucrative investment opportunities. Victims were presented with what appeared to be a privileged Ether (ETH) investment opportunity, supposedly tied to tangible gold holdings.
This pairing appears to have been deliberate.
It merged:
Together, these elements created an attractive narrative: the promise of substantial returns while minimizing perceived risk.
Victims were told they were being given access to a rare, exclusive opportunity that was not available to the general public.
The transaction method: Why victims purchased Ether
Instead of requesting direct transfers, the fraudsters instructed victims to:
-
Buy Ether through established, legitimate exchanges
-
Send the purchased Ether to designated wallet addresses
This approach had a significant psychological impact.
Victims felt reassured because they:
-
Conducted transactions on genuine, well-known platforms
-
Personally handled and authorized the purchase
-
Could observe and verify the funds in their own wallets before the transfer
As a result, the process never felt like directly giving money to fraudsters. Instead, it appeared to be genuine participation in a legitimate investment opportunity.
Did you know? In many fraud cases, scammers appear to operate in organized groups using scripted playbooks. Some teams specialize only in the “conversation phase,” while others handle crypto transactions, showing how modern fraud has become structured like a business operation.
What occurred after the Ether transfer
After victims sent their Ether to fraudsters:
-
The funds were routed through various intermediary wallet addresses
-
They were then converted into USDt, a stablecoin pegged to the US dollar
-
Finally, the stablecoins were transferred to unhosted wallets controlled by the perpetrators
This sequence was designed to:
-
Conceal the transaction path
-
Disconnect the funds from their original source
-
Significantly complicate efforts to recover them
Nevertheless, blockchain records, combined with investigative tools, helped authorities trace the money trail. The process ultimately resulted in the seizure of assets.
Part of a larger fraud pattern
This prosecution fits into a broader wave of cryptocurrency-related fraud cases. Authorities across the US have taken action against pig-butchering frauds and romance scams. They have also launched crackdowns on laundering operations involving stablecoins.
Across these incidents, common traits appear:
-
Initial outreach through social media, dating apps or informal platforms
-
A slow, deliberate process of cultivating trust
-
A pivot toward cryptocurrency “investment” opportunities
-
Fund transfers through layered transactions
While the specific methods and technologies may vary, the intent and strategy remain consistent.
Did you know? Crypto scams often use multiple blockchains to move funds, not just one. After converting assets into stablecoins, scammers may bridge them across networks to make tracking and recovery efforts even more difficult.
Why this scam proved effective
The core reason these schemes succeed is that they are rooted in psychology rather than in any technological flaw.
The perpetrators did not exploit vulnerabilities in the system itself. Instead, they targeted and manipulated predictable patterns of human behavior.
Several critical psychological elements contributed:
-
Politeness bias: Individuals tend to reply politely even to messages that appear accidental.
-
Trust formation: Consistent, repeated contact creates a growing sense of familiarity and comfort.
-
Perceived control: Victims personally handled the purchase and transfer of funds.
-
Credibility: Linking the high-growth promise of cryptocurrency with the time-tested stability of gold gave the proposal greater believability.
By the time the fraud unraveled, the victim had already become deeply committed both emotionally and financially.
The legal response: Moving from seizure to permanent forfeiture
The US government initiated a civil forfeiture proceeding to recover the seized assets.
Through this legal mechanism, authorities are able to:
-
Assert ownership over property suspected of being linked to criminal conduct
-
Obtain judicial authorization for the permanent forfeiture of those assets
-
Allow victims or other third parties an opportunity to file legitimate claims to the property
Unlike criminal prosecutions, civil forfeiture proceedings focus on the assets themselves and do not necessarily require a criminal conviction to move forward.
Warning signs to recognize
Scams of this nature tend to follow well-established patterns. Important red flags to watch for include:
-
Unsolicited messages claiming to have been sent in error
-
The rapid development of rapport and trust by previously unknown individuals
-
Discussions that gradually shift toward investment suggestions
-
Promises of exclusive access or guaranteed high returns in cryptocurrency
-
Instructions to send funds or cryptocurrency to external wallet addresses
Any investment proposal that arises from a random conversation should be approached with the highest level of skepticism.
What to do if you receive similar messages
If you receive an unsolicited message about a lucrative crypto investment, you should:
-
Refrain from responding to or engaging with unfamiliar contacts
-
Resist the urge to continue the conversation simply to be polite
-
Never transfer money or cryptocurrency to wallet addresses provided by strangers
-
Immediately block and report suspicious phone numbers, accounts or profiles
-
Promptly notify law enforcement and the relevant platforms or exchanges if any funds have already been sent
Prompt action can sometimes improve the chances of authorities tracing the funds or freezing them.
Cointelegraph maintains full editorial independence. The selection, commissioning and publication of Features and Magazine content are not influenced by advertisers, partners or commercial relationships.

One of Switzerland’s most prominent banking dynasties has officially fractured. Marc Syz has walked away from his family’s CHF 24 billion legacy at Banque Syz to bet the firm’s future on a Bitcoin treasury strategy that his father rejected.
The split centers on Future Holdings AG, a corporate treasury vehicle holding 5,000 BTC. Marc Syz and partner Richard Byworth pushed to integrate the $450 million position directly into the bank’s alternative asset arm.
Eric Syz refused.
Now Marc is taking the unit public independently. The move exposes a deep fault line in Swiss wealth management between capital preservation and digital asset adoption. The window for compromise has closed.
- The Asset: Future Holdings AG holds over 5,000 BTC in its corporate treasury, valued at approximately $450 million as of March 2026.
- The Event: Marc Syz has filed regulatory papers for a dual listing on Nasdaq and SIX Swiss Exchange to raise CHF 500 million later this year.
- The Friction: While 28% of private banks plan crypto allocations by 2027, CRD VI compliance deadlines are forcing institutions to choose between integration and exclusion.
The Mechanics of the Syz Separation Explained
This is not a simple resignation. It is a fundamental divergence on how value is stored. Marc Syz previously led Syz Capital, managing CHF 1.2 billion in alternative assets. His proposal was to absorb Future Holdings AG and its Bitcoin stack directly into the bank’s offering.
The structure was modeled explicitly on MicroStrategy. With 5,000 BTC on the balance sheet, the entity acts as a high-beta proxy for Bitcoin price action. Richard Byworth, a former HSBC and Ripple executive, joined as co-founder to build the infrastructure.

Banque Syz leadership balked at the volatility. The bank, founded in 1995, prioritizes the stability required by its private banking clientele.
While major US institutions like Morgan Stanley advance Bitcoin ETF applications to capture fee revenue, holding physical Bitcoin on a family bank’s balance sheet remains a bridge too far for the older guard.
Marc responded by filing for an IPO. Regulatory filings submitted to FINMA on March 15 confirm the plan for a dual listing on Nasdaq and the SIX Swiss Exchange. The goal is to raise CHF 500 million to expand the treasury further. The split is now administrative reality.
Can Old Money Survive the Bitcoin Transition?
The Syz family split is bigger than a boardroom disagreement.
Swiss wealth managers are staring down a relevance crisis. PwC data shows 28% plan to allocate 5-10% to crypto by 2027. Execution is stalling because of exactly this kind of internal governance clash.
Marc Syz is taking the corporate treasury route. 5,000 BTC in custody. Future Holdings heading for a public listing. The thesis is straightforward: Bitcoin is the only real hedge against monetary debasement available to family offices.
At completion, this deal sees @H100Group become the #1 BTCTC in Europe. — Richard Byworth ∞/21M (@RichardByworth) March 23, 2026
Then Switzerland 
Then tackling the 800bln bond market with zero yield
Just like Bitcoin: tick tock next block
Quiet continuous execution with @Sanderandersenn, @Wiik_Johannes, @HUGESKY852, @SYZCAP  https://t.co/1xq5PKOXAv
Eric Syz and the main Banque Syz branch are not following. They are sticking to traditional digitization, modernizing without putting the balance sheet anywhere near crypto volatility.
The market is moving faster than both of them.
By taking Future Holdings public, Marc Syz is not just making a bet. He is forcing the market to price his vision against his father’s. The prospectus is with FINMA. The split is official.
The dynasty is no longer hedging. It is dividing.
Discover: The best new crypto in the world
The post Switzerland Private Banking Dynasty Is Tearing Itself Apart Over Crypto appeared first on Cryptonews.
Bitcoin moved back above $71,000 after US President Donald Trump postponed Iran strike for five days, sending oil price crashing below $100.
Bitcoin (BTC) broke back toward $71,000 during Monday’s European trading session as US President Donald Trump said attacks on Iran’s power infrastructure would be postponed.
Key takeaways:
-
Bitcoin bounces 5% to $71,000 after President Trump said US attacks on Iran’s infrastructure would be postponed.
-
$270 million in short positions were liquidated in an hour.
-
Focus now shifts to $72,000–$75,000 liquidity zones to see if BTC price will rise further to grab these.
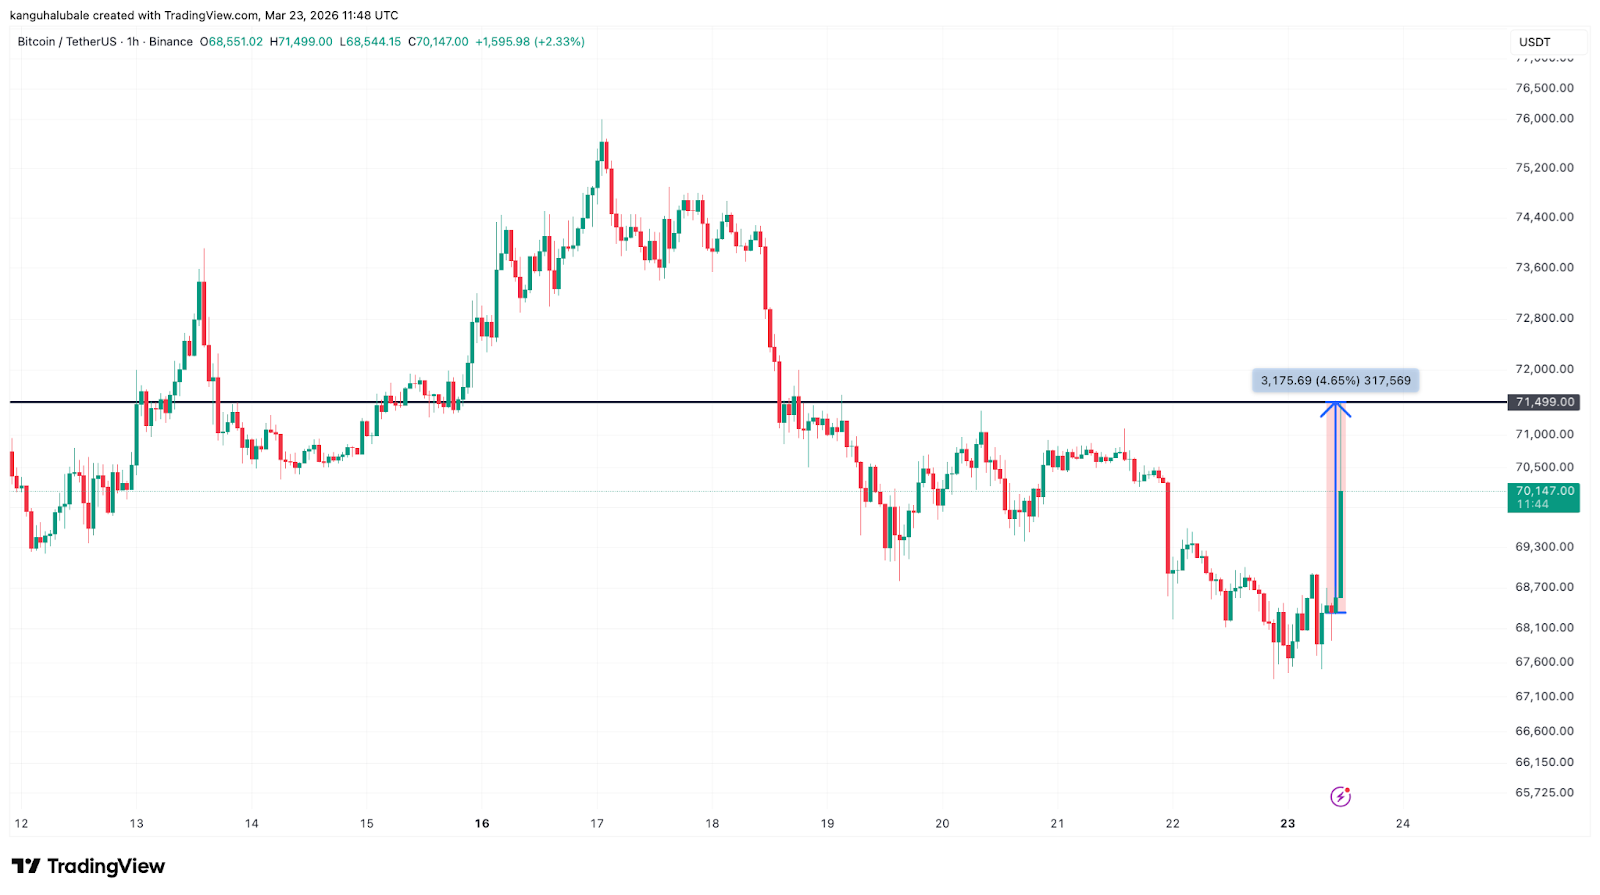
Bitcoin erases weekend losses with 5% rebound
Data from TradingView showed BTC price rose as much as 4.7% within 60 minutes to an intraday high of $71,500, recouping all the losses made over the last three days. The last time BTC/USD traded above $71,000 was on March 19.

The price reacted to President Trump’s announcement of a five-day pause on planned US military strikes against Iranian power plants and energy infrastructure after “very good and productive” discussions with Tehran.

“And this shall henceforth be known as the ‘TACO PUMP,’” Coinbureau CEO Nic Puckrin said in response to Bitcoin’s reaction following the news.
The move in Bitcoin was accompanied by $270 million in short liquidations within an hour, with BTC short liquidations accounting for $120 million.
This brought the total liquidations across the crypto market over the last 24 hours to $781 million.

Gold erased almost all its earlier losses, now down just 1% on the day and rebounding to $4,440 per ounce, while the dollar index (DXY) has slipped to 99.3.
Related: Gold bear market and sub-$50K BTC: Five things to know in Bitcoin this week
Oil, a key macro risk factor, dropped as much as 16% to $92 from an intraday high of $110, while WTI crude dropped below $85 — the steepest single-day decline since late 2025.

However, Iranian officials quickly denied the reports of substantive productive talks, insisting no meaningful concessions had been made and reiterating demands for a complete halt to US and Israeli actions before any broader resolution.
Bitcoin price fills CME gap at $70,000
Bitcoin started the week with a significant CME gap around $70,000. This gap has now been filled with the latest price rise. Traders will now focus on the next one near the $80,000 region.

Meanwhile, the liquidation heatmap showed BTC price eating away ask orders below $72,000. A close above this level would push the BTC/USD pair toward $75,000, where the next major liquidity cluster sits.

On the downside, “the $64K-$65K region is interesting,” analyst Daan Crypto Trades said, adding:
“Currently there’s a lot of fear for the latter which is why most markets have been selling off a lot the past few trading days.“
This article does not contain investment advice or recommendations. Every investment and trading move involves risk, and readers should conduct their own research when making a decision. While we strive to provide accurate and timely information, Cointelegraph does not guarantee the accuracy, completeness, or reliability of any information in this article. This article may contain forward-looking statements that are subject to risks and uncertainties. Cointelegraph will not be liable for any loss or damage arising from your reliance on this information.
Crypto investment products maintained their inflow streak last week but momentum slowed amid ongoing Middle East tensions and a “hawkish pause” interpretation of the US Fed’s meeting.
Crypto exchange-traded products (ETPs) recorded $230 million in inflows last week, with $405 million in outflows following the Federal Open Market Committee (FOMC) meeting in the US, CoinShares reported Monday.
The inflows extended the streak to four consecutive weeks, but the latest total was sharply lower than the previous week’s $1.06 billion.
CoinShares head of research James Butterfill largely attributed the slowdown to the market’s “hawkish pause” interpretation of the US Federal Reserve’s Wednesday meeting, rather than broader geopolitical tensions.
“The intra-week data supports this,” Butterfill said, referring to strong inflows in the first two days of the week before reversing sharply in the wake of the FOMC meeting.
Bitcoin funds lead inflows, while Ether reverses
Bitcoin (BTC) accounted for nearly all of last week’s crypto ETP inflows, posting $219.2 million in gains. Ether (ETH) funds saw $27.5 million in outflows, ending a three-week inflow streak.
Solana (SOL) saw $17 million in inflows for the seventh straight week, bringing the total to $136 million and making it one of the most popular ETP assets in recent months.

Additionally, notable gains came from Chainlink (LINK) and Hyperliquid (HYPE), with inflows netting $4.6 million and $4.5 million, respectively.
Related: NYSE exchanges scrap crypto options cap on 11 Bitcoin, Ether ETFs
Crypto ETPs have clocked $1.4 billion of inflows year-to-date, with Bitcoin ETPs leading at $1.2 billion. Total assets under management stand at $138 billion, according to CoinShares.
US spot Bitcoin ETFs account for 43% of gains
About half of Bitcoin ETP inflows were driven by the US spot Bitcoin exchange-traded funds (ETFs) last week, which ended the week with $95.2 million in inflows.
The inflows marked four consecutive weeks of gains totaling $2.2 billion, according to SoSoValue data. Despite the gains, spot Bitcoin ETFs remain underwater year-to-date, with roughly $400 million in outflows.

Similar to broader investment products, US spot Ether ETFs failed to maintain the inflow streak after three weeks of inflows, with last week’s outflows totaling around $60 million.
The US spot Ether ETFs have seen $599 million in outflows year-to-date, while broader ETPs were roughly $50 million underwater.
Magazine: Google flags crypto malware, retiree loses $840K in ‘expert’ scam: Hodler’s Digest, Mar. 15 – 21
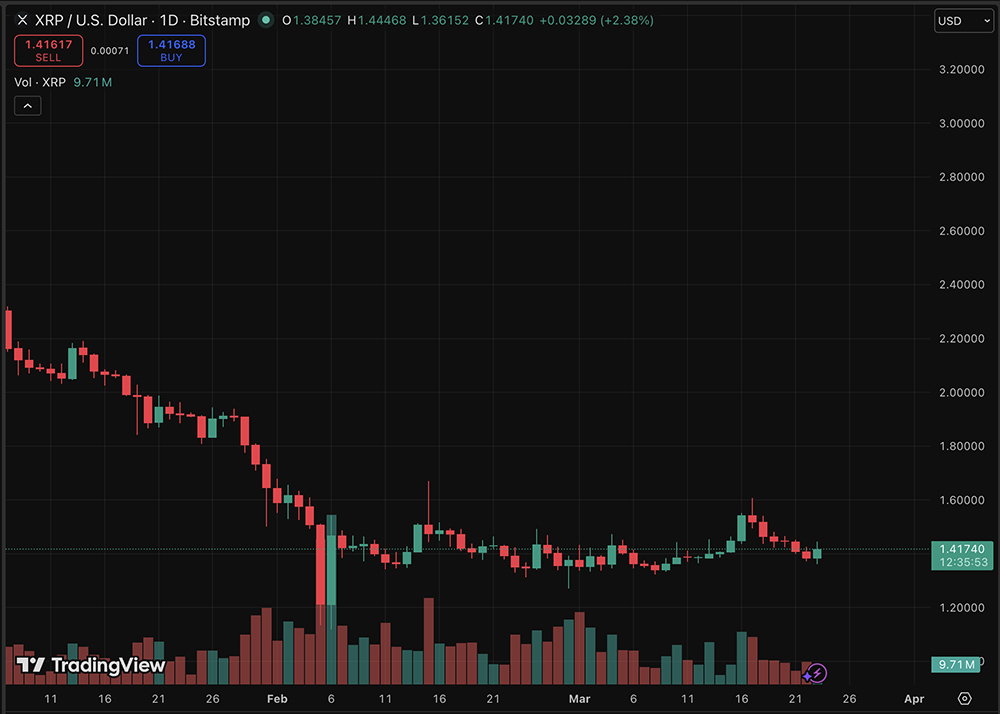
XRP is trading at the $1.40 price level, down just 1% over 24 hours, as the prediction says crypto markets will pull back further despite new U.S. regulatory clarity classifying the token as a digital commodity.
The classification, confirmed by the SEC and CFTC, handed bulls a headline victory, but the rally fizzled fast. We hit a wall of macro aggression: a hawkish Federal Reserve stalling rate cuts and a geopolitical oil spike to above $100 per barrel, before dropping this hour to under $90.
The $1.40 level, once a floor, has turned into a ceiling and a battleground for the week ahead.

XRP Price Prediction: Will Ripple Reclaim $1.50 Amid Macro Headwinds?
The technical landscape for Ripple’s native token is precarious. While the asset benefits from established support following the May 2025 SEC settlement, the failure to hold above $1.45 suggests buyer exhaustion. Trading volumes have thinned as capital rotates into commodities; oil prices above $112 act as a liquidity sponge, soaking up risk capital.
If bulls cannot reclaim $1.45 within 48 hours, the next logical support sits significantly lower. Conversely, a clean break above $1.45, fueled perhaps by institutional flows into spot ETFs, could target $1.55.
On-chain data signals XRP may be near a bottom, but the macro environment demands caution. With rates stuck at 3.50%-3.75%, the cost of capital remains high, dampening the leverage needed for a sustained breakout.
BREAKING: — Watcher.Guru (@WatcherGuru) March 18, 2026
 Federal Reserve leaves interest rates unchanged, remains at 3.50% – 3.75%.
Traders should watch the $1.30 support level closely. A breakdown here validates the pressure seen since the start of 2026, potentially exposing the asset to a deeper flush toward $1.30. Is the market pricing in a delay to altcoin season? The data points to a temporary risk-off sentiment.
Maxi Doge Targets Early Mover Upside as XRP Tests Key Levels
While major cap assets like XRP wrestle with interest rate realities and oil shocks, a subset of traders is rotating into high-velocity presales unaffected by Brent crude charts. Capital is seeking volatility in new narratives. Enter Maxi Doge ($MAXI), a new entrant aggressively targeting the “degen” trading subculture with a distinct leverage-king aesthetic.
The project has raised more than $4,6 million thus far, priced at $0.000281 per token and a staking reward bonus of 66%. Unlike standard meme tokens that rely solely on cute imagery, Maxi Doge integrates holder-only trading competitions and a “Maxi Fund” treasury designed for liquidity injections. It appeals to the high-risk demographic with the tagline “Never skip leg-day, never skip a pump.”
Meme coin liquidity is thinning elsewhere, yet $MAXI continues to attract inflows due to its specific market fit: a 240-lb canine juggernaut embodying a 1000x leverage trading mentality. For traders exhausted by XRP’s slow grind against the $1.40 resistance, this presale offers a high-variance alternative built for the current volatility. However, early-stage tokens carry inherent risks; dynamic APY staking provides an incentive for holding, but market timing remains critical.
The post XRP Price Prediction: SEC Clarity Meets Fed and Oil Shock as We Watch 1.40 appeared first on Cryptonews.

Chief Rabbi: British Jews saddened by ambulance attack but will not be cowed

UK must back North Sea oil and gas drilling, says trade body

Bitcoin Traders See New Lows Coming as Gold Enters Bear Market


-
 Crypto World3 days ago
NIO (NIO) Stock Plunges 6.5% as Shelf Registration Sparks Dilution Worries
-

 Fashion3 days ago
Weekend Open Thread: Adidas – Corporette.com
-

 Politics3 days ago
Jenni Murray, Long-Serving Woman’s Hour Presenter, Dies Aged 75
-
 Tech6 days ago
Are Split Spacebars the Next Big Gaming Keyboard Trend?
-

 Crypto World2 days ago
Best Crypto to Buy Now: Strategy Just Spent $1.57 Billion on Bitcoin During Fear While Early Investors Quietly Enter Pepeto for 150x Potential
-

 News Videos5 days ago
RBA board divided on rate cut, unusually buoyant share market | Finance Report | ABC NEWS
-

 Crypto World2 days ago
Bitcoin Price News: Bhutan Sells $72 Million in BTC Under Fiscal Pressure, but the Smart Money Entering Pepeto Sees What the Market Does Not
-

 Politics6 days ago
The House | The new register to protect children from their abusers shows Parliament at its best
-

 Tech4 days ago
inKONBINI Lets You Spend Summer Days Behind the Register
-
 Politics6 days ago
Real-time pollution monitoring calls after boy nearly dies
-

 Crypto World5 days ago
Canada’s FINTRAC revokes registrations of 23 crypto MSBs in AML crackdown
-

 Sports14 hours ago
Remo Stars and Kano Pillars Strengthen Survival Hopes in NPFL
-
 NewsBeat5 days ago
Residents in North Lanarkshire reminded to register to vote in Scottish Parliament Election
-

 News Videos5 days ago
PARLIAMENT OF MALAWI – PAC MEETING WITH REGISTRAR OF FINANCIAL ON AMARYLLIS HOTEL – INQUIRY LIVE
-

 Business1 day ago
No Winner in March 21 Drawing as Prize Rolls to $133 Million for Next
-

 Politics4 days ago
Gender equality discussions at UN face pushbacks and US resistance
-

 Business5 days ago
Who Was Alex Pretti? 5 Key Facts About the ICU Nurse Killed by Federal Agents in Minneapolis
-

 Sports13 hours ago
Gary Kirsten Accuses Pakistan Cricket Board Of ‘Interference’, Mohsin Naqvi Responds
-

 Tech1 day ago
Give Your Phone a Huge (and Free) Upgrade by Switching to Another Keyboard
-

 Sports3 days ago
2026 Kentucky Derby horses, odds, futures, preview, date: Expert who nailed 12 Derby-Oaks Doubles enters picks
You must be logged in to post a comment Login