
CryptoCurrency
Vanguard expert warns Bitcoin is a ‘digital Labubu’ as risky pattern forms

Bitcoin price retreated below $90,000 today, Dec. 12, as a senior executive at Vanguard warned that it was a ‘digital Labubu’ and as an alarming pattern formed.
Summary
- Bitcoin price dropped below the important support at $90,000.
- A senior Vanguard expert called it a digital Labubu.
- The coin has formed a bearish flag pattern on the daily chart.
Bitcoin (BTC) was trading at $89,700 at press time, down sharply from the year-to-date high of $126,300. Its pullback coincided with the significant drop in American equities, with the Nasdaq 100 and S&P 500 indices falling by over 1% as artificial intelligence fears mounted.
Bitcoin price also dropped as John Ameriks, a senior executive at Vanguar,d warned that it was a ‘Digital Labubu’. Made by Pop-Mart, Labubu, a plush toy, has seen its demand surge and then drop sharply this year.
Ameriks argued that Bitcoin lacks any income, compounding, and cash-flow properties, making it a risky investment. Other top investors like Warren Buffett and the late Charlie Munger also pointed to these risks.
His statement came a few weeks after Vanguard, which has over $12 trillion, started offering Bitcoin and other cryptocurrency ETFs on its platform. Ameriks said:
“We allow people to hold and buy these ETFs on our platform if they wish to do so, but they do so with discretion. We’re going to not give them advice as to whether buy or sell or which crypto tokens they ought to hold.”
Unlike its top competitors, like BlackRock, Invesco, and Franklin Templeton, Vanguard has not launched crypto ETFs despite their financial incentives. For example, BlackRock’s IBIT has become its most profitable fund, generating hundreds of millions of dollars in fees annually.
Bitcoin price technicals point to a breakdown
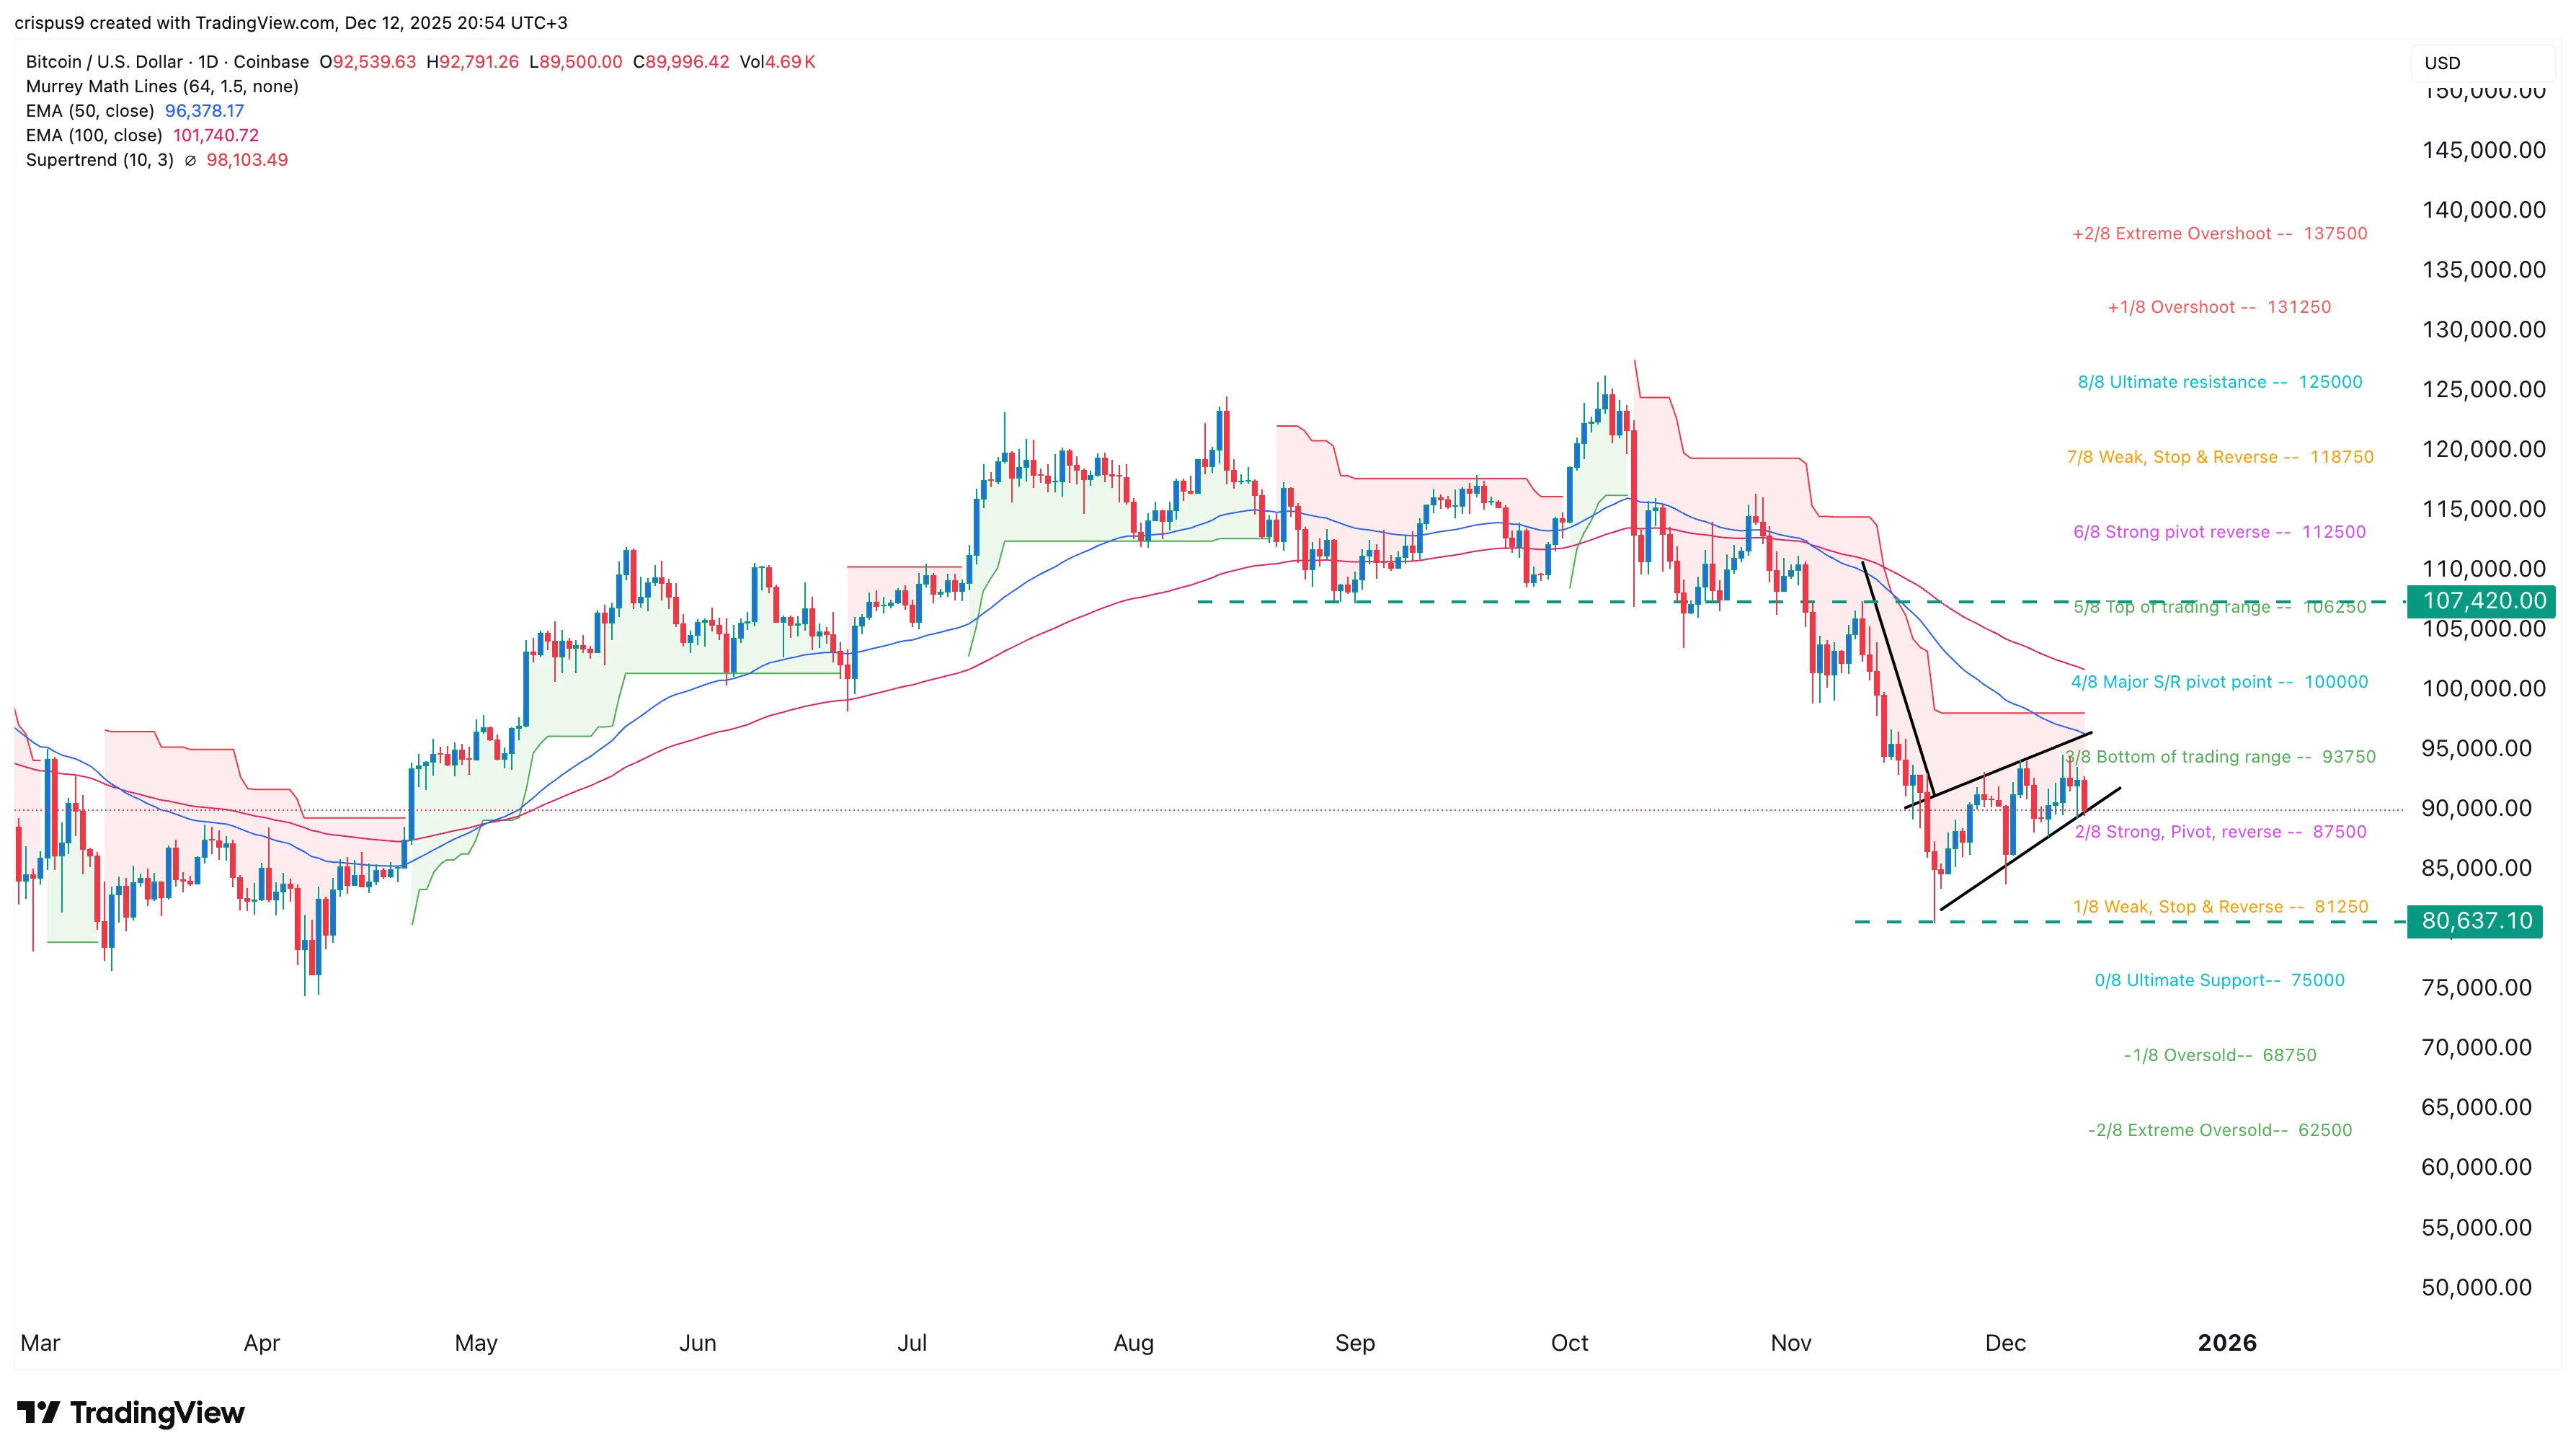
BTC price chart | Source: crypto.news
Meanwhile, the daily chart shows that the coin has remained below the Supertrend indicator. It has also moved below the 50-day Exponential Moving Average.
Bitcoin has formed a bearish flag pattern, which is one of the riskiest signs in technical analysis. Therefore, the coin will likely continue falling as sellers target the ultimate support of the Murrey Math Lines at $75,000. A move above the Major S&R pivot point at $100,000 will invalidate the bearish Bitcoin forecast.


