
Crypto World
Was Jane Street behind the bitcoin crash? A deep dive into why that theory may not not hold


Bitcoin has dropped like clockwork every morning after the New York market open since late 2025, and crypto fans on X are accusing Jane Street for causing it.
A theory on X has gotten retail participants pointing to the firm for single-handedly driving the asset from $125,000 to $62,000 in recent months.
However, market data and inner workings of an exchange-traded fund (ETF) authorized participant like Jane Street suggest otherwise, observers have noted.
CoinDesk reached out to Jane Street for comment on BTC allegations and did not receive a reply as of European morning hours.
This is INSANE.
Since Jane Street was sued two days ago, the 10 AM manipulation has stopped.
Bitcoin is up 10%, adding $120 billion to its market cap, and the BTC weekly candle has turned green after 5 consecutive red candles.
The total crypto market has added nearly $200… pic.twitter.com/4dCrFewTE4
— Bull Theory (@BullTheoryio) February 25, 2026
The allegations
The claim, spread across dozens of viral posts, goes something like this: Jane Street, one of the world’s largest trading firms, was systematically selling bitcoin at 10 a.m. ET every day to push prices lower and then snap up ETFs cheaply.
“BTC has been consistently dumping ~2-3% within minutes of the U.S. cash open (10 a.m. ET) almost every trading day since early November. Many traders point to Jane Street’s massive $2.5B+ position in BlackRock’s IBIT as the likely driver: engineered liquidity sweeps to accumulate spot ETFs at a discount,” Whale Factor, a widely-followed X account said in December.
The recent 13/F filings revealed that Jane Street held roughly $790 million in IBIT shares as of the fourth quarter of 2025.
Jan Happel and Yann Allemann, the co-founders of blockchain analytics firm Glassnode, have also documented these patterns through their shared X account Negentropic and said Wednesday: “Jane street Lawsuit gets made public, and miraculously the 10am $btc slam disappears.”
The allegations have exploded this week, after the firm was sued by TerraForm Labs’ bankruptcy operator for insider trading that hastened Terra’s demise in 2022. If that’s not enough, the 10 a.m. volatility has vanished in the wake of the lawsuit. Bitcoin surged by over 6% to nearly $70,000 on Wednesday.
In June last year, India’s SEBI banned Jane Street from local markets and froze $566 million in alleged illegal gains, citing a “morning pump, afternoon dump” scheme manipulating the Bank Nifty index on 18 derivatives expiry days from January 2023 to March 2025. The accusations, therefore, suggest Jane Street’s reputation precedes it.
Market data and logic suggest otherwise
The conspiracy that Jane Street has been secretly driving prices lower to snap up IBIT cheap could be challenged, however, using data tracked by crypto economist Alex Kruger, which doesn’t confirm the 10 a.m. dump.
The IBIT ETF has posted cumulative gains of around 0.9% in the 10:00-10:30 ET window; meanwhile, returns in the first 15 minutes have been -1%, according to Kruger. That’s noisy data, not evidence of systematic dumping, Kruger said on X.
Everyone says bitcoin dumps at 10AM every day.
I pulled the data, and it’s not true.
Since Jan 1, IBIT’s cumulative return in the 10:00–10:30 window is +0.9%, and in the 10:00–10:15 window it’s –1%. Noisy, not a systematic dump.
More interesting: the performance pattern in… pic.twitter.com/jboe0eehG0
— Alex Krüger (@krugermacro) February 26, 2026
More importantly, both windows closely mirror Nasdaq performance, Kruger added, which means the so-called “10 a.m. dump” was a part of broad risk-asset repricing, not Jane Street foul play.
Jane Street, it should be pointed out, isn’t a rogue operator with unfettered power over bitcoin, but a single player — an authorized participant (AP) — in a regulated ecosystem designed to ensure smooth trading of the ETFs.
“No single firm sits at a terminal pressing “dump Bitcoin.” But the structure itself—the ETF architecture, the AP exemptions, the shift to in-kind creation—creates a grey window where price discovery can be muted without anyone breaking rules,” Yale ReiSoleil, chief technology officer of Untrading, an Ethereum-based financial infrastructure firm, said on X.
Spot ETFs are funds that track bitcoin’s spot price while holding actual coins in custody. Their shares trade on the stock exchange and their prices tend to drift away from the underlying asset’s net asset value (NAV) depending on the demand and supply.
APs like Jane Street, JPMorgan and Citadel Securities are tasked with creating new ETF shares with demand spikes and redeem when demand falls to ensure the ETF price remains tethered to the NAV.
In the case of bitcoin ETFs, APs are allowed “in-kind” creation and redemption, where they can swap a basket of actual BTC directly with the issuing company, rather than just cash. These dynamics, which are legal and not manipulation, could have led to 10 a.m. volatility.
Short first, buy later
On a typical day, when BTC rises during the Asian and European hours, demand for ETFs spikes in early U.S. hours. This temporarily pushes the ETF price above its NAV. The APs then respond by increasing the supply of shares — sometimes by shorting shares they don’t have — to meet buyer demand and keep trading smooth.
Normally, shorting requires borrowing shares first, which costs money (like loan interest), but regulators have exempted APs from that rule.
Later, when they create new shares, they don’t rush to buy spot BTC right away and often source it privately through an over-the-counter shop. They then short futures or buy put options to hedge the long exposure from creating new shares.
These things combined can inject temporary downside pressure in the market.
“APs can short IBIT without borrowing costs, thanks to a Reg SHO carve-out. They can hedge that short with futures instead of spot. That means the natural arb that should close the gap between ETF price and NAV never happens, because the AP never buys spot,” ReiSoleil explained.
“Meanwhile, in-kind creation lets them source bitcoin privately, OTC, at their own pace. The spot market never sees the buy pressure. The beginning looks like market-making. The end looks like market-making. The middle is where the integrity of price discovery goes to die,” he added.
Kruger agreed that Jane Street conspiracy theories are typical of the doom-laden sentiment that often emerges after prolonged bitcoin downtrends.
He firmly disagreed with the allegation that the “short first and buy later” mechanics employed by APs temporarily suppress the price.
“Whether the spot is bought by the AP or the basis trader, the net demand on BTC spot is identical,” he said, arguing that the notion that hedging with futures first (and delaying immediate spot buys) somehow compromises the integrity of price discovery is simply incorrect.
Jane Street has not commented publicly, and no onchain data or exchange records have surfaced tying the firm to a coordinated campaign to push bitcoin lower.


TLDR
- Justin Sun’s frozen WLFI holdings lost over $11 million in 24 hours.
- WLFI price dropped 15% daily and over 74% since its launch.
- World Liberty Financial blacklisted Sun’s wallet, freezing his tokens.
- The project used WLFI as collateral to borrow stablecoins on Dolomite.
- World Liberty denied liquidation risks and called concerns “FUD.”
Justin Sun recorded a fresh loss as WLFI price dropped sharply within 24 hours. His frozen token holdings declined by over $11 million in value. Meanwhile, World Liberty Financial rejected concerns tied to its borrowing activity.
The decline followed a 15% daily drop in WLFI’s market price. The token has also fallen more than 74% since its trading debut last year. Sun’s locked position remains inaccessible after earlier blacklist actions.
Justin Sun Holdings Decline as WLFI Price Weakens
Justin Sun’s exposure to WLFI decreased as market prices continued to fall. His frozen holdings lost value and now stand near $45 million.
Blockchain data shows he holds about 545 million WLFI tokens. However, the tokens remain frozen due to earlier restrictions placed by the issuing project.
Sun initially invested $30 million in late 2024 before trading began. He later increased exposure, bringing his total WLFI position near $75 million.
At the same time, he committed $100 million to Donald Trump’s TRUMP memecoin. These combined moves expanded his footprint across politically linked crypto assets.
However, World Liberty Financial blacklisted a wallet tied to Sun last year. The action followed a transfer of roughly $9 million in WLFI tokens.
As a result, Sun cannot move or sell the frozen tokens. This restriction limits his ability to respond to market changes.
Recent estimates show his holdings have dropped over $80 million from earlier valuations. The decline reflects ongoing price pressure on WLFI.
Borrowing Activity Draws Scrutiny as Project Responds
World Liberty Financial increased activity on the Dolomite lending protocol. The project deposited billions of WLFI tokens as collateral.
In return, it borrowed tens of millions in stablecoins. This move triggered concern among market observers about potential risks.
Critics warned that falling WLFI prices could create bad debt exposure. They pointed to the scale of collateral relative to borrowed funds.
Concerns also arose due to internal connections within the project. Dolomite co-founder Corey Caplan serves as an advisor to World Liberty Financial.
However, the project dismissed these concerns in public statements. It described the claims as “FUD” and rejected liquidation risks.
The team stated, “We are nowhere near liquidation.” It added that it could supply more collateral if markets moved sharply.
World Liberty Financial said it acts as an “anchor borrower” on Dolomite. It argued that this role helps generate higher yields for users.
The project also maintained confidence in WLFI despite the price decline. It continued to defend its lending strategy in public posts.


Storm’s defense argued his work on the non-custodial mixer was lawful, while prosecutors claimed he profited from money laundering.
A federal judge heard arguments on whether to acquit Tornado Cash co-founder Roman Storm on conspiracy charges, but signaled she may not be ready to make a decision anytime soon.
Judge Katherine Polk Failla of the Southern District of New York presided over a hearing on Storm’s motion for acquittal under Criminal Rule 29, which asks the court to throw out charges when the prosecution’s evidence is legally insufficient. Storm was convicted last August of conspiracy to operate an unlicensed money-transmitting business, but a jury was unable to reach a unanimous verdict on two more serious charges — conspiracy to launder money and conspiracy to violate U.S. sanctions — resulting in a partial mistrial.
Storm’s attorneys argued that Tornado Cash is a legal, non-custodial protocol and that his work maintaining the software does not make him liable for criminal actors who also used the platform. His defense team has maintained since the original trial that Storm had no operational control over transactions and never intended for the protocol to be used by criminals. They further argued that denying the acquittal would effectively criminalize the publication of decentralized software in violation of the First Amendment.
Government prosecutors pushed back, arguing that Storm not only facilitated but also profited from money laundering through the protocol. Prosecutors allege that Tornado Cash processed more than $1 billion in illicit funds, including hundreds of millions linked to North Korea’s Lazarus Group.
Industry Reactions
Patrick Wilson, General Counsel of the Solana Policy Institute, called the prosecution’s expansive framing “alarming,” warning that it could recast otherwise lawful activity as illegitimate once criminals use a non-custodial tool at sufficient scale.
Amanda Tuminelli, CEO of the DeFi Education Fund, attended the hearing and said the government still does not understand the technology at issue. She added that while Failla asked detailed questions, predicting how she will rule is impossible. Given the judge’s focus on scheduling a potential retrial for late 2026, Tuminelli said she expects the case to continue.
If Failla grants the acquittal, prosecutors would need to decide whether to appeal or abandon the case. If denied, Storm faces sentencing on his existing conviction, which carries up to five years in prison, and a retrial on the two remaining charges that prosecutors have asked to schedule for October.
This article was written with the assistance of AI workflows. All our stories are curated, edited and fact-checked by a human.

The March inflation print came in hotter than expected, but a tame core reading and easing oil prices gave risk assets room to rally.
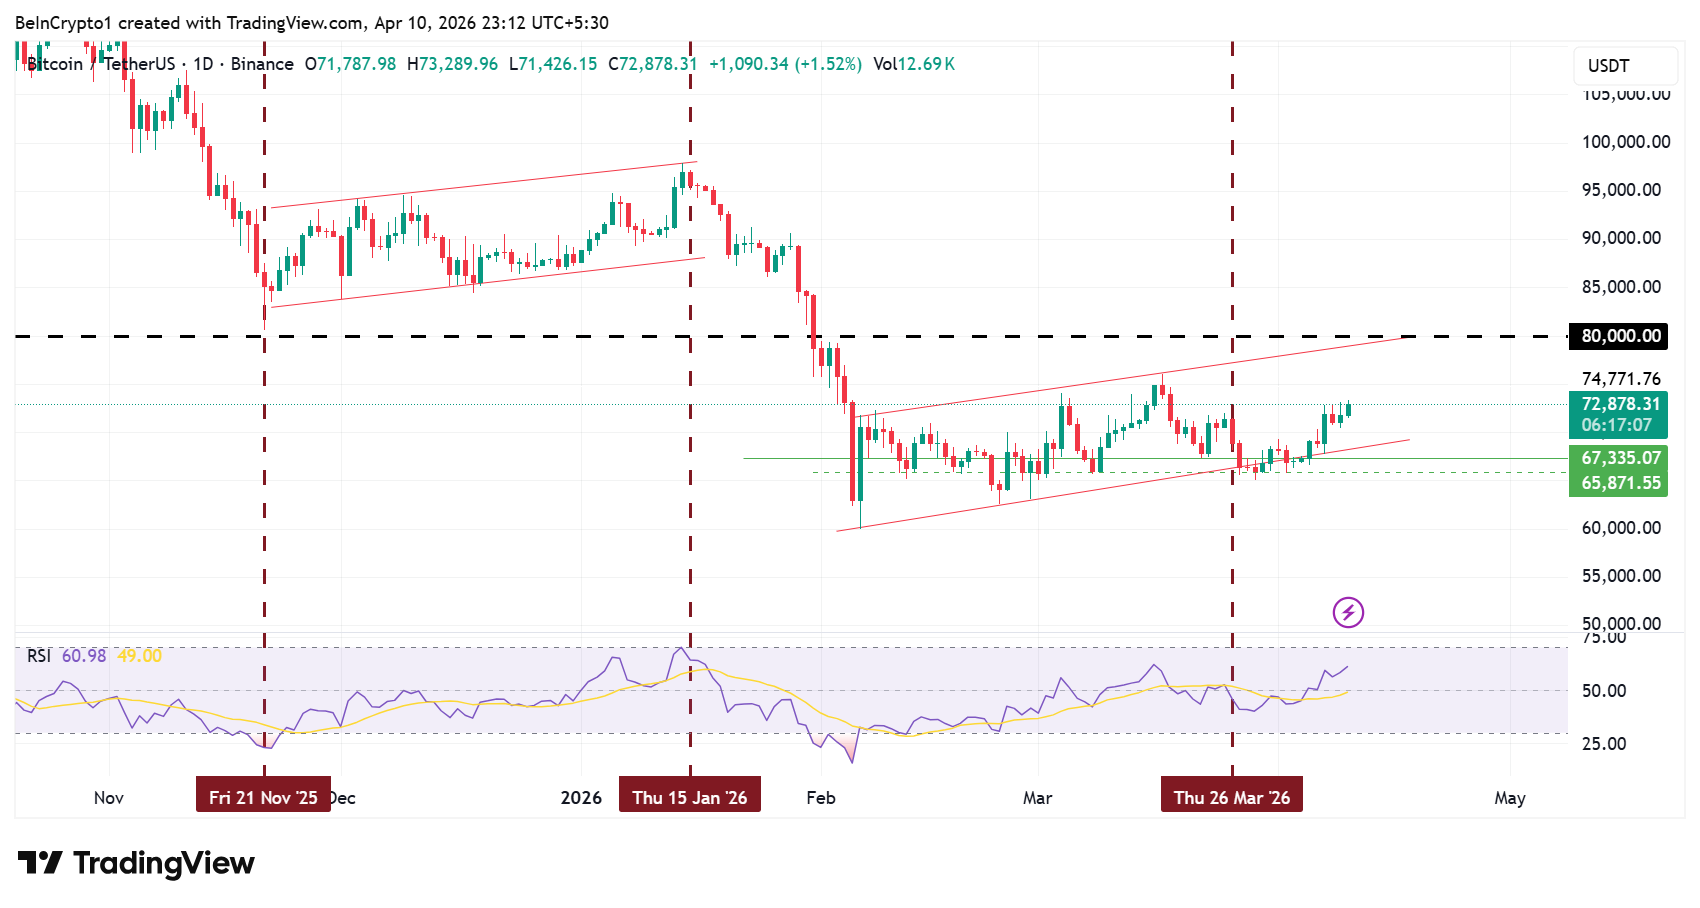
Bitcoin surged past $73,000 on Friday, up 1.8% over the past 24 hours and 9.4% on the week, as traders weighed a hotter-than-expected March CPI report against a still-fragile U.S.-Iran ceasefire.
Ethereum followed, climbing to $2,250, up 2.0% on the day and nearly 10% over the past seven days, per CoinGecko. Solana gained 2% to $85, XRP rose 0.6% to $1.36, and BNB ticked up 0.3% to $609.
Bittensor (TAO) was the day’s biggest loser among top tokens, dropping 21% to $265 after a prominent subnet developer denounced the ecosystem.
The total cryptocurrency market capitalization rose to approximately $2.55 trillion, up 1% over the past 24 hours. The Crypto Fear & Greed Index registered 16, still deep in “Extreme Fear,” a zone the market has now occupied for nearly two months.
Energy-Driven Inflation Spike
The Bureau of Labor Statistics reported that headline CPI rose 0.9% month-over-month and 3.3% year-over-year in March, the highest annual increase since May 2024. The spike was almost entirely energy-driven, as gasoline prices surged a record 21.2% during the month, accounting for nearly three-quarters of the overall monthly increase.
The silver lining for risk assets was the core print. Excluding food and energy, core CPI rose just 0.2% month-over-month, matching the prior month’s pace, while the annual core rate ticked up to 2.6% from 2.5%. That distinction matters because the headline number reflects the oil shock from the Iran war, but the Fed watches core inflation more closely. CME data shows that the market is pricing in a 98% probability that the Fed holds rates steady at its April 29 meeting.
The ceasefire announced earlier this week initially sparked a sharp rally, with Bitcoin jumping over 4% on Wednesday after Trump announced a two-week deal with Iran. But reports of continued fighting and disagreement over Iran’s control of the Strait of Hormuz quickly derailed that bounce. Friday’s move above $73,000 marks BTC’s highest level since mid-March.
Perpetual futures funding rates are trending toward negative territory again despite short liquidations earlier this week, according to CoinGlass, signaling that the derivatives market remains cautiously positioned even as spot prices rise.
Spot Bitcoin ETFs posted $343 million in net inflows on April 9, per SoSoValue data. Total BTC ETF net assets sit at roughly $93.2 billion.
Looking Ahead
Friday’s push above $73,000 brings Bitcoin to the upper end of the $62,000–$75,000 range it has traded within since early February.
The core CPI print gives the Fed cover to hold, but the headline number keeps rate cuts off the table for now. If the ceasefire holds and oil prices continue to ease, the energy-driven inflation spike should fade in the coming months. A sustained break above $75,000 would be the first technical signal that the post-crash range is resolving to the upside.
TLDR
- WLFI price declined 14% to $0.08 within 24 hours.
- Market capitalization dropped by $427 million to $2.58 billion.
- World Liberty Financial plans a structured token unlock proposal.
- The project holds $400 million in WLFI collateral on Dolomite.
- The team denied liquidation risks and pledged additional collateral if needed.
World Liberty Financial’s (WLFI) governance token dropped sharply after the project outlined a token unlock proposal. The price fell to $0.08, marking a 14% daily decline. At the same time, market capitalization declined by $427 million to $2.58 billion.
World Liberty Financial Token Drops on Unlock Plan
World Liberty Financial confirmed it is preparing a governance proposal to unlock WLFI tokens for early holders. The project said the plan includes a structured vesting schedule to control supply release.
Currently, about 75% of WLFI tokens remain locked and cannot be traded. The team acknowledged “strong demand” from early participants seeking liquidity access.
The token launched as a non-transferable digital asset and later gained a valuation based on limited circulating supply. Public sales distributed around 20% of the total supply to investors.
World Liberty Financial raised $550 million from about 85,000 participants during two token sales. Token Unlocks data valued those distributed tokens at nearly $2 billion on paper.
The team stated that the unlock proposal would not release all tokens at once. It added that a “long-term vesting and unlock schedule” will guide the process.
DeFi Loan Activity Sparks Liquidity Concerns
World Liberty Financial defended its $150 million stablecoin borrowing activity through the Dolomite protocol. The loans are denominated in USDC and backed by WLFI collateral.
Critics raised concerns about liquidity risks tied to WLFI’s limited tradable supply. Some users warned that liquidation events could create losses for liquidity providers.
The project responded by rejecting those concerns and stating, “We are nowhere near liquidation.” It also said it would add more collateral if market conditions changed.
Blockchain data showed the project posted about $400 million in WLFI as collateral. This amount represents nearly 98% of the token’s supply on the platform.
Observers also questioned how the project plans to repay the borrowed stablecoins. Some transactions showed that part of the funds moved to Coinbase Prime accounts.
World Liberty Financial described its borrowing strategy as beneficial for users supplying stablecoins. It stated that users are “earning outsized stablecoin yields right now.”
The Dolomite protocol’s lending pool for USD1 showed high utilization levels. This condition raised questions about borrowing limits and liquidity availability.
Despite concerns, the project maintained that its position remains secure under current conditions. It reiterated that additional collateral could support its loans if required.
TLDR
- Bitcoin exchange netflow dropped to -$582 million within two days.
- Exchange reserves declined by 100,000 BTC since mid-February.
- Funding rates fell to -0.253%, showing increased short positions.
- Reduced exchange supply limits immediate selling pressure.
- Market conditions suggest a possible short squeeze scenario.
Bitcoin moved sharply higher this week while exchange balances dropped and funding rates turned negative. Data shows reduced selling supply and growing short positions. This setup increases the probability of a short squeeze in the near term.
Bitcoin price climbed from $66,900 on April 3 to around $73,000. The asset reclaimed $70,000 earlier this week and held gains. On-chain data shows fewer coins available on exchanges.
Bitcoin Outflows Accelerate as Exchange Supply Tightens
Bitcoin exchange netflow flipped from a +2,109 BTC inflow to a -2,533 BTC outflow on April 9. This reversal shows coins left exchanges soon after entering. Data indicates traders removed holdings rather than keeping them available for selling.
Outflows increased further to -5,441 BTC on April 10. Total withdrawals reached 7,974 BTC, valued at about $582 million. This movement marks one of the largest recent net outflows.
Ruga Research stated, “Coins arrive, get absorbed, and then leave again.” The firm added that the trend matters more than daily swings. Exchange supply continues to decline over time.
Exchange reserves dropped from 2.8 million BTC on February 15 to 2.701 million BTC. This change reflects a reduction of about 100,000 BTC. The removed supply equals roughly $7.3 billion at current prices.
Lower exchange balances reduce immediate selling pressure. Fewer coins remain accessible for quick trades. This condition can support price stability during market swings.
Funding Rate Turns Negative as Short Positions Build
Funding rates dropped to -0.253% on April 9. This level shows that short traders pay long traders to hold positions. It also reflects strong bearish positioning in derivatives markets.
Ruga Research said, “Funding rates show growing conviction among short traders.” This data suggests traders expect price declines. However, market positioning can shift quickly under pressure.
Negative funding combined with exchange outflows creates tension. One side of the market may face forced liquidation. This setup often precedes rapid upward price moves.
Short squeezes occur when rising prices force short sellers to close positions. This action drives prices higher in a short period. Current data shows conditions that may trigger such events.
Ruga Research clarified that this data does not confirm price direction. It only reflects trader positioning and supply trends. Market participants continue to monitor funding and exchange flows.
Bitcoin continues to trade near $73,000 as of April 10. Exchange reserves remain lower than February levels. Funding rates stay negative, indicating ongoing short pressure.


Circle’s Chief Strategy Officer Dante Disparte published a direct defense of the company’s authority to freeze USDC (USDC), naming the $270 million Drift Protocol exploit as the catalyst.
The blog post and a separate X statement followed weeks of criticism from onchain investigator ZachXBT, who accused Circle of inaction while stolen funds moved through its Cross-Chain Transfer Protocol.
Circle Responds to Freeze Criticism
Circle framed its freeze capability as a compliance obligation rather than a discretionary tool. He wrote that USDC freezes happen only when the law compels action through a formal process.
When Circle freezes USDC, it is not because we have decided, unilaterally or arbitrarily, that someone’s assets should be taken from them. It is because the law requires us to act,” wrote Disparte in a blog.
The statement appeared to address ZachXBT’s earlier accusation that Circle failed to freeze stolen USDC during the April 1 exploit.
The investigator had noted that hundreds of millions in USDC moved from Solana (SOL) to Ethereum (ETH) via CCTP during U.S. business hours without intervention.
Disparte also acknowledged a tension familiar to the crypto industry. He argued that the same framework protecting holders from arbitrary interference also limits how fast an issuer can act during an active exploit.
Disparte Pushes for Faster Legal Frameworks
Beyond defending existing policies, Disparte called for new legal structures that would allow issuers and exchanges to respond more quickly to theft without creating overreach risks.
He said the tools to intervene exist, but the legal authorization for rapid, coordinated action does not.
He pointed to the GENIUS Act and the CLARITY Act as vehicles for codifying those standards. The U.S. Treasury Department is already advancing rulemaking to implement the GENIUS Act, with the FDIC approving a proposed rule on April 7.
In a parallel move, Disparte published an op-ed urging the UK to claim a second-mover advantage in stablecoin regulation.
He argued that combining elements of Europe’s Markets in Crypto-Assets Regulation (MiCA) with the GENIUS Act framework could position London as a competitive hub.
The contrast between aggressive civil enforcement and perceived inaction in the face of a confirmed exploit remains a focal point for critics questioning how regulated issuers exercise their freeze authority.
The post Circle Explains Why It Didn’t Freeze Stolen USDC in the $275 Million Drift Hack appeared first on BeInCrypto.

Key Insights
- PEPE price is locked inside a tight trading range, with sellers holding resistance levels and obstructing the path to higher prices.
- Important Fibonacci resistance levels and downtrends in the moving average lines reflect the current bearish structure in the markets.
- On-chain metrics such as open interest and netflow figures have been deteriorating lately.
Pepe Treading in Narrow Consolidation
Pepe (PEPE) is consolidating in a tight range, indicating indecisiveness in the market. Pepe has been trading within the $0.000036-$0.000040 range.
Neither side has made a significant move that would drive the price to decisively break out of the range. Neither buyers nor sellers have conviction, resulting in sideways price action.
Although the token is treading within the narrow range, it still represents an overall bearish formation. This is because the sideways price action has developed after a period of downtrend, indicating that it might just be a retracement. The hesitancy of market participants does not seem to allow for large movements in the price.
Bearish Price Structure Intact
The general trend still favors the bears, as the PEPE coin has been posting lower tops and lower bottoms on its daily chart. This price action reflects continued selling pressure, since each rally fails to exceed its former highs. Moreover, the price continues to trade beneath important exponential moving averages, which keep declining in value.
Rejections from these important support levels also indicate continued pressure from the sellers. Each move upwards is faced with significant selling interest, implying that traders view rallies as a chance for liquidation rather than for accumulation. Unless the price of PEPE rises above these levels, any sustained rebound may not occur.
Resistance Levels From Fibonacci Prohibit Further Upside Progress
Resistance levels persistently prevent any potential progress in terms of an upside move. In particular, the first resistance level located within the range from $0.000040 to $0.000041 corresponds to the 0.236 Fibonacci retracement.
As can be seen, multiple attempts to surpass this resistance level did not succeed, implying a high amount of selling pressure at this point.
Besides, further resistance levels located at $0.000047 and $0.000051 provide extra resistance barriers. Overcoming them requires an additional amount of buying force to push PEPE higher. Unless PEPE successfully passes these resistance levels, all upward movements should be regarded as temporary.
As far as downside potential is concerned, the price level of $0.000036 provides short-term support. Nonetheless, the level itself is getting weaker due to constant pressure. Consequently, a breakdown below $0.000036 would set a downside target at $0.000031.
Weakening Demand Reflected in On-Chain Data
The on-chain metrics still point toward caution regarding PEPE’s future performance. Open interest has fallen from its peaks recorded in early 2025, implying lower trading activity among market participants and lesser speculation. This trend shows that there are fewer traders interested in opening long leveraged positions, which may indicate their lack of confidence.
Furthermore, the spot netflows have behaved erratically; there were flows of funds even when the price was decreasing, which implies that the purchases were sporadic and uncoordinated. Recently, there has been a little decline in netflow and price levels, supporting the assumption of lower demand.
Overall, the on-chain analysis does not provide many positive signals, with no signs of increased demand. Therefore, the chances of a successful breakout are rather low at the moment.
Breakout or Breakdown: Volatility Ahead
With PEPE trading in a range at the moment, this means a breakout or breakdown is likely near. Typically, consolidation periods like these tend to lead to an increase in volatility, which makes this upcoming breakout or breakdown even more crucial.
If PEPE is able to break out above $0.00004150, it could mean short-term momentum could change and see higher targets being reached such as $0.000047 or even $0.000056. Breaking above the $0.00004150 price point will need volume to confirm it.
However, if PEPE fails to hold the support at $0.000036, then it could mean more selling pressure is imminent and the price could move lower towards $0.000031 or lower.
Iran’s parliament speaker publicly demanded a Lebanon ceasefire and the release of frozen Iranian assets before weekend peace talks in Islamabad can begin.
The statement from Mohammad Bagher Ghalibaf arrived just hours before VP JD Vance departed for Pakistan-brokered negotiations, injecting fresh uncertainty into a fragile diplomatic window.
Bitcoin’s Ceasefire Rally Faces a Test
Bitcoin (BTC) surged 5% to $72,700 on April 7 after President Trump announced a two-week ceasefire with Iran via Truth Social.
The move triggered roughly $595 million in crypto futures liquidations, with short sellers absorbing the bulk of the losses.
As of this writing, BTC traded just shy of $73,000, riding the wave of ceasefire news and easing inflation fears that had weighed on risk assets for weeks.
However, a Bybit and Block Scholes derivatives report released April 10 found that sentiment remains cautious. Options markets show narrowing downside premiums without a decisive bullish flip.

Preconditions Put Talks at Risk
Ghalibaf, Speaker of the Parliament of Iran, stated that two “mutually agreed” conditions from the ceasefire framework remain unfulfilled.
Iran considers the Lebanon ceasefire and the release of assets non-negotiable before sitting down with the US delegation.
Trump simultaneously told the New York Post that US warships are being reloaded in case talks fail.
The White House told Fox News separately that the president remains “optimistic a deal can be reached.”
A CNN report also indicated Trump had a tense phone call with Israeli PM Benjamin Netanyahu shortly before Israel announced steps toward direct Lebanon ceasefire talks. Sources suggest Trump pressured Netanyahu to de-escalate, partly to satisfy Iran’s preconditions.
What This Means for BTC
BTC now sits at the top of the $65,000 to $73,000 range that has contained trading since the conflict began in late February.
A successful outcome from Islamabad could push BTC toward $75,000 to $80,000 as geopolitical risk premiums unwind further.
However, a collapse of talks risks renewed Hormuz disruptions and a possible retest of $68,000 support.
The next 48 hours of diplomacy will likely determine whether this week’s relief rally holds or reverses.
“I think it’s gonna be positive. We’ll see. As POTUS said: if Iranians are willing to negotiate in good faith, we’re certainly willing to extend the open hand! If they try to PLAY us, they’ll find the negotiating team isn’t very receptive. We’re gonna try to have a positive negotiation. The president has given us some pretty clear guidelines,” US Vice President JD Vance stated.
The post Why This Weekend Could Break Bitcoin or Send It to $80,000 appeared first on BeInCrypto.


Hyperliquid’s HYPE token is trading around $40.3 on April 10, 2026, up roughly 3.9% in 24 hours and about 10% week‑on‑week after rebounding from early April lows near $35.6.
Summary
- HYPE trades around $40.3, up roughly 3.9% on the day and about 10% over the week, with spot volume near $250M against a circulating market cap around $9B.
- Hyperliquid controls an estimated 66–73% of decentralized perps flow, with ~$50B in weekly volume and $6–$10B in open interest, tying HYPE to real protocol usage.
- Only ~24.8% of HYPE’s 1B max supply is circulating; its fully diluted value clocks in near $35–$39B, implying significant future unlock pressure.
Hyperliquid’s (HYPE) 4-hour chart shows price grinding higher inside a constructive channel, with HYPE still roughly 32% below its all‑time high around $59.3 but supported by rising volume and a bullish, not yet overbought, momentum profile. On the fundamental side, Hyperliquid controls an estimated 66–73% of decentralized perps volume with about $50 billion in weekly trading and 100,000+ weekly active users, suggesting structural demand for HYPE as long as platform open interest near $6–$10 billion remains elevated.
Hyperliquid’s HYPE token is trading at about $40.3 on April 10, 2026, according to data from CryptoRank and other price trackers, up roughly 3.9% over the past 24 hours and extending a climb from early April lows near $35.6. The move leaves HYPE about 32% below its all‑time high of roughly $59.3 set in September 2025, but with a current market capitalization in the $9.6–$13.0 billion range and 24‑hour spot volume between $225 million and $285 million, signaling persistent two‑way flow rather than a thin meme spike.
On TradingView, the HYPEUSDT chart shows price holding a broad uptrend from the 2025 lows, with recent weekly candles printing higher lows above the $35–$36 zone and intraday action clustering in the $38–$41 band. Short‑term analyses on the platform highlight the $39–$40 area as a key demand zone, with some traders targeting initial upside toward $42–$44 if support holds. Momentum remains trend‑positive but not yet in the classic parabolic danger zone: technical dashboards flag RSI as bullish but shy of the 70+ overbought threshold on higher timeframes, while MACD and other trend indicators remain in buy territory.
Fundamentally, HYPE tracks a real business rather than pure narrative. CoinStats’ April investment analysis notes that Hyperliquid has become a dominant decentralized perpetuals venue, with an estimated 66–73% share of on‑chain perps trading, roughly $50 billion in weekly volume and more than 100,000 weekly active users. That positioning is reflected in derivatives data, where aggregated futures dashboards show Hyperliquid open interest frequently in the $6–$10 billion range, with peaks near $9.7 billion during prior volatility spikes — a scale that tends to correlate with demand for the protocol token.
At the token level, however, the growth story comes with a clear caveat. As of April 1, only about 24.8% of HYPE’s maximum 1 billion supply is circulating, with a circulating market cap near $8.7–$9.6 billion versus a fully diluted valuation around $35–$39 billion, implying roughly 4x potential dilution as remaining tokens unlock. That gap matters for medium‑term price predictions: as long as Hyperliquid’s share of perps volume and on‑platform open interest keeps growing, structural demand may offset some unlock pressure, but slower activity or venue competition could see new supply weigh more heavily on price.
Near term, the technical and fundamental mix leans slightly bullish. The token is riding a constructive trend above key support in the high‑$30s, momentum is positive rather than euphoric, and platform usage metrics remain strong. A clean break below the $35–$36 area on rising volume would undermine that thesis and open room for a deeper mean‑reversion toward prior consolidation levels, while sustained closes above the low‑$40s, backed by continued growth in open interest and weekly volume, would keep $50+ back on the table as a medium‑term target.


The Ethereum Layer 2 network raised its L1 data cost scalars 1,280x over six days before rolling them back yesterday.
Users on Scroll, an Ethereum Layer 2 (L2) network, paid more than $50,000 in excess transaction fees over roughly four days after the team behind the project repeatedly raised the parameters that determine how much users pay for posting data to Ethereum, according to an analysis published by L2BEAT.
The overcharges stemmed from six manual increases to two fee multipliers on Scroll’s gas price oracle, the smart contract that calculates the Layer 1 data portion of every transaction’s cost. Each update raised the previous value by 2x to 10x, compounding to 1,280x the original baseline by April 5, L2BEAT said. On April 9, the team slashed both multipliers by 160x.
The baseline cost for all roughly 139,000 affected transactions would have been just $280. Instead, users collectively paid upward of $50,000, with automated bots accounting for the vast majority.
Scroll has not publicly addressed the findings at the time of writing.
Etherfi Cash bots, which are still running during the protocol’s ongoing migration to Optimism, accounted for roughly $35,000, or 66% of the excess, per L2BEAT. Scroll’s own oracle relayer paid approximately $5,200, with LayerZero, Succinct, and other bots making up the rest.
The issue was first flagged by a pseudonymous developer running a Succinct relayer, who posted on X that their transaction costs had jumped from $0.002 to over $20.
“Scroll was subsidizing L1 DA costs and is now correcting to sustainable pricing?” the developer asked. “And there’s no users on Scroll except us, so we’re paying full price for it?”
Crypto research firm Kairos Research noted that the fee spike appeared to coincide with etherfi’s migration to Optimism. When etherfi was Scroll’s dominant app, total daily transaction fees from its products averaged about $250. After the multiplier increases began on March 31, that figure jumped to roughly $16,000 per day.
L2BEAT clarified that the overcharges were not a sequencer issue, as the L1 gas prices reported by the oracle were accurate. The entire overcharge came from the multiplier increases, which went through a separate governance path involving the team’s multisig wallet.
The episode raises the question of whether Scroll had been running fees below cost to retain users, a common practice among L2s competing for activity, and abruptly repriced once its largest fee contributor departed.
Scroll’s total value locked (TVL) sits at just $24 million, according to DeFiLlama, down 96% from its peak of $585 millon in October 2024.
This article was written with the assistance of AI workflows. All our stories are curated, edited and fact-checked by a human.
Reports of ‘suspicious items’ found as emergency crews rush to area

Genco Shipping: Freight Rates Offer Hope, But The Cycle Isn't On Your Side
Justin Sun Faces $11M WLFI Drop as World Liberty Rejects Fears


-

 Business5 days ago
Three Gulf funds agree to back Paramount’s $81 billion takeover of Warner, WSJ reports
-

 Sports6 days ago
India men’s 4x400m and mixed 4x100m relay teams register big progress | Other Sports News
-

 Politics3 hours ago
US brings back mandatory military draft registration
-

 Business7 days ago
Expert Picks for Every Need
-

 Tech3 days ago
How Long Can You Drive With Expired Registration? What Florida Law Says
-

 Business5 days ago
No Jackpot Winner, Prize to Climb to $231 Million
-

 Fashion4 days ago
Massimo Dutti Offers Inspiration for Your Summer Mood Board
-
 Sports4 hours ago
Man United discover Nico Schlotterbeck transfer fee as defender reaches Dortmund agreement
-

 Fashion4 hours ago
Weekend Open Thread: Veronica Beard
-

 Fashion3 days ago
Let’s Discuss: DEI in 2026
-

 Crypto World2 days ago
Bitcoin recovers as US and Iran Agree a Ceasefire Deal
-

 Business6 days ago
Akebia Therapeutics, Inc. (AKBA) Discusses Pipeline Progress and Strategic Focus on Kidney Disease Treatments at R&D Day – Slideshow
-

 Crypto World1 day ago
Canary Capital Files SEC Registration for PEPE ETF
-

 Business9 hours ago
OpenAI Halts Stargate UK Data Centre Project Over Energy Costs and Copyright Row
-

 Politics7 days ago
The UK should not pay a penny in slavery reparations
-

 Business36 minutes ago
Tesla Model Y Tops China Auto Sales in March 2026 With 39,827 Registrations, Beating Cheaper EVs and Gas Cars
-

 NewsBeat7 days ago
Kemi Badenoch talks ‘spring cleaning’ Reform defections
-

 Tech5 days ago
Samsung just gave up on its own Messages app
-

 Tech5 days ago
Haier is betting big that your next TV purchase will be one of these
-

 Tech5 days ago
The Xiaomi 17 Ultra has some impressive add-ons that make snapping photos really fun
You must be logged in to post a comment Login