
Crypto World
Western Digital (WDC) Stock: $4 Billion Buyback Sends Shares Higher

TLDR
- Western Digital’s board approved an additional $4 billion for share repurchases on top of existing authorization
- The company had approximately $484 million remaining from its prior $2 billion buyback authorization from May 2024
- WDC shares rose about 5% in premarket trading following the announcement
- Stock has surged 57% year-to-date and more than tripled in value during 2024
- Global memory chip shortage is driving up prices and extending lead times as demand from AI and consumer electronics companies increases
Western Digital announced Tuesday that its board has greenlit an extra $4 billion for stock buybacks. The move comes as demand for memory chips used in AI servers continues to climb.
Western Digital Corporation, WDC
The company’s shares jumped roughly 5% in premarket trading. That adds to an already impressive 57% gain so far this year.
Last year was even better. The stock more than tripled in value during 2024.
As of Monday, Western Digital had about $484 million left from its previous buyback authorization. That program was worth $2 billion and started in May 2024.
CEO Irving Tan explained the thinking behind the decision. “Our capital allocation strategy balances reinvestment in the business, debt reduction, and capital returns to shareholders,” he said.
The new authorization takes effect immediately. But the company kept its options open.
Timing Depends on Market Conditions
Western Digital noted that the amount and timing of actual share repurchases will depend on market conditions. Other corporate considerations will also play a role.
The company can suspend or discontinue the program whenever it wants. That’s standard language for buyback programs.
The announcement comes as memory chip makers are riding a wave of demand. AI applications and consumer electronics companies are competing for limited supplies.
This competition has pushed prices higher. Lead times have also stretched out as manufacturers work to increase production capacity.
Last week, Western Digital released guidance that beat Wall Street expectations. The company forecast fiscal third-quarter revenue and profit above analyst estimates.
That optimism stems from sales of hard drives and flash storage for AI servers. These products are in high demand as companies build out their AI infrastructure.
Memory Chip Shortage Drives Growth
A global shortage of memory chips has intensified the competitive landscape. AI companies need these chips for their servers.
Consumer electronics makers also need them for their products. The result is a supply crunch that shows no signs of easing soon.
Manufacturers are scrambling to ramp up capacity. But building new production facilities takes time and massive investment.
The shortage has been good news for Western Digital and its peers. Memory product makers like Seagate Technology and others have seen their stocks soar over the past year.
Western Digital’s strong stock performance reflects this trend. The company is benefiting from its position in the memory chip market.
The $4 billion buyback authorization gives management flexibility. They can repurchase shares when they see value in the market.
Share buybacks can boost earnings per share by reducing the number of shares outstanding. They also signal management’s confidence in the company’s future.
Western Digital ended Monday with about $484 million available under its previous authorization. The new $4 billion adds substantially to that amount.


Bitcoin spot ETFs in the United States extended their inflow streak to seven consecutive days on Monday, marking the longest run of fresh capital since late 2025. Data compiled by SoSoValue show spot BTC ETFs adding $199.4 million, lifting the seven-day sum to roughly $1.2 billion. The persistence of inflows signals renewed institutional interest in regulated access to crypto exposure, even as total year-to-date (YTD) inflows remain negative when measured against earlier peaks. In parallel, the broader crypto ETF ecosystem posted mixed but resilient momentum across assets, underscoring a cautious but steady reallocation toward crypto-linked vehicles.
Within the same framework, total trading volumes for spot BTC ETFs slipped to about $2.6 billion, while assets under management (AUM) climbed to $96.7 billion. The dynamic suggests that new money is entering through regulated vehicles, but the macro cadence of inflows remains softer than the high-water marks seen in late 2025. The year-to-date balance continues to tilt negative, with roughly $1.8 billion in cumulative monthly outflows offset by about $1.7 billion in cumulative inflows. The divergence highlights that while the appetite for regulated crypto access persists, investors are weighing risk, regulatory clarity, and the path to profitability as markets evolve.
The rebound in Bitcoin ETFs coincides with broader strength in crypto investment products. Across the sector, crypto exchange-traded products (ETPs) accrued about $2.7 billion over the previous three weeks, lifting year-to-date inflows to around $1.2 billion, according to data cited in industry trackers. The pattern aligns with a gradual reset in risk sentiment as investors reassess the trajectory of mainstream crypto assets, seeking diversified exposure through regulated structures rather than direct custody. The momentum also underscores ongoing demand for bottom-line transparency and on-ramp infrastructure, amid shifts in macro liquidity and regulatory expectations.
Key takeaways
- Bitcoin spot ETFs added $199.4 million on Monday, extending a seven-day inflow streak to about $1.2 billion and signaling renewed institutional appetite for regulated access to BTC exposure.
- Ether ETFs drew $138.3 million—the strongest weekly print since March 4—while Solana ETFs brought in $17.8 million, marking the largest weekly inflows for SOL in the same period.
- XRP ETFs posted $4.64 million in inflows for the period, the first positive print after an eight-day losing streak, even as overall XRP ETF outflows totaled $56.8 million from March 5–16.
- Bitcoin ETFs remain the standout driver of the trend, with total assets under management near $96.7 billion and weekly volumes pacing at a subdued level relative to previous peaks.
- Ether ETFs continue to lag on a year-to-date basis, ceding $364.5 million in net outflows YTD after inflows of $358.5 million in March and earlier outflows in January and February.
Tickers mentioned: $BTC, $ETH, $XRP, $SOL
Sentiment: Neutral
Market context: The ETF rebound mirrors a broader, cautious reacceleration in crypto investment products, with multi-week inflows suggesting a measured return of interest from institutions and a willingness to diversify exposures through regulated vehicles as volumes trend modestly higher and risk sentiment improves.
Why it matters
The sustained inflows into spot BTC ETFs, and the broader uptick across Ether and Solana products, point to a disciplined market response to evolving regulatory clarity and infrastructure. Investors appear to be seeking regulated entry points to digital assets, balancing the desire for crypto exposure with risk controls, liquidity standards, and clear reporting. The seven-day BTC inflow run, coupled with an AUM near $97 billion, underscores that institutions remain willing to place capital into products that offer price discovery, custody guarantees, and transparent settlement frameworks.
At the same time, the divergence between Bitcoin’s robust ETF inflows and Ether’s persistent YTD outflows highlights a nuanced allocation dynamic among asset classes within crypto. While BTC remains the marquee entry for many institutions, Ether’s ongoing pressure may reflect a combination of concerns about network congestion, macro capital allocation, and regulatory posture around major ETH-related developments. The Solana narrative—its best weekly inflow in this cycle—adds a complementary vector, suggesting that select layer-1 ecosystems with active developer activity and practical use cases continue to attract capital through dedicated ETFs.
In a broader sense, the data point to a maturing market for regulated crypto exposure. As more assets gain ETF and ETP coverage, the space benefits from standardized liquidity, clearer valuation references, and the ability to participate in professional portfolios without direct custody. Yet the year-to-date performance gap—with Ether ETFs in negative territory and XRP experiencing mixed inflows—serves as a reminder that the sector remains sensitive to macro shifts, regulatory signals, and shifting risk appetites among sophisticated buyers and fund managers.
What to watch next
- Next week’s BTC ETF inflow data: Will the seven-day streak extend further, and how will AUM adjust in response to price volatility?
- Ether ETF performance: Will the YTD outflows abate, and can ETH-based products reclaim momentum as network fundamentals improve?
- Solana ETF flows: Monitor whether SOL continues to post outsized weekly inflows, signaling renewed appetite for ecosystem exposure.
- XRP ETF trajectory: Track subsequent inflows/outflows after the March period, as regulatory clarity and market sentiment evolve.
- Regulatory and product developments: Any new approvals or structural changes to US crypto ETFs that could alter investor demand.
Sources & verification
- SoSoValue data on US BTC spot ETF inflows and seven-day totals, including the $199.4 million print on Monday.
- SoSoValue asset page for US BTC spot ETFs: https://sosovalue.com/assets/etf/us-btc-spot
- Three-week crypto ETP inflow flow data referenced in market coverage: https://cointelegraph.com/news/crypto-etp-1-billion-inflows-three-straight-weeks-gains
- Past inflow reference for the October 2025 run and related context: https://cointelegraph.com/news/bitcoin-etfs-record-6-day-inflow-streak-longest-since-october
- Crypto ETF and asset mix commentary noting Ether ETF underperformance and SOL inflows: https://cointelegraph.com/news/bitcoin-rebound-bernstein-long-term-holder-base
ETF inflows persist as spot BTC ETFs extend seven-day streak
Bitcoin (CRYPTO: BTC) has continued to draw institutional interest as US spot BTC ETFs record their seventh straight day of inflows, lifting the weekly total to around $1.2 billion. The latest $199.4 million addition arrived on Monday, reinforcing a narrative of growing comfort with regulated exposure to digital assets within portfolio allocations. While the pace of fresh money remains well short of the lofty peaks seen during the October 2025 surge, the pattern matters for liquidity and price discovery in a market that has historically been driven by spot demand, futures hedging, and macro liquidity cycles.
Across altcoins, the appetite looks uneven but constructive. Ether (CRYPTO: ETH) led inflows among non-Bitcoin ETFs with about $138.3 million, the strongest weekly print since early March. Solana (CRYPTO: SOL) followed with approximately $17.8 million, marking the largest weekly inflow for SOL in the current cycle. XRP (CRYPTO: XRP) posted $4.64 million in fresh inflows after an eight-day stretch of outflows, signaling a potential re-engagement with regulatory-friendly exposure to ripple-linked assets. Despite the upticks, XRP ETFs still faced a net outflow of $56.8 million for the March 5–16 window, underscoring that investor sentiment remains split across the crypto spectrum.
Overall, Bitcoin ETFs have been the most durable source of capital, with total assets under management approaching $96.7 billion and trading volumes hovering around the $2.6 billion mark for the latest reporting period. In contrast, Ether ETFs are underwater for the year, with approximately $364.5 million in net outflows so far in 2026, following March inflows of $358.5 million and earlier sizeable movements in January and February. The broader market narrative—driven by ongoing institutional testing of regulated exposure, macro liquidity, and the evolving crypto regulatory landscape—remains a critical factor shaping flows across BTC, ETH, XRP, and SOL.
As the sector recalibrates, market participants are watching whether the flow environment remains constructive, particularly given the resilience seen in three straight weeks of positive crypto ETP inflows. The data points, while not guaranteeing sustained rallies, do suggest a continued willingness to explore crypto exposure through regulated vehicles, a trend that could influence pricing dynamics, risk management strategies, and the pace of product innovation in the months ahead. The coming weeks will be telling as new data illuminate the balance between cautious optimism and the persistent volatility that characterizes crypto markets.
Solana just set a new stablecoin liquidity record. Supply surged past $15.58 billion in February.
At the same time, Open Interest climbed from $4.9 billion to nearly $6 billion in a matter of weeks. That is $1 billion in fresh leverage entering the system while sideline capital sits at all-time highs.
Transaction volumes are up 300% year-over-year. This is real settlement activity, not just speculative rotation.
But the leverage building underneath is the real story. Massive dry powder plus rising derivative exposure is exactly how volatility squeezes get built.
Stablecoin Liquidity Signals Dry Powder: What the Data Shows
Solana’s stablecoin dominance is the foundation of this entire setup.
USDC transfer volume on the network jumped 300% year-over-year. And the median transaction fee stayed near $0.00047 throughout that volume spike.
Solana now holds roughly 36% of global stablecoin transaction volume. That is not a vanity metric. Stablecoins sitting on-chain represent potential buy pressure that does not need to bridge in from anywhere else.

The derivatives side is where it gets dangerous.
Open Interest climbed 22% in a short window, from $4.9 billion to nearly $6 billion. Fresh capital is entering, not just short covering. That validates the trend but also loads the gun for a liquidation cascade.
XRP flipped BNB in open interest right before a major volatility event. High OI is always a double-edged sword.
Watch funding rates closely. If OI pushes above $6 billion while price consolidates, a 5% move in either direction could trigger $500 million in liquidations.
The floor is strong. The ceiling is loaded. Something is going to give.
Can Solana Crypto Price Push Higher? Key Levels to Watch
SOL is printing higher highs and higher lows. Buyers are defending strength instead of fading it. The structure is constructive.
But $100 to $110 is the wall that matters.
If stablecoins rotate into risk assets and SOL clears $110 with volume, the path to $125 opens up. The stablecoin supply sitting on-chain provides the fuel to sustain that move.
The danger is the OI acting as a heavy anchor. A rejection at $105 could trigger a long squeeze and flush over-leveraged positions fast. First major support lands at $88. Lose that and the structure weakens significantly.
Watch $105 on the daily. Close above it and the squeeze resolves upward. Lose $92 and the bullish leverage thesis falls apart.
Discover: The best new crypto in the world
The post Solana Crypto Stablecoin Liquidity Hits Record Highs as Open Interest Climbs appeared first on Cryptonews.


Stablecoin payments infrastructure firm TransFi has raised $19.2 million to expand its operations.
Summary
- TransFi raised $19.2 million in a Series A round led by Turing Financial Group to expand its stablecoin-based cross-border payments infrastructure.
- The company plans to deploy the funds across emerging markets while strengthening regulatory licensing and scaling enterprise merchant adoption.
According to a recent announcement, the company raised $14.2 million in Series A equity along with a $5 million committed liquidity facility. The funding round was led by Turing Financial Group.
TransFi will use the capital to fund expansion across South-East Asia, South Asia, the Middle East, LatAm and Africa. It plans to pursue deeper regulatory licensing and scale its enterprise merchant acquisition.
A portion of the funds would also be used to strengthen AI-first operations and product development across B2B payments, checkout infrastructure and stablecoin orchestration.
“This Series A allows us to scale our infrastructure across high-friction markets and continue proving that stablecoin-enabled payments are not the future, they are already happening,” said Raj Kamal, Co-Founder and CEO of TransFi.
TransFi positions itself as an alternative to traditional correspondent banking and SWIFT-based systems and said it is on track to achieve roughly $5 billion in processed transaction volume by the end of fiscal year 2026. The company currently operates in over 70 countries and supports more than 40 fiat currencies and over 100 cryptocurrencies.
Stablecoin usage is rising
As previously reported by crypto.news, stablecoin supply has surpassed $315 billion, led by Tether, which continues to dominate the market by share. Other major players, such as Circle, have also expanded their presence across payments and financial applications.
A number of traditional financial firms, including Mastercard and Standard Chartered, have also taken an interest in the growing stablecoin sector.
Meanwhile, several jurisdictions across the globe have started introducing regulatory frameworks and legislation.


U.S. regulators’ first joint guidance on applying securities laws to different types of crypto tokens failed to provide enough impetus to lift bitcoin , the largest, above $75,000.
The interpretive guidance from the Securities and Exchange Commission (SEC) and the Commodity Futures Trading Commission (CFTC), which doesn’t carry the weight of a formal rule, classified crypto tokens into five distinct categories: digital commodities, digital collectibles, digital tools, stablecoins and digital securities, and removed a major source of market uncertainty.
The stance marks a shift from the existing case-by-case enforcement, making it clear which tokens are considered securities and which are not, and is expected to give issuers and exchanges much‑needed clarity on how different assets will be regulated under federal law.
“The practical effect is a more coherent and less burdensome regulatory environment. Legal uncertainty declines, the risk of retroactive enforcement is reduced, and compliance becomes more predictable,” Tagus Capital said.
“This supports institutional participation, exchange development, and product innovation, while improving market structure through lower compliance costs and better price discovery. Although the guidance stops short of binding law and still leaves room for case-by-case interpretation, it sets a strong template for future legislation and may accelerate global regulatory convergence.”
Even so, bitcoin was unable to build on this month’s bounce from $65,000, which at one point on Tuesday, saw the price approach $76,000. The cryptocurrency was largely unchanged over the past 24 hours.
Other major tokens such as XRP (XRP), ether (ETH) and solana (SOL) also saw choppy price action, with the CoinDesk 20 Index down 0.3%.
According to analysts, $75,000 is a key resistance level for bitcoin.
“On the upside, $75,400–$76,000 continues to act as resistance,” Vikram Subburaj, CEO of India-based crypto exchange Giottus said in an email. “Bitcoin needs to hold above this range to signal stronger momentum.”
One possible reason for the restraint could be the Federal Reserve’s interest-rate decision due later Wednesday. The U.S. central bank is widely expected to hold rates unchanged in the 3.5% to 3.75% range. This leaves traders focused less on the decision and more on the interest‑rate projections in the wake of the Iran war‑related energy price shock.
The rate decision, policy statement, and economic projections will hit the wires at 2 p.m. ET followed by Chairman Jerome Powell’s press conference a half hour later.

Yesterday, BTC/USD rose above the $75k level, thereby setting a new high for March. The last time Bitcoin traded at such levels was in early February.
Why is Bitcoin Rising?
Bitcoin’s appeal appears to be increasing due to a combination of factors, including:
→ ongoing military conflict in the Middle East;
→ expectations of rising inflation and upcoming Federal Reserve decisions on interest rates.
According to on-chain data, March has seen capital inflows into spot Bitcoin ETFs. At the same time, media reports indicate that major corporate players (notably MicroStrategy) have purchased approximately $1.57 billion worth of Bitcoin, creating strong organic demand.
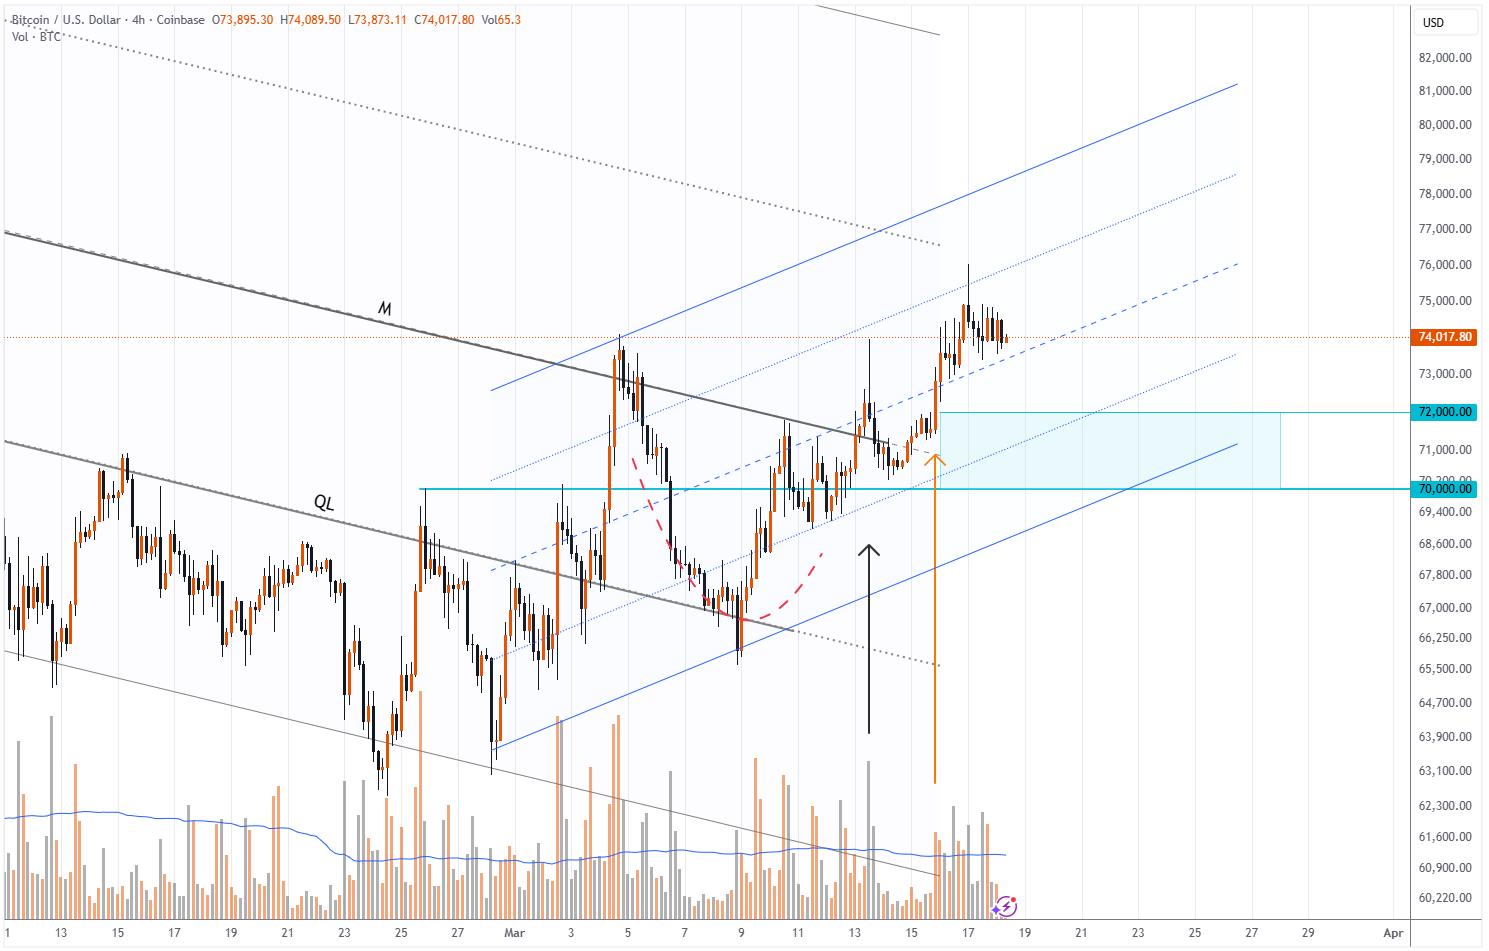
Technical Analysis of BTC/USD
On 5 March, when analysing Bitcoin’s price movements within a broad descending channel, we:
→ noted that the bullish impulse at the beginning of March led to a breakout above the QL resistance line, as well as the psychological $70k level;
→ highlighted that the median line M could act as a barrier to further gains;
→ suggested a potential pullback scenario.
Indeed, since then (as shown by the red trajectory), Bitcoin has undergone a fairly deep correction, reversing lower from the M line. Notably, the QL line subsequently acted as support.
Trading volume analysis (based on Coinbase data) shows that:
→ on 13 March, bearish activity intensified, resulting in a long upper wick on a high-volume candle;
→ on 15–16 March, the price advanced alongside rising volumes, with candles closing near their highs.
This can be interpreted as strengthening demand: buyers are pushing sellers out of the $70–72k zone, which may serve as support in the near term.
Given the above, a continued upside scenario cannot be ruled out, in which Bitcoin maintains an upward trajectory within the blue channel.
FXOpen offers the world’s most popular cryptocurrency CFDs*, including Bitcoin and Ethereum. Floating spreads, 1:2 leverage — at your service (additional fees may apply). Open your trading account now or learn more about crypto CFD trading with FXOpen.
*Important: At FXOpen UK, Cryptocurrency trading via CFDs is only available to our Professional clients. They are not available for trading by Retail clients. To find out more information about how this may affect you, please get in touch with our team.
This article represents the opinion of the Companies operating under the FXOpen brand only. It is not to be construed as an offer, solicitation, or recommendation with respect to products and services provided by the Companies operating under the FXOpen brand, nor is it to be considered financial advice.
EUR/USD is attempting a recovery wave from the 1.1400 zone. USD/CHF climbed higher above 0.7900 before it started a downside correction.
Important Takeaways for EUR/USD and USD/CHF Analysis Today
· The Euro declined toward 1.1400 before it started a recovery wave against the US Dollar.
· There was a break above a major bearish trend line with resistance at 1.1500 on the hourly chart of EUR/USD at FXOpen.
· USD/CHF climbed higher above 0.7850 and 0.7900 before it faced hurdles.
· There was a break below a bullish trend line with support at 0.7870 on the hourly chart at FXOpen.
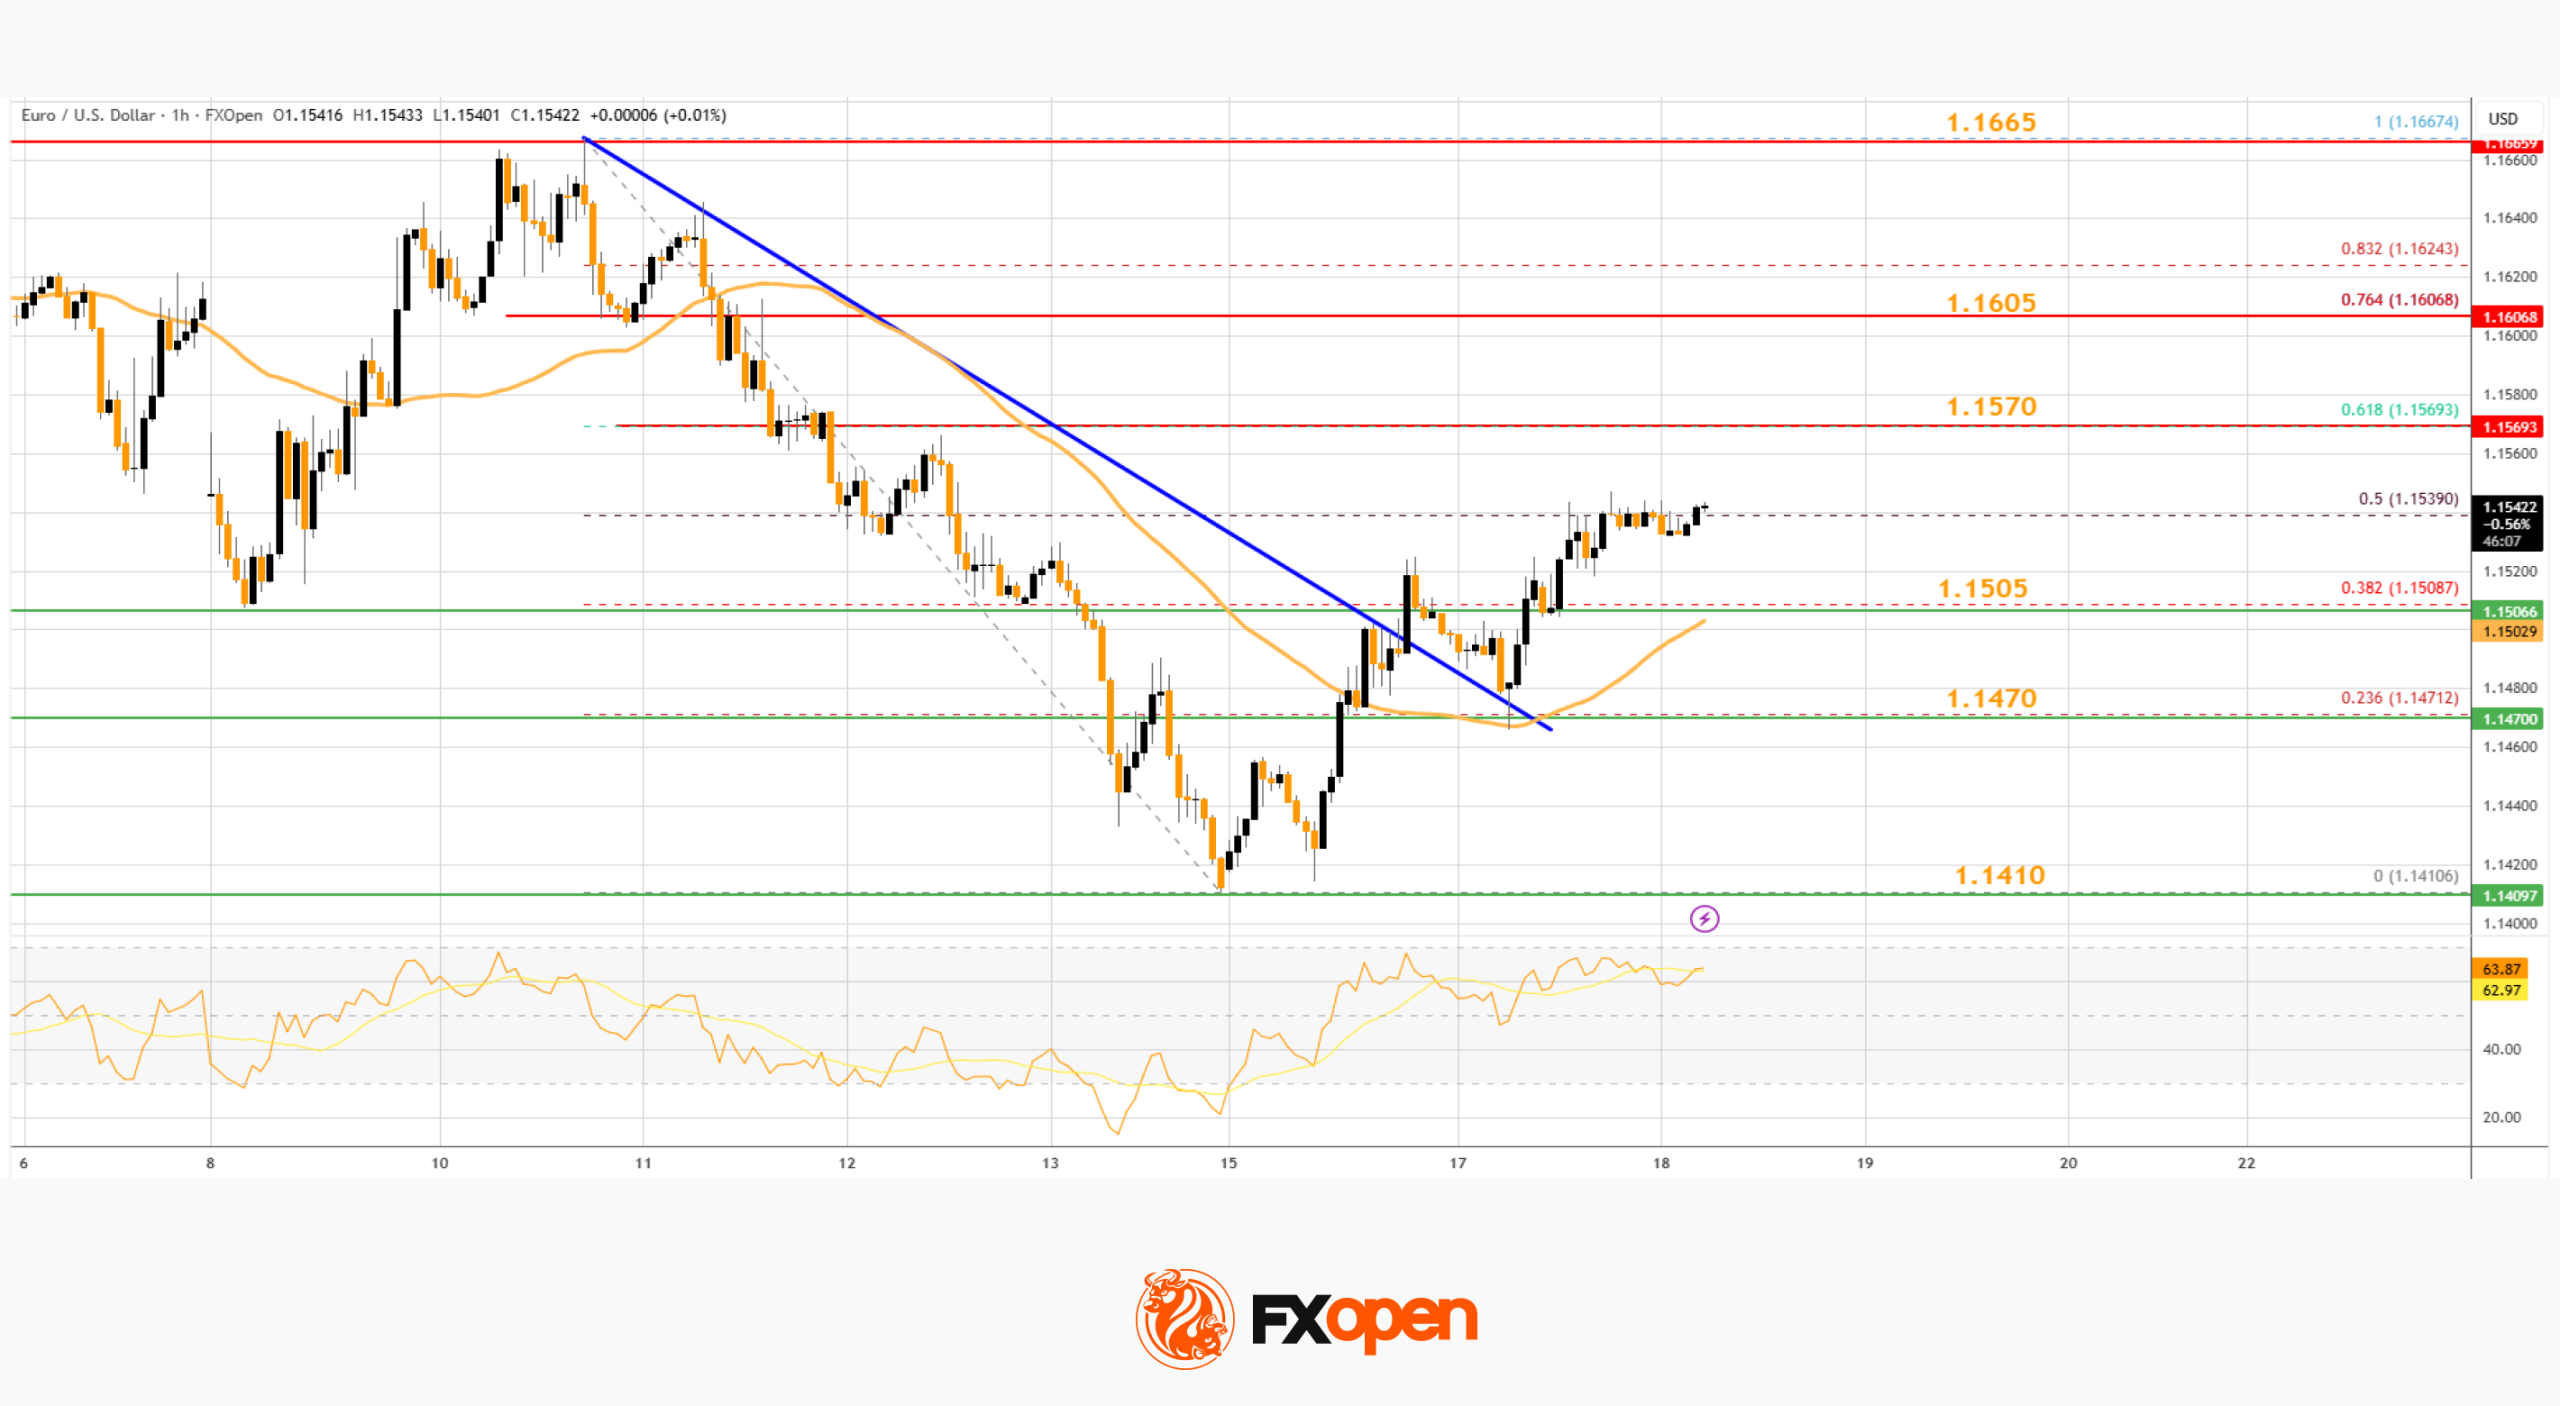
EUR/USD Technical Analysis
On the hourly chart of EUR/USD at FXOpen, the pair extended the decline below 1.1500. The Euro even declined below 1.1440 before the bulls appeared against the US Dollar.
The pair tested 1.1410 and recently started a recovery wave. There was a move above 1.1450 and 1.1480. The pair climbed above the 38.2% Fib retracement level of the downward move from the 1.1667 swing high to the 1.1410 low.

More importantly, there was a break above a major bearish trend line with resistance at 1.1500. The pair is now trading above 1.1520 and the 50-hour simple moving average. Immediate hurdle on the EUR/USD chart is near the 61.8% Fib retracement at 1.1570.
The first key breakout zone sits at 1.1605. An upside break above 1.1605 might send the pair toward 1.1665. Any more gains might open the doors for a move toward the 1.1700 zone. If there is a fresh decline, the pair might find bids near 1.1505.
The next major support is 1.1470. A downside break below 1.1470 could send the pair toward 1.1410. Any more losses might send the pair to 1.1360.
USD/CHF Technical Analysis
On the hourly chart of USD/CHF at FXOpen, the pair started a decent increase from 0.7750. The US Dollar climbed above the 0.7800 handle against the Swiss Franc.
The bulls were able to pump the pair above the 50-hour simple moving average and 0.7850. Finally, the pair tested 0.7920. A high was formed near 0.7923 and the pair is now correcting some gains. The pair dipped below the 38.2% Fib retracement level of the upward move from the 0.7748 swing low to the 0.7923 high.
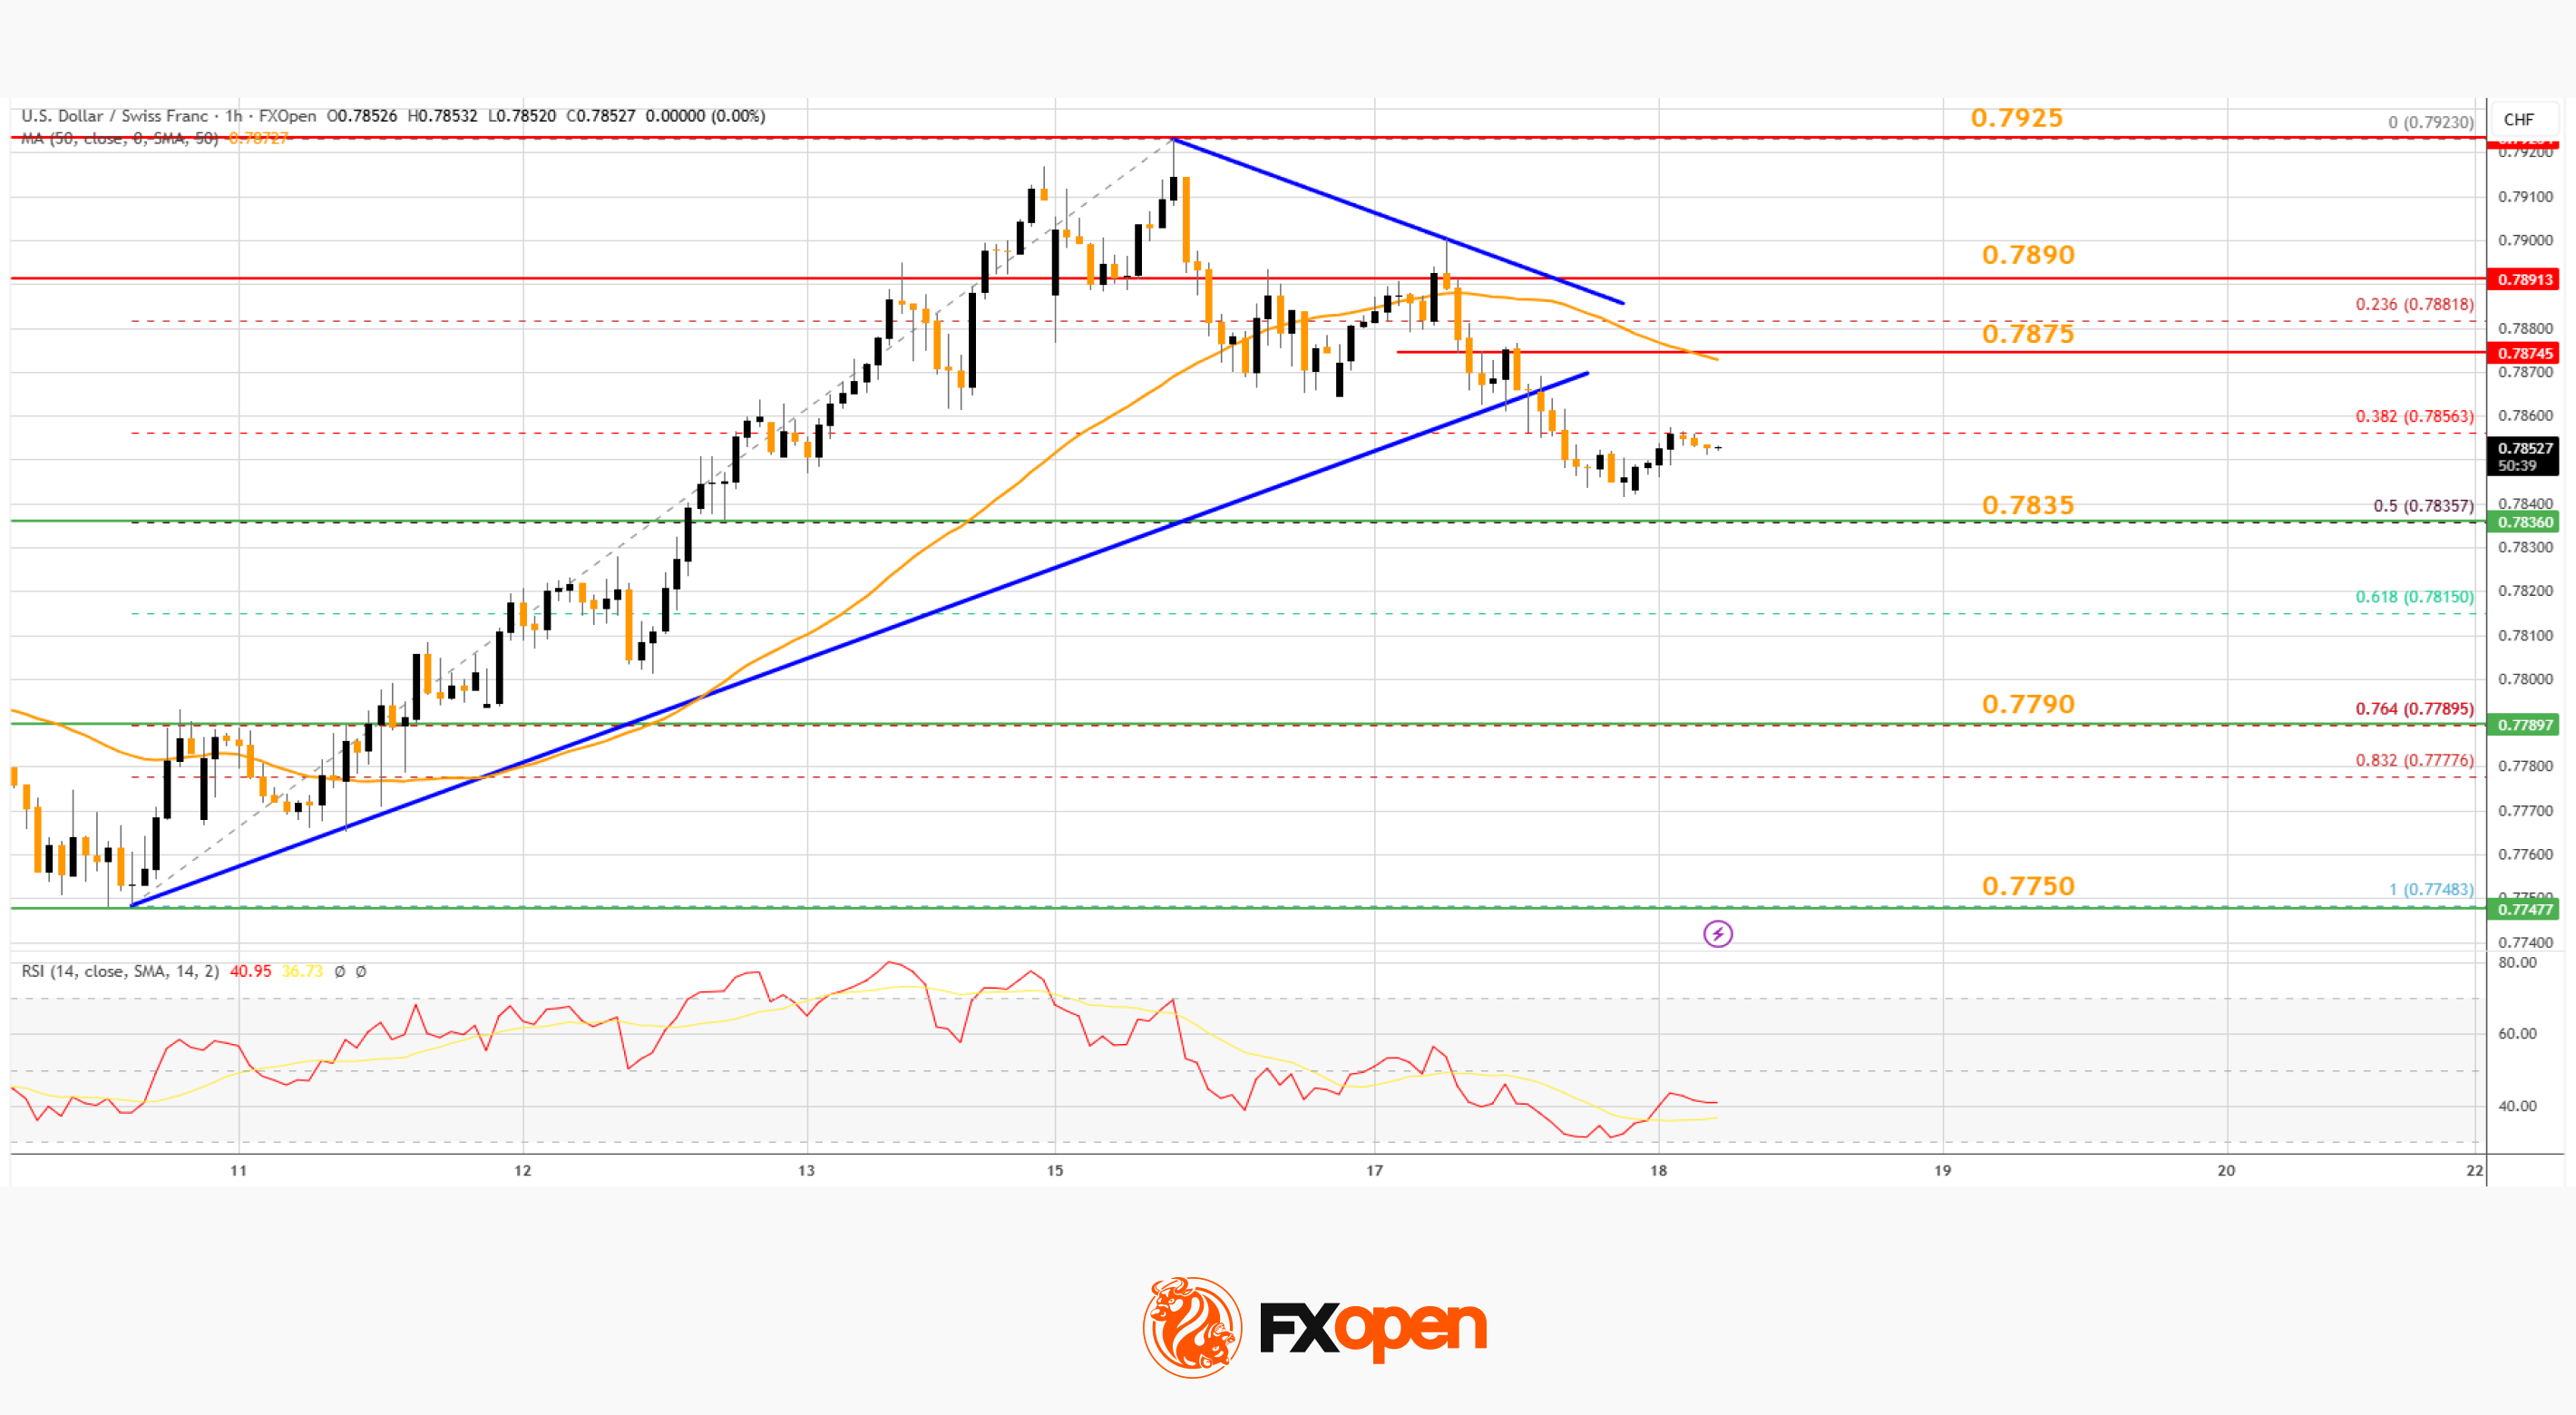
Besides, there was a break below a bullish trend line at 0.7870. On the downside, immediate support on the USD/CHF chart is near the 50% Fib retracement at 0.7835. The first key area of interest might be 0.7790.
A downside break below 0.7790 might call for a drop to 0.7750. Any more losses may possibly open the doors for a move toward 0.7720.
On the upside, the pair could struggle near 0.7875. The first major barrier for bulls is 0.7890. If there is a clear break above 0.7890 and the RSI climbs above 50, the pair could start another increase. In the stated case, it could test 0.7925.
Trade over 50 forex markets 24 hours a day with FXOpen. Take advantage of low commissions, deep liquidity, and spreads from 0.0 pips (additional fees may apply). Open your FXOpen account now or learn more about trading forex with FXOpen.
This article represents the opinion of the Companies operating under the FXOpen brand only. It is not to be construed as an offer, solicitation, or recommendation with respect to products and services provided by the Companies operating under the FXOpen brand, nor is it to be considered financial advice.

Whale activity around the Official Trump (TRUMP) token, which is tied to United States President Donald Trump, has hit a five-month high according to on-chain data.
Summary
- Whale wallets holding over 1 million TRUMP tokens have risen to a five-month high of 83, with combined holdings valued at around $3.7 million, according to Santiment.
- TRUMP price has climbed more than 50% from recent lows after a Mar-a-Lago luncheon announcement for top holders, though the token remains over 95% below its all time high.
According to Santiment, there are now 83 wallets that hold more than 1 million Official Trump (TRUMP) tokens. Collectively, these holdings amount to roughly $3.7 million worth of the tokens, marking the highest level recorded since Oct. 8 last year.
TRUMP has remained in a steady downtrend since the start of the year, but activity picked up pace after the project’s team announced a luncheon event at Trump’s Mar-a-Lago residence, where the U.S. president is expected to host top token holders.
Beyond the main event, those ranked among the top 297 holders are eligible to attend, while the top 29 wallets will qualify for a private reception with the president, subject to background checks.
Several figures across the crypto sector are expected to take part in the gathering, which appears to have driven the recent surge in interest around the token.
Additional data from CoinCarp shows that TRUMP has 642,882 holders, though concentration remains heavily skewed. Over 91% of the supply is held by the top 10 wallets, while roughly 97% sits with the top 100 wallets.
TRUMP started rallying from multi-month lows near $2.7, climbing more than 50% to reach a peak of $4.35. As of press time, the token is up over 26% in the past 7 days, though it remains down more than 95% from its all time high of $73.43.
For TRUMP holders, this pattern is not new. Last year, a similar gala-style event was announced, which saw the token rally sharply in the lead-up.
However, after the initial momentum faded, the token entered a prolonged downtrend, and unless market conditions change meaningfully, the latest event could follow a similar trajectory.
Regulatory concerns remain
While the upcoming event has generated renewed interest among crypto participants, it is also likely to draw scrutiny in Washington, where lawmakers have continued to question whether such initiatives present conflicts of interest.
Last year, Democratic Senator Jon Ossoff called for Trump’s impeachment over the memecoin dinner, while Senators Elizabeth Warren and Adam Schiff urged ethics officials to review the president’s involvement with the event.
Meanwhile, Representative Sam Liccardo introduced the Modern Emoluments and Malfeasance Enforcement (MEME) Act in February 2025, seeking to bar federal officials and their families from issuing or promoting digital assets.
Similar concerns could resurface this time around, as lawmakers have already raised questions over potential foreign influence and financial interests tied to Trump-linked crypto ventures.

Shibarium’s recovery process shows steady progress as indexing levels improve and system stability returns. Network data accuracy remains limited, yet activity continues to build across the ecosystem. Meanwhile, broader developments around Shiba Inu add new context to the current market positioning.
Shibarium indexing recovery gains traction
Shibariumscan reports that 45% of network blocks are now indexed, showing clear progress from earlier levels. This improvement follows ongoing restoration efforts after infrastructure changes. Consequently, the network continues to rebuild visibility across transactions and wallet activity.
Earlier, the team initiated a migration to a new server environment to boost performance and reliability. This move aimed to address system limitations that affected data tracking and user experience. As a result, indexing resumed gradually while stability improved across the network.
However, incomplete indexing still affects the accuracy of key metrics such as total transactions and wallet counts. Users may see partial data until the process reaches completion. Nevertheless, the steady increase signals continued backend recovery and system alignment.
Temporary display issues and network adjustments
At the beginning of the month, users reported missing tokens and NFTs within wallet interfaces and the explorer. These display issues created confusion across parts of the Shiba Inu ecosystem. However, developers linked the problem to indexing delays and a temporary bridge update.
Indexing plays a central role in how blockchain explorers present on-chain data. Without full indexing, systems cannot display complete transaction histories or asset balances. Therefore, partial indexing directly impacts how users interact with network data.
Meanwhile, ongoing updates aim to restore full functionality across the explorer and connected services. The community expects improvements as indexing progresses toward completion. Additionally, future upgrades may strengthen data handling and network performance further.
Broader developments shape Shiba Inu outlook
Beyond technical updates, Shiba Inu has entered discussions around inclusion in a proposed exchange-traded fund. T. Rowe Price submitted plans for an actively managed crypto ETF that includes multiple digital assets. This development places Shiba Inu within a broader institutional framework.
The asset manager oversees significant capital, which adds weight to the filing despite pending regulatory decisions. Inclusion in such a fund could expand exposure to digital assets beyond direct trading platforms. Consequently, it reflects ongoing integration between traditional finance and crypto markets.
At the same time, Shiba Inu price activity remains subdued amid wider market conditions. The token declined slightly over the past day while trading near the lower end of recent ranges. However, macroeconomic factors continue to influence short-term price direction.
The current market focus centers on the Federal Reserve meeting and interest rate expectations. Market data suggests a high probability of unchanged rates within the existing range. As a result, traders position cautiously while awaiting further signals from monetary policy decisions.
Bittensor (TAO) crypto just surged 46% in March. Trading near $277.
The network successfully deployed its Covenant-72B model on Subnet 3. That is not a roadmap promise. It is a live heavy-compute model running on-chain.
The market responded immediately. The subnet-native τemplar token pumped nearly 200% in under a week.
TAO is no longer just a governance play. Actual utility demand is driving this move.
Key Takeaways:
- TAO posts 46% monthly gain driven by Covenant-72B model deployment.
- Subnet 3 activity explodes, pushing the τemplar token up 194% in days.
- Institutional inflow accelerates ahead of potential Grayscale ETF approval.
Covenant-72B: Why This Release Moved the Market
Covenant-72B is a 72 billion parameter large language model. A significant jump from the lighter models Bittensor has run previously. It means the network can now handle enterprise-grade compute loads.
That scale directly impacts validator staking. Running a model this size requires higher quality miner inputs and more TAO staked to secure the bandwidth. Demand for compute on Subnet 3 created direct demand for the collateral backing it. The pricing mechanism worked exactly as designed.
The biggest winner was not TAO itself. It was τemplar, the Subnet 3 native token, which rallied 194% following the deployment. That is the ecosystem feedback loop in action. High-performance subnets attract speculative capital, which deepens liquidity for the miners running there.
Volume backs the move. TAO’s volume-to-market-cap ratio is sitting between 17% and 19%, with over $254 million traded in 24 hours. That is not a thin order book pump. That is real participation.
When subnet tokens outperform the parent chain like this, it typically signals the start of an application layer season for the protocol. That is the next phase traders are positioning for.
TAO Crypto Price Analysis: Can Bulls Breach $300?
TAO is consolidating at $277.49, just below the $300 psychological level. Structure stays bullish as long as $250 holds.
The 46% impulse already flushed weak hands. OI is building. Traders are positioning for a breakout.
Bull case: daily close above $300 opens $350. Grayscale ETF filing provides the fundamental narrative. Volume needs to stay above $250 million daily to keep the momentum alive.
Bear case: rejection at $300 retests $240. If the broader altcoin recovery stalls, TAO could chop sideways for weeks. Watch $265 closely. Lose that level and the immediate breakout setup is invalidated.
The post Bittensor (TAO) Crypto Surges 46% as Covenant-72B Launch Triggers Subnet Explosion appeared first on Cryptonews.
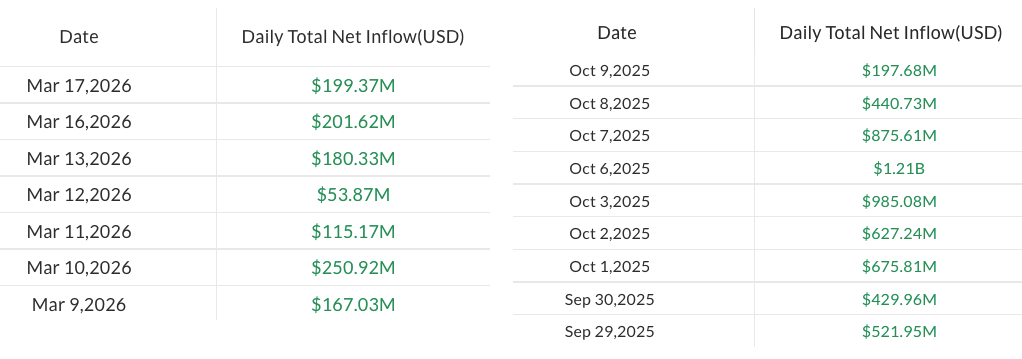
US spot Bitcoin exchange-traded funds (ETFs) extended their inflow streak to seven consecutive days, marking the longest run since October 2025.
Spot Bitcoin (BTC) ETFs added $199.4 million on Monday, bringing their seven-day streak to around $1.2 billion, according to data from SoSoValue. The latest inflows suggest continued institutional interest, though total inflows remain far below the roughly $6 billion seen during the October 2025 run.
Total trading volumes fell to $2.6 billion on Monday, while total assets under management in Bitcoin ETFs climbed to $96.7 billion. Net year-to-date flows remain negative, following $1.8 billion in cumulative monthly outflows and $1.7 billion in cumulative inflows.
The ETF rebound has coincided with broader strength in crypto investment products, which drew about $2.7 billion over three straight weeks, lifting year-to-date inflows to roughly $1.2 billion, according to CoinShares.

XRP funds post first gains after eight-day losing streak
Spot altcoin ETFs also saw a broad uptick, led by Ether (ETH) with $138.3 million in inflows, the largest since March 4. Solana (SOL) followed the trend with $17.8 million in inflows, also the biggest since March 4.
XRP (XRP) stood out with $4.64 million inflows, the first gains since March 4. The ETFs saw $56.8 million outflows in the period from March 5-16.

Despite $33.5 million in outflows so far in March, XRP ETFs remain in the green year-to-date, supported by $73.7 million in inflows during January and February.
Solana leads all crypto ETFs year-to-date with $223 million in net inflows.
Related: Bernstein says Bitcoin rebound reflects more resilient long-term holder base
In contrast, Ether ETFs remain underwater, with $364.5 million in year-to-date outflows, following $358.5 million in inflows in March and $723 million in outflows during the first two months of the year.
Magazine: Spot Bitcoin ETFs first green week, crypto ATM losses surge 33%: Hodler’s Digest, Mar. 8 – 14

Bitcoin ETF Inflow Streak Near October Run, Yet Totals Lag
Vikings Have Finally Moved Past a Major Blunder

Aryna Sabalenka: Late Dubai withdrawal criticism ‘ridiculous’


-
 Crypto World4 days ago
HYPE Token Enters Net Deflation as HyperCore Buybacks Outpace Staking Rewards
-

 Fashion5 days ago
Weekend Open Thread: Addict Lip Glow
-

 Tech3 days ago
Your Legally Registered ‘Motorcycle’ Might Not Count Under Proposed US Law
-
Sports4 days ago
Why Duke and Michigan Are Dead Even Entering Selection Sunday
-

 NewsBeat7 days ago
Residents reaction as Shildon murder probe enters second day
-

 Sports7 days ago
PWHL, Senators discussing plan to keep Charge in Ottawa
-

 Business3 days ago
Search for Savannah Guthrie’s Mother Enters Seventh Week with No Arrests
-

 Business4 days ago
US Airports Launch Donation Drives for Unpaid TSA Workers as Partial Government Shutdown Enters Fifth Week
-
 Tech17 hours ago
Are Split Spacebars the Next Big Gaming Keyboard Trend?
-
Crypto World4 days ago
Coinbase and Bybit in Investment Talks: Could Bybit Finally Enter the US Crypto Market?
-

 NewsBeat7 days ago
I Entered The Manosphere. Nothing Could Prepare Me For What I Found.
-

 Business4 days ago
Country star Brantley Gilbert enters growing non-alcoholic beer market
-

 Business2 days ago
Australian shares drop as Iran war enters third week
-

 Crypto World2 days ago
Crypto Lender BlockFills Enters Chapter 11 with Up to $500M in Liabilities
-

 Sports5 days ago
College Basketball Best Bets: Conference Tournament Semifinal Picks
-

 Crypto World6 days ago
Three Binance Charts May Be Hinting at Bitcoin’s Next Move
-

 Business6 days ago
Trump demands Powell cut rates as Iran conflict raises energy prices
-

 Crypto World6 days ago
Senate Votes to Include CBDC Ban in Bipartisan Housing Bill
-

 Fashion2 days ago
25 Celebrities with Curly Hair That Are Naturally Beautiful
-

 NewsBeat7 days ago
What to know about Erika Kirk after her Air Force board appointment | News US


You must be logged in to post a comment Login