
Crypto World
What $1m in test swaps revealed


Disclosure: This article does not represent investment advice. The content and materials featured on this page are for educational purposes only.
Lowest fee crypto exchanges often hide real costs. A $1m analysis across 25+ platforms reveals what traders truly pay.
Summary
- Hidden fees on “0%” crypto exchanges can cost 3-5% per trade, far above advertised rates.
- Spread manipulation and inflated withdrawal fees make some low-fee exchanges surprisingly costly.
- True crypto trading costs go beyond commissions; total cost of ownership reveals hidden losses.
Finding the lowest fee crypto exchange sounds simple — until it is discovered that advertised rates rarely tell the complete story. Behind glossy “0% trading fee” promises lurk hidden charges that can silently consume 3-5% of every transaction. Through analysis of over $1 million in aggregate transaction volume across 25+ platforms — combining real test trades with calculated projections — this article uncovers what people are really paying.
The real cost of “low fee” crypto exchanges
Most traders evaluate crypto exchange fees by glancing at headline percentages, typically 0.1-0.6% for standard accounts. Industry research confirms average spot trading fees hover around 0.2%. Yet these numbers represent only a fraction of actual costs.
The cheapest crypto exchange isn’t determined by trading commissions alone, it’s calculated through total cost of ownership. An investigation revealed platforms advertising 0.1% fees can cost substantially more than competitors charging 0.3% once withdrawal premiums, spread manipulation, and conversion charges are accounted for. A single BTC-to-ETH swap on certain “low-fee” platforms resulted in hidden costs exceeding $150 beyond stated commissions.
Six hidden fee categories draining profits
1. Spread manipulation: The invisible tax
Trading spread represents the gap between buy and sell prices — where “zero-fee” exchanges generate most revenue. If Bitcoin’s actual market price (aggregated across Binance, Kraken, Coinbase) sits at $73,000, certain platforms quote buy prices at $75,000, a concealed 2.74% premium. Platforms claiming zero commissions routinely embed 2-3% spreads during volatile periods, while competitors with transparent 0.2% trading fees deliver execution within 0.5% of market rates.
2. Inflated withdrawal fees
Blockchain network fees are unavoidable, validators must be compensated for transaction processing. The issue is platform markup. An analysis found withdrawal fee variations of 300-500% for identical assets. One exchange charged 0.0005 BTC ($36) for Bitcoin withdrawals when actual on-chain fees averaged 0.0001 BTC. USDT withdrawals ranged from $0.50 on Tron to $30 via certain platforms — pure markup.
Platform Type
BTC Withdrawal
USDT (Tron)
Network Cost
High-markup CEX
0.0005 BTC
$5.00
~$0.50-2.00
Transparent platform
0.0001 BTC
$0.80
~$0.50-2.00
Instant swap service
Network only
$0.50
~$0.50-2.00
3. Fiat deposit fees
Cryptocurrency deposits are free on virtually all platforms — industry standard. However, fiat deposits carry substantial charges: bank transfers cost $0-1, credit/debit cards charge 2.5-3.99%, and wire transfers run $10-30. A $10,000 card deposit at 3% costs $300 instantly, more than most annual trading commissions.
4. Currency conversion markups
When depositing USD to trade on EUR-based platforms, exchanges apply conversion rates 2-4% worse than mid-market rates, pocketing the difference. A U.S. trader depositing $50,000 and later withdrawing faces potential losses exceeding $3,000 from round-trip FX premiums.
5. Deceptive Fee Tiers
Volume-based structures advertise rates dropping to 0.05% — but require monthly volumes exceeding $10-250 million. Platforms headline their lowest possible fees without clarifying these apply only to institutional volumes. Most retail traders operate at base tiers of 0.4-0.6% per transaction.
6. Slippage on low-liquidity pairs
Slippage — the difference between expected and executed prices — becomes severe on exchanges with shallow liquidity. Godex’s modeling revealed costs of 1-5% on orders exceeding $50,000. The lowest fee crypto exchange must balance fee percentages with execution quality.
Calculate the true exchange costs
Total Cost = Trading Fees + Deposit Fees + Withdrawal Fees + Spread Costs + Slippage + Conversion Fees
Example: Trading $10,000 through a typical “low-fee” exchange:
- Card deposit: $300 (3%)
- Trading fees: $81.60 (0.4% buy + sell)
- Spread cost: $150 (1.5% hidden)
- Withdrawal fee: $65 (inflated)
- Total fees: $596.60 on $400 profit = Net loss of $196.60
Hidden fees exceeding trading gains occurs frequently with short-term positions.
Instant Swap platforms: A transparent alternative
The cryptocurrency industry divides into two models with different cost structures:
Traditional CEXs: Account-based platforms with KYC and multiple fee layers — trading fees (0.1-0.6%), inflated withdrawal fees, fiat deposit charges (0-3.99%), and conversion fees. Best for high-volume traders leveraging VIP tiers.
Instant Swap Platforms: Registration-free services with embedded rates (0.5-1.5% total), no withdrawal fees beyond network costs, no deposit fees, and transparent locked pricing. Best for privacy-focused traders.
Godex exemplifies the instant swap model. Operating since 2018, this anonymous cryptocurrency exchange platform facilitates swaps across 928+ cryptocurrencies with no registration, no KYC, and no personal data collection, offering both fixed-rate exchanges (eliminating volatility risk) and floating-rate options.
Key differentiators:
- No withdrawal fees — only blockchain network costs
- No deposit fees — send from any wallet
- Transparent pricing — all costs in displayed rate
- Fixed-rate protection — lock rates for 15 minutes
- No exchange limits — swap unlimited volumes
A quote showing 0.05 BTC → 1.8 ETH delivers exactly 1.8 ETH, minus only network fees (typically $0.50-3.00).
Five Strategies to minimize trading fees
1. Compare Total Cost: Execute small test transactions across platforms, comparing actual amounts received after all fees.
2. Optimize Deposits: Avoid card deposits (2.5-3.99%). Use bank transfers ($0-1) or instant swap platforms accepting crypto directly.
3. Choose Low-Cost Networks: Select Tron or Polygon ($0.50-1.00) over Ethereum mainnet ($5-20) for stablecoin withdrawals.
4. Use Fixed-Rate Swaps: Platforms like Godex guarantee quoted rates for 15 minutes, eliminating slippage during volatility.
5. Demand Transparency: Platforms advertising zero fees generate revenue through spread manipulation. Exchanges displaying comprehensive breakdowns typically deliver lower total costs.
The verdict
After analyzing over $1 million in aggregate volume across 25+ exchanges:
- Advertised fees represent 30-50% of actual costs for traders using card deposits
- Spread manipulation costs more than trading fees on “zero commission” platforms
- Withdrawal fee inflation shows 300-500% markups above network costs
- The cheapest crypto exchange varies by use case — high-volume traders benefit from tiered CEX discounts, while small-to-medium traders save using transparent instant swap services
The crypto exchange with lowest fees depends on trading frequency, assets, privacy requirements, and withdrawal patterns. Platforms transparently displaying total costs consistently outperform competitors hiding charges.
Take control of trading costs
Calculate total costs using the formula above, test alternatives with small swaps, and explore platforms like Godex offering transparent rates and comprehensive asset coverage. Trading profits deserve protection from hidden charges — choose wisely and keep more of what is earned.
Disclosure: This content is provided by a third party. Neither crypto.news nor the author of this article endorses any product mentioned on this page. Users should conduct their own research before taking any action related to the company.

Crypto World
STRC trading surge drives record volume and signals largest bitcoin purchase since launch

Stretch (STRC), the perpetual preferred security sold by Strategy (MSTR) to fund its bitcoin purchases, posted record trading volume on Monday, funding the biggest single-day buying splurge through the company’s at-the-market (ATM) program.
The world’s largest publicly traded bitcoin holder is estimated to have added 7,800 BTC, according STRC.live, as STRC volume surged to $1.16 billion, more than four times the 30-day average of $278 million.
This comes after Strategy purchased $1 billion worth of bitcoin last week, funded entirely by STRC, which offers an 11.5% annual dividend, paid monthly in cash. The stock maintained its $100 par value throughout the entire trading session.
Historically, the trading day preceding the ex-dividend date, the cutoff date after which new buyers are no longer entitled to the next dividend payment, tends to see the highest trading volume. That’s Wednesday, so it’s possible trading on Tuesday may be even higher than Monday’s record.
STRC now has a market capitalization of $6.4 billion, exceeding the combined market cap of the company’s other preferred securities, including STRD at $1.1 billion, STRK at $1 billion, and STRF at $1.2 billion, according to the MSTR dashboard.
The common stock rose 2.9% on Monday and was 3.7% higher in pre-market trading.
Read More: The one metric investors are overlooking in Michael Saylor’s Strategy

Key takeaways
- Hyperliquid is up 8% in the last 24 hours, maintaining its position in the top 10.
- The coin could rally towards the $50 psychological level if the bullish sentiment persists.
Hyperliquid (HYPE) continues its upward momentum, trading above $44 as of Tuesday after an 8% surge on the previous day. With strengthening on-chain data, favorable derivatives metrics, and technical analysis pointing to further gains, the outlook for HYPE remains bullish, with a target of $50 in sight.
Bullish Sentiment Backed by On-Chain and Derivatives Metrics
On-chain data from CryptoQuant suggests a strong buy-side dominance in both Hyperliquid’s spot and futures markets, with cooling conditions indicating a favorable environment for a potential price rise. The market shows mostly neutral conditions across other metrics, reinforcing the possibility of an upside move.
On the derivatives front, CoinGlass data reveals that HYPE’s futures Open Interest (OI) has surged to $1.96 billion on Tuesday, up from $1.5 billion on April 3. This steady rise in OI points to new capital entering the market, which could propel HYPE’s price higher. This is the highest level of futures OI seen since early November.
Moreover, CoinGlass’ long-to-short ratio for HYPE stands at 1.04, signaling a predominantly bullish sentiment in the market, as more traders expect the price to rally.
Price Forecast: HYPE bulls target $50
The HYPE/USD 4-hour chart is extremely bullish and efficient. HYPE’s price has extended its gains, surpassing the March high of $43.75 and reaching above $44 on Tuesday. If the upward trend continues, HYPE could target the October 30 high of $50.15.
The Relative Strength Index (RSI) on the daily chart is currently at 69, indicating strong bullish momentum as it moves toward overbought territory. Additionally, the Moving Average Convergence Divergence (MACD) indicator recently showed a bullish crossover on April 10, further supporting a positive outlook for HYPE.
Should HYPE experience a pullback, it could find support near the psychological $40 level. However, the prevailing market conditions suggest a strong potential for further upside, with $50 being the next major resistance.
UK Liberal Democrats have urged the Financial Conduct Authority (FCA) to investigate Nigel Farage’s ties to Bitcoin treasury company Stack BTC after it disclosed a 37 Bitcoin purchase and published promotional material featuring the Reform UK leader, who is also a shareholder.
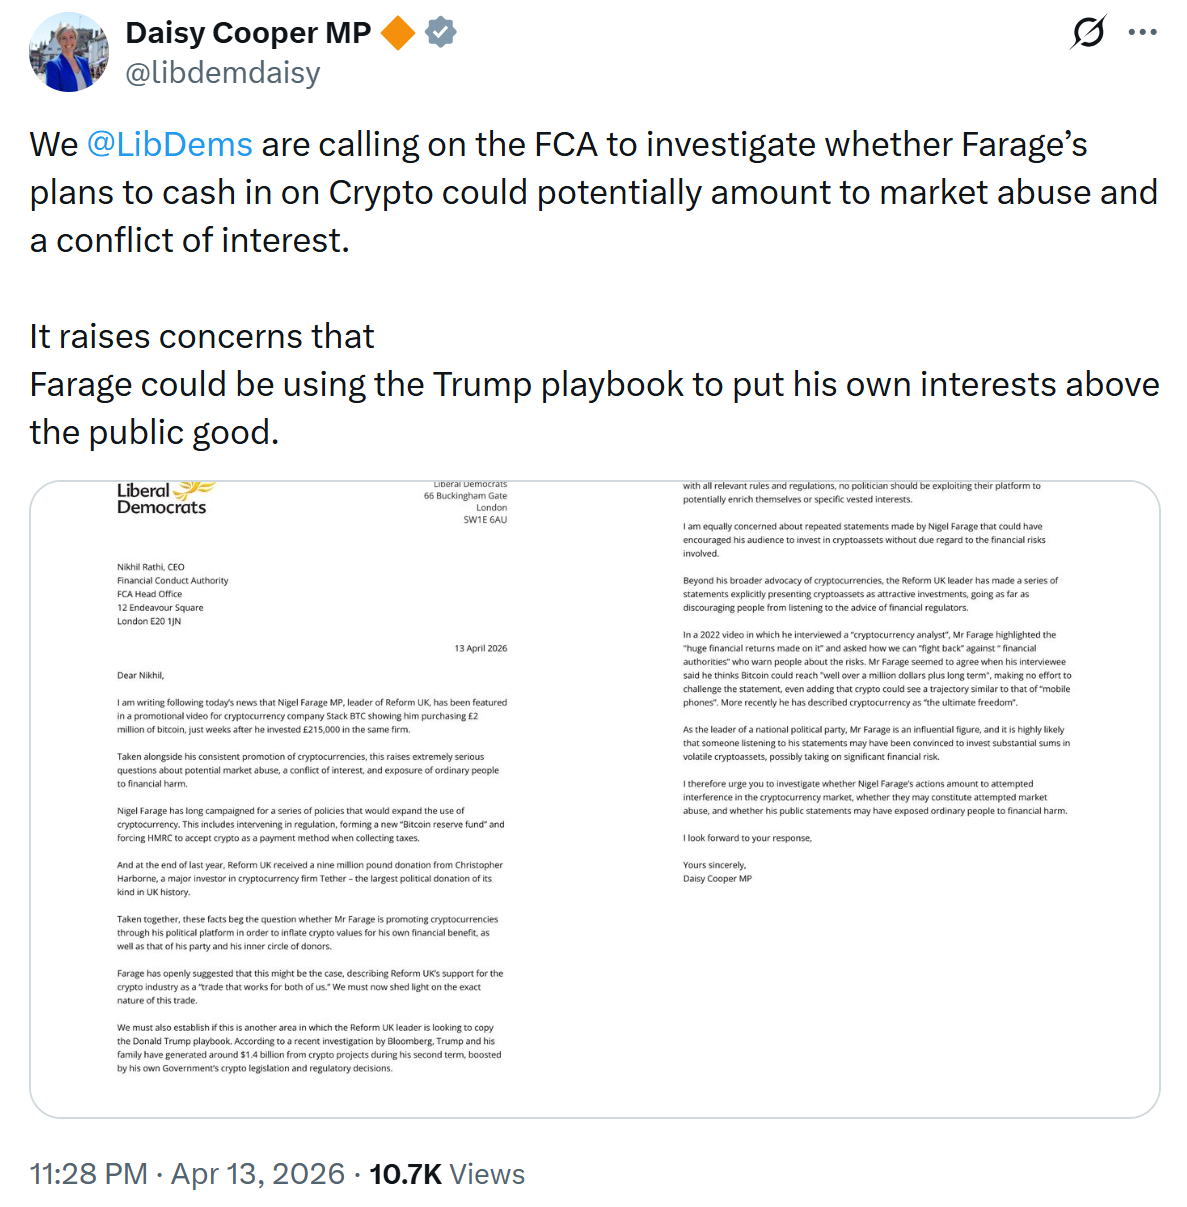
In a letter to the FCA, Liberal Democrat deputy leader Daisy Cooper asked the regulator to investigate whether Farage breached market rules by appearing in a promotional video for Stack BTC while holding a financial stake in the company.
“The FCA must investigate whether Farage’s plans to cash in on Crypto could potentially amount to market abuse and a conflict of interest,” she wrote, adding that “we cannot allow political leaders to treat the financial markets like a personal piggy bank to potentially line their own pockets.”
Stack BTC said Monday that it purchased 37 Bitcoin (BTC) for roughly $2.7 million as part of its treasury strategy. In a video tied to the purchase, Farage said that a Bitcoin treasury company cannot exist without holding Bitcoin.
The scrutiny adds to questions over the intersection of crypto and UK politics as Farage deepens his involvement with Stack BTC and lawmakers push for tighter rules on digital asset donations to political parties. An FCA spokesperson told Cointelegraph that they will “review the letter and respond directly.”
Cointelegraph reached out to Stack BTC for comment, but had not received a response by publication.
Related: UK sanctions $20B scam market by cutting ‘legitimate’ crypto ties
Farage deepens ties to Stack BTC
Farage, leader of Reform UK, has recently deepened his relationship with Stack BTC. In March, he disclosed a $286,000 equity investment in the company, acquiring a 6.31% stake in the company through his media vehicle Thorn In The Side.
Stack BTC, chaired by former UK Chancellor Kwasi Kwarteng, holds over 68 BTC purchased at an average cost of $72,400 per coin, according to its website.
Cooper’s letter also references the record 9 million British pounds (about $12 million) donation to Reform UK from early crypto investor Christopher Harborne and Farage’s push for crypto-friendly policies.
“Taken together, these facts beg the question whether Mr Farage is promoting cryptocurrencies through his political platform in order to inflate crypto values for his own financial benefit, as well as that of his party and his inner circle of donors,” she wrote.

Related: UK lawmakers seek moratorium on crypto donations to political parties
UK moves to ban crypto political donations
Last month, the Rycroft Review recommended a moratorium on cryptocurrency donations to political parties, warning they could open the door to foreign financial interference in UK elections. The UK government moved forward with the proposal, with Prime Minister Keir Starmer stating the government will impose a temporary ban on crypto donations until stronger safeguards are in place.
Several members of parliament, including the chair of the security committee, have been pushing for a full ban this year.
Magazine: How crypto laws changed in 2025 — and how they’ll change in 2026

Errol Musk, father of Tesla and SpaceX founder Elon Musk, says there is no doubt that crypto is the future of finance.
In an exclusive interview with BeInCrypto Editor-in-Chief Vladimir Arkhireysky, the South African engineer called the old model “finished.” His comments come alongside revelations about his sons’ Bitcoin (BTC) holdings and his own first-hand experience of crypto payments.
Elon Musk’s Father Backs Crypto
Errol Musk was unequivocal about where global finance is heading.
“I have no doubt that crypto will be the future of finance. The old model has run its course, it’s finished,” he said. “The new form of money management is clearly crypto.”
The 79-year-old engineer grounded his conviction in personal experience. He described how transferring money across countries through a bank is “practically impossible,” whereas crypto transfers happen instantly.
“It’s an amazing form of money movement. For example, if I’m in South Africa and I want to bring some money from America through a bank, it’s impossible. They make it so impossible through the bank. If I go to my friends in crypto, they do it immediately, no problem,” Errol told BeInCrypto.
He noted that he has met the founder of Binance, Changpeng “CZ” Zhao, and the founder of Bybit, and has personally received crypto that bypassed traditional banking channels entirely.
Despite his conviction, Errol admitted he does not personally own any digital assets. He described himself as “old-fashioned,” though he said he would like to learn more about crypto.
“What I know about it is small, but it’s a big thing. I am still old-fashioned. I have a bank card,” he remarked. “Altogether, I’m not an expert, but it’s clearly fascinating stuff.”
Follow us on X to get the latest news as it happens
Inside the Musk Family’s Crypto Exposure
Errol also offered a rare glimpse into the Musk family’s crypto positions.
“I know it sounds astronomical. Elon and Kimbal, my two sons, have 23,400 Bitcoins,” he said.
If accurate, the figure would be striking. Based on the latest data from BitsoinTreasuries, Elon Musk’s electric vehicle firm Tesla holds 11,509 BTC, ranking 12th among the largest publicly traded holders. In addition, SpaceX holds 8,285 Bitcoins.
The family has also dealt in other tokens. Errol revealed that they once received payment in Solana (SOL), an amount he described as “a little more than a million rubles.”
“It was strange for me to receive that payment in crypto. We received Solana back then, it was worth much more, and we got out at the peak,” he mentioned.
Errol Musk is a South African engineer, pilot, and businessman. Born in 1946. Father of Elon Musk, founder of Tesla and SpaceX, and Kimbal Musk, entrepreneur and philanthropist.
Early in his career, he worked in real estate and electrical engineering and was involved in various mining projects across Africa. He is known as a candid speaker who readily comments on his sons’ achievements and global trends.
The post Elon Musk’s Father Declares Crypto the Future of Finance appeared first on BeInCrypto.


The Digital Asset Market Clarity Act is gaining fresh momentum in the U.S. Senate as negotiators work to solidify a bipartisan compromise on stablecoin regulations.
Summary
- The White House has secured a bipartisan agreement on stablecoin yields to move the Digital Asset Market Clarity Act toward a Senate Banking Committee markup.
- Negotiators are finalizing additional provisions involving illicit finance rules for decentralized finance and ethics restrictions on senior government officials.
Patrick Witt, the executive director of the President’s Council of Advisors for Digital Assets, told CoinDesk TV on Monday that a crucial agreement regarding stablecoin yield appears to be holding firm.
This consensus was a prerequisite for addressing other sticking points in the bill, which had previously stalled due to concerns from the banking sector.
“We’re hopeful that the compromise that has been reached will be durable and will hold,” Witt said, noting that resolving the yield issue was a “must-have” before the administration could pivot to remaining hurdles.
CoinDesk TV reported that the legislation faced significant delays earlier this year after bank lobbyists argued that allowing stablecoins to offer interest-like returns could drain traditional bank deposits.
While White House economists recently released a report downplaying these risks, the American Bankers Association maintains that the government’s assessment is flawed.
Witt observed that the banking industry remains divided on the technology, stating, “They’re grappling with it. These are all important issues to their members. And, you know, some of them are going to view stablecoins more positively. Some are going to be a little bit more threatened by them.”
Legislators are also working through sensitive non-financial clauses behind the scenes. These include establishing illicit finance protections for the decentralized finance (DeFi) sector and addressing a demand from Democrats to prevent senior government officials, including President Donald Trump, from personally profiting from the crypto industry.
Witt declined to specify which of these secondary topics are now fully settled, but expressed optimism about the current pace of negotiations.
“All of these issues felt intractable and unsolvable at one point in time,” Witt said.
“So the fact that we’ve been able to close out a lot of them gives me confidence that we can close out these other ones, too.”
The bill must now pass a markup hearing in the Senate Banking Committee before it can be scheduled for a full floor vote.
Bitcoin analysts sounded bullish early this week and the market is proving them right. The cryptocurrency’s price has hit four-week highs above $74,000.
As the rally continues, several key levels are now in focus. Let’s take a look at those in detail.
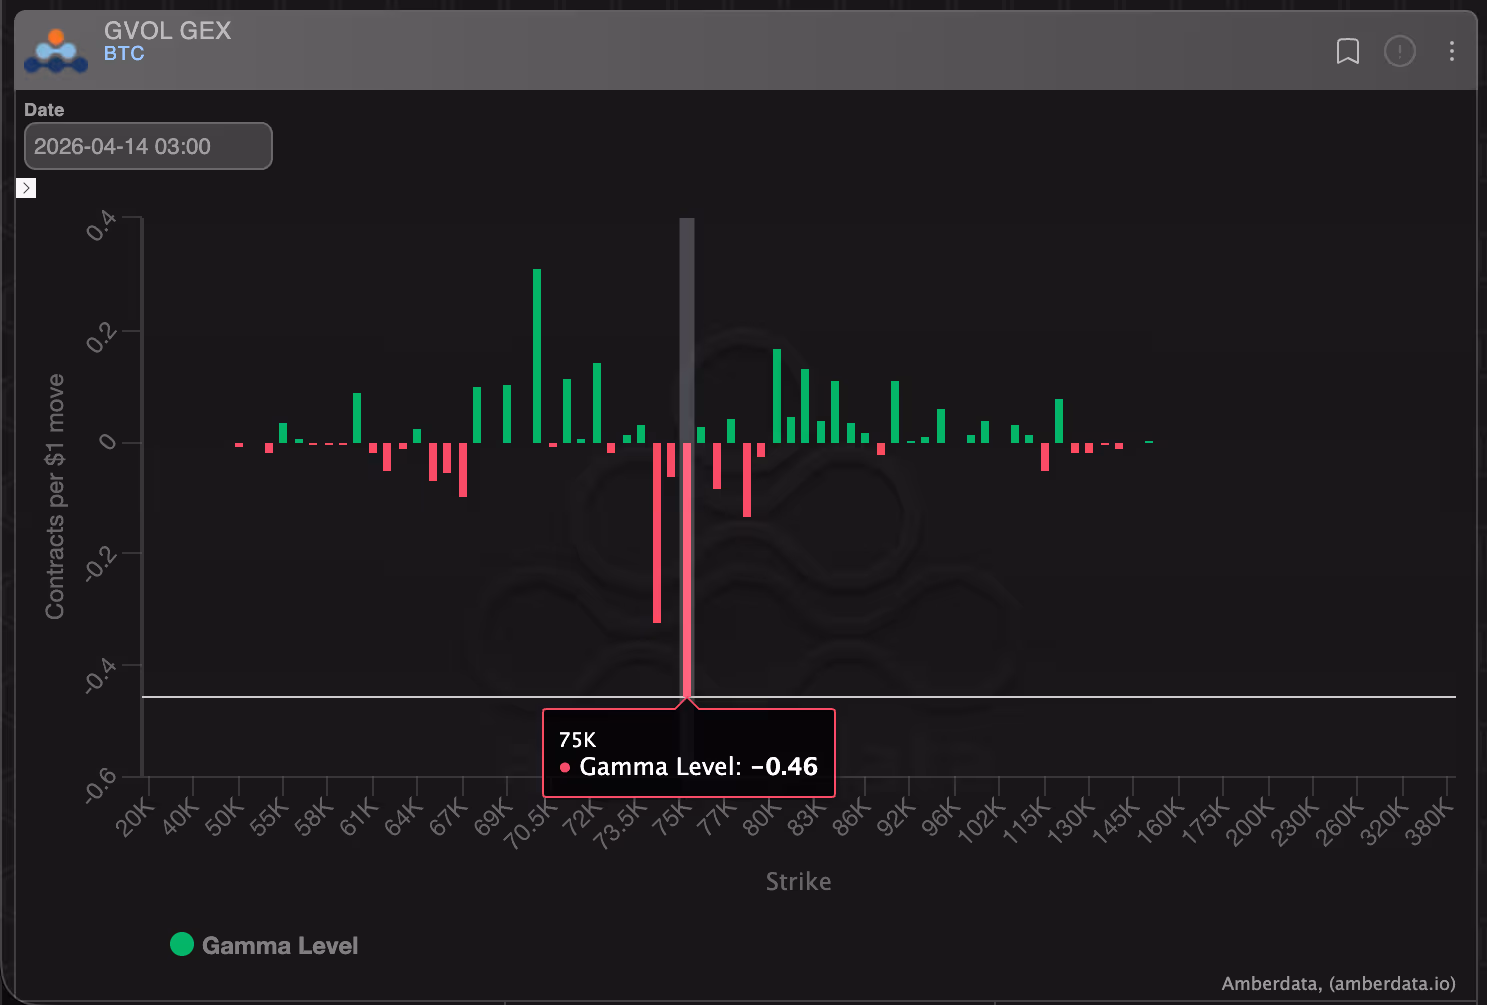
$75,000 the ‘release point’
This may be the most important because of its implications for derivatives positioning and dealer hedging flows. Dealers, or market makers, are entities that keep markets liquid and ensure a seamless trading experience by stepping in to buy or sell assets, taking the opposite side of your trade.

At $75,000, options market data from Deribit indicates that dealer and market maker exposure is tilted heavily toward so-called “negative gamma.”
Gamma refers to how quickly dealers must adjust their hedges as the underlying price moves.
When dealers are “long gamma,” they tend to buy the underlying asset in spot/futures when its price falls, and sell when its price rises, inadvertently curbing volatility. But when they are short or in negative gamma, as is the case at $75,000, their behavior flips – hedging becomes pro-cyclical, meaning they may be forced to buy into rallies and sell into declines. Other things being equal, this dealer hedging often amplifies price volatility.
So, as bitcoin approaches and trades near $75,000, even modest price swings can trigger hedging flows from dealers adjusting their options exposure. If prices move past $75,000, dealers may buy into the rising market, potentially accelerating upside momentum.
Conversely, if prices turn lower from around $75,000, dealers could short, accelerating the decline, meaning this point can act less like a traditional support or resistance level and more like a “volatility release point.”
Since 2020, as bitcoin’s options market has expanded significantly, negative gamma positioning has increasingly acted as an accelerant, intensifying both upswings and selloffs depending on the prevailing market’s direction.
Second, $75,000 also aligns with the 100-day moving average, a widely tracked technical indicator that often serves as support or resistance. It previously marked a key resistance zone in January, where sellers re-established their dominance, stopping the rally and paving the way for a deeper drop toward $60,000.

Above $80,000
The next key price range is $80,000–$80,600. This zone is characterized by positive dealer gamma exposure, which means they are likely to buy low and sell high in this range, potentially reducing the directional pressure. As a result, trading within this band could be relatively rangebound, with less tendency for sharp trend continuation in either direction.
Meanwhile, $80,525 also stands out as a historically important level, marking the point where the November sell-off lost momentum. From there, selling pressure faded and the market transitioned into a two-month recovery rally that carried bitcoin toward the $100,000 area.

Prior inflection points, such as $80,525, often represent potential areas where a bullish move may stall.
A final indicator to watch is the massively popular 200-day average of the price, tracked by traders and analysts as an indicator of long-term price trajectory. As of writing, the 200-day average is $87,519, indicating BTC is currently trading below its long-term valuation.

The initial rise in EUR/USD and GBP/USD was driven by reports of a temporary ceasefire between the United States and Iran, which reduced demand for the US dollar as a safe-haven asset. However, over the weekend, reports emerged that negotiations had stalled, leading to a bearish gap at the start of the new trading week. Subsequently, rumours of a possible resumption of dialogue once again shifted market sentiment, restoring interest in risk-sensitive assets.
This supported a swift recovery in the euro and the pound, while also increasing pressure on the US dollar. Additional downside pressure on the dollar comes from declining Treasury yields and a reassessment of expectations regarding the Federal Reserve’s monetary policy, which continues to limit the upside potential of the US currency.
Market attention today will focus on upcoming macroeconomic releases from the euro area and the United States, including producer inflation (PPI), business activity data, and speeches from Federal Reserve officials. These factors may adjust current interest rate expectations and influence the dollar’s short-term trajectory.
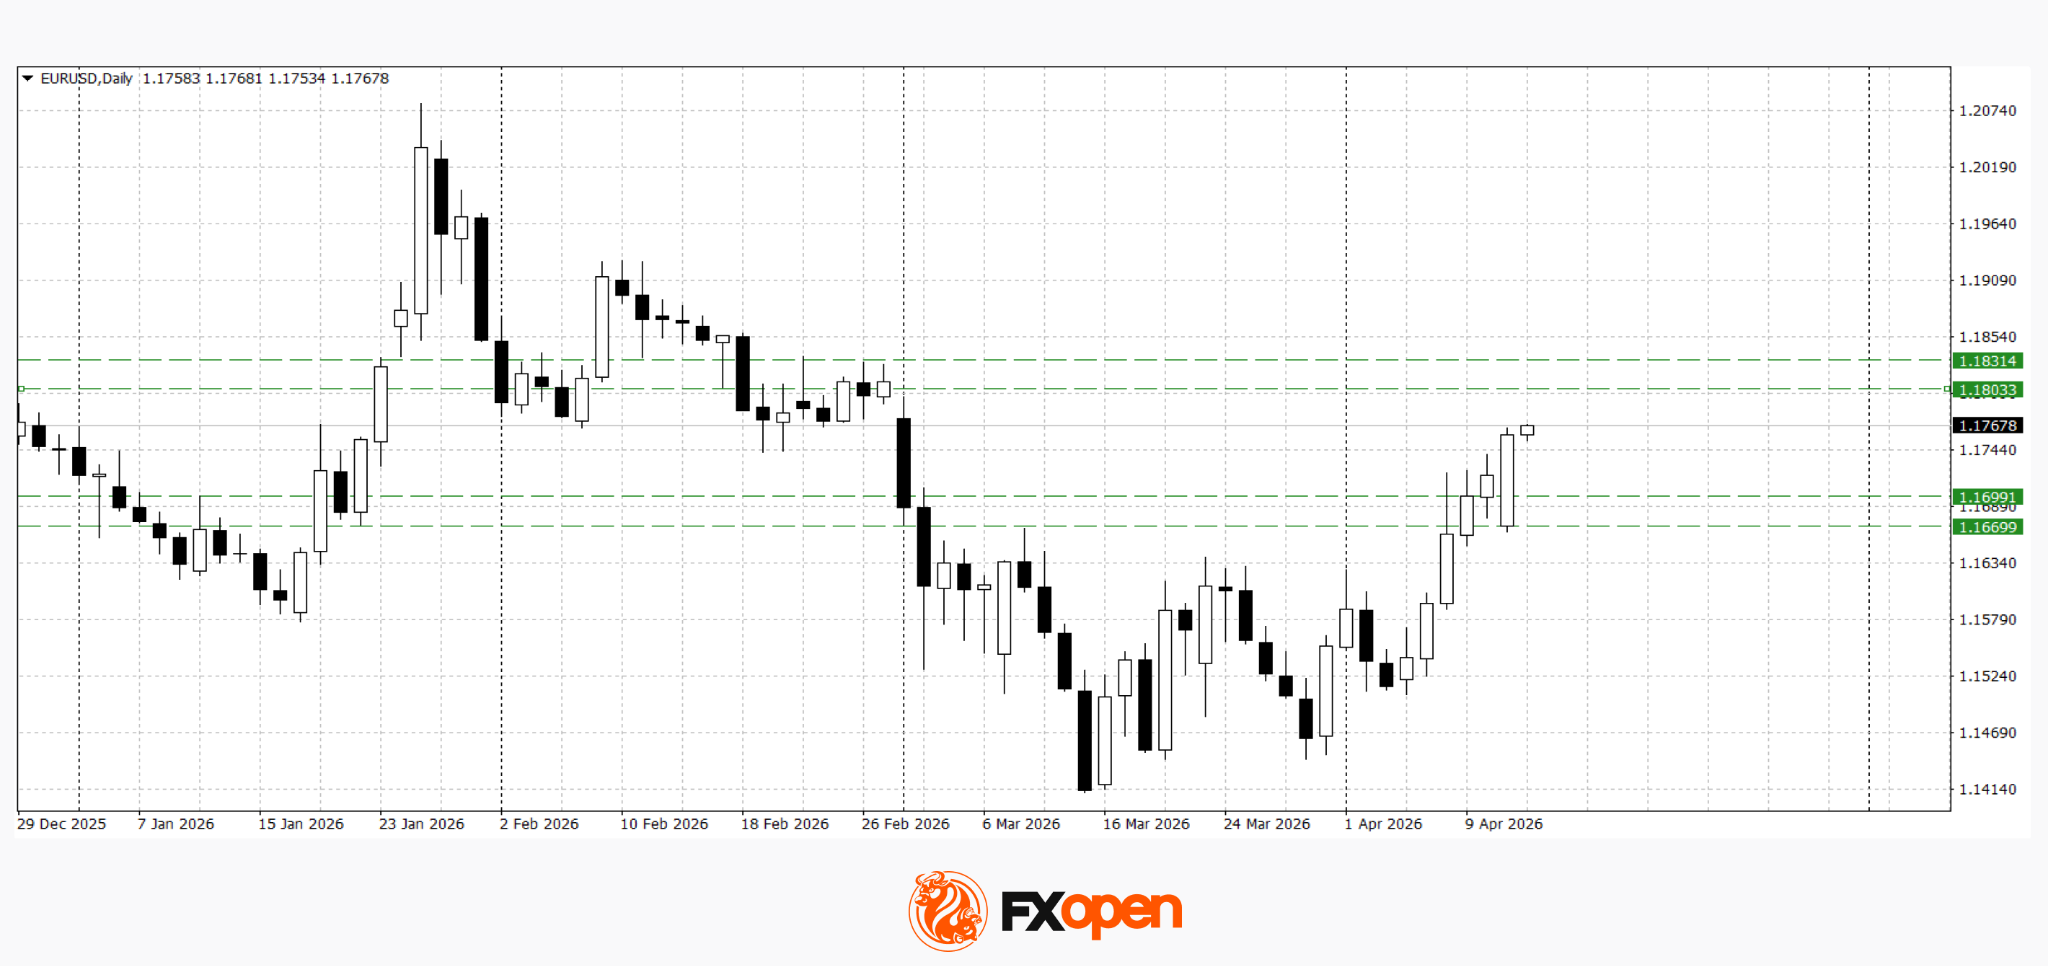
EUR/USD
The pair continues to move higher following a breakout from last week’s consolidation range. The week opened with a price gap, but after a retest of support at 1.1660, the pair quickly recovered above 1.1700. Technical analysis suggests the potential for further gains towards the 1.1800–1.1830 area. However, any negative developments in US–Iran negotiations could trigger a sharp pullback towards 1.1700–1.1660.
Key events for EUR/USD:
- today at 10:00 (GMT+3): Spain HICP
- today at 15:30 (GMT+3): US Producer Price Index (PPI)
- today at 20:00 (GMT+3): speech by Bundesbank representative Balz
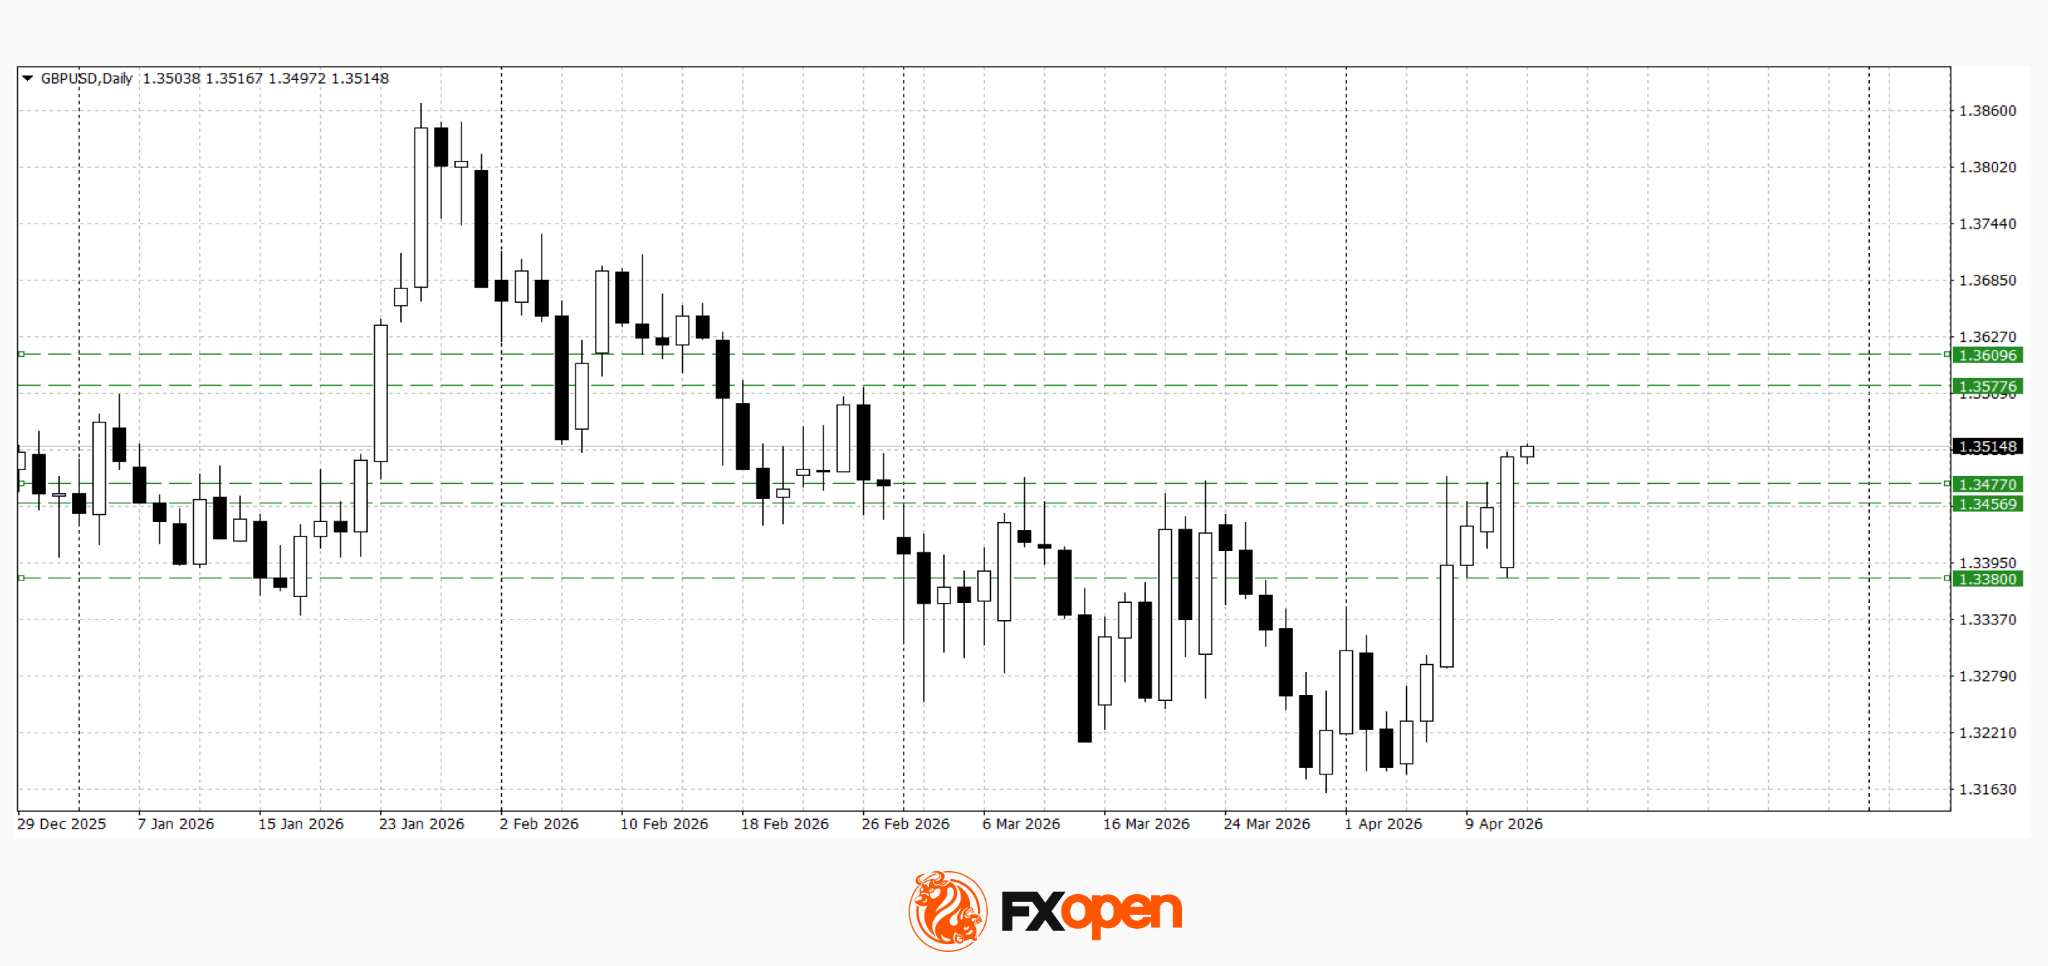
GBP/USD
The pair is showing a similar pattern, largely mirroring the euro’s dynamics. Following the overnight gap, the price managed to break above last week’s highs and test key resistance at 1.3500. Technical analysis points to a possible move towards 1.3570–1.3600. In case of a pullback, a retest of recent levels near 1.3450–1.3470 is possible.
Key events for GBP/USD:
- today at 11:50 (GMT+3): speech by Bank of England MPC member Mann
- today at 19:00 (GMT+3): speech by Bank of England Governor Bailey
- today at 19:45 (GMT+3): speech by Federal Reserve Vice Chair for Supervision Michael S. Barr
Overall, European currencies maintain an upward bias amid an unstable geopolitical environment and declining US yields. However, the current rally remains highly sensitive to developments in the negotiation process, increasing the likelihood of short-term volatility. The next directional move in EUR/USD and GBP/USD will depend on both geopolitical signals and incoming macroeconomic data.
Trade over 50 forex markets 24 hours a day with FXOpen. Take advantage of low commissions, deep liquidity, and spreads from 0.0 pips (additional fees may apply). Open your FXOpen account now or learn more about trading forex with FXOpen.
This article represents the opinion of the Companies operating under the FXOpen brand only. It is not to be construed as an offer, solicitation, or recommendation with respect to products and services provided by the Companies operating under the FXOpen brand, nor is it to be considered financial advice.
Bitcoin price edged closer to the $75,000 mark after news reports suggested a potential de-escalation of the U.S.-Iran war. Bitcoin is now close to breaking out of an ascending triangle that could push it higher this week.
Summary
- Bitcoin price climbed toward $75K on U.S.-Iran ceasefire hopes and easing inflation fears as oil prices dropped.
- A $225 million short squeeze across derivatives markets accelerated BTC’s rally and strengthened bullish momentum.
- BTC is approaching a breakout above $76K from an ascending triangle, with $80K as the next key resistance level.
According to data from crypto.news, Bitcoin (BTC) price rose nearly 6% to a 4-week high of $74,788 on Tuesday morning Asian time. Trading at $74,675 at press time, it stood nearly 9% higher over the past week.
Bitcoin price climbed higher amid renewed hopes of a potential ceasefire deal between the U.S. and Iran after the latter hinted that its officials are ready to abandon pursuing a nuclear enrichment program. This came just a day after U.S. naval forces began intercepting and blocking Iranian traffic at the Strait of Hormuz.
Following this, crude oil prices, which rose to nearly $120 yesterday, came crashing down under $100 at press time, reducing fears of global inflation and boosting risk assets such as Bitcoin.
Bitcoin price also benefited from anticipation surrounding the U.S. Producer Price Index (PPI) scheduled for release later today, as investors look for signs that wholesale inflation might come in lower than the 4.6% year-over-year forecast.
Risk assets, including Bitcoin, tend to thrive when PPI data shows cooling below expectations—currently estimated at a 1.2% monthly increase, as it suggests slowing inflation at the production level. This trend could encourage the central bank to pause its aggressive stance on interest rates or even begin cutting interest rates later this year.
Over $225 million in short positions from across derivatives markets also helped lift Bitcoin price as bears were forced to buy back their assets at a loss. This wave of forced buying created a short squeeze that provided the necessary fuel to accelerate the current market breakout.
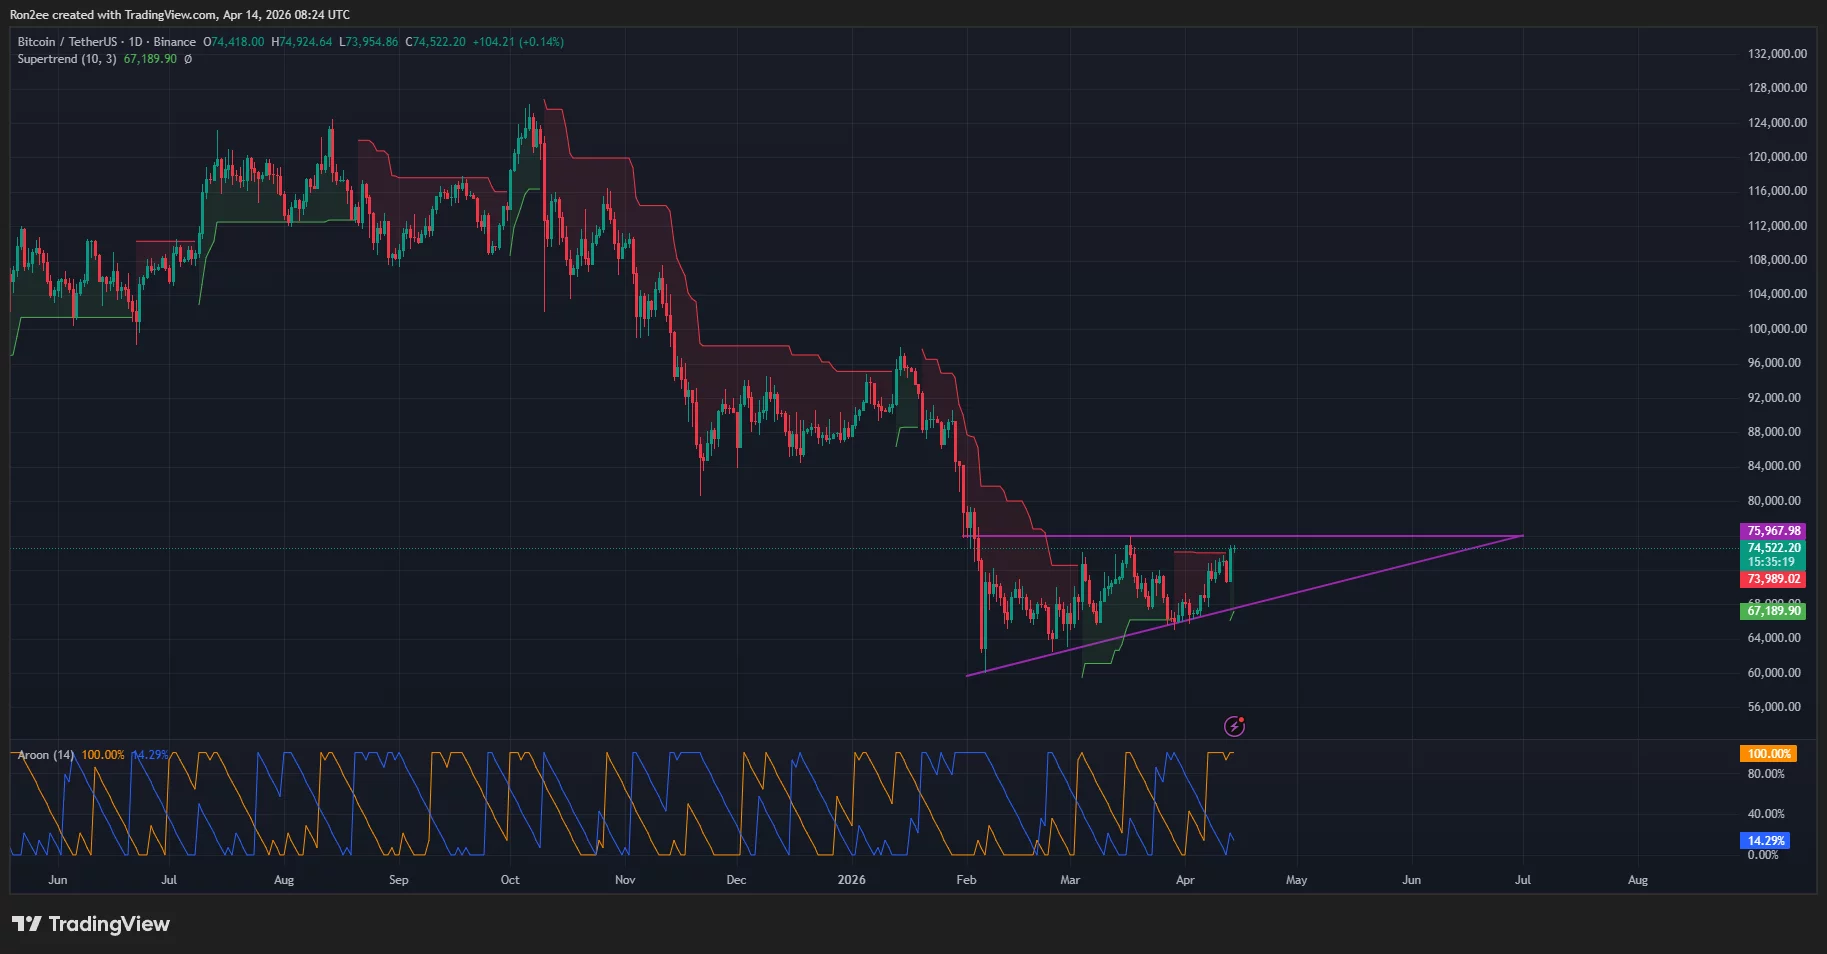
On the daily chart, Bitcoin has been forming an ascending triangle pattern that it has been developing since its drop in early February this year. Following the recent Bitcoin rebound, the bellwether asset is moving closer toward breaking out of the upper horizontal trend line of the pattern at around $76,000.

A look at technical indicators shows that bulls currently maintain control of the market. The Supertrend has flipped green for the first time this month, which means the short-term momentum has shifted from bearish to bullish.
The Aroon Up sits at 100% while a much lower Aroon Down reading also reinforced the bullish view by suggesting that new highs are being reached while selling pressure remains weak.
For now, $76,000 is acting as the key resistance level to watch. A decisive breakout above the current triangle could embolden bulls to reach for the next immediate psychological resistance level at $80,000.
On the contrary, a drop below $72,000 could invalidate the short-term bullish setup.
Disclosure: This article does not represent investment advice. The content and materials featured on this page are for educational purposes only.

TLDR:
- Rakuten Wallet lists XRP on April 15, 2026, giving 44 million Rakuten Pay users direct access to the asset.
- Users can convert Rakuten Points into XRP, tapping a loyalty pool worth approximately $23 billion USD.
- XRP converted to Rakuten Cash becomes spendable at over five million merchant locations across Japan.
- Rakuten’s ecosystem records 5.6 trillion yen in annual GMV, placing XRP inside one of Asia’s largest commerce networks.
Rakuten Wallet will list XRP as a supported asset and payment method starting April 15, 2026. The move connects XRP to one of Japan’s largest consumer ecosystems.
Rakuten Pay serves 44 million users across the country. Users will be able to buy XRP directly with Rakuten Points or convert XRP into Rakuten Cash for everyday spending. The integration covers over five million merchant locations nationwide.
XRP Enters Japan’s Mainstream Commerce Network
Rakuten Pay is not a crypto-native platform. It is Japan’s everyday commerce app, used by tens of millions of consumers for routine purchases.
Bringing XRP into this environment puts the asset in front of users who may have never engaged with digital currencies before.
Through this integration, users can convert Rakuten Points directly into XRP. Rakuten has issued over three trillion points to date, which is equivalent to roughly $23 billion USD. That existing pool of value now has a direct pathway into digital assets.
Spending XRP will be straightforward for users. Once converted to Rakuten Cash, XRP can be used at any of the five million-plus merchants that accept Rakuten Pay across Japan. This gives XRP real transactional utility at a scale that few digital assets have reached in any market.
Crypto analyst Tatsuya Kohrogi noted the scale of the development on X, writing that Rakuten Pay has 44 million users and that “this isn’t a crypto-native app — it’s Japan’s everyday commerce platform.”
He described it as putting XRP in front of people who have never thought about crypto before.
The Numbers Behind the Rakuten Wallet and XRP Partnership
Rakuten’s broader ecosystem adds further weight to this development. The platform reports over 100 million total members and processes 5.6 trillion yen in annual e-commerce gross merchandise value. These figures place the XRP integration inside one of Asia’s most active digital commerce networks.
The loyalty points system alone represents a substantial entry point for digital asset adoption. With three trillion-plus points now convertible to XRP, the pipeline between traditional rewards and crypto is direct and accessible to everyday consumers.
Kohrogi also pointed out that XRP is “now embedded into its loyalty and payments infrastructure,” calling it a strong indicator of where broader digital asset adoption is heading. His post acknowledged the Rakuten Wallet team for executing the integration.
For XRP, the partnership represents access to a trusted, established consumer brand. Rakuten’s reputation in Japan is built on decades of retail and financial services.
That credibility now extends to XRP as a usable and purchasable digital asset within a familiar ecosystem.

Key Points
- Criminal organization demands payment from Kraken after obtaining video recordings of the exchange’s internal operations
- Chief Security Officer Nick Percoco states no system compromise occurred and all customer assets remain secure
- Approximately 2,000 user accounts may have been accessed during two distinct events in February 2025 and recently
- Federal authorities are collaborating with Kraken on the investigation, with one extortion scheme already neutralized
- Similar incident targeted Coinbase in May 2025, demanding $20 million following compromise of approximately 70,000 customer records
The cryptocurrency exchange Kraken has publicly declined to meet the demands of cybercriminals who captured video recordings of its internal operational systems and are threatening public disclosure. Nick Percoco, serving as the platform’s Chief Security Officer, announced the company’s position via X on Monday.
According to Percoco, the perpetrators recorded Kraken’s customer support personnel while they accessed internal client management platforms. This footage is now being weaponized to extract an undisclosed sum from the exchange.
“We will not pay these criminals,” Percoco declared. “We will not ever negotiate with bad actors.”
The exchange has verified that no complete system penetration took place. At no time were customer assets placed in jeopardy during either occurrence.
Two distinct security events form the foundation of this extortion campaign. The initial incident transpired in February 2025, when evidence suggests a Kraken support staff member recorded internal platform activities. A subsequent incident following a comparable methodology occurred more recently.
In each situation, Kraken responded swiftly to recognize the security risk and terminate unauthorized access. The platform reports successfully dismantling one extortion scheme tied to this criminal activity.
Approximately 2,000 customer accounts on Kraken’s platform were potentially accessed throughout both security incidents. The exchange has initiated contact with all potentially impacted users.
Federal Authorities Join Investigation
Kraken has engaged federal law enforcement agencies to pursue the criminal organization. Percoco indicated the ongoing investigation may result in apprehensions.
The platform is additionally coordinating with cybersecurity specialists across the industry. Percoco stated the organization is partnering to “investigate and disrupt insider recruitment efforts” focused on cryptocurrency, gaming, and telecommunications sectors.
Internal security risks have emerged as an escalating challenge throughout the digital currency ecosystem. The North Korean-linked Lazarus Group has gained notoriety for infiltrating operatives within legitimate organizations, with security researchers documenting no fewer than 60 identified Lazarus-connected developers working for cryptocurrency ventures.
Coinbase Experienced Comparable Extortion Scheme
Kraken isn’t the inaugural prominent exchange confronting this type of criminal pressure. During May 2025, Coinbase revealed that cybercriminals demanded $20 million to prevent the release of customer information.
That security incident impacted approximately 70,000 platform users and stemmed from corruption payments made to international customer support personnel.
Overall cryptocurrency security incidents have demonstrated an upward trajectory. Blockchain intelligence provider Nominis reports that more than $178 million vanished through significant crypto-related attacks during March 2026, representing a substantial increase from $49.3 million recorded in February.
Authorization exploitation emerged as the predominant attack vector throughout March, with targets inadvertently approving transactions that granted attackers complete control over their digital assets.
Percoco emphasized that protecting Kraken’s customers remains the platform’s “highest priority” and affirmed ongoing efforts to strengthen defenses against evolving security challenges.

Dina Asher-Smith & Julien Alfred set for Glasgow Commonwealth Games

Audio Reactive LED Strips Are Hard

Iran Just Used Bitcoin To Break US Sanctions! (Here’s What Nobody Told You)

Why Israel is blocking foreign journalists from entering

Bitcoin: We’re Entering The Most Dangerous Phase

Alan Cumming Brands Baftas Ceremony A ‘Triggering S**tshow’
Iran Just Used Bitcoin To Break US Sanctions! (Here’s What Nobody Told You)

XRP- DTCC = $100T Flip Of The Switch? – The Clarity Act & Crypto Tax? – AI XRP Price Target?

Hima Bindhu : Anantha Money Mantra 2.O – 762 |How to Attract Money |Money Affirmations |SumanTV USHA
-

 Politics4 days ago
US brings back mandatory military draft registration
-
 Sports4 days ago
Man United discover Nico Schlotterbeck transfer fee as defender reaches Dortmund agreement
-

 Fashion4 days ago
Weekend Open Thread: Veronica Beard
-

 Tech6 days ago
How Long Can You Drive With Expired Registration? What Florida Law Says
-

 Politics4 days ago
Malcolm In The Middle OG Turned Down ‘Buckets Of Money’ To Appear In Reboot
-

 Politics2 days ago
World Cup exit makes Italy enter crisis mode
-

 Crypto World5 days ago
Canary Capital Files SEC Registration for PEPE ETF
-

 Business4 days ago
Tesla Model Y Tops China Auto Sales in March 2026 With 39,827 Registrations, Beating Cheaper EVs and Gas Cars
-

 Fashion7 days ago
Let’s Discuss: DEI in 2026
-

 Crypto World6 days ago
Bitcoin recovers as US and Iran Agree a Ceasefire Deal
-

 Crypto World15 hours ago
The SEC Conditionalises DeFi Platforms to Be Avoided for Broker Registration
-
 NewsBeat1 day ago
Pep Guardiola and Gary Neville agree over Arsenal title problem that benefits Man City
-

 Crypto World12 hours ago
SEC Signals Exemption for Crypto Interfaces From Broker Registration
-

 Business4 days ago
OpenAI Halts Stargate UK Data Centre Project Over Energy Costs and Copyright Row
-

 Business3 days ago
Ireland Fuel Protests Enter Day 5 as Blockades Spark Shortages and Government Prepares Support Package
-

 Politics4 days ago
LBC Presenter Mocks Trump Over Iran War Failures
-

 Crypto World3 days ago
Federal judge blocks Arizona from bringing criminal charges against Kalshi
-

 Tech4 days ago
A version of Windows 10 released a decade ago is now eligible for additional security patches
-
 NewsBeat2 days ago
JD Vance announces ‘no agreement’ with Iran over nuclear weapons fear
-

 Business3 days ago
IMF retains floor for precautionary balances at SDR 20 billion
You must be logged in to post a comment Login