
Crypto World
What Happens to XRP if the $1.30 Demand Zone Breaks?
Ripple’s XRP remains under sustained bearish pressure, with the price continuing to print lower lows and failing to reclaim key supply zones. The broader structure still reflects a dominant downtrend, and the recent price action suggests sellers remain in control as the market approaches a critical demand area that could define the next directional move.
Ripple Price Analysis: The Daily Chart
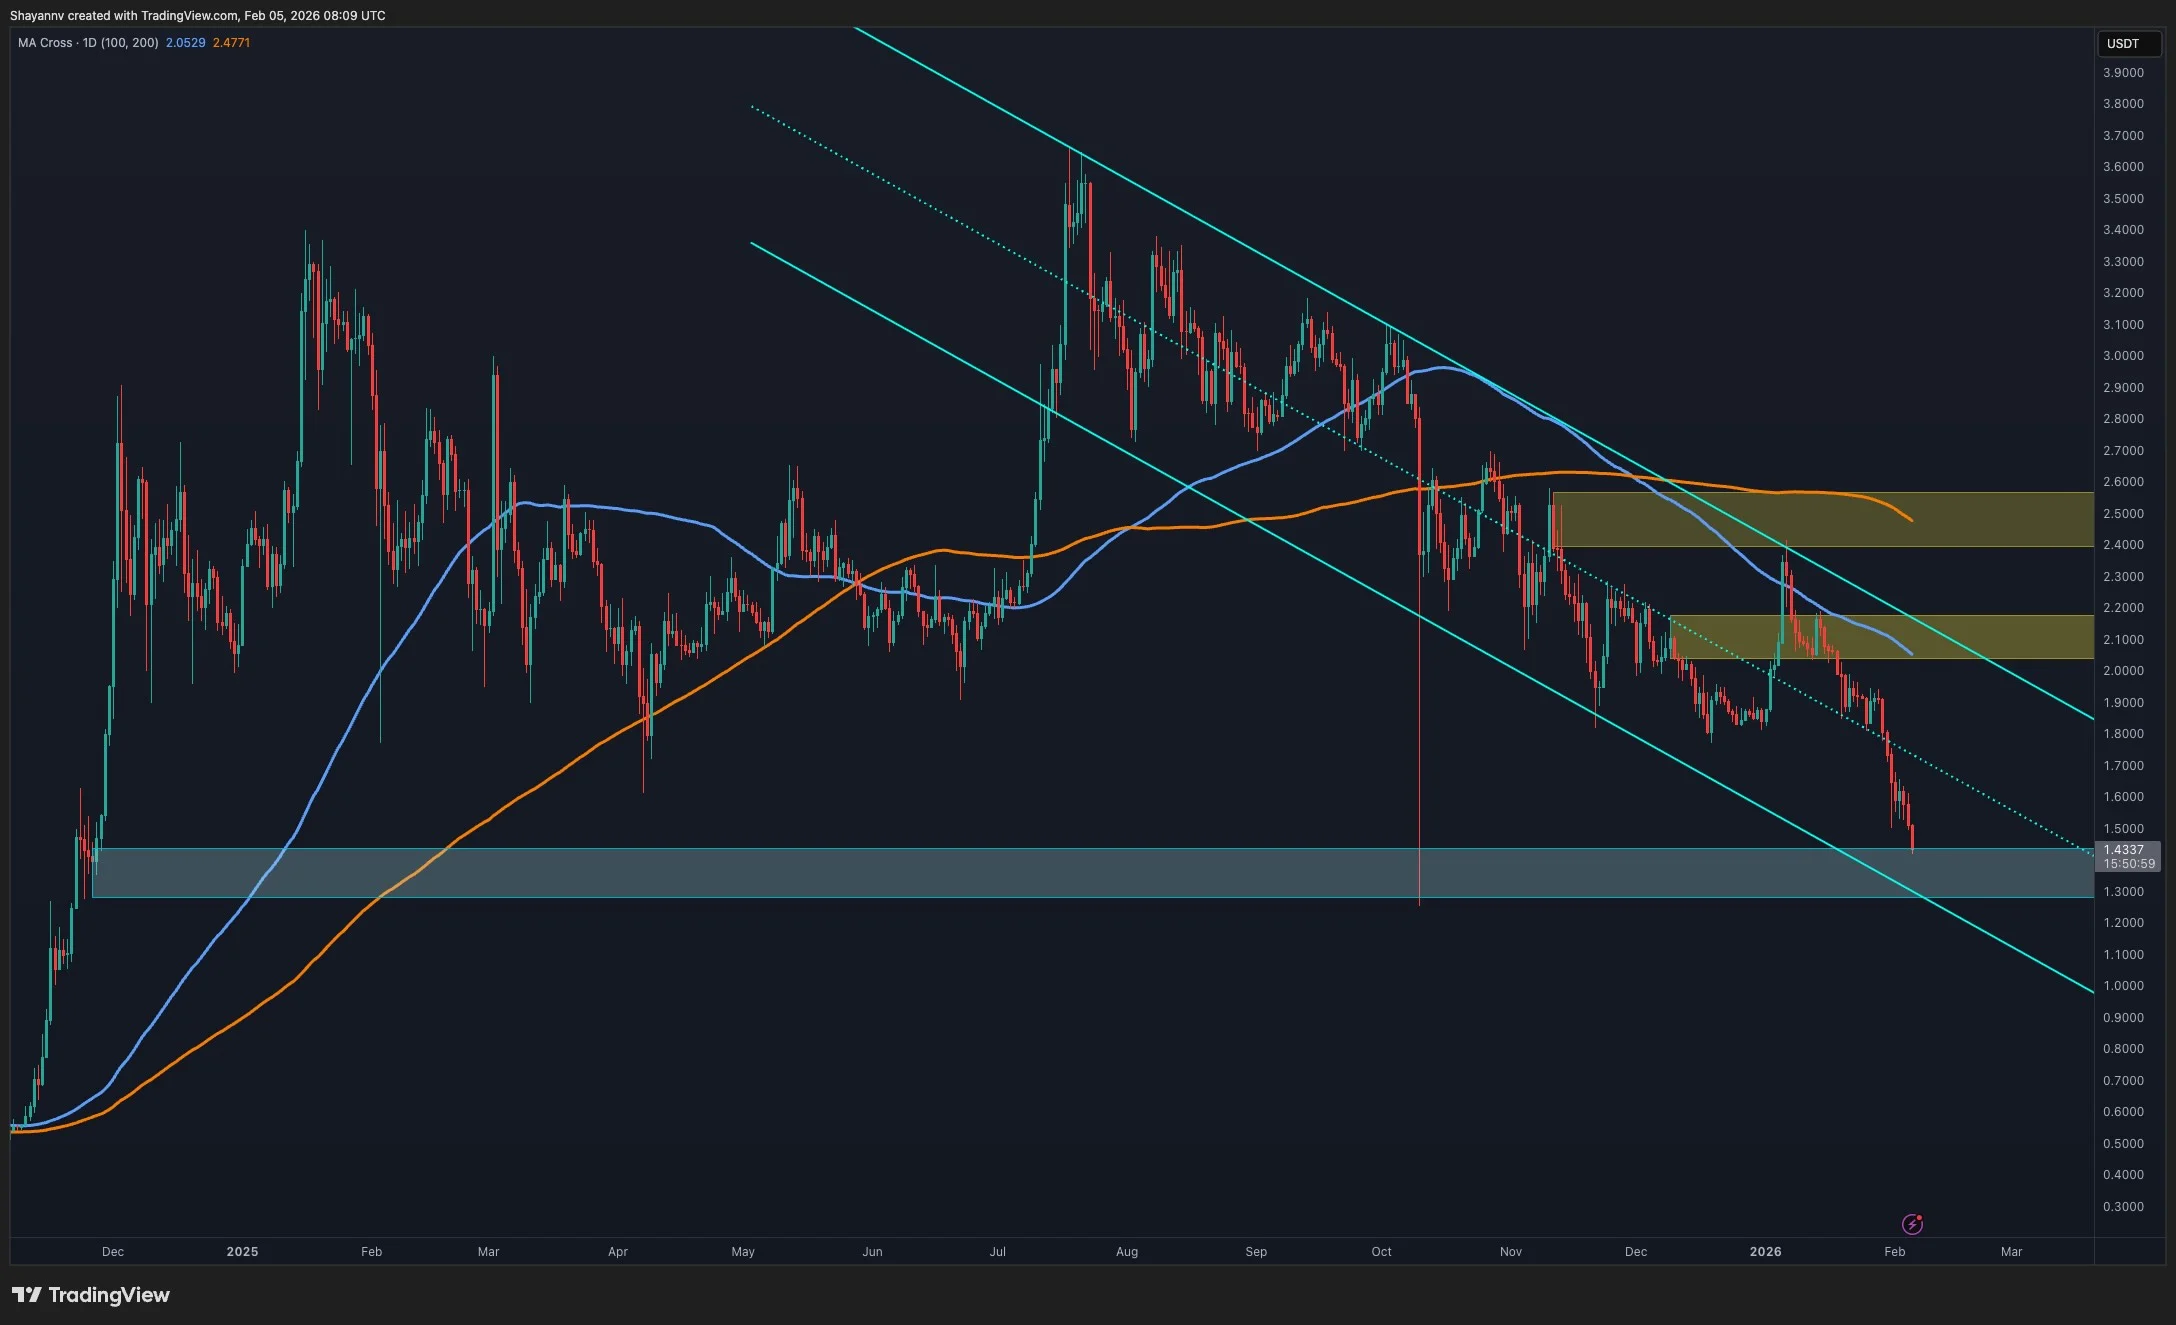
On the daily timeframe, XRP is trading deep within a bearish market structure, having lost multiple former support levels that have now flipped into resistance. The price is currently pressing into a well-defined demand zone at the $1.3 range highlighted on the chart, an area that previously acted as a base before the last impulsive upside move. This zone represents the first meaningful area where buyers may attempt to slow the decline.
However, the broader daily trend remains decisively bearish. Each corrective bounce over the past months has been capped by lower supply zones, and the asset has consistently respected these areas before continuing lower. As long as XRP remains below the channel’s mid-trendline of $1.6, any bounce from the current demand should be treated as corrective rather than trend-reversing.
Nevertheless, a failure to hold this demand zone would significantly weaken the structure and open the door for a deeper continuation toward lower, untested liquidity levels. Conversely, a strong daily reaction from this area would be required to signal short-term relief, but not yet a confirmed trend shift.
XRP/USDT 4-Hour Chart
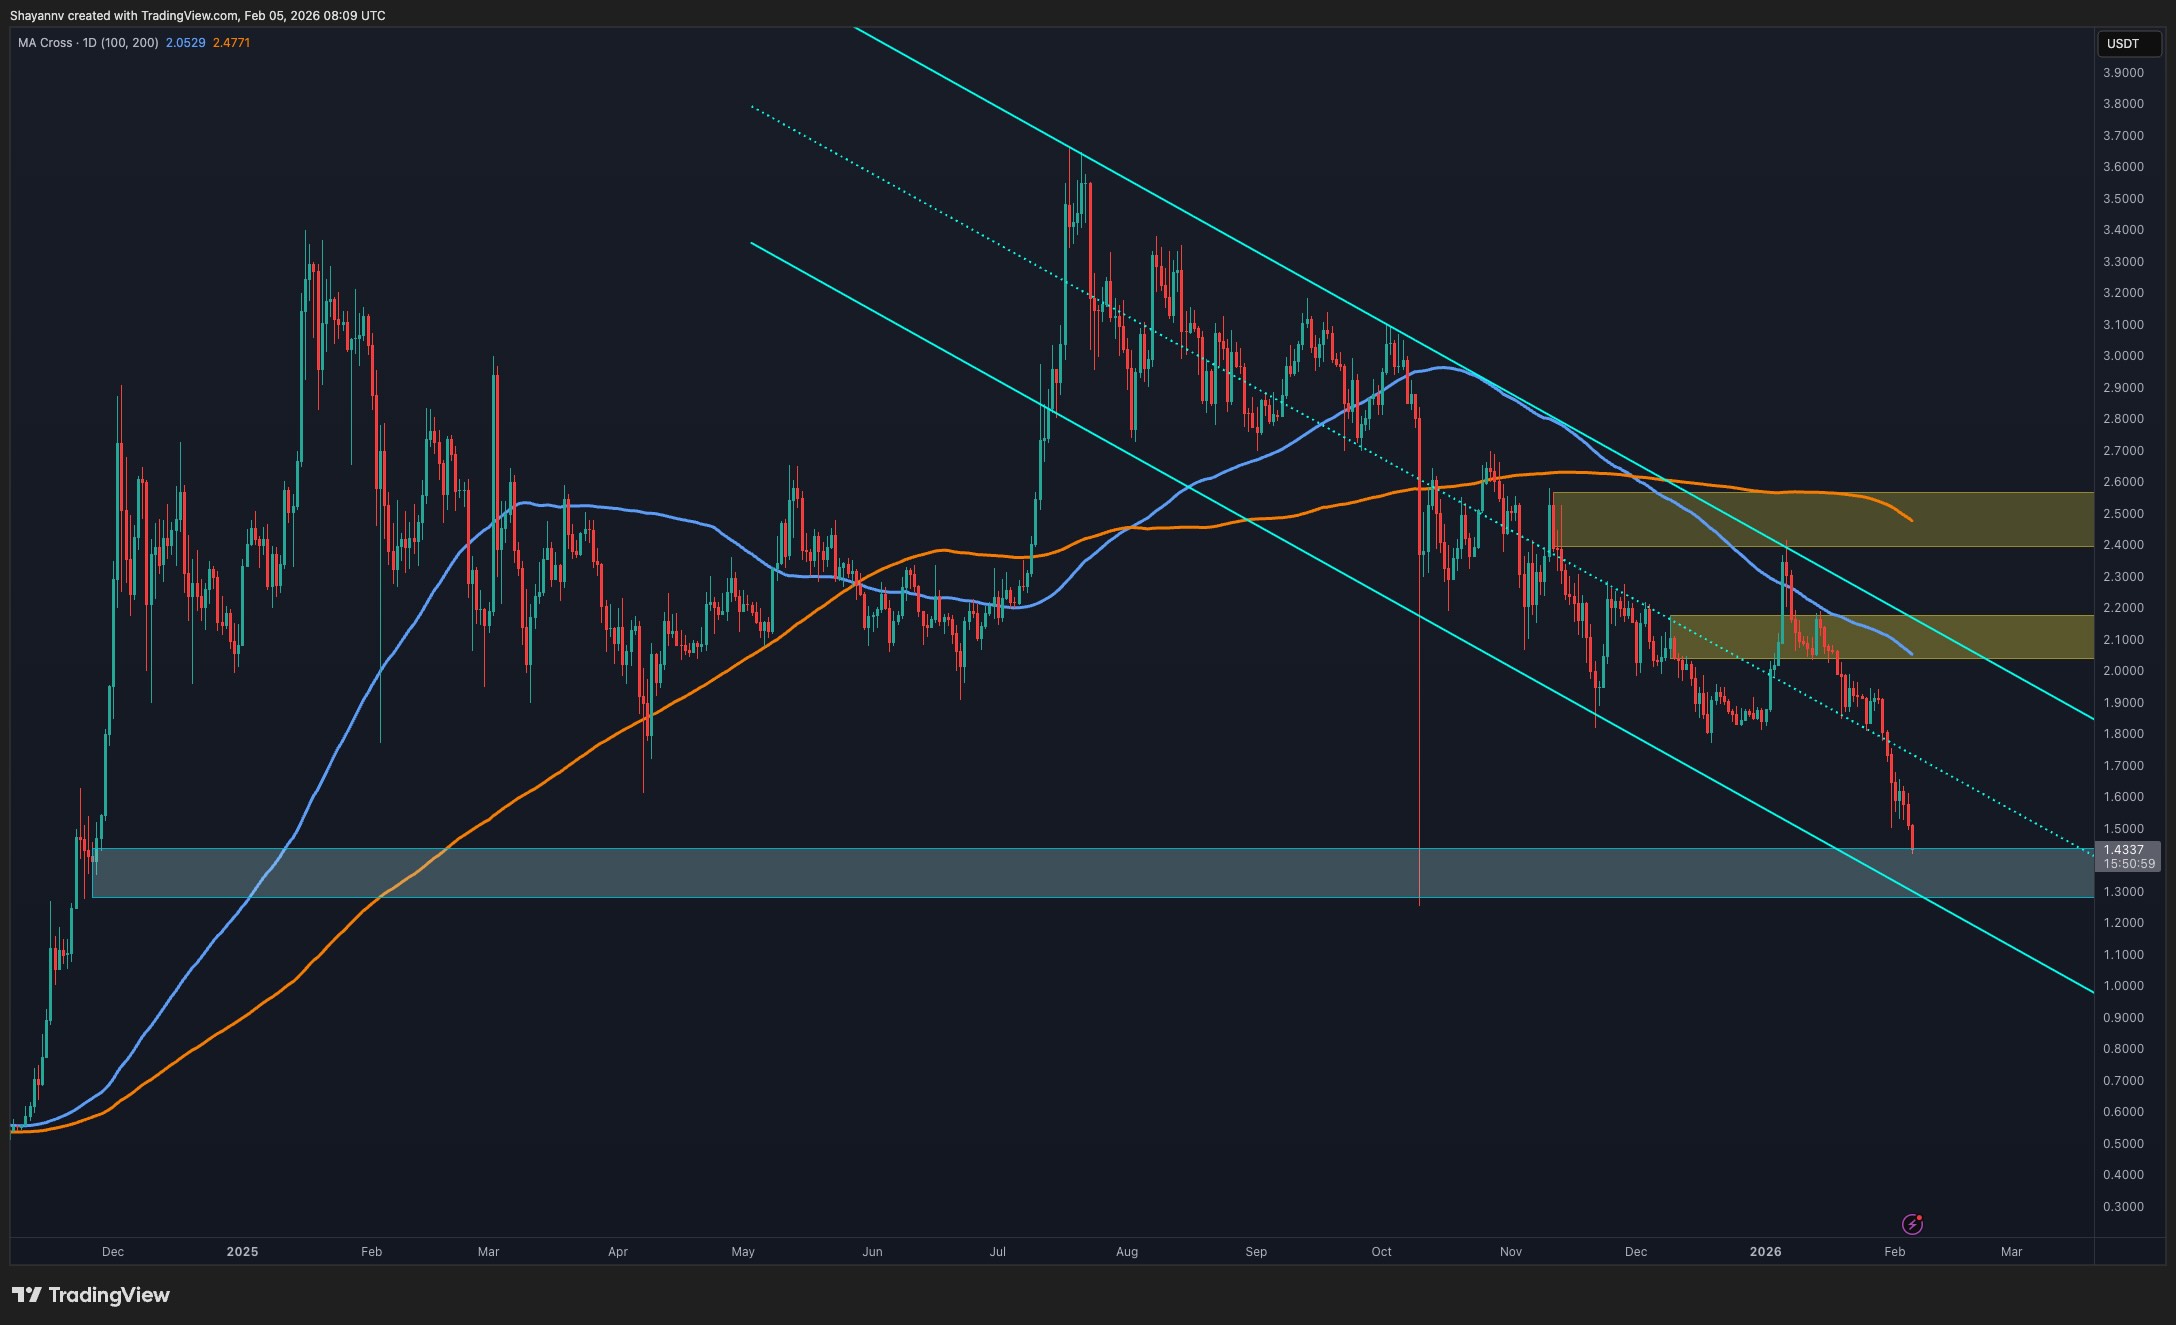
The 4-hour chart provides additional clarity on the internal structure of the downtrend. Recent price action shows a sharp rejection from successive supply zones, confirming that sellers are aggressively defending these levels.
Following the latest rejection, the asset accelerated lower and is now approaching the $1.3 critical support, which also aligns with the broader demand zone visible on the daily timeframe. This confluence increases the probability of at least a short-term reaction, as short sellers may begin to take profits and reactive buyers step in.
That said, the presence of multiple stacked supply zones above the current price at $1.6 and $2 significantly limits upside potential in the near term. Any rebound toward these levels would likely face renewed selling pressure, unless accompanied by a clear break in structure and acceptance above the channel. Until such confirmation appears, the 4-hour trend remains firmly bearish, with rallies best viewed as pullbacks within a broader downtrend.

SECRET PARTNERSHIP BONUS for CryptoPotato readers: Use this link to register and unlock $1,500 in exclusive BingX Exchange rewards (limited time offer).
Disclaimer: Information found on CryptoPotato is those of writers quoted. It does not represent the opinions of CryptoPotato on whether to buy, sell, or hold any investments. You are advised to conduct your own research before making any investment decisions. Use provided information at your own risk. See Disclaimer for more information.

The US Commodity Futures Trading Commission has given more details on its expectations for the use of crypto as collateral amid a pilot program that the agency launched last year.
In a notice on Friday, the CFTC’s Market Participants Division and Division of Clearing and Risk responded to frequently asked questions that emerged from two staff letters issued in December that established a pilot allowing crypto to be used as collateral in derivatives markets.
The notice reminded futures commission merchants wanting to take part in the pilot that they must file a notice with the Market Participants Division “which includes the date on which it will commence accepting crypto assets from customers as margin collateral.”
The crypto industry has argued that crypto technology is best suited for 24-7 trading and instant settlement, and the CFTC’s guidance in December clarified what tokenized assets can be used as collateral, along with how to value them and calculate how much is needed for a trading position.
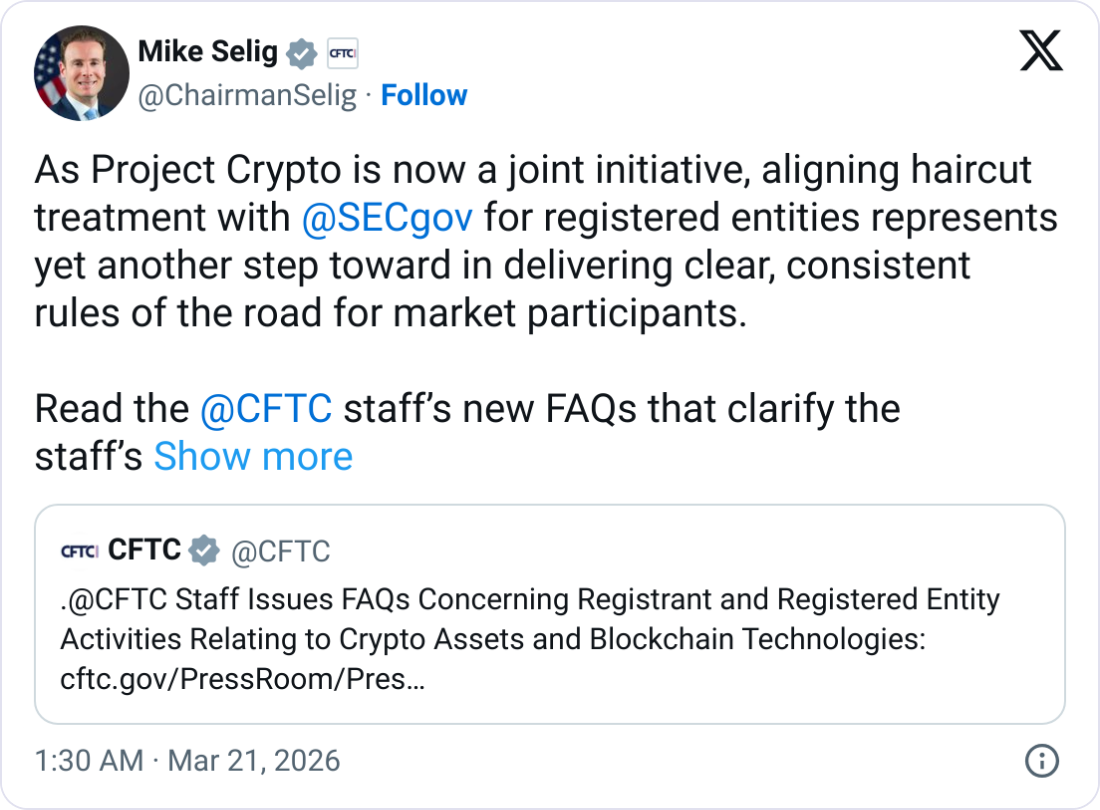
CFTC aligns guidance with SEC
The CFTC made clear its guidance was to align with the Securities and Exchange Commission, as the two agencies work together on a regulatory framework for crypto.
The CFTC said that capital charges, the amount that must be held to cover losses, would be “consistent with the SEC” and that futures commission merchants should apply a 20% capital charge for positions in Bitcoin (BTC) and Ether (ETH), while stablecoins should get a 2% charge.

The notice added that futures commission merchants taking part in the pilot can only accept Bitcoin, Ether, or stablecoins for the first three months and must give prompt notice of any significant cybersecurity or system issues. They must also file weekly reports of the total crypto held across customer account types.
After the three-month period, other cryptocurrencies can be accepted as collateral and the reporting requirements will end.
Related: SEC interpretation on crypto laws ‘a beginning, not an end,’ says Atkins
The notice also clarified that “only proprietary payment stablecoins may be deposited as residual interest in customer segregated accounts” and that futures commission merchants can’t accept other cryptocurrencies for that purpose.
The CFTC said that crypto and stablecoins cannot be used for collateral of uncleared swaps, but swap dealers can use tokenized versions of an eligible asset if it meets regulatory requirements and grants the holder the same rights in its traditional form.
Meanwhile, derivatives clearing organizations can accept crypto and stablecoins as initial margin for cleared transactions if they meet CFTC requirements regarding minimal credit, market, and liquidity risks.
Magazine: How crypto laws changed in 2025 — and how they’ll change in 2026
Brazil’s crypto tax policy is taking a back seat as the government focuses on an October 2026 presidential race, with officials delaying public consultation on crypto taxation until after the election cycle. Sources familiar with the matter told Reuters that regulators are hesitant to push divisive tax changes during an election year, though the topic remains on the radar for future consideration.
The policy environment in Brazil has already shifted markedly over the past year. In June 2025, Brazil ended its tax exemption for gains from smaller cryptocurrency sales or transfers, replacing it with a flat 17.5% capital gains tax that applies to profits from both onshore and offshore holdings, including self-custodied assets. The change marks a substantial tightening for retail investors who previously navigated a more lenient regime, and it set the stage for broader regulatory alignment of crypto activity with conventional tax rules.
In a separate development, Banco Central do Brasil unveiled rules in November 2025 that reframe stablecoin transfers as foreign currency exchanges, thereby bringing these transactions under the same tax framework as other FX movements. The government has also signaled potential proposals to tax cryptocurrencies used for international payments and is moving to align reporting obligations with the Crypto-Asset Reporting Framework (CARF), an international standard for monitoring crypto transactions.
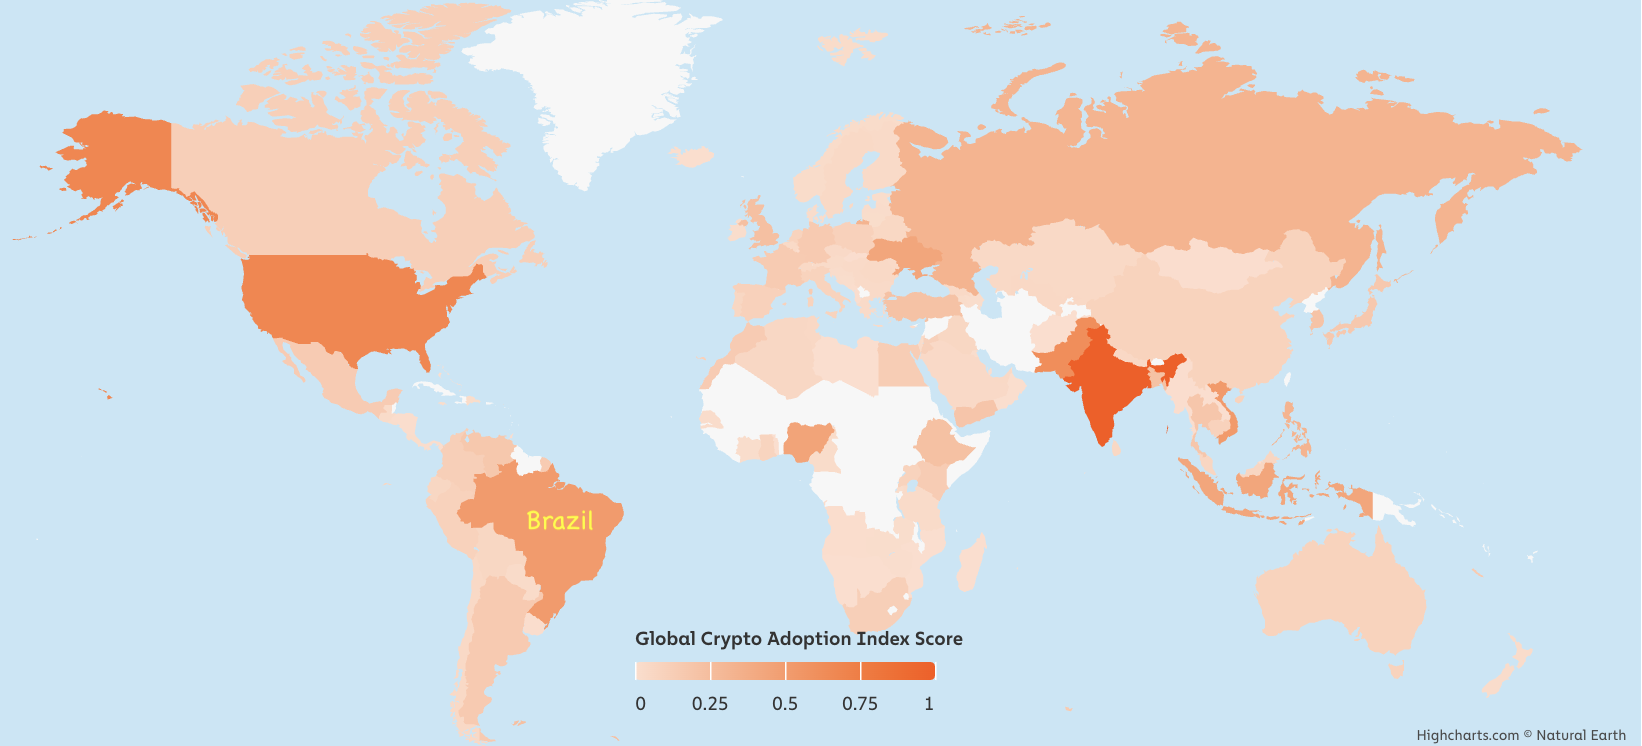
Amid these regulatory shifts, Brazil’s crypto ecosystem has continued to expand. The country—home to more than 213 million people with a median age around 33.5 and a predominantly urban population—remains a leading crypto market in Latin America. Chainalysis data placed Brazil fifth globally in the 2025 Global Crypto Adoption Index, and first within Latin America, underscoring the country’s rapid embrace of digital assets among both retail and institutional players. In 2025, Latin America’s crypto adoption grew by about 63%, a reflection of broader regional momentum that Brazil has helped to drive.
Beyond tax and oversight, the Brazilian payments landscape has been evolving as well. The Pix instant payment system, already widely used domestically, has begun expanding its footprint beyond Brazil’s borders, signaling a growing ecosystem that could influence cross-border crypto activity and policy considerations in the region.
Key takeaways
- Brazil delays public consultation on crypto tax policy until after the 2026 presidential elections, with a potential slip into 2027, according to Reuters.
- As of June 2025, Brazil imposes a 17.5% flat tax on crypto capital gains, replacing the prior exemption for smaller sales and transfers.
- November 2025 rules from Banco Central treat stablecoin transfers as foreign currency exchanges, bringing them under existing tax laws.
- CARF alignment is on the radar, as Brazil seeks to harmonize crypto reporting with the Crypto-Asset Reporting Framework.
- Brazil remains a standout crypto market in Latin America, ranking fifth globally in Chainalysis’s 2025 index and first in the region, with Latin America’s adoption rising 63% in 2025.
Adoption, policy, and the road ahead
Brazil’s regulatory posture illustrates a broader tension visible across many jurisdictions: balancing a thriving crypto economy with the need for clear, stable tax and reporting rules. The decision to pause a public consultation on crypto taxation reflects a strategic calculus that policymakers often make in the heat of electoral campaigns. Yet the substance of policy—tighter tax treatment of gains, stricter treatment of cross-border transfers, and stronger alignment with international reporting standards—appears to be moving forward in the background.
For investors, traders, and builders, the shift to a 17.5% flat tax on capital gains marks a more predictable tax environment for many participants, particularly those who previously benefited from exemptions or progressive rates. However, the removal of exemptions also raises the bar for compliance and reporting, especially for individuals with offshore or self-custodial positions. The ongoing alignment with CARF suggests greater transparency and standardized reporting, which could facilitate cross-border activity while increasing the regulatory burden for some market participants.
Brazil’s position as a regional crypto hub matters beyond national borders. The country’s adoption momentum—reflected in Chainalysis’s ranking and the growth trajectory across Latin America—gives policymakers a clear signal about the potential economic benefits of a well-regulated crypto sector. It also raises questions about how Brazilian rules will interact with regional standards and bilateral fintech partnerships, particularly as cross-border payments and stablecoin use gain ground.
On the technology and payments front, the Pix system’s expansion into Argentina hints at a broader cross-national digital payments narrative that could influence both consumer behavior and the regulatory dialogue around crypto. If these cross-border payments channels become more integrated with crypto rails, Brazil’s regulatory stance—whether it tightens further or onboards more participants—will likely influence neighboring markets and the regional stance on digital asset taxation and reporting.
As politicians and regulators weigh the next steps, market watchers should track two key developments: the outcome of the 2026 election and the timing of any post-election crypto tax consultations. Clarity on the latter will be essential for market participants planning tax optimization, compliance workflows, and product launches within Brazil’s rapidly evolving crypto landscape.
Crypto World
Best Crypto to Buy Now: Strategy Just Spent $1.57 Billion on Bitcoin During Fear While Early Investors Quietly Enter Pepeto for 150x Potential

Strategy just filed an SEC disclosure confirming it purchased 22,337 BTC at $70,194 per coin between March 9 and 15 according to Bitcoin Magazine.
That is $1.57 billion deployed in one week while the market panicked about Iran, oil at $98, and the Fed holding rates. Total holdings sit at 761,068 BTC worth over $57 billion. When the largest corporate Bitcoin buyer adds over a billion in a week of fear, that is conviction. But Strategy could not enter a presale. Retail investors can.
The best crypto to buy now is not the asset that needs to double from $70,500. It is the early stage entry where presale to listing math creates returns large caps cannot produce.
Strategy’s latest SEC filing confirms it purchased 22,337 BTC funded through STRC preferred share sales, bringing total holdings to 761,068 BTC at a cost basis of $57.61 billion according to Bitcoin Magazine.
Goldman Sachs projected two more rate cuts in 2026 that would bring rates to 3.0% to 3.25%, improving conditions for risk assets including crypto according to Intellectia.
Institutional capital flows in while retail sits frozen. The best crypto to buy now is the entry that captures the gap between fear pricing and the listing that closes the presale window permanently.
Best Crypto to Watch in 2026: Pepeto, Solana, and Cardano Compared
Pepeto: The Best Crypto to Buy Now Before the Listing Changes Everything
Strategy could not enter a presale. Most retail investors do not realize they can, and that is the gap Pepeto closes. While institutions added Bitcoin at $70,000, the exchange being constructed behind Pepeto is what convinced over $8 million in capital to enter during this correction.
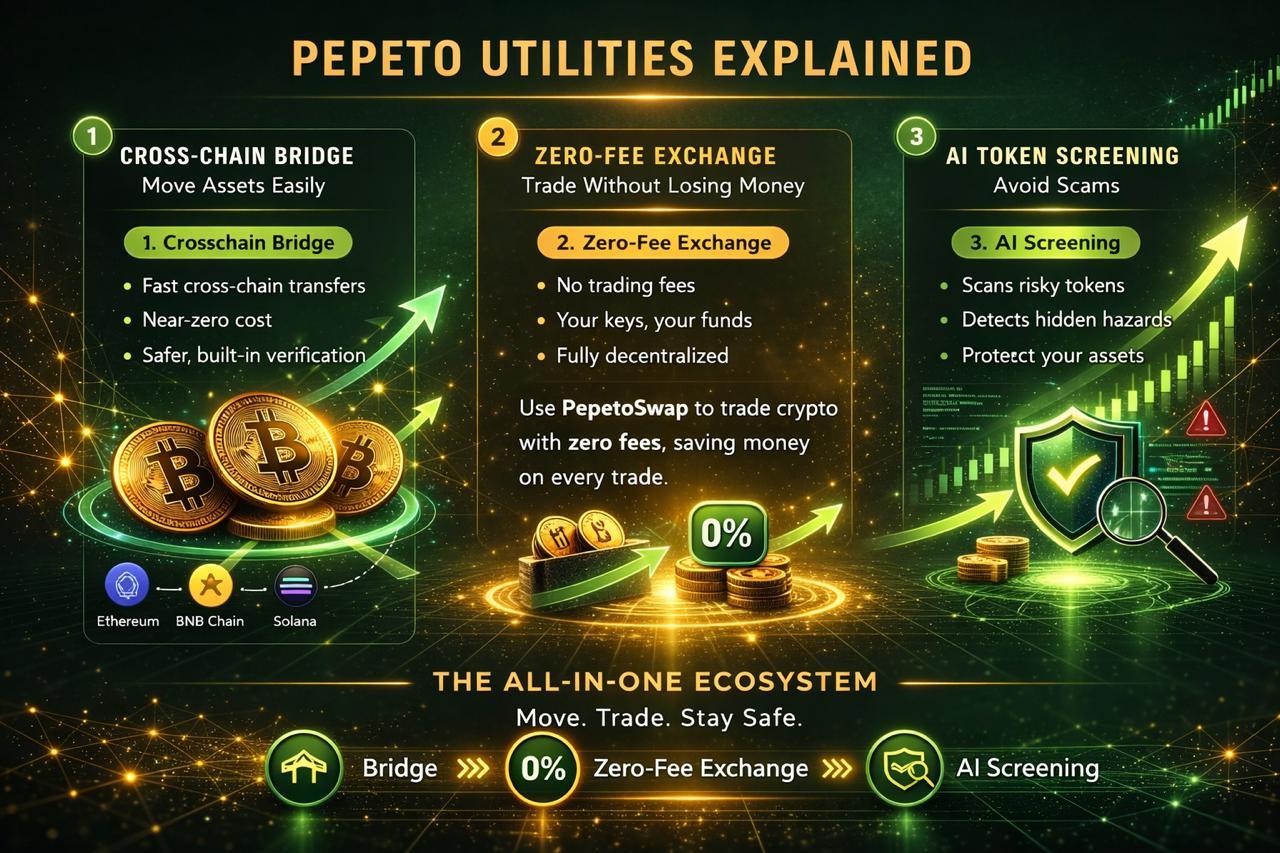
What makes Pepeto different is the innovation investors see taking shape. A fee free trading platform designed to keep your capital intact on every trade. A chain to chain bridge built to move tokens across networks without losing a single unit. Investors recognize what this infrastructure means once the exchange listing with Binance brings it to the full market.

Now in its final presale stages at $0.000000186, past the $8 million mark in funding, the infrastructure behind Pepeto has driven predictions that outperform every large cap forecast for 2026. The founder who took Pepe to $11 billion on 420 trillion tokens and zero products is now constructing the exchange Pepe never had. SolidProof verified every contract before the presale opened, and a Binance insider is steering the platform toward listing. Staking at 195% APY gives early holders growing positions from entry.
Pepeto is the best crypto to buy now because the gap between this presale price and a confirmed listing is where returns are created. The stages fill faster every round, and wallets that do not commit before the listing will spend this cycle wishing they had.
Solana (SOL)
Solana is trading at $89.86, down roughly 65% from its November 2025 all time high near $260 according to CoinMarketCap.
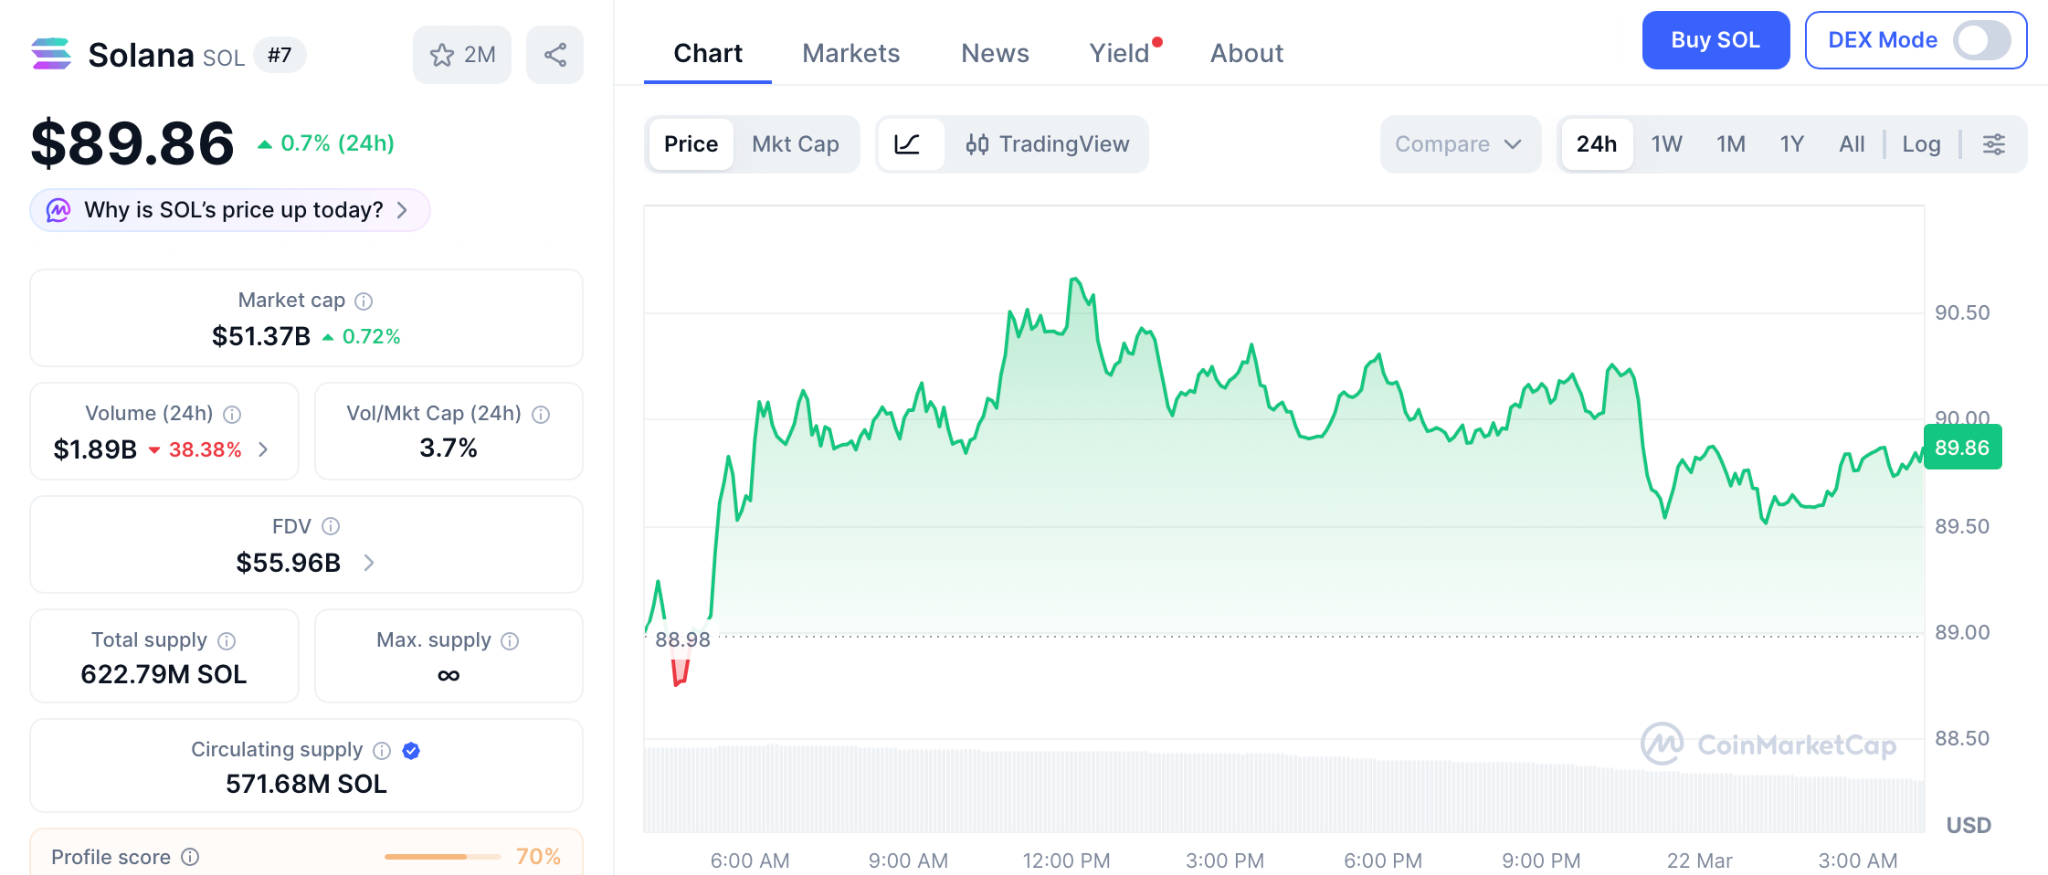
SOL has one of the strongest on chain narratives in 2026 with record breaking metrics from 2025. SOL ETFs continue leading altcoin inflows. A bullish reversal could push SOL toward $200, roughly 2x from current levels.
For investors looking for the best crypto to buy now, 2x is decent but nowhere near what a presale to listing entry delivers.
Cardano (ADA)
Cardano is trading at $0.265, having dropped from $0.297 in late February according to CoinMarketCap.
ADA has hardly attempted a recovery while other tokens at least tested breakout levels. The lack of any significant catalyst has pushed investors to look for alternatives with real movement. Some traders are comparing it to the xrp price prediction narrative where even recent dips have not stopped breakout talk.
ADA would need to triple just to revisit $0.80, and for investors searching for the best crypto to buy now, Pepeto’s presale math makes that comparison feel irrelevant.
Conclusion
That combination of meme virality and exchange infrastructure on the Ethereum blockchain is why analysts call Pepeto the best crypto to buy now. The wallets entering every stage are linked to addresses that held major ETH positions through multiple cycles. They built wealth by recognizing infrastructure early and they only commit when they see something the broader market has not caught up to. The Pepeto official website is where those entries are being made right now, the ones set to make the returns every crypto holder dreams about.
Secure the best crypto to buy now before the listing closes this window
Click To Visit Pepeto Website To Enter The Presale

FAQs
How does Strategy’s $1.57 billion Bitcoin purchase affect the best crypto to buy decision?
Strategy bought 22,337 BTC during peak fear, confirming institutional conviction. But retail investors have access to presale entries like Pepeto where the math from entry to listing creates returns BTC at $70,500 cannot deliver.
What is the best crypto to buy now for maximum returns in 2026?
Pepeto at presale pricing targets 150x to the level Pepe reached with zero products. SOL at $89.86 targets 2x. ADA at $0.265 has stalled. The presale to listing math makes the decision clear.
Why is Pepeto called the best crypto to buy now?
Same Pepe cofounder, 420 trillion supply, SolidProof audit, over $8 million raised, and a confirmed Binance listing ahead. Visit the Pepeto official website before the presale closes.
Disclaimer: This is a Press Release provided by a third party who is responsible for the content. Please conduct your own research before taking any action based on the content.

Brazil’s Finance Minister, Dario Durigan, is putting crypto tax policy on the back burner until after the country’s presidential elections in October 2026 to avoid pushing for “divisive” tax changes during an election year.
Regulators and government officials originally slated a public consultation on crypto tax policy for later this year, which may be delayed until 2027, but still “remains on the radar,” sources familiar with the matter told Reuters.
Brazil ended its no tax policy on gains from smaller cryptocurrency sales or transfers in June 2025, shifting to a 17.5% flat tax on crypto capital gains, including those made from offshore and self-custodial holdings.
Under the previous rules, residents who sold up to 35,000 Brazilian real, equivalent to about $6,587, per month were exempt from capital gains taxes on any profits, and investors who surpassed this threshold were subject to progressive tax rates between 15% and 22.5%.
In November 2025, Banco Central do Brasil, the country’s central bank, published rules that treat stablecoin transfers as foreign currency exchange, subject to the same tax laws.
The Brazilian government is also eyeing proposals to tax cryptocurrencies used for international payments and is aligning its reporting rules to be consistent with regulations under the Crypto-Asset Reporting Framework (CARF), an international monitoring standard for crypto transactions.
The decision to place the crypto tax consultation on hiatus comes during a time when the South American country is rapidly adopting crypto, and the industry is growing in Brazil.
Related: Brazil’s Pix instant payment system expands to Argentina
Brazil is one of the top countries in the world for crypto adoption
Brazil ranks number five on Chainalysis’s crypto Global Adoption Index and ranks number one in terms of adoption in the Latin America region.

The country has a population of over 213 million people, with a median age of 33.5 years, and over 91% of the population lives in urban areas, according to data from Worldometer.
In 2025, “Latin America’s crypto adoption grew by 63%, reflecting rising adoption across both retail and institutional segments,” according to Chainalysis.
Magazine: ‘Painful to think about’: NFT Creator Nate Alex on selling 70 CryptoPunks too early
Crypto World
Bitcoin Price News: Bhutan Sells $72 Million in BTC Under Fiscal Pressure, but the Smart Money Entering Pepeto Sees What the Market Does Not

The bitcoin price news this week shows what happens when a sovereign nation becomes a forced seller. Bhutan’s state investment arm transferred 973 BTC worth $72.3 million in a single day, dropping its holdings from 13,295 BTC at peak to just 4,400 BTC according to The Crypto Basic.
What was once worth $1.5 billion is now $330 million. Bhutan did not have the choice to wait. Sovereign holders face fiscal demands that make them structural sellers at the worst possible times. The BTC price news looks rough on the surface.
Below it, the wallets that always profit during fear are entering a presale that the broader market has not priced in yet.
Bhutan’s state investment arm Druk Holding transferred 973 BTC worth $72.3 million in a single day on March 17, continuing a drawdown that has cut the kingdom’s holdings from 13,295 BTC at peak to roughly 4,400 BTC according to The Crypto Basic.
The selling appears driven by fiscal need, not strategy, with funds directed toward infrastructure projects including Gelephu Mindfulness City. Bhutan has now sold over $110 million in BTC this year alone according to FinanceFeeds.
Sovereign sellers are structurally different from retail or institutions because they sell regardless of price. The bitcoin price news is bearish short term, but capital that moves during fear captures the biggest returns when the cycle turns.
Bitcoin Price News 2026 and the Presale Where the Real Returns Live
Pepeto: The Entry That Could Change Lives
The BTC price news just showed retail investors what happens when the entire market raises cash at once. Most traders will use this moment to panic. The traders entering Pepeto will use it to secure positions while everyone else watches from the sidelines.
Most traders who missed early stages of major rallies did not have the right entry at the right time. Pepeto exists to close that gap. The exchange under construction includes a risk detection engine designed to surface dangerous contracts before your money goes near them, and a blockchain bridge connecting networks so your capital moves without a single token lost to fees. Investors see this innovation taking shape and recognize the gains potential once the listing opens it to millions of traders.

While the BTC price news shows a pullback, the capital entering Pepeto tells a different story. The builder behind the original Pepe coin, which reached $11 billion on an identical 420 trillion token count with zero products, is now constructing an exchange the original never had. SolidProof confirmed every contract before the presale opened. An experienced Binance figure drives the listing timeline forward.
Cleared $8 million in presale capital during this correction proves conviction enters during fear. Staking at 195% APY gives early holders growing positions from day one. A presale entry at $0.000000186 carries the kind of return potential the bitcoin price news will never generate. The Binance listing on the horizon is the catalyst, and the wallets committing now are building positions everyone else will reference when this cycle’s biggest winners are counted.
Bitcoin Price News: Targets, Levels, and the Macro Picture
Bitcoin is trading at $70,381, down 44% from its October 2025 all time high of $126,173 according to CoinMarketCap.
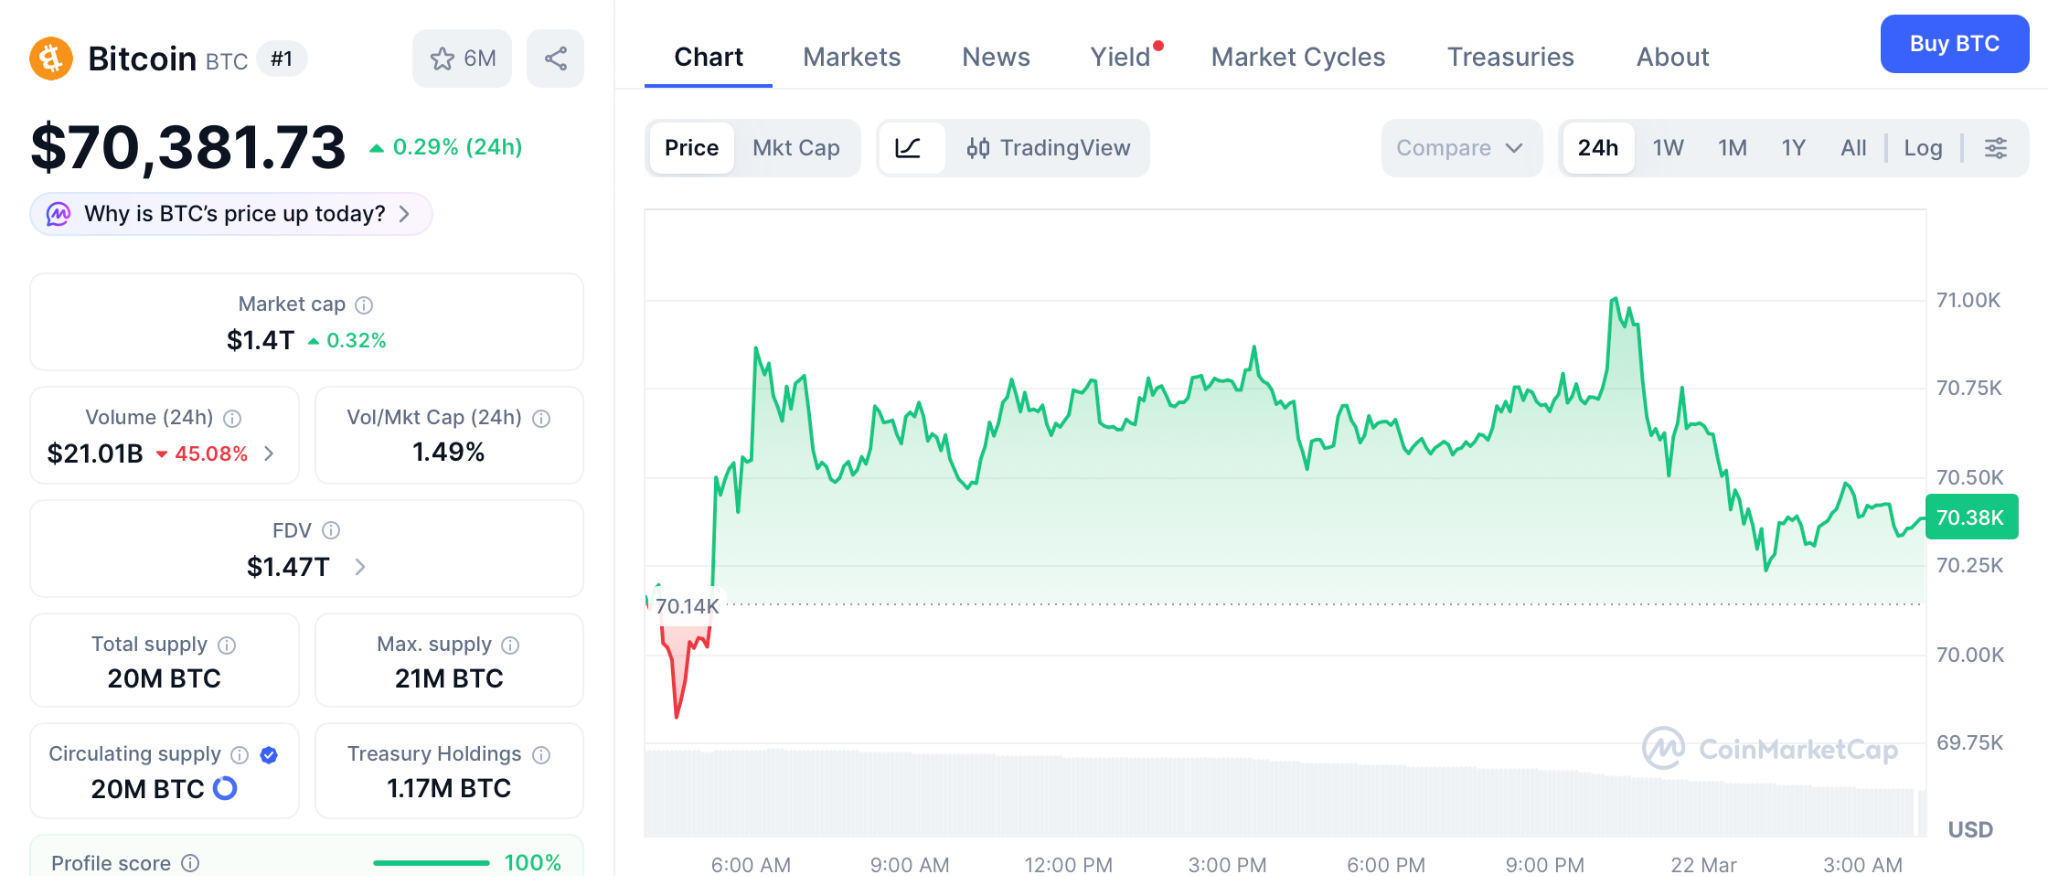
Analyst consensus for 2026 clusters between $120,000 and $175,000. CoinShares expects $120,000 to $170,000. Bit Mining projects $225,000 in the bull case. Corporate treasuries now hold over 1.09 million BTC worth roughly $110 billion according to FXEmpire. Reclaiming $72,749 eases the bearish pressure.
Losing $67,000 opens deeper losses. Even in the best case at $150,000, BTC delivers roughly 2x from here. Those returns are decent for a portfolio anchor but will never match the multiples the presale to listing window creates.
Bitcoin Price News Is Bearish, but the Presale That Whales Entered During Fear Is Where the Returns Are Built
The whales buying Pepeto are sending the strongest signal in this presale because they see what the listing delivers. The exchange infrastructure fixes the one thing every meme coin lacked: a reason for demand to keep growing after launch instead of fading.
But the main wealth driver is viral energy. Shiba Inu delivered over 25,000% to early buyers on virality alone with zero products. Pepeto carries stronger virality into a market with higher volume, and the Binance listing drawing closer is the catalyst that pushes the price to its peak.
The presale entry right now is the same window that created every crypto millionaire story people still reference today. The Pepeto official website is where that window remains open, but not for long.
Click To Visit Pepeto Website To Enter The Presale

FAQs
What does the $13.5 billion Deribit derivatives expiry mean for the bitcoin price news?
The March 27 expiry could trigger volatility as traders close or roll positions. The bitcoin price news is bearish short term, but conviction capital is entering Pepeto’s presale during the fear.
What is the bitcoin price prediction for 2026?
Analysts target $120,000 to $225,000 for BTC. Even at $150,000 that is 2x from $70,381. Pepeto at presale pricing targets 150x to the level Pepe reached with zero products.
Why are investors choosing Pepeto over Bitcoin right now?
BTC offers 2x to $150,000. Pepeto targets 150x from presale to listing with the same Pepe cofounder and a listing on Binance confirmed. Visit the Pepeto official website before the presale closes.
Disclaimer: This is a Press Release provided by a third party who is responsible for the content. Please conduct your own research before taking any action based on the content.
Bitcoin traded in a narrow range near $70,000 on Friday after a stumble to reclaim the $75,000 level earlier in the week. The back-to-back sessions of net outflows from U.S.-listed spot Bitcoin ETFs cooled a recent run of inflows, prompting traders to reassess whether institutions are turning more cautious in the face of a firmer inflation backdrop and renewed risk-off mood across markets.
Two days of net outflows, totaling about $254 million, were recorded in the ETF space, a magnitude not yet decisive enough to signal a wholesale shift in sentiment. Yet the move comes as macro headlines remain unhelpful to a rapid policy pivot from the Federal Reserve. Oil has remained stubbornly elevated, complicating inflation dynamics and, in turn, the Fed’s likely path for rate cuts. The broader risk-off tone was reinforced by a slide in equity markets and a softening of traditional hedges.
Key takeaways
- Bitcoin persists near $70,000 amid two days of spot ETF outflows totaling $254 million, not yet confirming a bearish regime flip.
- Options markets show elevated hedging: put options on Bitcoin are trading at roughly 2.5 times the premium of calls, with a 30-day delta skew around 16%—a sign of caution among professional traders.
- Macro pressures loom large as oil remains above $94 per barrel, complicating growth expectations and potentially delaying further rate cuts, according to Oxford Economics.
- The S&P 500 slid to its lowest level in six months, while gold fell about 10% over a multi-day stretch, underscoring a broad risk-off environment that weighs on Bitcoin beyond its own fundamentals.
Oil shock and the inflation problem
The price of West Texas Intermediate (WTI) crude has held above $94 a barrel since March 12, marking a roughly 50% move higher from a month prior. Analysts argue that supply disruptions in the Middle East—alongside ongoing energy-market volatility—boost inflationary pressures and constrain the Federal Reserve’s ability to slash rates, at least in the near term. An Oxford Economics analysis highlighted how higher energy costs could dampen consumer spending and ripple through import-dependent manufacturing, potentially fueling tangible price pressures across the economy.
Market participants are watching for how energy dynamics intersect with Fed policy and equity risk appetite. The combination of higher fuel costs and geopolitical risk tends to steer investors toward hedging strategies and safer assets, even as Bitcoin’s own fundamentals may present a different risk profile for traders long on crypto exposure.
Bitcoin derivatives signal risk-off posture among professionals
Deribit data, as tracked by Laevitas, shows a notable tilt toward protective positioning among Bitcoin options traders. The put-to-call premium on Friday was nearly 2.5 times the premium for equivalent call options, signaling a pronounced demand for downside protection. This echoes previous episodes when macro shocks or geopolitical developments prompted a similar shift in the derivatives world.
To interpret whether this hedging translates into actual downside risk coverage, traders look at the delta skew—a measure of the relative pricing of puts versus calls. The 30-day delta skew stood at about 16% on Friday, implying professional participants were skeptical that the $69,000 to $70,000 area would prove sturdy in the near term. While not at the panic levels seen in past episodes, the figure reflects a market bracing for further volatility amid a 21% slide in Bitcoin’s price over the past three months, even as gold and U.S. equities displayed more resilience.
The price action also frames a broader question: can Bitcoin hold the line above $70,000 as macro uncertainty persists? A strong rally to $75,000 earlier in the week failed to translate into a sustained shift in the options market, suggesting a continued appetite among traders for risk mitigation rather than outright exposure.
Market observers note that a sustained, meaningful divergence between spot price performance and derivatives signals could offer clues about potential future moves. In this environment, the balance between macro risk and crypto-specific catalysts will likely determine whether hedging remains dominant or if risk appetite returns to Bitcoin’s price action.
For additional context on institutional sentiment during this period, readers can consider earlier coverage noting that larger players have not necessarily abandoned risk assets—even as they pursue strategies that hedge downside risk. Earlier coverage noted that institutions aren’t waiting for the bottom, indicating a nuanced approach rather than a wholesale retreat.
What the data imply for investors and builders
First, the two-day $254 million ETF outflow does not by itself signal a decisive shift in institutional stance. Yet it sits within a broader process where macro risk and energy volatility shape risk tolerance. Investors should watch whether outflows persist or subside in coming weeks, and how that interacts with the price regime Bitcoin can sustain above key levels such as $70,000.
Second, the elevated put-to-call premium and a positive delta skew imply sophisticated market participants are prioritizing downside protection. For traders, this could translate into more pronounced hedging around macro-sensitive milestones, such as inflation readings, central-bank guidance, or geopolitical headlines. For builders and developers, the data emphasize the importance of risk modeling that accounts for regime shifts in macro conditions and derivatives positioning, beyond simply tracking spot price snapshots.
Finally, the energy and geopolitical backdrop remains a potential source of ongoing volatility. With oil hovering at elevated levels and the risk of supply disruptions persisting, policy responses and financial conditions will continue to influence crypto markets. Readers should monitor oil-price trajectories, central-bank communications, and the evolving relationship between traditional markets and digital-asset liquidity flows as the year unfolds.
Meanwhile, Bitcoin’s performance remains juxtaposed against a broader macro landscape where stocks and precious metals are reacting to the same risk-off impulses that pressure crypto markets. The coming weeks will reveal whether Bitcoin can establish a firmer floor around the $70,000 mark or if further downside protection becomes increasingly essential for market participants.
As always, readers should stay tuned to macro developments, on-chain signals, and the evolving dynamics of investor appetite. The next move—whether risk assets regain footing or volatility remains elevated—will likely hinge on how inflation, energy prices, and geopolitical tensions unfold in the near term.
Crypto World
BNB Price Prediction Eyes $1,000 as Grayscale Expands Crypto ETFs, but Pepeto’s Presale Is the Entry That Binance Whales Are Choosing First
The bnb price prediction for 2026 just received a fresh tailwind. Grayscale filed with the SEC to launch an ETF tied to Hyperliquid’s token HYPE, expanding the crypto ETF universe beyond Bitcoin and Ethereum according to crypto.news.
BNB Chain holds $3.2 billion in distributed real world asset value, positioning it second only to Ethereum according to CoinGecko.
As institutional capital keeps flowing into the Binance ecosystem, the bnb price outlook looks increasingly bullish. But traders who understand return math know that BNB at $641 has a very different ceiling than a presale approaching the same Binance listing. This article covers the BNB price targets and the presale pulling smart money away from large caps.
Grayscale’s proposed HYPE ETF would give investors exposure to Hyperliquid’s token without holding it directly according to crypto.news.
The filing adds to a growing list of firms building investment products tied to newer digital assets. BNB Chain registered major ecosystem growth with $3.2 billion in RWA value and the Ondo integration bringing tokenized stocks onto the network according to CoinGecko.
BNB Chain also launched the ERC 8183 AI agent standard, creating new utility. The bnb price prediction benefits from this institutional buildout, but for traders hunting the biggest returns, the presale window is where the real math lives.
BNB Price Prediction 2026 and the Presale Where the Real Returns Are Being Built
Pepeto: The Exchange Presale Where Innovation Draws Capital Before the Listing
Pepeto is constructing the kind of exchange that gives traders a real edge once it launches. With institutional frameworks expanding and ETF products multiplying, the wallets entering this presale see what this exchange becomes after the listing opens it to millions.
A zero cost trading system designed to keep every dollar of trading capital intact. A smart contract auditor built to flag dangerous tokens before your money goes near them. Investors recognize this innovation and the gains potential it carries.

The presale cleared over $8 million in committed capital, and the entry price at $0.000000186 signals that early investors see the potential in infrastructure driven plays. The person behind the original Pepe coin, which reached $11 billion on the full 420 trillion supply that mirrors Pepeto with zero products, is now constructing a complete exchange on Ethereum. Pepeto is fully verified by SolidProof, and a key Binance executive on the development team is guiding the platform toward a confirmed listing. Staking at 195% APY gives early holders an expanding position from the day they enter.
Every serious bnb price prediction factors in institutional capital flowing into the Binance ecosystem. When that ecosystem lists Pepeto, the presale price disappears permanently and wallets that entered at this level carry returns the BNB price takes years to deliver from $641.
BNB Price Prediction: Targets, Levels, and What the Data Shows
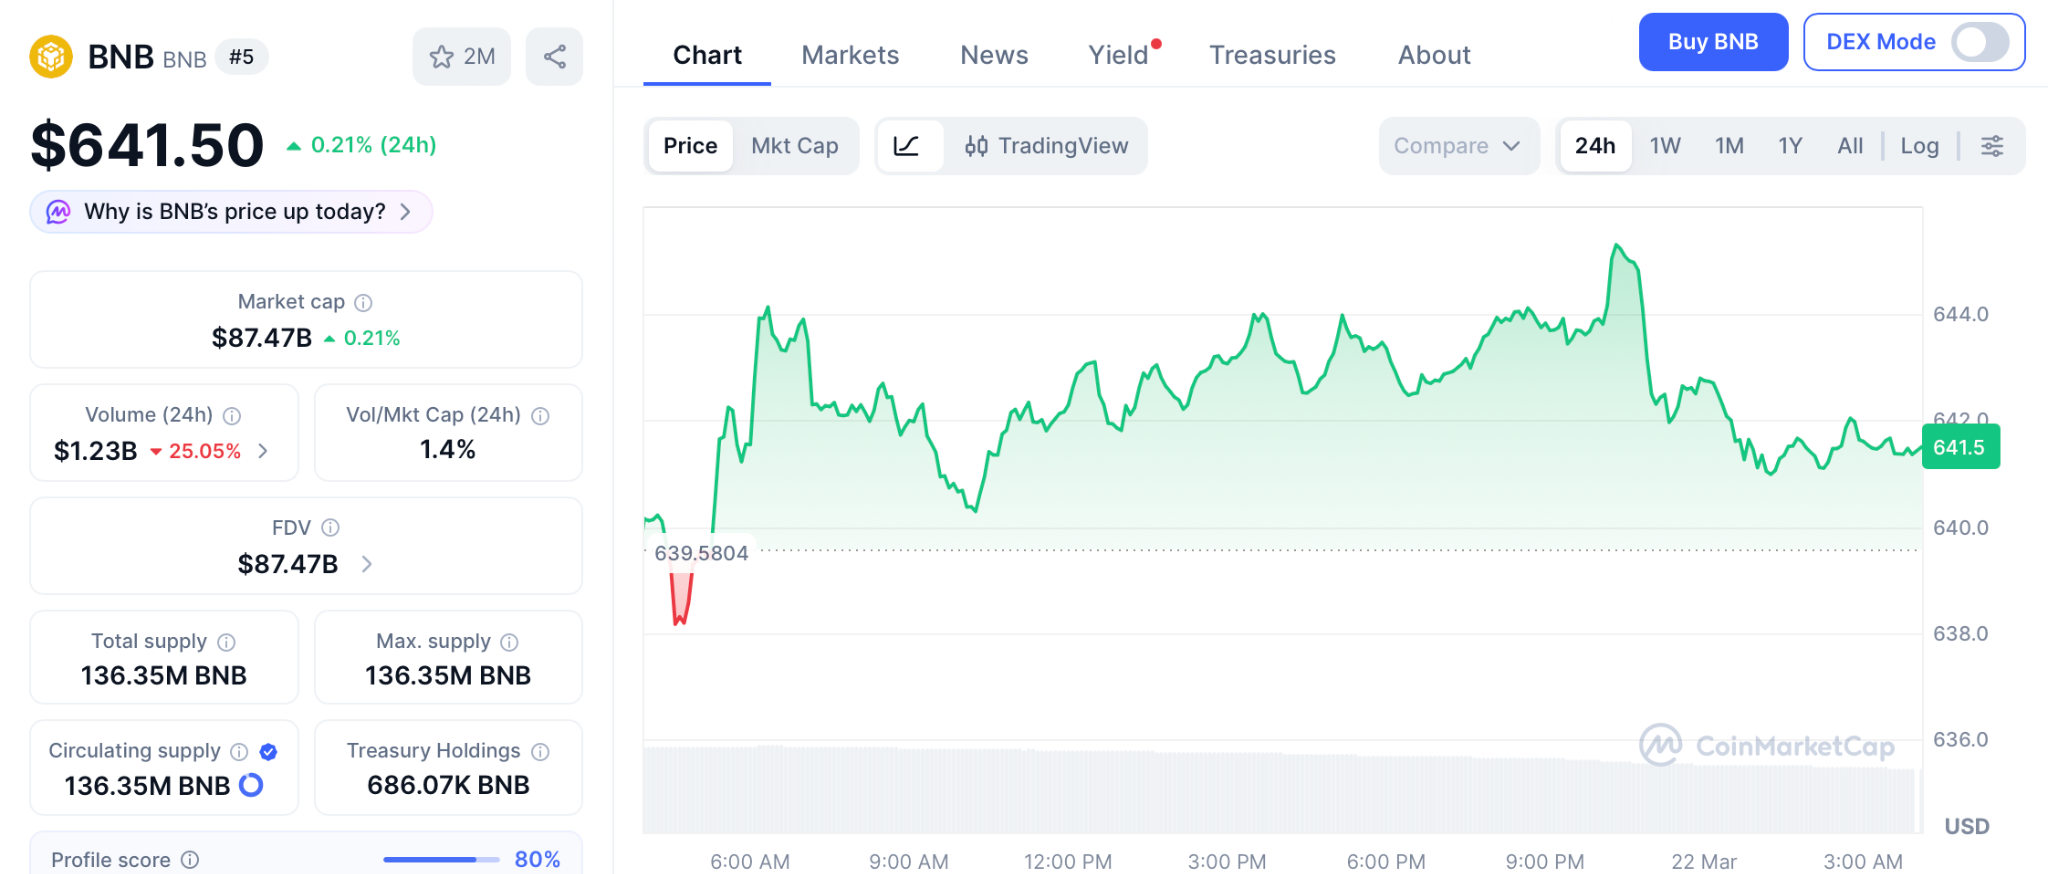
BNB is trading at $641, down roughly 53% from its all time high of $1,370 in late 2025 according to CoinMarketCap.
Changelly forecasts a 2026 range of $739 to $1,003, with an average around $871 according to Changelly. Binance user consensus targets $803 for this year. If the CLARITY Act passes and institutional adoption from Asian markets including Hong Kong’s $82 billion insurance sector flows into crypto, analysts see BNB reaching $1,200 to $1,500.
Even the bullish case at $1,000 is roughly 55% from current levels. For a token that powers the world’s largest exchange, the growth is real but the return math does not compare to a presale entry where the Binance listing event alone compresses years of large cap appreciation into a single moment.
BNB Price Prediction Shows Growth, but the Presale Approaching the Same Binance Listing Offers 150x
A strong portfolio should include an early stage entry because those are the ones that deliver the biggest multiples any large cap cannot match. Pepeto is making that choice easier, and the comparison with the original Pepe coin makes the future clearer than any BNB price prediction. This opportunity sits at presale pricing right now with a senior Binance executive on the team, past the $8 million mark in capital raised, and a confirmed listing drawing closer every day.
The investors who entered Pepe early and held made millions, and every one of them wishes they had committed more. Pepeto is that second chance with better infrastructure, the same cofounder, and a presale filling faster every week. The Pepeto official website is where investors who understand how rare this is are securing positions right now.
Enter the presale before the Binance listing closes this window permanently
Click To Visit Pepeto Website To Enter The Presale

FAQs
How does the Grayscale HYPE ETF filing affect the bnb price prediction?
Grayscale expanding crypto ETFs beyond BTC and ETH shows growing institutional appetite for the Binance ecosystem. This supports the bnb price outlook, but Pepeto’s presale to listing math offers multiples BNB cannot deliver from $641.
What is the bnb price prediction for 2026?
Analysts forecast $739 to $1,003 for BNB, with a bull case at $1,500 if Asian institutional adoption ramps up. Pepeto at presale pricing targets 150x to the level Pepe reached with zero products.
Is Pepeto a better investment than BNB right now?
BNB targets 55% gain to $1,000. Pepeto targets 150x from presale to listing with the same Pepe cofounder and the Binance listing on the horizon. Visit the Pepeto official website before the presale entry disappears.
Disclaimer: This is a Press Release provided by a third party who is responsible for the content. Please conduct your own research before taking any action based on the content.

TLDR:
- Bitcoin shows its longest decoupling from equities since 2020 amid ongoing macro uncertainty.
- A major liquidation event erased months of open interest in a single trading session.
- While equities held firm, Bitcoin continued to decline due to market-specific pressures.
- Correlation shifts reveal changing dynamics between crypto and traditional financial markets.
Bitcoin has entered its longest period of divergence from the S&P 500 since 2020, following a sharp market disruption.
While equities maintained strength during this period, Bitcoin continued its decline, reflecting a shift in correlation patterns between crypto and traditional markets.
The separation became more visible after October, when both markets began moving in different directions. Bitcoin lost momentum, while equities remained near their highs.
This divergence has now persisted for several months, marking a rare phase in recent market cycles.
Liquidation Event Reshapes Market Structure
Market data shows that Bitcoin’s recent decline began after a large liquidation event on October 10. Nearly 70,000 BTC in open interest was wiped out within a single session. This reset brought derivatives exposure back to levels last seen in April 2025.
The sudden unwind erased more than six months of accumulated positions. As a result, market structure weakened, leading to sustained selling pressure. Bitcoin failed to recover alongside equities, marking a clear break from earlier synchronized movements.
A tweet from Darkfost noted that Bitcoin entered a bear phase during this period. At the same time, the S&P 500 continued to perform, creating a visible gap between the two markets. This separation has now extended longer than any similar period seen since 2020.
In addition, the removal of leveraged positions reduced short-term upward momentum. Traders became more cautious, while liquidity conditions tightened. As a result, Bitcoin struggled to regain strength even during brief market rebounds.
Correlation Breakdown Signals Market Shift
Historically, Bitcoin and equities have shown periods of strong alignment, especially during liquidity-driven cycles. However, the current phase reflects a breakdown in that relationship. Correlation levels have dropped toward neutral or negative territory in recent months.
Bitcoin’s continued decline has been linked to broader geopolitical tensions affecting global markets. Even so, equities remained resilient for most of this period. This contrast reinforced the ongoing divergence between the two asset classes.
The divergence suggests that crypto markets reacted earlier to tightening conditions. While equities showed delayed weakness, Bitcoin had already adjusted through price corrections. This pattern aligns with previous cycles where crypto moved ahead of traditional assets.
At the same time, Bitcoin’s higher volatility has made it more sensitive to sudden shocks. The recent liquidation event amplified this effect, accelerating downside movement. Meanwhile, equities absorbed similar pressures more gradually and with less volatility.
As the correlation weakens, market participants continue to monitor whether alignment will return or divergence will persist. Current conditions suggest that both assets are responding differently to evolving macroeconomic pressures.
Crypto World
US Senators and White House Reach Tentative Deal to End Bank-Crypto Stablecoin Yield Clash
TLDR:
- Senators Tillis and Alsobrooks reached a White House-backed agreement in principle on stablecoin yield language.
- The deal proposes barring yield payments on passive balances to address bank concerns over deposit flight.
- White House adviser Patrick Witt called the agreement a major milestone toward passing the CLARITY Act.
- The agreement still requires vetting from banking and crypto industry groups before any final deal is confirmed.
Stablecoin regulation in the United States may be edging closer to a major breakthrough. Key senators and White House officials have reached a tentative agreement on crypto legislative language.
The deal addresses a long-standing clash between banks and digital asset firms over yield payments. Sen. Thom Tillis (R-N.C.) and Sen. Angela Alsobrooks (D-Md.) spearheaded the agreement. Their deal could unlock a path forward for landmark crypto legislation stalled since January.
Senators Bridge Partisan Divide Over Stablecoin Yield
The central dispute in this legislation has been about yield payments to stablecoin holders. Banks and Wall Street groups raised concerns about widespread deposit flight from traditional accounts.
They argued that stablecoin yield rewards could pull customers away from conventional banking products. The clash had been keeping the crypto bill stalled in the Senate Banking Committee since January.
Both Tillis and Alsobrooks acknowledged those banking concerns throughout the negotiation process. Alsobrooks confirmed the two senators have reached a deal, stating, “Sen. Tillis and I do have an agreement in principle.”
She added that the deal seeks to “protect innovation” while also giving lawmakers the opportunity to “prevent widespread deposit flight.” Her comments came during a Friday interview following talks with White House officials.
The new language is expected to target yield payments made on a passive balance. Alsobrooks confirmed the proposal will seek to bar yield payments “on a passive balance,” though full details remain undisclosed.
The specifics are still being worked through as lawmakers prepare to share the language with industry stakeholders.
Tillis echoed a cautiously optimistic tone when speaking about the progress made. “In working with the White House, I think we have an agreement,” he said in a separate interview.
He noted that the next step is to vet the language with industry, describing them as “a party to an ultimate deal.” He added that he feels “like we’re in a good place” with where negotiations currently stand.
White House Endorses Deal as Industry Review Awaits
The White House played an active role in brokering the tentative stablecoin agreement. Patrick Witt, a top White House crypto policy adviser, publicly addressed the development on X.
He credited both Tillis and Alsobrooks “for bridging the partisan divide to tackle a difficult issue.” His public comments came shortly after the story of the agreement was first published.
Witt also acknowledged in his post that more work remains before the bill is finalized. He wrote that there is “more work to be done to close out this and other outstanding issues.”
Despite that, he described the development as “a major milestone toward passing the CLARITY Act.” That bill has been held up in part due to the ongoing bank-crypto yield dispute.
Still, the agreement does not guarantee automatic support from the banking and crypto industries. Both sectors will need to review the final language before giving any formal endorsement.
Industry groups on both sides have strong interests in the outcome of this legislation. Any final version of the bill will need broad backing from both sectors to pass.
The coming weeks will be critical in determining whether the CLARITY Act can advance. Senators and White House officials will continue working to address any remaining sticking points. A finalized agreement could clear the way for a vote in the Senate Banking Committee.
TLDR:
- Whale unrealized profit ratios remain between 1 and 1.5, showing balanced market positioning without excess pressure
- Historical data links low whale profit zones with accumulation phases and the start of upward price trends
- No spike above 3 suggests Ethereum has not reached overheated conditions seen in past cycle peaks
- Current structure supports gradual price growth rather than sharp rallies or immediate market reversals
Ethereum’s long-term market structure shows a steady recovery, with whale profitability pointing to a developing uptrend rather than a peak phase.
Data tracking price movements and unrealized profit ratios suggest that the market remains balanced, with no strong signs of distribution pressure.
The chart, covering 2016 through early 2026, aligns Ethereum’s price with the profitability of whale wallets. Large holders across multiple tiers appear to have returned to profit, a condition historically linked to early-cycle growth.
Whale Profitability Returns as Market Stabilizes
Ethereum’s price cycles have consistently moved alongside whale profit ratios. During previous bull runs, profit levels surged above 3, followed by sharp corrections. In contrast, bear market phases pushed ratios closer to zero, marking accumulation zones.
The current range sits between 1 and 1.5, which reflects moderate profitability. This level has previously appeared during transition periods between accumulation and expansion phases. As a result, the market structure appears stable rather than overheated.
A recent tweet by analyst CW noted that wallets holding over 100,000 ETH have moved back into profit. The tweet stated that past transitions from loss to profit often marked the beginning of upward trends. That pattern now appears to be forming again.
At the same time, earlier cycles show similar behavior. In 2019 and 2020, whale profitability remained low before gradually rising. Those phases later led to sustained price growth. The current setup mirrors those earlier conditions without showing excess momentum.
Mid-Cycle Structure Supports Gradual Price Movement
Ethereum’s present structure reflects a mid-cycle phase rather than a late-stage rally. Profit ratios have not reached extreme levels, which reduces the likelihood of immediate large-scale selling by major holders.
During the 2021 peak, profit ratios climbed above 3.5 as prices approached all-time highs. That environment encouraged distribution as whales secured gains. The absence of such levels today suggests a different market stage.
Price action between $2,000 and $3,000 aligns with this moderate profitability range. The market appears to be building strength gradually, instead of accelerating into a sharp rally. This behavior often precedes more extended upward movement.
The lack of rapid spikes in whale profit indicates steady accumulation or holding patterns. When combined with historical data, this condition has often led to continued price expansion over time.
If profit ratios begin rising toward 2.5 or higher, the market could enter a stronger growth phase. However, a sudden move above 3 would require close monitoring, as past cycles show such levels near turning points.
As of this writing, the structure remains balanced. Whale profitability supports a developing trend without signaling overheating. As a result, Ethereum appears positioned within an early growth phase rather than nearing a cycle peak.

Senators pounce on Leafs early to coast to victory

MacBook Neo review: the new king of budget laptops

check the description to know more #business #farming #investment #money


-

 Tech6 days ago
Your Legally Registered ‘Motorcycle’ Might Not Count Under Proposed US Law
-

 Fashion1 day ago
Weekend Open Thread: Adidas – Corporette.com
-

 Politics1 day ago
Jenni Murray, Long-Serving Woman’s Hour Presenter, Dies Aged 75
-
 Tech4 days ago
Are Split Spacebars the Next Big Gaming Keyboard Trend?
-

 News Videos3 days ago
RBA board divided on rate cut, unusually buoyant share market | Finance Report | ABC NEWS
-

 Crypto World3 hours ago
Best Crypto to Buy Now: Strategy Just Spent $1.57 Billion on Bitcoin During Fear While Early Investors Quietly Enter Pepeto for 150x Potential
-

 Crypto World4 hours ago
Bitcoin Price News: Bhutan Sells $72 Million in BTC Under Fiscal Pressure, but the Smart Money Entering Pepeto Sees What the Market Does Not
-

 Business6 days ago
Search for Savannah Guthrie’s Mother Enters Seventh Week with No Arrests
-
 Crypto World1 day ago
NIO (NIO) Stock Plunges 6.5% as Shelf Registration Sparks Dilution Worries
-

 Business6 days ago
Australian shares drop as Iran war enters third week
-

 Crypto World6 days ago
Crypto Lender BlockFills Enters Chapter 11 with Up to $500M in Liabilities
-

 Politics4 days ago
The House | The new register to protect children from their abusers shows Parliament at its best
-

 Fashion6 days ago
25 Celebrities with Curly Hair That Are Naturally Beautiful
-

 Tech2 days ago
inKONBINI Lets You Spend Summer Days Behind the Register
-

 Crypto World3 days ago
Canada’s FINTRAC revokes registrations of 23 crypto MSBs in AML crackdown
-
 Politics4 days ago
Real-time pollution monitoring calls after boy nearly dies
-
 NewsBeat3 days ago
Residents in North Lanarkshire reminded to register to vote in Scottish Parliament Election
-

 News Videos3 days ago
PARLIAMENT OF MALAWI – PAC MEETING WITH REGISTRAR OF FINANCIAL ON AMARYLLIS HOTEL – INQUIRY LIVE
-

 Business6 days ago
Meta planning major layoffs as AI spending and automation reshape workforce
-

 Politics7 days ago
9 Stylish Leather Jackets Perfect For Spring 2026
You must be logged in to post a comment Login