
CryptoCurrency
What To Expect in January 2026?
Hedera has faced persistent bearish pressure over the past two months, tracking weakness across the broader crypto market. HBAR price declined steadily as risk appetite faded and capital rotated into defensive positions.
Despite recent losses, market structure suggests January could mark a meaningful shift in momentum for the altcoin.
Sponsored
HBAR’s History Speaks For Itself
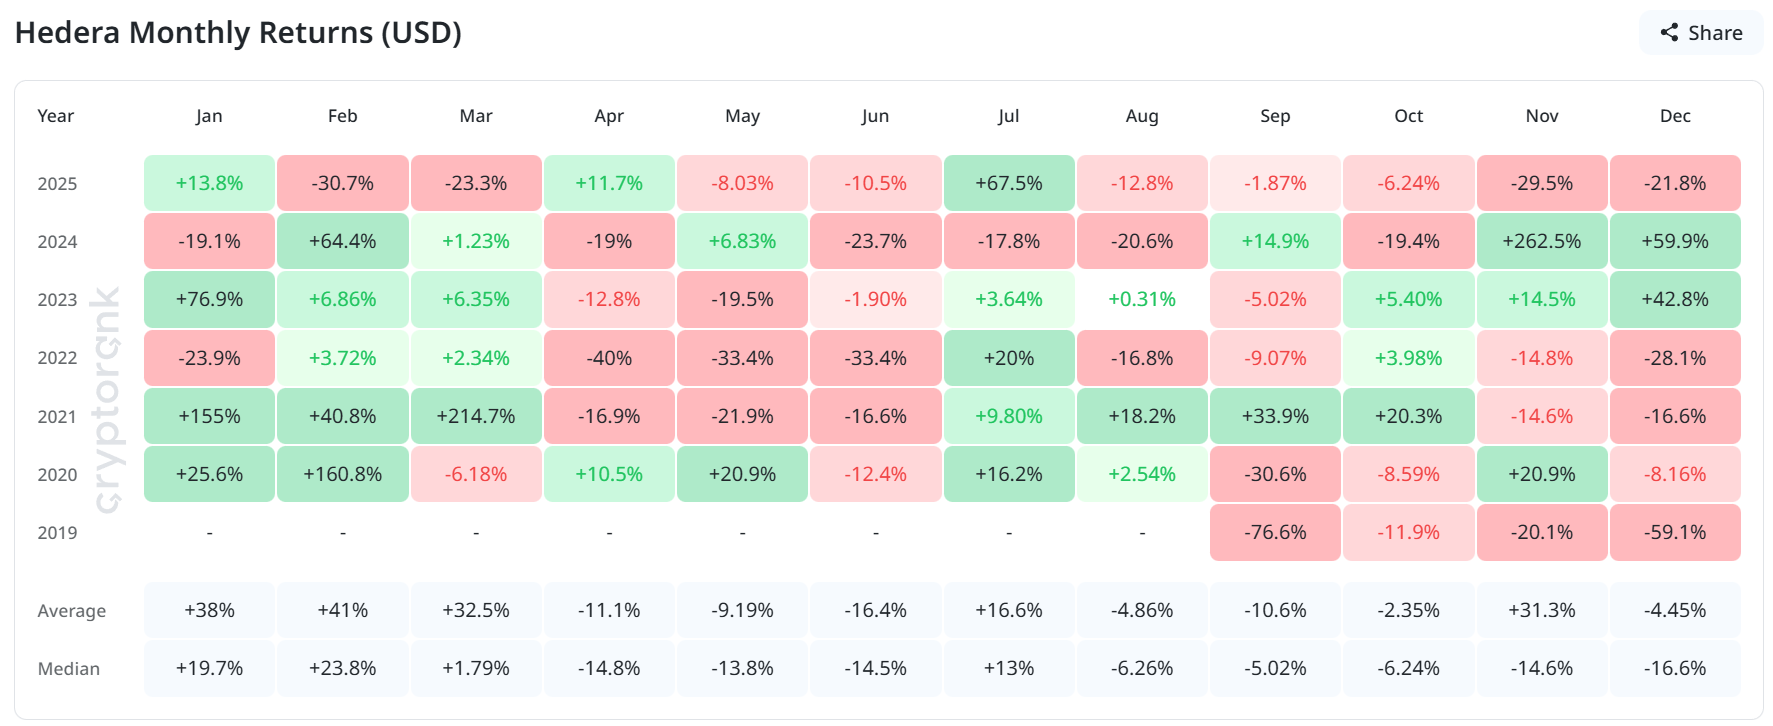
January has historically been one of the strongest months for HBAR price performance. Over seven years of price history, the token posted an average January return of 38%. The median return stands at 19.7%, highlighting consistent seasonal strength rather than isolated rallies.
Seasonality data remains relevant for long-term market participants. If historical patterns repeat, HBAR could see renewed demand early in 2026. Such behavior would align with post-year-end repositioning, when traders reassess undervalued assets following extended drawdowns.
Want more token insights like this? Sign up for Editor Harsh Notariya’s Daily Crypto Newsletter here.
Sponsored
Hedera Traders Seem Bearish
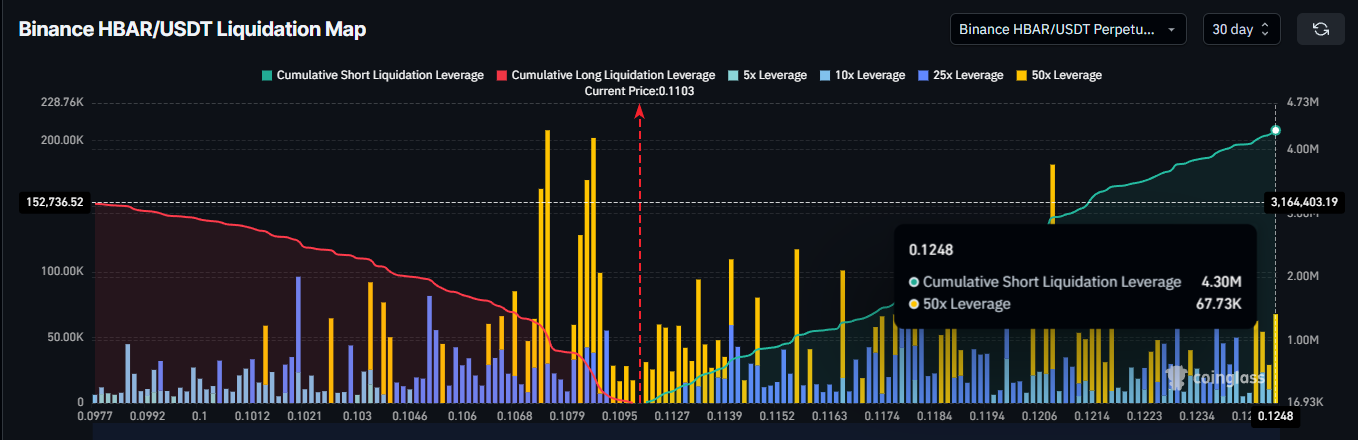
Derivatives data support a cautiously bearish outlook among active traders. Futures positioning shows short exposure at approximately $4.30 million, while short exposure currently sits lower, near $3.16 million. This indicates an imbalance favoring downside expectations.
This positioning reflects a lack of confidence that downside risk may be limited near current levels. HBAR traders typically expand short exposure when they anticipate further decline. While leverage increases volatility, the current structure suggests a more pessimistic approach rather than optimistic hedging.
Sponsored
Bitcoin Is Leading The Way
HBAR maintains a strong correlation with Bitcoin, currently measured at 0.89. This relationship has strengthened over recent days, signaling that Hedera price movements increasingly mirror broader market direction. Such alignment reinforces Bitcoin’s role as a primary driver of short-term momentum.
Correlation presents both opportunity and risk. A Bitcoin recovery would likely lift HBAR alongside other large-cap altcoins. Conversely, renewed weakness in BTC could undermine any standalone recovery attempt by Hedera.
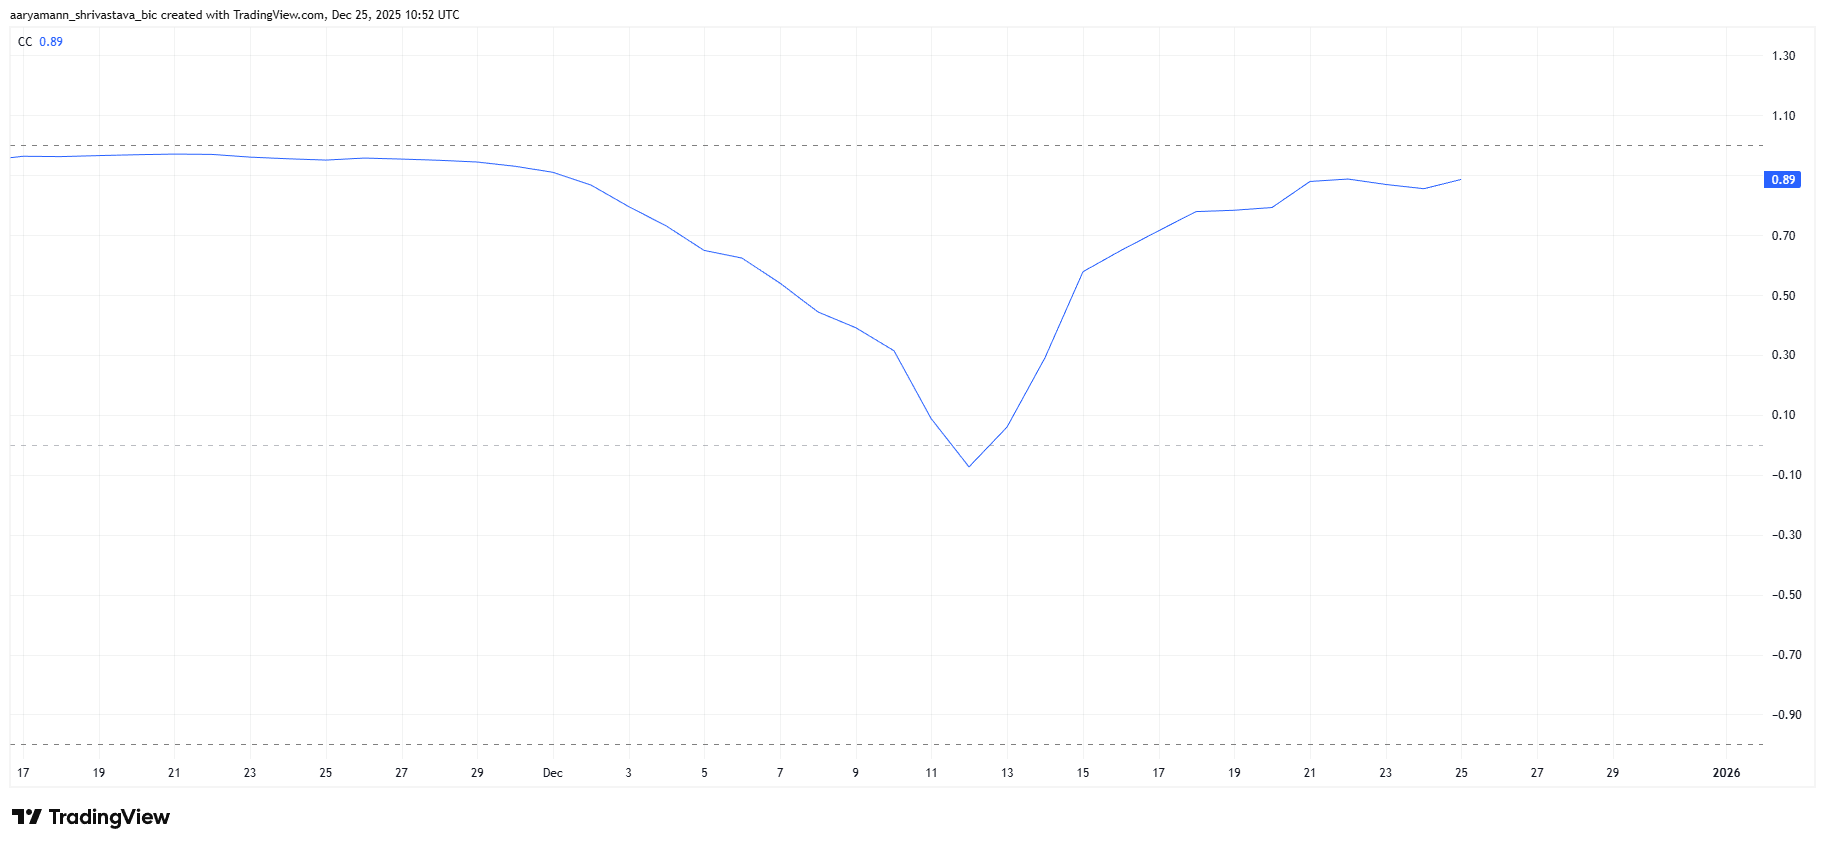
Macro conditions, therefore, remain critical. As long as Bitcoin holds key support levels, HBAR may benefit from positive spillover. Any sharp BTC correction would likely weigh heavily on Hedera’s price structure.
Sponsored
Can HBAR Price Reclaim This Critical Support?
HBAR price traded near $0.110 at the time of writing. The token remains capped below the 23.6% Fibonacci retracement drawn from the $0.155 high to the $0.102 swing low. Recovery from this zone remains possible, though momentum appears gradual rather than impulsive.
A deeper pullback may be required to rebuild strength. A move toward the $0.100 psychological level could attract stronger demand. Liquidity often concentrates near round numbers. As long as the price remains below the $0.112–$0.115 range, activity reflects distribution rather than accumulation.
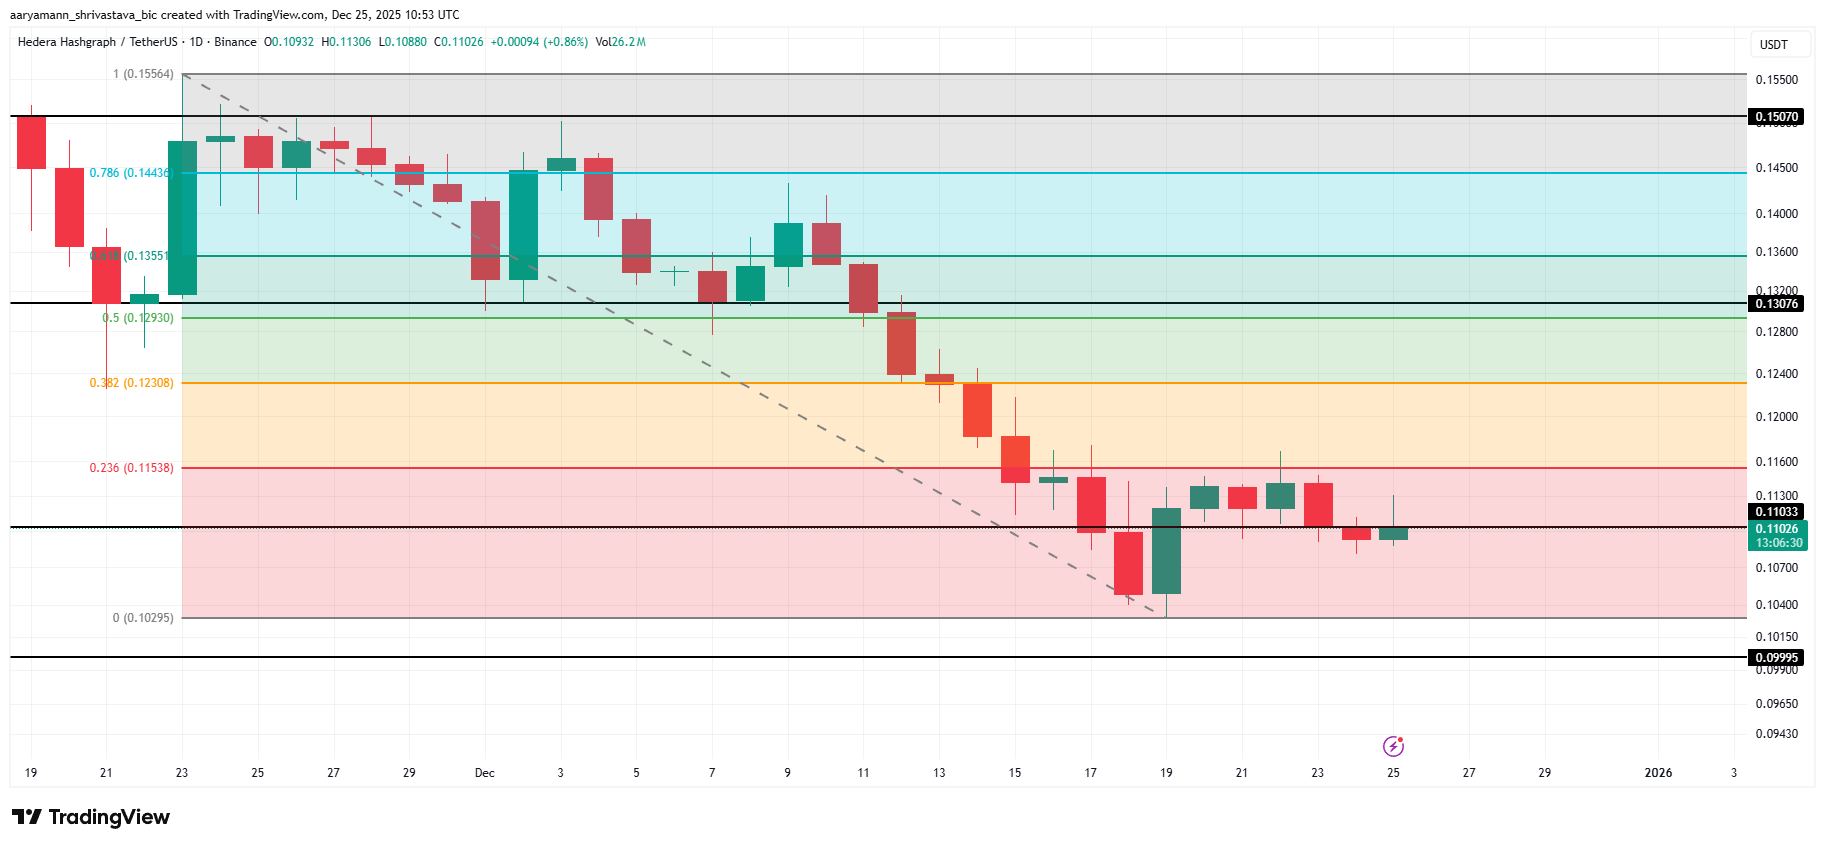
If buyers regain control, the first objective would be reclaiming the 23.6% Fib level at $0.115 as support. Success there could open the path toward $0.130 during January. However, a failure to sustain bullish momentum or a downturn in Bitcoin could push HBAR below $0.100. Such a move would expose the HBAR price to $0.099 or lower, invalidating the bullish prediction.


