
Crypto World
Why ETH’s Return to $2K Might Be a ‘Turning Point’


After weeks of subdued activity, US spot ETH ETFs also witnessed a surge in inflows.
Ethereum reclaimed the coveted $2,000 level on Wednesday, amidst a broader improvement in market tone. The world’s largest altcoin by market cap extended its gains and rallied by 8% over the past day.
But new data suggest that ETH’s price action may be entering a more unstable phase.
Ethereum at a Crossroads
Ethereum’s 30-day realized volatility on Binance has climbed to nearly 0.97. According to CryptoQuant, this is its highest level since March 2025. Such a move indicates that ETH’s daily price swings have widened significantly, in what appears to be a pivot away from the relatively calm trading conditions seen in recent weeks.
At the same time, Ethereum is trading in an area that has acted as a mid-range support zone. The combination of rising volatility and price consolidation points to an active standoff between buyers and sellers. Market participants are repositioning as they anticipate a larger move.
The analytics platform explained that this type of volatility expansion often reflects a repricing phase, rather than random short-term fluctuations.
From a structural front, the current volatility levels imply that the market has exited a low-volatility environment and entered a more reactive and uncertain phase. If volatility continues to rise in addition to the price movement, it could pave the way for a decisive directional breakout.
However, if price fails to follow through despite high volatility, ETH may remain trapped in a range until stronger conviction emerges. In past cycles, sharp increases in volatility have frequently come just before strong price rallies, which means that the market may now be at a critical turning point.
You may also like:
Analysts have recently stated that Ethereum is trading within a five-year demand zone, which they say has historically favored accumulation rather than selling.
Meanwhile, the latest data from Santiment revealed that Ethereum’s 30-day MVRV sits at -5.5%, which places it in mildly undervalued territory despite the recent market rally. The negative MVRV suggests recent buyers are, on average, at a loss, a condition that historically aligns with improved risk-reward zones rather than local market tops.
Improving Sentiment
On the institutional front, US-based spot Ethereum ETFs saw a sharp pickup in demand on February 25, logging more than $157 million in net inflows – its strongest daily total in over a month. The surge was led by Fidelity’s FETH, which attracted $62 million.
Grayscale’s ETHE followed with $33.8 million in inflows, while BlackRock’s ETHA added $31 million.
Binance Free $600 (CryptoPotato Exclusive): Use this link to register a new account and receive $600 exclusive welcome offer on Binance (full details).
LIMITED OFFER for CryptoPotato readers at Bybit: Use this link to register and open a $500 FREE position on any coin!


Key Highlights
- Fair Isaac shares plummeted approximately 13% during Friday’s trading session, ranking among the S&P 500’s weakest performers
- Shares are headed toward their lowest closing level since November 2023
- FHFA’s Bill Pulte called for more affordable credit score pricing on March 24
- Missouri Senator Josh Hawley launched a formal probe into the company’s pricing strategy
- Wall Street firm Barclays reduced its price objective to $1,950 while maintaining an Overweight stance
Shares of Fair Isaac experienced a severe downturn Friday, plummeting approximately 13% to close at $954.43. This level represents the stock’s lowest closing price since it finished at $927.76 on November 6, 2023. The credit scoring giant ranked as the second-worst performer in the S&P 500 index, trailing only Akamai Technologies.
The benchmark indices painted a contrasting picture. While the S&P 500 managed a modest 0.2% gain, the Dow Jones Industrial Average slipped 0.3%. FICO’s performance clearly diverged from the broader market trend in a decidedly negative direction.
The selloff extended beyond Fair Isaac. Other credit reporting companies also faced downward pressure. TransUnion shares declined 4.2%, Equifax retreated 2.7%, and Experian similarly finished the session lower.
Regulatory concerns surrounding FICO have been mounting in recent weeks. Federal Housing Finance Agency Director Bill Pulte took to social media on March 24 to declare that both credit score and credit bureau pricing “must be more affordable.” His statement came as a response to comments made by Missouri Republican Senator Josh Hawley.
Hawley escalated the matter by announcing the commencement of a formal examination into Fair Isaac’s pricing methodology. The company has not yet issued a public statement regarding the senator’s investigation.
This type of regulatory scrutiny presents significant challenges for any stock, particularly one already experiencing downward momentum prior to the week’s events.
Wall Street Analyst Reduces Target
Adding to the regulatory concerns, Barclays released a more reserved outlook. The investment bank suggested that FICO’s strong first-quarter financial results might not be sufficient to counterbalance mounting investor anxiety regarding the company’s positioning in the artificial intelligence landscape.
Barclays adjusted its price objective downward to $1,950 from its previous forecast, though the firm retained its Overweight rating on the shares. While the bank continues to see potential for long-term appreciation, it anticipates near-term investor sentiment will remain subdued as macroeconomic uncertainty and AI-related narratives influence trading patterns.
Management’s forward guidance is likely to face heightened examination, especially considering geopolitical uncertainties that weren’t comprehensively factored into prior projections.
Year-to-Date Struggles Intensify
Fair Isaac’s performance throughout 2026 has been notably challenging. Shares have declined roughly 43% year-to-date, with March alone accounting for a 24% drop. Friday’s decline marks the fifth consecutive monthly decrease for the stock.
Daily trading volume averages approximately 337,499 shares, and technical indicators currently signal a Sell recommendation. The company’s market capitalization has contracted to roughly $25.44 billion.
Prior to Friday’s trading action, FICO shares had already fallen around 36.57% for the year, positioning it among the S&P 500’s poorest performers in 2026.
Senator Hawley’s pricing investigation continues to progress, and Fair Isaac has not yet publicly responded to the affordability concerns articulated by both Hawley and Pulte.


TLDR
- Ethereum gained 7.12% in March 2026 while Bitcoin rose 1.83%.
- Ethereum market cap increased by 2.97% while Bitcoin declined slightly.
- ETH showed higher volatility at 62.8% compared to Bitcoin’s 49.8%.
- Exchange outflows indicated reduced selling pressure for Ethereum.
- Network activity on Ethereum increased with rising active addresses.
Ethereum advanced over Bitcoin in March 2026 as capital shifted across crypto markets. Data showed stronger price gains and rising activity on Ethereum. Analysts linked the trend to liquidity response and network usage growth.
Ethereum Gains Momentum With Price and Activity Growth
Ethereum recorded a 7.12% monthly increase while Bitcoin posted a 1.83% gain. Market data showed investors favored assets with stronger short-term movement. Analysts stated, “Ethereum responded faster to liquidity changes during March.”
At the same time, Ethereum’s market capitalization rose by 2.97% during the period. Bitcoin’s market value slipped by 0.43%, reflecting slower capital inflows. This shift pointed to active repositioning by market participants.
Ethereum’s realized volatility reached 62.8%, while Bitcoin showed 49.8%. The higher volatility indicated sharper price reactions to market conditions. Analysts described Ethereum as a “higher beta asset in the current cycle.”
Meanwhile, Ethereum maintained a strong correlation with Bitcoin near 0.94. Despite this link, Ethereum displayed larger price swings in short periods. This pattern supported its role in rapid trading strategies.
Bitcoin Trails as Capital Moves Toward Ethereum
Bitcoin continued to attract steady demand but showed limited price expansion. Its modest growth aligned with its store-of-value positioning. Analysts said, “Bitcoin remained stable but lacked short-term momentum.”
On-chain data showed Ethereum exchange outflows increased during the same period. Reduced exchange balances suggested lower immediate selling pressure. This trend indicated stronger holding behavior among participants.
Meanwhile, Ethereum network activity expanded with rising active addresses. Increased usage pointed to broader engagement across applications and services. Analysts linked this growth to DeFi and tokenization demand.
The Coinbase Premium Gap for Ethereum stayed negative but improved over time. This movement suggested a gradual return of demand from U.S. investors. Analysts noted steady recovery signals in regional trading flows.
Stablecoins and decentralized finance activity supported Ethereum’s ecosystem growth. Real-world asset tokenization also gained traction on the network. These factors reinforced Ethereum’s position as a financial infrastructure layer.

Key Takeaways
- Fair Isaac shares plummeted approximately 13% during Friday’s trading session, ranking among the S&P 500’s poorest performers
- The closing price represents the company’s weakest level since late 2023
- FHFA’s Bill Pulte publicly called for more affordable credit scoring on March 24
- Missouri Senator Josh Hawley launched a formal probe into the company’s pricing strategies
- Investment bank Barclays reduced its price objective to $1,950 while maintaining an Overweight stance
Shares of Fair Isaac experienced a substantial decline on Friday, plummeting roughly 13% to close at $954.43. This marks a trajectory toward the company’s weakest closing level since November 6, 2023, when shares settled at $927.76. Only Akamai Technologies posted a worse performance among S&P 500 constituents that day.
Meanwhile, broader market indices painted a contrasting picture. The S&P 500 climbed 0.2%, though the Dow Jones Industrial Average slipped 0.3%. FICO’s steep decline stood out sharply against this mixed backdrop.
The selloff extended beyond Fair Isaac itself. Other credit reporting companies also experienced significant downward pressure. TransUnion’s shares declined 4.2%, Equifax retreated 2.7%, and Experian similarly posted losses for the session.
Regulatory concerns surrounding FICO have been mounting over recent weeks. On March 24, Bill Pulte, Director of the Federal Housing Finance Agency, took to social media to declare that both credit score and credit bureau pricing structures “must be more affordable.” His statement came as a response to commentary from Missouri’s Republican Senator Josh Hawley.
Senator Hawley escalated matters by announcing the commencement of a formal investigation targeting FICO’s pricing methodologies. The company has not yet issued a public statement regarding the investigation.
Such regulatory scrutiny typically weighs heavily on stock performance, particularly for a company already experiencing downward momentum entering the trading week.
Investment Bank Reduces Price Outlook
Compounding the regulatory concerns, Barclays issued a more conservative assessment of the company’s prospects. The investment bank cautioned that FICO’s strong first-quarter financial performance might prove insufficient to counterbalance mounting investor anxiety regarding the company’s competitive positioning in artificial intelligence.
Barclays revised its price target downward to $1,950 from its previous estimate, though the firm retained its Overweight rating on the shares. While the bank continues to identify long-term value potential, it anticipates near-term investor sentiment will remain subdued as macroeconomic uncertainty and AI-related narratives influence trading patterns.
Management’s forward guidance is anticipated to face heightened examination, especially considering geopolitical uncertainties that weren’t fully incorporated into prior projections.
Challenging Year Continues to Deteriorate
Fair Isaac’s year-to-date stock performance presents a concerning picture for shareholders. The shares have declined approximately 43% since the beginning of the year, with a 24% drop recorded in March alone. Friday’s selloff positions the stock for its fifth consecutive monthly decline.
Daily trading volume averages approximately 337,499 shares, while technical indicators currently signal a Sell recommendation. The company’s market capitalization has contracted to roughly $25.44 billion.
Before Friday’s trading session, FICO stock had already fallen around 36.57% year-to-date, establishing it as among the S&P 500’s weakest performers in 2026.
The investigation initiated by Senator Hawley continues to develop, while Fair Isaac has yet to publicly respond to the pricing criticisms voiced by both the Senator and FHFA Director Pulte.
TLDR
- Flare plans to reduce FLR inflation from 5% to 3% under a new governance proposal.
- The proposal introduces FIRE to manage revenue from protocol-level MEV capture.
- Flare aims to shift block building to a controlled model to retain network value.
- The network proposes raising gas fees to increase annual token burn levels.
- Governance voting will take place between April 17 and April 24.
Flare introduced a governance proposal to reshape FLR tokenomics and capture protocol-level MEV. The plan reduces inflation and redirects network value into ecosystem incentives. It also outlines a structured builder model to control block production and revenue flow.
Flare and FLR Plan Shifts Tokenomics Through MEV Capture
Flare proposes reducing annual FLR inflation from 5% to 3%, cutting issuance by 40%. The proposal also lowers the yearly cap from 5 billion to 3 billion FLR tokens.
The network introduced FIRE, or Flare Income Reinvestment Entity, to manage captured value. It aims to channel proceeds into buybacks, burns, and ecosystem funding.
Flare stated, “The model seeks to connect network usage directly to token value.” The framework focuses on aligning onchain activity with FLR demand.
The proposal shifts block building toward a protocol-controlled structure over time. This change targets value flows that typically move to external searchers.
The system plans to capture positive MEV, including arbitrage and liquidation events. It also includes liquidity provisioning within the builder framework.
Flare said the change supports long-term token sustainability through structured revenue capture. It also aims to reduce inefficiencies seen across many blockchain systems.
Network Activity Supports Proposal Timing and Economic Changes
Flare reported over $160 million in total value locked across its ecosystem. It also recorded more than 880,000 active addresses on the network.
The network confirmed around 150 million FXRP minted, with over 85% deployed in DeFi use. Dune data shows TVL near $165 million.
The proposal includes a gas fee increase from 60 gwei to 1,200 gwei. This adjustment aims to raise annual FLR burn from 7.5 million to 300 million tokens.
Flare said higher fees could strengthen burn mechanics under current transaction levels. It also expects a stronger linkage between usage and token supply reduction.
The plan shifts reward allocation toward P Chain staking participants. It also sets a minimum 20% fee share for infrastructure contributors.
Flare noted that this structure supports entities maintaining network services. It ensures a defined share of generated revenue flows to operators.
Governance Timeline Outlines Decision Window for Proposal
Flare scheduled the governance notice period from April 9 to April 16. The network then set voting between April 17 and April 24.
The proposal outlines immediate implementation for key economic changes upon approval. These include inflation cuts and fee structure adjustments.
Flare emphasized that the builder model will roll out gradually over time. The shift depends on governance approval and network readiness.
The proposal connects multiple network components, including FAssets and Smart Accounts. It also integrates Flare Data Connector and Confidential Compute.
Flare stated that the next phase links ecosystem activity directly to FLR economics. The network confirmed that voting will determine the proposal outcome.


TAO drops 30% from its weekly high, confirming fractal setups that projected deeper downside targets for the token in the past.
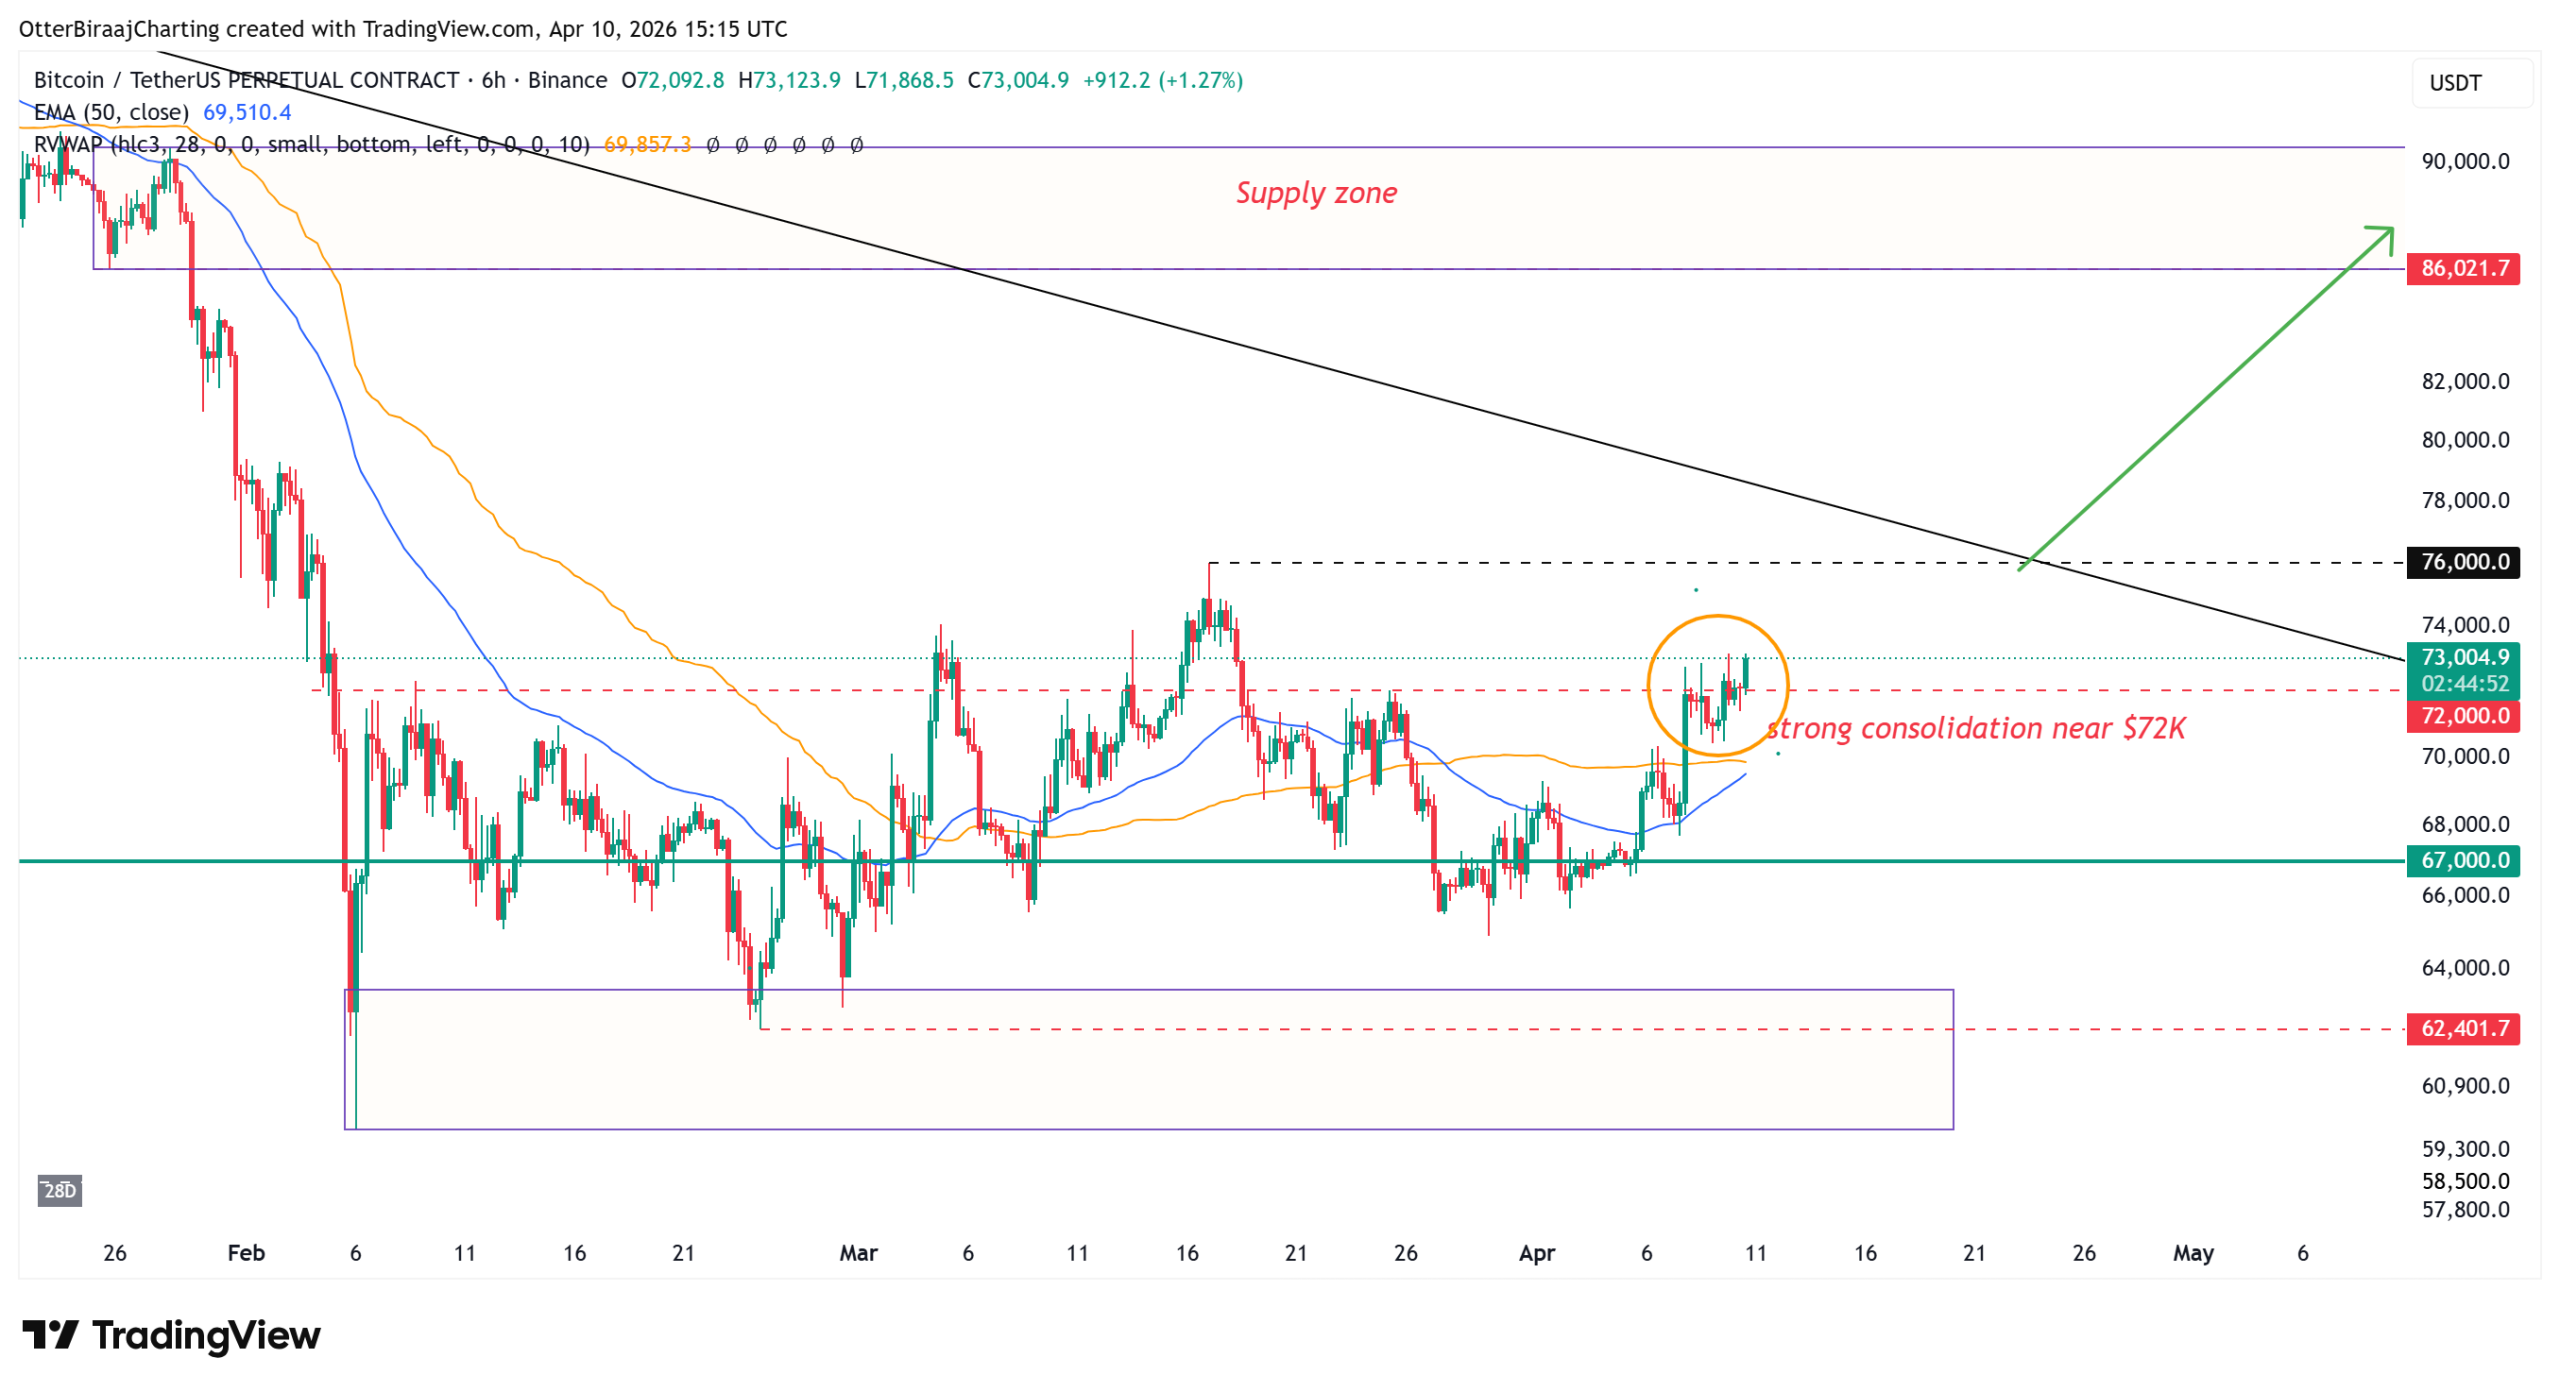
Mirroring a breakout setup from Q2 2025, Bitcoin (BTC) is now eyeing a possible rally toward the $86,000–$90,000 range over the next few weeks.
The bullish view is supported by robust Bitcoin whale activity and large BTC inflows to exchanges, which have dropped by $5 billion over the past two months.
BTC support cluster at $70,000 builds breakout pressure
Bitcoin reached a weekly high of $73,255 on Friday after testing the $72,000 level earlier in the week, with the price compressing between $70,000 and $72,000 over the past four days. The higher price range is showing more stability for BTC than in March, when BTC quickly corrected after reaching the key level.

The 30-day rolling volume-weighted average price (VWAP), which indicates where most recent trading activity has occurred, and the 50-day moving average have converged below the price, forming a dynamic support base.
Currently, the $76,000 level marks the upper boundary of a 64-day sideways phase. A push above this level aligns with the descending trendline formed after the October highs near $126,000.
A breakout from this trend may signal a major shift and remove the psychological barrier that capped rallies over the past few months.
In Q2 2025, a similar setup formed after a prolonged compression below the moving averages. Once the price cleared the descending trendline, it expanded quickly into the next supply zone.

The current structure mirrors that sequence, with liquidity stacked between $86,000 and $90,000. This indicates a clean path for price expansion once the bearish trendline gives way.
Related: Bitcoin can be made quantum-safe without protocol upgrade: Researcher
BTC whale flows signal supply absorption
Crypto analyst Amr Taha noted that the 30-day Bitcoin inflows to exchanges from whales dropped to $2.96 billion, the first sub-$3 billion reading since June 2025.
The lower inflows reduce immediate sell-side pressure on exchanges. For context, the whale inflows to exchanges were as high as $8 billion in February.

At the same time, the long-term holder realized cap change reached $49 billion on April 9, marking renewed accumulation.
Taha noted a transfer of supply from weaker to stronger hands across these metrics. The divergence highlights steady absorption rather than aggressive selling.

Additionally, whale-sized orders of $1 million to $10 million pushed the spot cumulative volume delta (CVD) above $600 million on April 9, while market analyst CW pointed to renewed buying from other whale cohorts as well.
This activity coincides with price stabilization above $70,000. The $76,000 level now acts as a trigger zone, with the $86,000 to $90,000 range holding a visible, concentrated liquidity zone.

Related: Bitcoin hits $73K as cool US CPI data shows 60-year record gas price hike
This article is produced in accordance with Cointelegraph’s Editorial Policy and is intended for informational purposes only. It does not constitute investment advice or recommendations. All investments and trades carry risk; readers are encouraged to conduct independent research before making any decisions. Cointelegraph makes no guarantees regarding the accuracy or completeness of the information presented, including forward-looking statements, and will not be liable for any loss or damage arising from reliance on this content.

Disclosure: This article does not represent investment advice. The content and materials featured on this page are for educational purposes only.
Little Pepe presale surpasses $28M as project nears completion and draws investor attention.
Summary
- Little Pepe presale surpasses $28M, with Stage 13 nearing completion as demand continues to rise
- LILPEPE is advancing toward next phase, with exchange listings and ecosystem expansion in focus
- Layer 2 utility, staking, and zero-tax trading position Little Pepe for long-term growth
Little Pepe’s (LILPEPE) presale has reached a crucial milestone in its journey to completion, having raised over $28 million. This shows the investors’ confidence in the project and the fact that the project has a lot to offer in the field of blockchain. As the end of the presale is in sight, attention is now focused on the future prospects of the project and the steps it will take towards the next stage.
Stage 13 nearing completion and price progression
The current presale has gathered more than $28 million in its current presale stage 13, which will reward investors who join the project at an early stage. The project has sold more than 16.9 billion tokens, out of its 17.25 million token target. After completing Stage 13, priced at $0.0022, the next stage after this will be Stage 14, priced at $0.0023.
As the present presale is nearing completion, the next step in the journey of Little Pepe is expected to be the expansion of its ecosystem. Generally speaking, projects at this phase are likely to look towards listing on exchanges, which can greatly contribute to improving market accessibility. Moreover, the development of its core features will greatly contribute to improving demand for the token in the long run.

Utility-driven ecosystem as a growth catalyst
Little Pepe differs from other cryptocurrencies in the fact that it has an Ethereum-compatible Layer 2 infrastructure. This enables the platform to facilitate faster and cheaper transactions. Additionally, the platform has several features geared towards the use of the platform. These include zero tax trading, sniper bot attacks, and staking rewards. The NFT and cross-chain capabilities to be introduced in the platform make it an even more promising venture compared to the current status of the platform as a meme coin.
In addition to the infrastructure, the ecosystem includes other utility-based features. The zero tax trading feature helps in the reduction of hurdles for the participants in the ecosystem. The sniper bot protection feature ensures the fairness of the ecosystem, especially in the token launch. The staking reward feature helps in the reduction of sell pressure in the ecosystem. Meme launchpad is an additional utility feature in the ecosystem. This feature helps the user to create a token in the ecosystem.
Community incentives as a growth catalyst
As the presale reaches its final stretch, the Little Pepe team has continued to reward the growing community with several incentives. The giveaway of $777,000 is still going strong. Additionally, the reward of 15+ ETH to the top contributors and random participants has been going on. All the above incentives not only reward the contributors but also grow the platform.
However, crossing the mark of $28 million is not only a milestone but is also the starting point to a new era for Little Pepe. Hence, with Stage 13 almost being completed and the presale being in the final stages, the project has already moved from the fundraising stage to the execution and expansion stage.
Having created a good foundation with the utilization of layer 2, tokenomics, and ecosystem, it is clear that the project has the potential to grow and expand in the coming days. Once all these exchange listings and other factors come into play, it is clear that the project has the potential to grow and become a major player in the meme coin industry. From an investment point of view, it is clear that this is a critical point to assess the potential of the project and how it is going to be in the coming days, as it is almost at its final stage.
For more information, visit the official website, X (Twitter), and Telegram.
Disclosure: This content is provided by a third party. Neither crypto.news nor the author of this article endorses any product mentioned on this page. Users should conduct their own research before taking any action related to the company.


The HKMA selected two issuers from a pool of 36 applicants under the Stablecoins Ordinance, which took effect in August 2025.
The Hong Kong Monetary Authority (HKMA) granted its first two stablecoin issuer licenses on Friday, awarding them to HSBC and Anchorpoint Financial, a joint venture led by Standard Chartered that includes Animoca Brands and Hong Kong Telecommunications.
The regulator selected the two from a pool of 36 applicants under the Stablecoins Ordinance, which took effect in August 2025. Both licensees are authorized to issue stablecoins pegged to the Hong Kong dollar.
The decision to award the first licenses to HSBC and Standard Chartered is notable, as both are among the only three commercial banks authorized to print physical Hong Kong dollar banknotes, a system dating back to 1846.
“The two applicants have experience in traditional finance and risk management, which fits the mission of stablecoins that aim to bridge traditional finance and digital finance,” said HKMA Deputy Chief Executive Darryl Chan.
Strict Guardrails
Hong Kong’s framework imposes tight requirements on issuers. Stablecoins must be fully backed by high-quality liquid assets such as cash, bank deposits, or short-term government securities. Issuers must maintain at least HK$25 million in paid-up capital and hold liquid capital equal to 12 months of operating expenses.
Holders must be able to redeem tokens at par within one business day, and issuers are prohibited from offering interest or yield on stablecoin holdings. The regime also bars algorithmic stablecoins from obtaining a license.
Financial Secretary Paul Chan had signaled in his February budget address that the first batch would be limited, with regulators prioritizing risk management, reserve quality, and anti-money-laundering controls.
Retail and Cross-Border Ambitions
HSBC said its HKD stablecoin will be available inside its PayMe app and HSBC HK Mobile Banking in the second half of 2026, giving retail customers direct access to the token. Anchorpoint plans to distribute through selected business partners.
The broader stablecoin market now exceeds $311 billion, though USD-denominated tokens account for nearly all of it. Hong Kong is betting that bank-issued, regulated HKD stablecoins can carve out a niche in regional trade settlement.
The licensing milestone also comes as mainland China explores renminbi-backed stablecoins through Hong Kong, and as state-owned enterprises like China National Petroleum Corporation study stablecoin use for cross-border payments.
This article was written with the assistance of AI workflows. All our stories are curated, edited and fact-checked by a human.


Mixero’s latest privacy feature, Ricochet, is designed to make Bitcoin transaction trails far harder to track.
This comes as state-of-the-art blockchain analytics tools are pushing many users into a corner, with privacy becoming a major concern.
For context, Bitcoin gives users control over their funds, but privacy remains limited by design. Every transaction is recorded on a public ledger, where wallet activity can be traced, linked, and analyzed over time.
That becomes a serious issue once a wallet is connected to a real-world identity. A single withdrawal from a KYC exchange can tie a person’s name to an address, and from there, the rest of their on-chain activity can become much easier to follow.
Ricochet creates a longer and less readable transaction path
Ricochet routes Bitcoin through a chain of intermediary addresses before the funds reach their final destination.
Instead of moving BTC directly from one wallet to another, the transaction passes through multiple hops.
Each hop uses a newly generated wallet address that is never reused. This creates a more complex path between sender and recipient, making it much more difficult to reconstruct the full route through standard blockchain analysis.
In short, Mixero is making the trail less direct, clean, and much harder to interpret.
Randomized hops make tracing more difficult
Ricochet also introduces randomness into the timing and structure of the route.
Each transfer step can be separated by randomized delays, which removes the fixed timing patterns that often make blockchain activity easier to analyze. Users can also choose how many hops to include and how many confirmations should be required along the way.
For those who want deeper protection, full randomization adds even more variation to the route. That makes each transaction path less predictable and harder to model.
This gives users room to adjust privacy settings based on their own priorities. Some may want a faster process with fewer steps. Others may prefer a more layered route that puts greater distance between the source of funds and the final receiving address.
Ricochet works differently from CoinJoin
Mixero is already known for privacy tools built around CoinJoin, but Ricochet follows a slightly different logic.
CoinJoin mixes multiple users’ transactions together in a shared structure, making it difficult to determine which inputs and outputs belong to whom. Instead of merging transactions, Ricochet extends the route. It’s a key difference. CoinJoin disrupts transaction matching. Ricochet obscures the path itself by multiplying the number of steps between origin and destination.
For users who want stronger privacy without relying on pooled transaction structures, Ricochet offers another way to reduce traceability on Bitcoin.
Public blockchains expose a lot
On a public blockchain, transaction history can expose wallet balances, behavior patterns, recurring counterparties, and long-term financial activity.
Once an address is identified, the rest of that history can become easier to map. For users who value discretion, that creates obvious risks.
Privacy in crypto is often dismissed as an edge case, largely because it is associated with anonymity. In reality, it is a normal financial concern. Not every user wants their transaction history open to exchanges, analytics firms, investigators, or anyone else watching the chain.
Tools like Ricochet exist because transparency on public ledgers has consequences.
No logs
Ricochet is paired with Mixero’s no-logs policy, which reduces the amount of user activity data retained during the process.
That adds another layer of privacy beyond the transaction route itself. The combination of fresh addresses, randomized delays, customizable hops, and limited data retention creates a stronger privacy model for Bitcoin transactions on a public network.
For users trying to reduce the visibility of their BTC activity, Ricochet offers a direct way to make transaction tracing much more difficult.
About Mixero
Mixero is a privacy-focused crypto service for users who want stronger transaction privacy on public blockchains. The platform offers CoinJoin-based Bitcoin mixing, Tor access, signed Letters of Guarantee, and Ricochet, a feature that routes BTC through multiple randomized hops before it reaches its destination. The service is built for users who want more discretion in an on-chain environment where transaction histories are otherwise easy to inspect.
The post Mixero Crypto Mixer Adds Ricochet to Strengthen Bitcoin Transaction Privacy appeared first on BeInCrypto.
Crypto World
Advanced Micro Devices (AMD) Stock Surges 6% Following TSMC’s Impressive Q1 Revenue Report

Key Takeaways
- Taiwan Semiconductor Manufacturing Company posted first-quarter 2026 revenue of $35.6 billion, marking a 35% year-over-year increase
- Shares of AMD climbed as high as 6.4% during Friday’s session before moderating to gains of approximately 3.6–3.8%
- Market participants interpreted TSMC’s robust fabrication orders as a bullish indicator for AMD’s forthcoming quarterly performance
- Advanced Micro Devices will announce its Q1 2026 financial results on May 5, with company leadership projecting $9.8 billion in quarterly revenue
- Equity research analysts maintain a Moderate Buy rating on AMD shares with a consensus price target of $284.68
Shares of Advanced Micro Devices (AMD) experienced substantial upward movement Friday following Taiwan Semiconductor Manufacturing Company’s announcement of exceptional first-quarter financial performance, providing a tailwind across the semiconductor industry.
Advanced Micro Devices, Inc., AMD
Taiwan Semiconductor disclosed that its first-quarter 2026 revenue soared 35% to reach $35.6 billion. The figure immediately resonated throughout financial markets.
Market participants interpreted this disclosure as compelling evidence that artificial intelligence processor demand remains resilient. AMD, a major producer of central processing units and graphics processing units deployed in AI-focused data infrastructure, was viewed as a prime beneficiary of this trend.
AMD stock registered intraday gains reaching 6.4% before moderating to approximately 3.6–3.8% appreciation by late-afternoon trading. Daily transaction volume totaled roughly 20 million shares, falling short of the stock’s three-month average daily volume of 33.17 million.
The semiconductor company’s shares have now appreciated nearly 15% since the beginning of the year and have surged approximately 153% during the trailing twelve-month period.
Upcoming Quarterly Report for AMD
Advanced Micro Devices is scheduled to release its first-quarter 2026 financial results on May 5. Company executives have provided guidance calling for revenue of $9.8 billion at the midpoint, representing a 32% year-over-year expansion.
During the fourth quarter of 2025, AMD’s data center division generated $5.4 billion in revenue, reflecting 39% annual growth — establishing a new company record. Market observers are anticipating that the first quarter will maintain this positive trajectory.
TSMC’s healthy order backlog suggests that demand for processors and graphics chips remained firm throughout the opening quarter. This development bodes well for AMD, which depends extensively on TSMC’s fabrication capabilities for its semiconductor production.
A broader geopolitical context is also influencing market sentiment. A ceasefire agreement between Iran and the United States has improved investor confidence. Vice President Vance is scheduled to visit Pakistan this weekend for continued diplomatic discussions, with markets seemingly pricing in optimism regarding further tension reduction.
Analyst Sentiment and Price Projections
Wall Street equity analysts collectively assign a Moderate Buy consensus recommendation to AMD shares. This assessment reflects 21 Buy recommendations and eight Hold recommendations issued during the most recent three-month period.
The consensus price target stands at $284.68, suggesting approximately 16% appreciation potential from present valuation levels.
AMD currently trades at $245.17, within a 52-week trading range spanning from $83.75 to $267.08, while maintaining a market capitalization approaching $386 billion.
Friday’s intraday trading range extended from $238.98 to $249.56.
The upcoming May 5 earnings announcement represents the next significant event for AMD shareholders, who will scrutinize data center segment revenue performance and any modifications to full-year financial projections.

General Hospital: Jordan’s Tragic Car Crash – Who’s REALLY Guilty Behind the Wheel?

Sam Altman’s San Francisco home targeted in Molotov cocktail attack

Under The Influence Leads Timeless Hits in 2026 Streaming Era


-

 Business5 days ago
Three Gulf funds agree to back Paramount’s $81 billion takeover of Warner, WSJ reports
-

 Sports6 days ago
India men’s 4x400m and mixed 4x100m relay teams register big progress | Other Sports News
-

 Business6 days ago
Expert Picks for Every Need
-

 Tech3 days ago
How Long Can You Drive With Expired Registration? What Florida Law Says
-

 Business5 days ago
No Jackpot Winner, Prize to Climb to $231 Million
-

 Fashion4 days ago
Massimo Dutti Offers Inspiration for Your Summer Mood Board
-
 Sports1 hour ago
Man United discover Nico Schlotterbeck transfer fee as defender reaches Dortmund agreement
-

 Fashion3 days ago
Let’s Discuss: DEI in 2026
-

 Crypto World2 days ago
Bitcoin recovers as US and Iran Agree a Ceasefire Deal
-

 Business6 days ago
Akebia Therapeutics, Inc. (AKBA) Discusses Pipeline Progress and Strategic Focus on Kidney Disease Treatments at R&D Day – Slideshow
-

 Crypto World1 day ago
Canary Capital Files SEC Registration for PEPE ETF
-

 Politics7 days ago
The UK should not pay a penny in slavery reparations
-

 NewsBeat7 days ago
Kemi Badenoch talks ‘spring cleaning’ Reform defections
-

 Tech4 days ago
Samsung just gave up on its own Messages app
-

 Tech4 days ago
Haier is betting big that your next TV purchase will be one of these
-

 Business7 hours ago
OpenAI Halts Stargate UK Data Centre Project Over Energy Costs and Copyright Row
-
Sports7 days ago
A Kevin O’Connell Theory Can Now Be Retired
-

 Tech4 days ago
The Xiaomi 17 Ultra has some impressive add-ons that make snapping photos really fun
-

 Tech4 days ago
Gamer Restores the Original PlayStation Portal From Two Decades Ago
-

 Tech4 days ago
Italian court says Netflix must refund customers up to $576 over price hikes
You must be logged in to post a comment Login