
Crypto World
Why is Hyperliquid price up despite crypto market bloodbath?
Hyperliquid price is rallying against the market tide as institutional adoption and improving chart structure attract fresh buyers.
Summary
- HYPE gained 6% even as Bitcoin dipped below $72,000 and most majors fell.
- Institutional integrations and token utility developments lifted sentiment.
- Technical structure shows a confirmed trend shift with momentum favoring buyers.
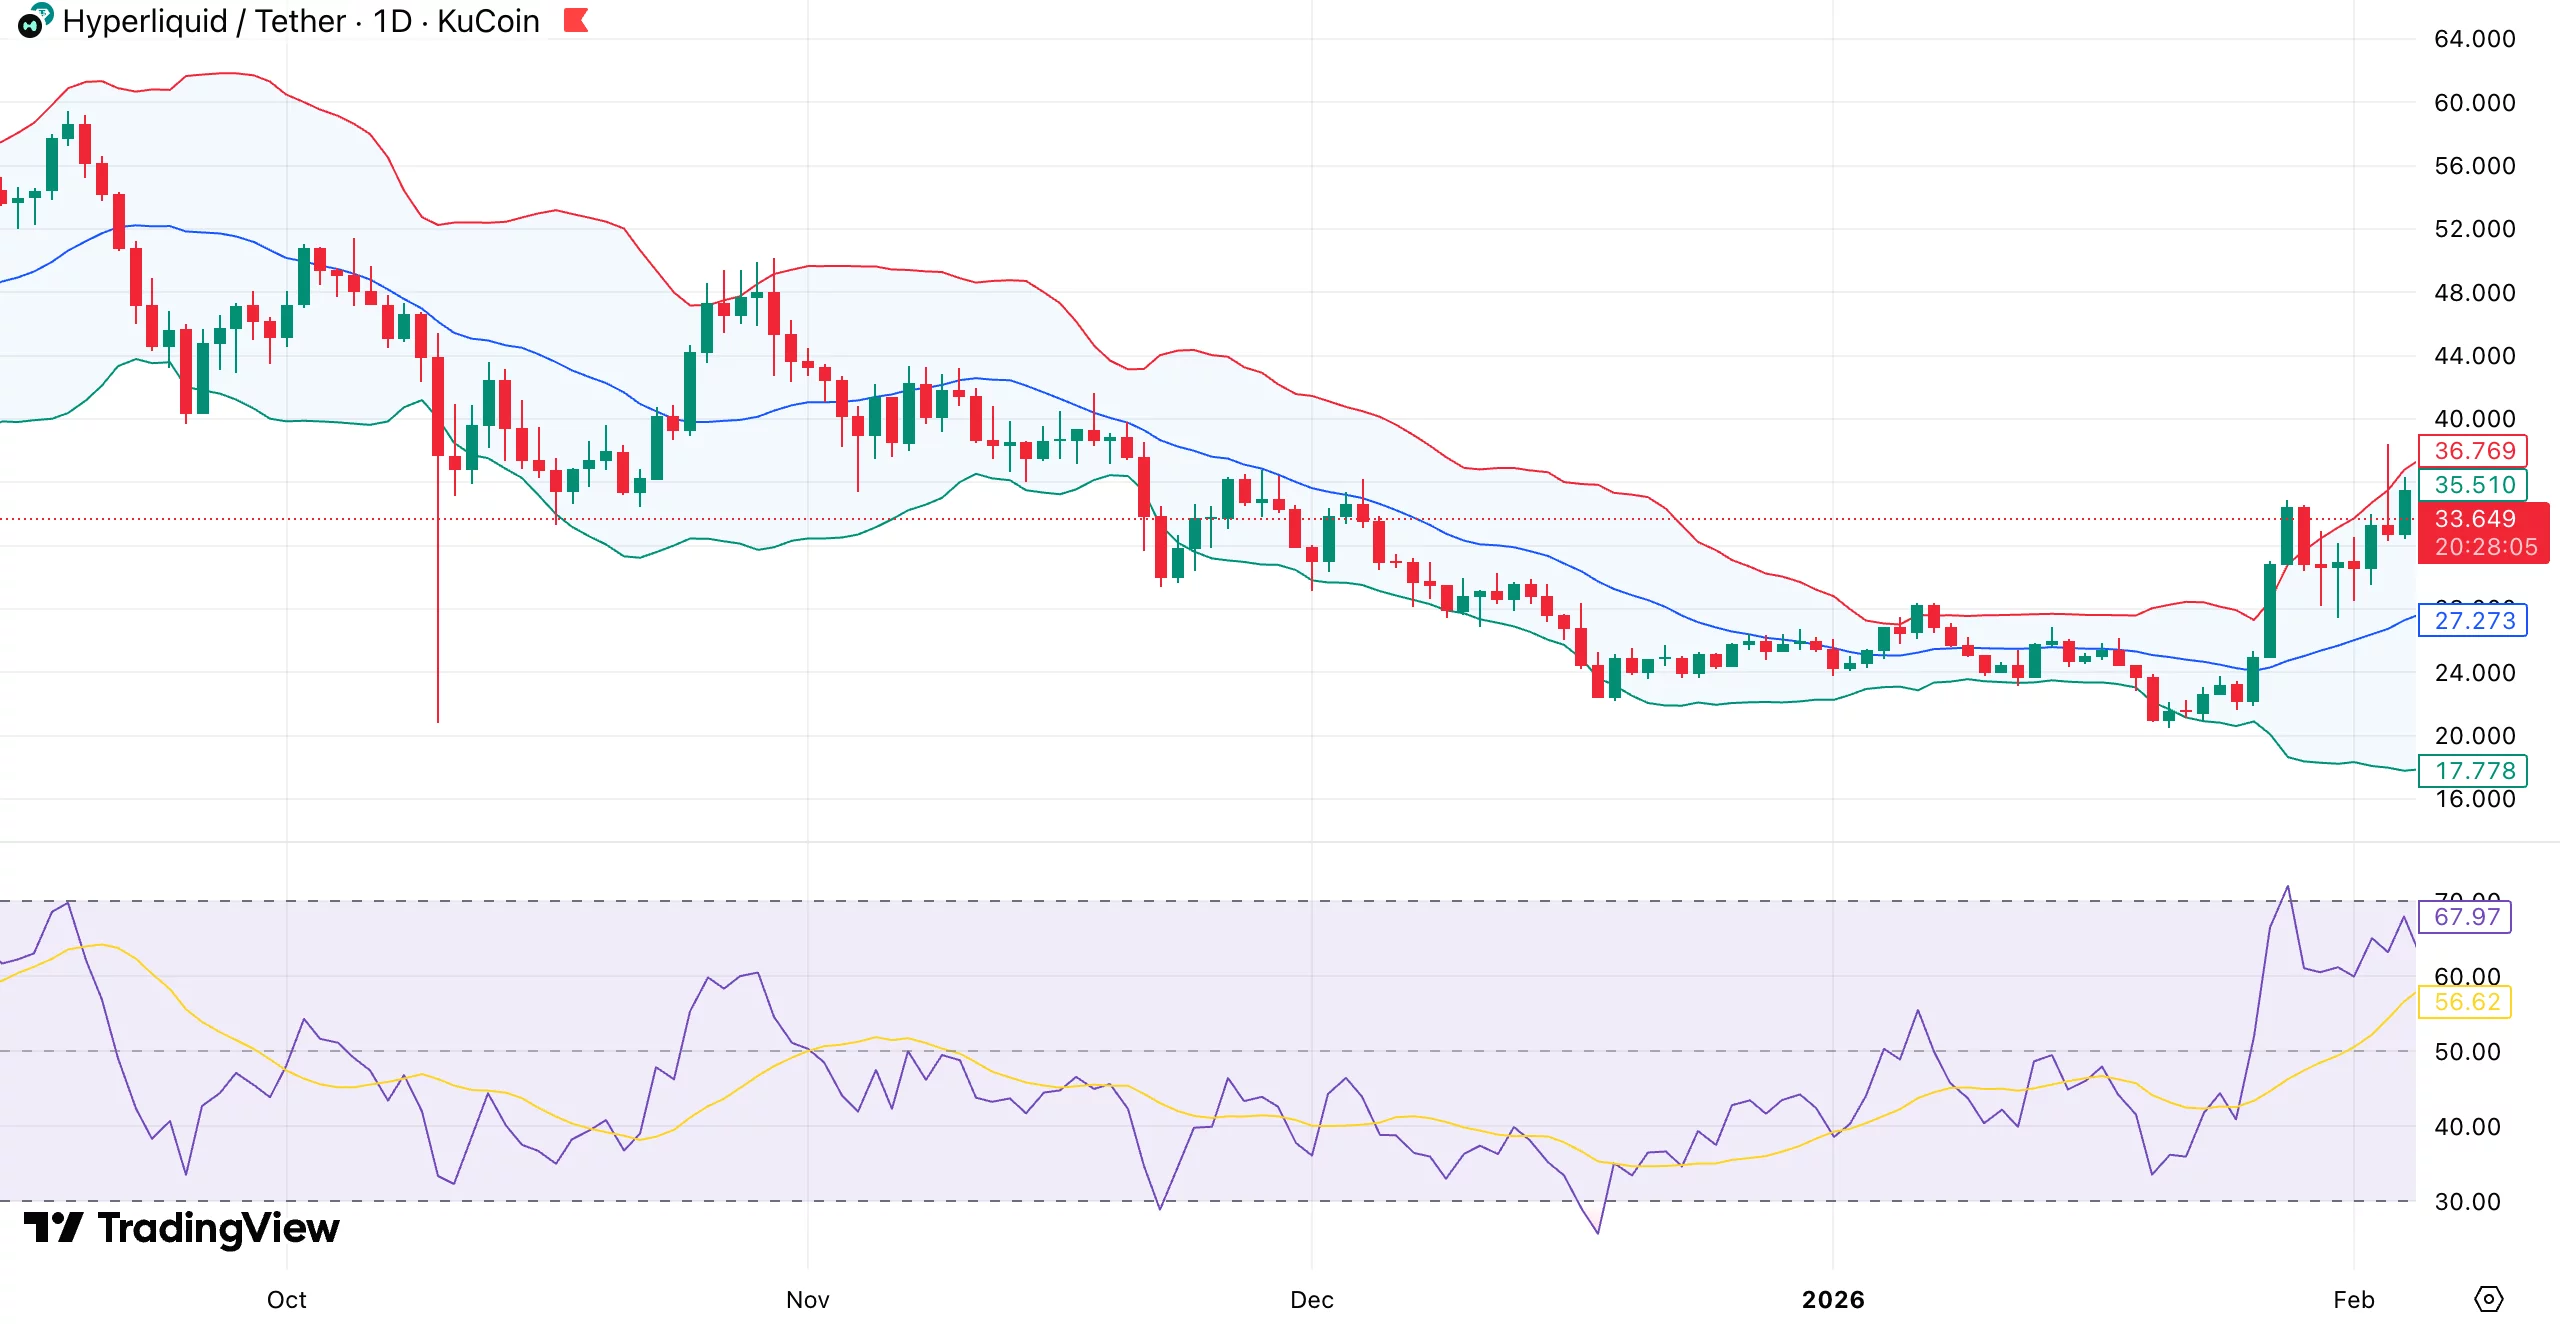
Hyperliquid was trading around $34.96 at press time, up 6% in the past 24 hours, even as the crypto market sold off sharply. Bitcoin briefly slipped below $72,000, and most large-cap tokens traded lower.
Hyperliquid (HYPE), however, has moved in the opposite direction. The token is up 1.5% over the past seven days and has gained 29% over the last month, standing out during a period of heavy market pressure.
Derivatives data points to cooling leverage rather than panic buying. Open interest fell 2.42% to $1.55 billion, while trading volume decreased 31% to $4.06 billion, according to CoinGlass data.
This often indicates that traders are lowering their exposure rather than chasing gains, which can keep the price stable during volatile sessions.
Why is Hyperliquid price rising?
Several developments have raised short-term demand. On Feb. 4, Ripple announced that Ripple Prime, its institutional brokerage platform, had added support for Hyperliquid.
The integration allows institutions to access on-chain perpetuals and derivatives on Hyperliquid while managing risk alongside traditional assets such as FX and fixed income.
The news was met with a positive market response, lifting HYPE even as selling pressure persisted across the crypto market. While the integration does not directly benefit XRP or rely on the XRP Ledger, it will boost HYPE which is at the centre of perps trading activity.
Another development followed the same day. Hyperion DeFi Inc. (NASDAQ: HYPD), a publicly traded digital asset treasury focused on Hyperliquid, said it plans to use its HYPE holdings as options collateral.
The company said it isn’t engaging in directional bets. Instead, the strategy focuses on earning income from options premiums and fees, together with staking rewards. Hyperion is working with Rysk protocol to launch an on-chain options vault directly on Hyperliquid.
Over time, the vault could be opened to other institutional HYPE holders. By putting more tokens into structured products and reducing the liquid supply, this strategy might support the token’s price.
Another protocol update that has garnered attention is HIP-4. The plan introduces fully collateralized “outcomes” trading for products that resemble options and prediction markets. The feature is designed to appeal to traders who prefer defined risk during volatile periods.
HIP-4 comes after previous improvements that enabled permissionless markets for crypto, equities, and commodities. With over $1 billion in open interest, nearly $5 billion in daily volume, and a massive rise in weekly transactions since those updates, Hyperliquid has seen strong network growth.
An upcoming token unlock on Feb. 6, releasing about 9.92 million HYPE worth roughly $300 million, has so far failed to unsettle buyers. Previous unlocks were absorbed without sharp pullbacks, which has helped calm concerns.
Hyperliquid price technical analysis
After months of steady decline, HYPE has shifted structure. A distinct shift in trend behavior is visible as the price recovered the mid-Bollinger Band and remained above it. The recent pullback formed the first higher low since November, flipping the structure from bearish to neutral-bullish.

Price has pushed above the upper Bollinger Band with strong closes rather than thin wicks. Volatility bands have turned upward, and the 20-day moving average now acts as support instead of resistance. The relative strength index has moved into the 60–70 range, holding above its signal line.
HYPE also cleared the $32–$33 resistance zone and has stayed above it, suggesting acceptance at higher levels. Overhead supply looks limited until the $40 area.
Holding above $32 keeps momentum intact and allows a move toward $38–$42 if market conditions stabilize. A drop back below $32 could pull the price toward $27–$28, where trend support would be tested.

Crypto World
Algorand Foundation cuts 25% of workforce amid crypto market downturn: Algorand Foundation


The Algorand Foundation has laid off a quarter of its staff, citing macroeconomic uncertainty and depressed crypto prices as conditions worsen across the industry.
The Algorand Foundation has cut 25% of its workforce due to macroeconomic uncertainty and lower cryptocurrency prices. The layoff at the organization behind the layer-1 Algorand blockchain reflects broader challenges facing the crypto sector as market conditions deteriorate.
The Algorand Foundation’s reduction joins a wave of workforce cuts sweeping through crypto and blockchain companies. Other major players including Blockchain.com, Optimism Labs, and Gemini Space Station have similarly announced 25% staff reductions, signaling sustained pressure on the industry as crypto prices remain depressed.
Sources: Algorand on X
This article was generated automatically by The Defiant’s AI news system from publicly available sources.
Bitcoin retraced about 7% after briefly touching the $76,000 mark earlier in the week, as a confluence of macro headlines trimmed risk appetite. A jump in oil prices tied to Middle East tensions and a hotter-than-expected producer price index added headwinds for risk assets, including equities. Yet optimism about the longer-term narrative persists: persistent spot-market demand, manageable leverage, and a potential rotation from gold could sustain the rally despite a near-term pullback.
Oil traded above $98 a barrel after reports of heightened tensions in the region, while the US producer price index rose more than expected, complicating the outlook for monetary policy. The S&P 500 remained within striking distance of its all-time highs just weeks earlier, even as recent US data showed some softness in the labor market. Against this backdrop, investors kept an eye on Bitcoin’s price action, viewing the move as a pause in momentum rather than a reversal of the bull case, particularly given how spot demand and institutional buying have shaped the market in recent weeks.
Key takeaways
-
Spot market demand, reinforced by US-listed spot Bitcoin inflows and significant buying by strategy-minded investors, has helped sustain upwards momentum.
-
Leverage in the Bitcoin long-side remains moderate, reducing the risk of cascading liquidations if prices slip further.
-
Rising inflation concerns and weaker fixed-income returns are fueling a potential rotation from gold into Bitcoin over time.
-
Derivative signals show bears are not flooding the market with excessive leverage; while funding rates have turned negative, they stay below historically aggressive levels, indicating a broader preference for cautious risk-taking.
Spot demand remains a stabilizing force
In recent sessions, Bitcoin’s move higher has been supported by a steady stream of demand from the spot market, rather than a heavy reliance on speculative leverage in the futures arena. Market observers pointed to ongoing accumulation inUS-listed spot-market products and notable buying activity by the Strategy group’s backers, highlighting a trend toward price discovery driven by real demand rather than purely synthetic liquidity. This dynamic is seen as a more durable underpinning for upside than a mere tilt toward derivatives-driven speculative bets.
Analysts also note that the immediate risk of a violent, cascading liquidation squeeze appears limited. Data on leveraged positions suggest traders are not collectively overexposed to bullish bets, even if Bitcoin tests lower levels in the near term. A hypothetical $450 million liquidation scenario tied to a move back toward the 68,000 area would still represent a small fraction of the overall open interest, reinforcing the view that current risk is more about price retries than systemic margin calls.
Macro backdrop and the path of policy
Although volatility has risen with energy prices and inflation concerns, the equity backdrop has not collapsed. The S&P 500 hovered within a short distance of record levels, while ongoing headlines around inflation and policy expectations shaped traders’ risk budgeting. The US 2-year Treasury yield stood around 3.71%, and inflation expectations from the Cleveland Fed around 2.27%, translating into a modestly positive carry for holders of cash and fixed income relative to the uncertain macro regime. In market terms, this environment tends to favor assets that can act as inflation hedges or portfolio diversifiers, which has historically been Bitcoin’s longer-run narrative for many participants.
Fed policy expectations also shifted. Volatility in rate outlooks was underscored by the CME FedWatch Tool, which indicated a sharp drop in odds of a near-term rate cut or hold, with probabilities of sustained rates by September moving from the mid-to-high range toward a tighter stance picture. In other words, the horizon for monetary support remains uncertain, nudging investors to consider hedges beyond traditional assets.
Derivatives signals and the risk outlook
From a derivatives perspective, negative funding rates for Bitcoin futures have been a feature of late, suggesting that shorts have paid to maintain positions and that bears may be more aggressive than the price action alone would imply. Yet, the funding rate has hovered below the neutral 6%–12% band even as Bitcoin traded above the previous highs, implying that the market’s buoyancy is being driven more by spot demand than margin-driven speculation. This nuance matters for risk managers and long-term holders alike, as it points to a steadier ascent rather than an abrupt, leverage-fueled ascent or collapse.
Industry trackers also highlight ongoing spot ETF activity. While inflows into spot product offerings can be lumpy, sustained accumulation supports a different dynamic than futures-only rallies, with investors signaling a willingness to own Bitcoin as a core asset rather than as a speculative bet on volatility alone.
Gold rotation and what it could mean for Bitcoin
Another angle traders are watching is the potential rotation away from gold as inflation pressures persist. Gold’s price action has shown signs of fatigue after a period of firmness, which could, over time, create room for Bitcoin to capture risk-off and risk-on demand that might otherwise have found a home in gold. While this is not a guaranteed path, the argument stands: if inflation remains stubborn and fixed-income alternatives underperform, Bitcoin could increasingly position itself as a diversifying asset in portfolios seeking inflation protection and asymmetric upside potential.
In the near term, the market will likely keep a close eye on both macro data and energy-price trajectories, as both have historically been proximate drivers of risk appetite and correlation patterns across assets. The balance between inflation signals, policy expectations, and real-world demand for Bitcoin will shape whether the current pullback evolves into a consolidation or a pause before renewed leg higher.
Related industry observations have underscored a broader sentiment among institutions: while interest in cryptocurrency exposure remains, investors are seeking more resilience in the face of macro uncertainty. The ongoing debate about how crypto assets fit within traditional portfolios—especially as a potential hedge against inflation—continues to inform how market participants allocate to Bitcoin in the months ahead.
What remains uncertain is how quickly spot-demand momentum translates into durable price gains, and whether external shocks—such as further geopolitical tensions or unexpected shifts in energy prices—could reintroduce volatility. Still, the current data points suggest Bitcoin’s upside is anchored less by speculative leverage and more by genuine demand from buyers who view it as a constructive component of a diversified, risk-managed crypto exposure.
Readers should watch for continued spot-market inflows, evolving ETF dynamics, and the macro data flow over the coming weeks to gauge whether Bitcoin can reclaim its recent highs or establish a new range as policy expectations firm up.
S&P Dow Jones Indices has licensed its S&P 500 Index to Trade[XYZ] for the launch of a perpetual futures contract on Hyperliquid, in what the company described as the first officially licensed onchain product offering continuous, leveraged exposure to the index for eligible non-US users.
According to Wednesday’s announcement, contract allows eligible non-US traders to take long or short positions on the index without an expiry date, with markets operating continuously outside traditional exchange hours using official index data from S&P Dow Jones Indices.
The contract also brings equity index exposure onto Hyperliquid, extending the use of perpetual derivatives beyond cryptocurrencies into traditional financial benchmarks.
Trade[XYZ] said its onchain markets have processed more than $100 billion in volume since October 2025, with an annualized run rate topping $600 billion.
The move comes after the index maker teamed with Centrifuge in July to bring the S&P 500 onchain through proof-of-index infrastructure and the launch of a tokenized index fund built on blockchain-based systems.
Related: Perp DEXs almost triple volume in 2025 as onchain derivatives mature
Crypto exchanges expand perpetual trading into traditional assets
Efforts to bring traditional financial markets into crypto are taking varied forms, including tokenized assets and perpetual derivatives tied to real-world markets.
In January, Binance launched “TradFi” perpetual contracts, offering USDT-settled derivatives linked to commodities such as gold and silver with 24/7, no-expiry trading. The following month, Kraken expanded the model to equities, introducing tokenized perpetual futures that provide leveraged exposure to US stock indexes, gold and specific companies.
Earlier this month, Coinbase said it would introduce round-the-clock trading for Bitcoin (BTC) and Ether (ETH) futures in the US and expand into perpetual-style contracts.

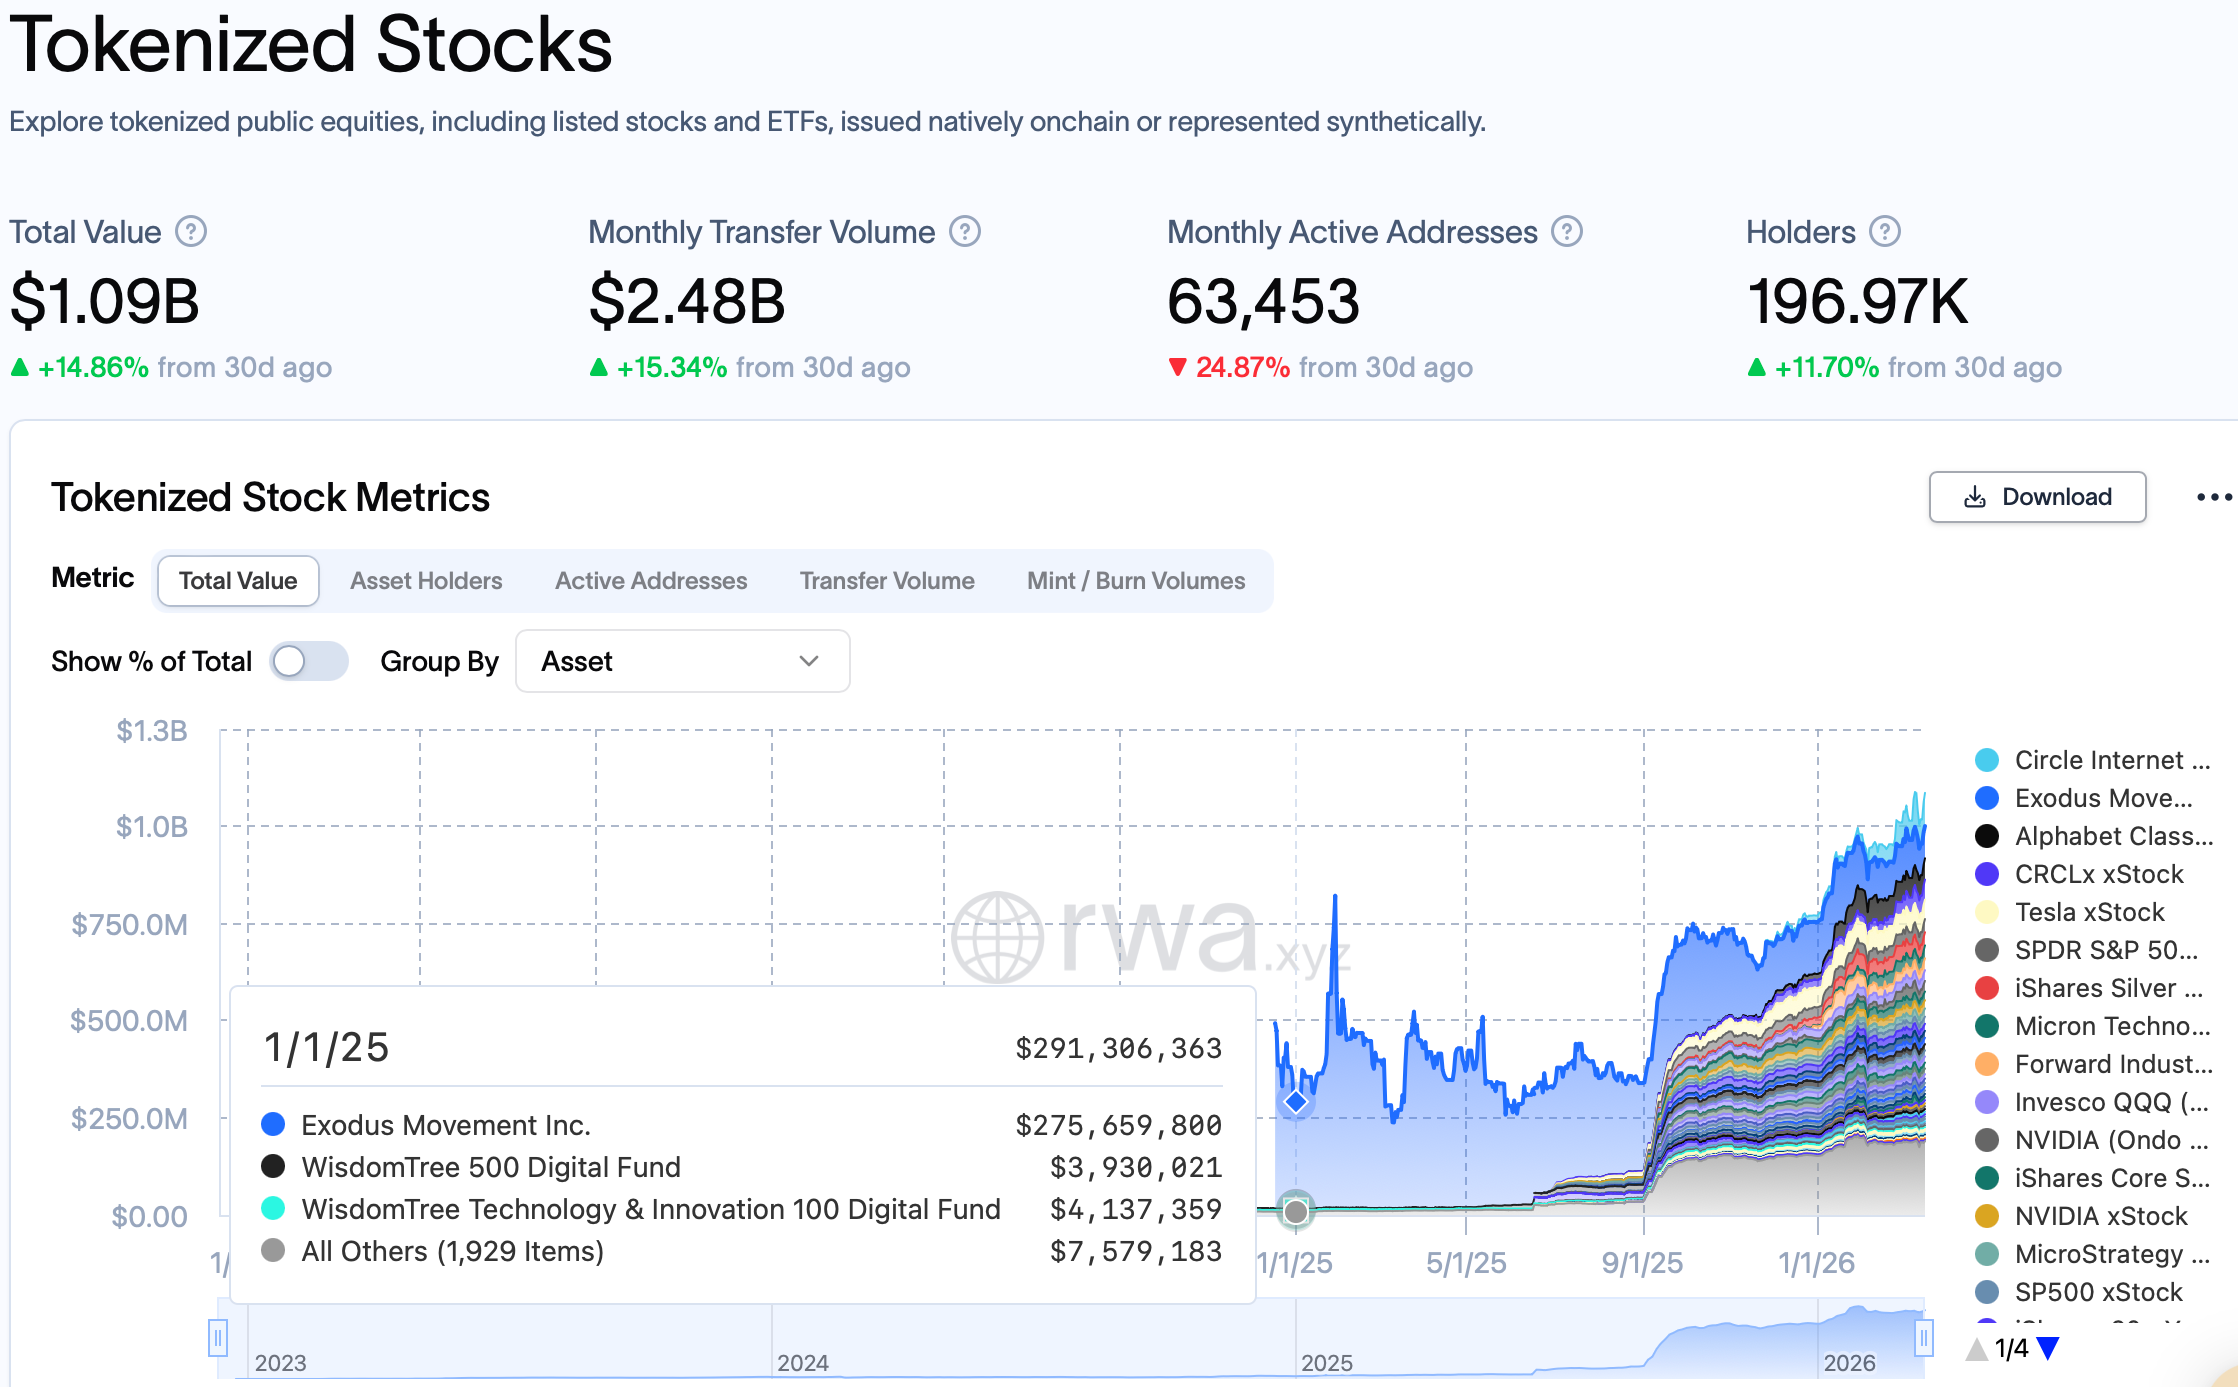
At the same time, tokenized equities have grown steadily. Data from RWA.xyz shows total onchain value rising to about $1.09 billion from roughly $300 million at the start of 2025.
The market remains relatively concentrated, led by a mix of tokenized equities and exchange-traded products. Circle Internet Group accounts for about $136.8 million in value, followed by Exodus Movement at $83 million and Alphabet at $72.9 million, with Tesla and the iShares Silver Trust also among the largest holdings.

Magazine: Big Questions: Can Bitcoin save you from the dreaded Cantillon Effect?


A pseudonymous whale called Jason has built a 2,281 BTC short on Binance, now in multi‑million profit, extending a pattern of eerily well‑timed macro trades.
Summary
- On-chain sleuths say Jason holds a 2,281 BTC short on Binance at a $74,238 entry, sitting on roughly $4.2 million in unrealized profit with BTC near $72,467.
- The trader’s history includes perfectly timed shorts during prior market crashes and a reported $58.89 million loss, underscoring a high‑conviction, high‑risk strategy.
- Today’s bet lands as Bitcoin slides on Iran-linked Strait of Hormuz tensions and hotter‑than‑expected U.S. PPI, with analysts split on whether Jason is signal or noise.
A pseudonymous trader known online as Jason (@Jason60704294) is once again drawing scrutiny from on-chain analysts after data published Wednesday by blockchain sleuth @ai_9684xtpa revealed that Jason currently holds a short position of 2,281.09 BTC on Binance, with a nominal value of approximately $169 million and an opening average entry price of $74,238. With Bitcoin (BTC) trading around $72,467 at the time of monitoring — roughly 2.38% below Jason’s entry point — the position carries an unrealized floating profit of approximately $4.155 million.
The trade is not an isolated event. It is the latest chapter in a documented pattern that has made Jason one of the most closely tracked retail-sized whale accounts in crypto markets. According to on-chain analysis aggregated by Blockchain.news, Jason had just days earlier closed a long position with a profit of $14.668 million before pivoting sharply to the short side, opening an initial position of 28.48 BTC at an estimated entry price of around $74,210. Wednesday’s data confirms that position has since been substantially scaled up to over 2,281 BTC — a markedly more aggressive commitment.
Jason’s history adds considerable weight to the current trade. In August 2025, the trader opened short positions on BTC at $120,948 and on ETH at $4,712, positions that — if held — would have generated substantial returns as both assets declined sharply in subsequent months. Earlier, the trader had reportedly exited positions recording a $58.89 million loss, underscoring that the strategy carries real risk despite its headline-grabbing wins.
The timing of today’s short aligns with a broader market deterioration. Bitcoin has been under sustained pressure since late February, when U.S.-Israel military strikes on Iran triggered a Strait of Hormuz crisis that has since disrupted approximately 15% of global oil supply. Wednesday’s release of U.S. February PPI data — coming in at 0.7% month-on-month against a 0.3% forecast — compounded the risk-off sentiment, further dimming expectations for Federal Reserve rate cuts that had previously underpinned crypto’s bull case.
It is worth noting the platform context. Jason’s current position is held on Binance, not on Hyperliquid, making real-time on-chain tracking of the exact account more difficult, as Odaily reported. The figures cited are derived from analyst monitoring of wallet behaviour and social media timestamps rather than direct smart contract reads. Nonetheless, the data is broadly consistent with Jason’s established trading fingerprint: high-conviction, concentrated directional bets placed at key technical inflection points.
Whether Wednesday’s short is prescient once again, or whether it becomes a cautionary tale in an eventual Bitcoin rebound, remains to be seen. What is clear is that a growing cohort of on-chain analysts are watching every move — and that in a market defined by opacity, Jason has become something of an unlikely signal in the noise.
The negative ETF streak finally came to an end, which is the first good sign for XRP.
Ripple’s native cross-border token was rejected at over $1.60 yesterday and has dropped by over 10% since that local peak to $1.45 as of press time.
Nevertheless, there are a couple of positive signs for its short-term price movements, including the reactivation of whale wallets.
2 Bullish Signs
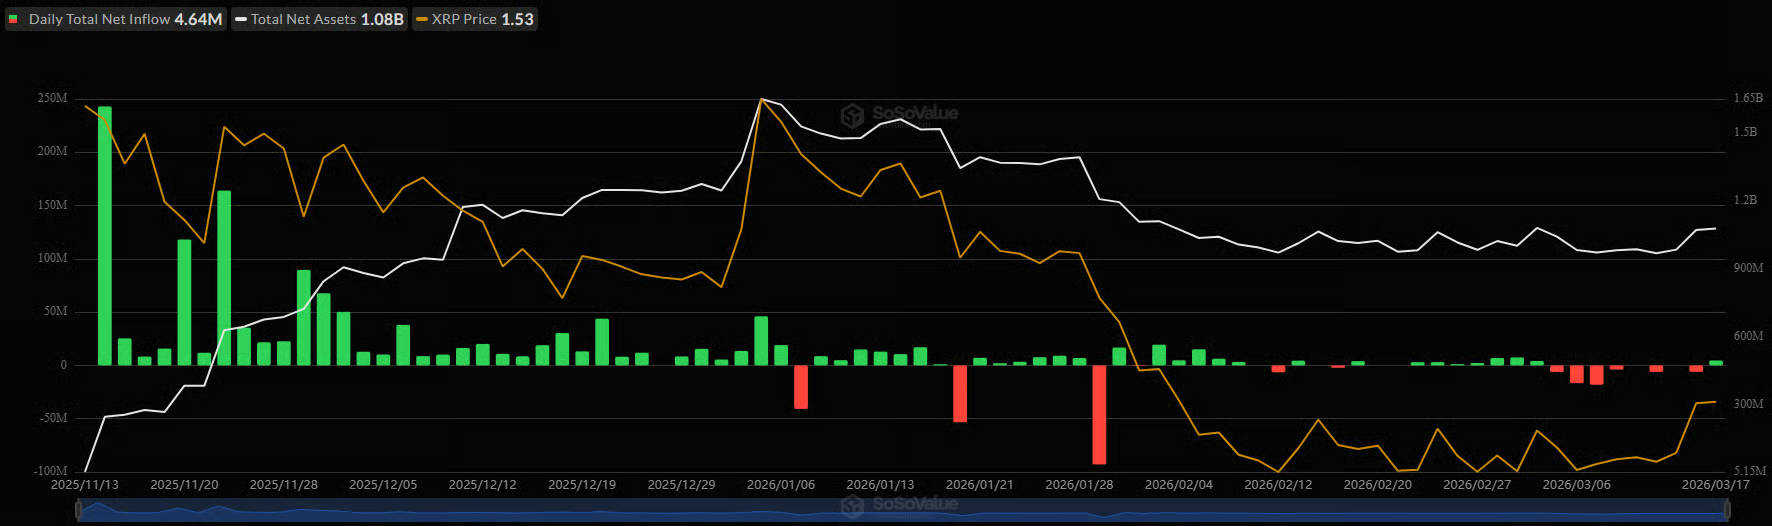
The spot XRP ETFs in the United States had entered their worst streak in terms of consecutive daily net outflows (or lack of any flows) that lasted nearly two straight weeks – from March 5, when investors pulled out just over $6 million, to March 16, when the withdrawals were just shy of that number. In the meantime, there were two days with zero reportable activity.
However, that negative trend was finally broken yesterday as the funds attracted $4.64 million – the highest single-day figure since March 3. As such, the total net inflows have remained above $1.2 billion.

The second positive news for the XRP Army comes from whales. After a prolonged period of lack of any substantial activity, these large market participants have resumed their accumulation spree. Citing data from Santiment, Ali Martinez asserted that they have bought 200 million tokens in the past two weeks. In terms of USD, this stash is worth roughly $300 million at current prices.
200 million $XRP have been bought by whales in the last two weeks! pic.twitter.com/sMQNef3VZN
— Ali Charts (@alicharts) March 18, 2026
XRP Price Rejected
Yesterday’s positive net inflow day for the ETFs, aligned with the accumulation from whales and the overall market-wide resurgence, led to an impressive rally for XRP. The token surpassed BNB in terms of market cap after it jumped to a monthly high of around $1.63.
You may also like:
Although analysts began praising the move and setting new big targets ahead, XRP was rejected at that point and driven south by over 10%. It currently struggles to remain above $1.45. This correction comes despite the recent expansion news from the company behind the asset, as well as the fact that the top traders on Binance have been “quietly buying XRP long positions,” according to data from popular analyst CW.
Binance top traders are quietly buying $XRP long positions. pic.twitter.com/01QV7hj7AC
— CW (@CW8900) March 18, 2026
Binance Free $600 (CryptoPotato Exclusive): Use this link to register a new account and receive $600 exclusive welcome offer on Binance (full details).
LIMITED OFFER for CryptoPotato readers at Bybit: Use this link to register and open a $500 FREE position on any coin!
Additional reporting by Turner Wright.
The FTX Recovery Trust, which oversees the distribution of funds to creditors and former customers of the failed crypto exchange, announced on Wednesday that it will distribute $2.2 billion to creditors on March 31, 2026.
Eligible creditors will receive their funds through their chosen distribution provider within one to three business days, according to an announcement from the Trust.
The fourth distribution includes a 18% payout for Dotcom Customer claims, a 5% distribution for US Customer Entitlement Claims and a 15% distribution for both General Unsecured Claims and Digital Asset Loan Claims.
Convenience claims will receive a 120% reimbursement under the recovery plan, according to the announcement.
Following the fourth round of distributions, about $10 billion will have been paid out to creditors and former customers of the exchange. The fifth round of payments is scheduled for May 29, 2026, according to the trust.
The reimbursements could effect crypto prices in the short term if creditors and former customers of the FTX exchange, which collapsed in 2022, invest the recovery funds in digital assets.
Related: Court sets deadline for US to address Bankman-Fried’s new trial motion
FTX recovers billions in payouts, but creditors say it isn’t nearly enough
The FTX Recovery Estate began creditor payments in February 2025, with a $1.2 billion payment, followed by a $5 billion distribution the following May. The third round of creditor payments was distributed in September 2025 and totaled $1.6 billion.
Despite the billions of dollars recovered, creditors and former customers of the FTX exchange say they were short-changed by the recovery plan.
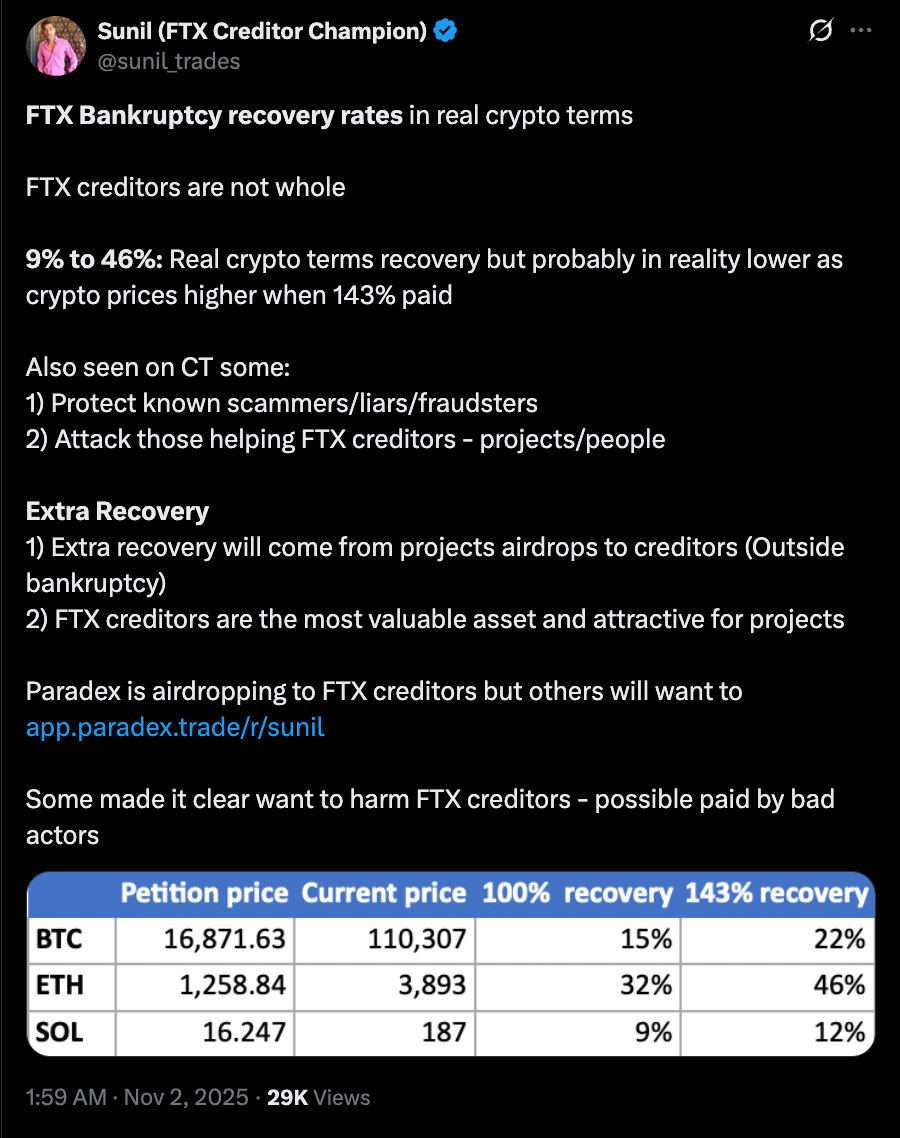
Creditors and former customers were reimbursed according to crypto asset values at the petition date in 2022, when legal action was taken against the exchange by creditors and customers.

Crypto asset values were much lower when the petition was filed, with Bitcoin (BTC) then trading at about $16,871, and Ether (ETH) at about $1,258.
“FTX creditors are not whole,” FTX creditor and creditor advocate Sunil Kavuri said in response to the reimbursement plan.
Convicted founder “SBF” pursues appeal, prison change
The latest effort to make victims whole comes amid appeal efforts by Sam “SBF” Bankman-Fried, the former CEO of FTX, who was sentenced to 25 years in prison following his 2023 conviction related to the misuse of customer funds.
He has posted to his X account using a proxy, often praising US President Donald Trump’s actions in the country’s conflict with Iran and his approach to regulating digital assets. Many experts speculate that the former CEO is lobbying the president for a pardon, but Trump reportedly said in January that he would not consider it.
As of Wednesday, Bankman-Fried was housed at the Federal Correctional Institution Terminal Island in the Los Angeles area. However, a Monday court filing by his mother claimed that he would be relocated “sometime in the next couple of weeks.”
Magazine: The $2,500 doco about FTX collapse on Amazon Prime… with help from mom
Crypto World
Smartest Ripple (XRP) Alternative? Smart Money Move To Taurux (TAUX) as Presale Surpasses $300K Raised
Sixty percent of XRP’s circulating supply is currently held at a cost basis above market price. That is 36.8 billion tokens sitting on a combined $50.8 billion in unrealized losses.
XRP trades at $1.51, down from its $3.65 all-time high reached in July 2025. Whales are buying into the pain: large wallets added 1.3 billion XRP in just 48 hours this month, and $738 million worth of tokens moved to cold storage in a single day. The smart money is accumulating while 60% of holders bleed. That dynamic tells you who controls the next move and who is along for the ride.
Passive holders hoping the whales will push the price past their cost basis are dependent on a group whose interests may not align with theirs. Taurox (TAUX) is a decentralized hedge fund where AI agents will trade pooled capital across DEXs and CEXs once the presale ends. Stakers keep 80% of net profits from strategies that generate returns regardless of any single token’s cost basis distribution.

What the High-Water Mark Means for Protecting Staker Gains
The high-water mark prevents agents from earning fees on recovery. If an agent generates $10,000 in profit, then loses $3,000, the creator earns nothing on the next $3,000 of gains. Performance fees only apply to net new highs above the previous peak. Recovery is free for stakers. This eliminates the classic fund problem where managers collect fresh fees while clawing back to breakeven.
Agents that consistently fail to reach new highs lose capital allocation through Sharpe-weighted rebalancing. Capital flows away gradually as performance declines. No forced liquidation. Stakers keep 80% of net gains at the standard tier. The protocol takes 5% on profits only, with 30% burned permanently and 70% flowing to the DAO treasury. Sixty percent of XRP holders are underwater with no mechanism preventing further decline.
Taurox stakers benefit from a high-water mark that ensures they never pay for an agent’s mistakes twice. One position has a $50.8 billion loss overhang with no structural protection against further decline. The other has protocol-level safeguards that ensure stakers never subsidize an agent’s recovery from losses. That difference is architectural, not speculative.
Phase 2 Fills While 60% of XRP Holders Wait to Break Even
Phase 1 of the TAUX presale sold out in under 24 hours at $0.01. Phase 1 buyers are already up 20% at Phase 2’s price of $0.012, without staking or seeing an agent trade pool capital. The presale has raised $314.7K, and Phase 2 is 23.9% filled. Nineteen phases run from $0.01 to $0.07, each closing permanently once its allocation sells out. The price steps up and the previous entry vanishes forever. Staking activates at the end of the presale, and agents begin trading once the pool goes live.
XRP holders sitting on $50.8 billion in unrealized losses need the price to more than double just to break even. The TAUX presale is pricing in forward value before the pool even activates. The buyers entering Phase 2 right now are not waiting to recover from losses.
They are positioning before agents begin trading. Every token sold at $0.012 brings Phase 2 closer to closing permanently. The window is narrowing in real time, and the cost of hesitation is a permanently higher price tier. Waiting costs real money when phases close and the entry steps up with no exceptions.

Phase 2 Entry and Upside Math
Phase 2 is live at $0.012. Listing at $0.08 is a 6.67x return before the pool produces any profit. A $1 post-listing target is x83 from the current price. At a $1 billion pool with 30% gross returns, implied price reaches $1.85, or x154 from today’s entry. The protocol charges 5% on gross profits only. No management fees at any tier. Thirty percent of collected fees are burned permanently. Supply is locked at 2 billion tokens, non-mintable.
XRP has $50.8 billion in underwater positions. The TAUX presale has $314.7K from buyers who entered at the ground floor. Every profitable trade by agents will compress supply further through the burn mechanism. Phase 2 will not survive the same demand that emptied Phase 1 in a single day.
Learn More
Buy TAUX: https://taurox.io/
Whitepaper: https://docs.taurox.io/
Official Telegram: https://t.me/tauroxlabs
The post Smartest Ripple (XRP) Alternative? Smart Money Move To Taurux (TAUX) as Presale Surpasses $300K Raised appeared first on Blockonomi.
XRP has legal clarity and sits in a post‑parabolic range; models see slow upside toward 2026–2030, with any real breakout hinging on Ripple turning hype into payment volume.
Summary
- XRP trades in the mid‑$1.40s and is negative year‑to‑date after a huge 2024–2025 run, behaving like a large‑cap alt digesting gains rather than a meme coin about to explode.
- The 2025 SEC settlement treated XRP as a non‑security for exchange trading, imposed manageable penalties on Ripple, and lifted the lawsuit overhang, but shifted the story from court drama to execution risk.
- Base‑case models cluster around a gradual climb (roughly $1.7–$1.9 by 2030), with higher $3–$6—and in extreme cases above $10—only if Ripple captures meaningful real‑world payment flows and liquidity.
XRP (XRP) is trading around the mid‑$1.40s in March 2026, still capped below its post‑SEC‑settlement spike highs but comfortably above the dead‑money zone it occupied for most of the lawsuit era. With legal overhang largely gone and macro liquidity improving, the next leg depends on one thing: whether Ripple can convert regulatory clarity into real payment volume instead of just social media nostalgia.
Where XRP Stands Now
Spot XRP has been oscillating roughly between $1.40 and $1.70 year‑to‑date, with March prints clustered near $1.40–$1.50. On a longer window, 2026 YTD performance is negative double digits after a monster 2024–2025 run, a typical post‑parabolic digestion phase. Derivatives markets are also sober: XRP March 2026 futures reflect only modest premium over spot, implying that professionals are not pricing in an imminent vertical move. In other words, this is not a meme mania – it’s a large‑cap alt consolidating after finally getting regulatory answers.
What The SEC Settlement Changed
The multi‑year SEC fight effectively ended in 2025 with a settlement that left XRP legally treated as a non‑security for exchange trading, while penalizing Ripple’s past institutional sales. Ripple absorbed around $125 million in penalties, a rounding error relative to prior fears of multi‑billion‑dollar damages, and walked away with a workable compliance roadmap. Post‑settlement, several analyses note that XRP’s valuation stabilized in a higher band, roughly in the low‑to‑mid single dollars at peak before retracing, as legal clarity pulled sidelined capital back in. The lawsuit is no longer the story; execution is.
XRP Price Predictions: 2026–2030
Model‑driven forecasts are boring on the surface but important for framing expectations. Binance’s aggregated prediction data puts current spot near $1.45, with year‑ahead projections moving gradually higher into the $1.70–$1.80 zone by late 2026 and around $1.75–$1.90 by 2030 – essentially a slow grind scenario. Other quant models, like CoinCodex, see XRP at about $1.78 by the end of 2026 and around $5.90 by 2030, implying roughly 20% upside in the near term and a 3x over four years if adoption tracks their curve. Centralized‑exchange research desks such as Kraken float similar near‑term bands around $1.50 for 2026, reinforcing the idea that base‑case pricing is incremental, not explosive. More aggressive boutiques push optimistic 2030 targets between $5 and $7.50 – and in one extreme scenario even above $10–$20 – but explicitly condition those paths on Ripple capturing a meaningful slice of SWIFT‑scale flows.
Trading The Narrative, Not The Myth
The rational way to treat XRP now is as a large‑cap, event‑driven payments token with asymmetric but conditional upside. A conservative band for 2026 sits roughly between $1.20 and $2.00, with the lower edge funded by macro risk‑off and the upper edge needing sustained inflows from banks, fintechs, and on‑chain liquidity venues. If Ripple manages to convert regulatory clarity plus infrastructure deals into real settlement volume, the 2030 path into $3–$6 is plausible; if not, XRP risks remaining a high‑beta index of past cycles rather than a leader of the next one. Position sizing should respect that profile: think of XRP as closer to a volatile financial infrastructure equity than a lottery ticket – meaningful upside, but paid out over adoption cycles, not overnight.


Polymarket has acquired DeFi infrastructure startup Brahma, folding its smart-account execution layer into a prediction market now eyeing a $20B valuation and an AI‑driven, onchain future.
Summary
- Polymarket bought Brahma, a DeFi infrastructure startup for programmable smart accounts and automated execution, in its third acquisition in under a year as it eyes a $20 billion valuation.
- Brahma will wind down outside partnerships and focus on Polymarket’s stack, streamlining wallets, deposits, asset routing and result-token redemptions while helping bring deeper liquidity into niche contracts.
- The deal follows earlier QCEX and Dome buys and comes as algorithmic traders and AI bots dominate Polymarket performance tables, making robust, low-friction onchain plumbing a competitive necessity.
Polymarket, the blockchain-based prediction market platform currently eyeing a valuation of approximately $20 billion, has acquired Brahma — a DeFi infrastructure startup focused on programmable smart accounts and onchain execution automation — for an undisclosed sum, Fortune reported on Wednesday. The deal marks Polymarket’s third known acquisition in under a year and signals a deliberate strategic shift: the company is not merely growing its user base, it is acquiring the technical substrate to build a more sophisticated onchain financial product.
Brahma was co-founded in 2021 by Alessandro Tenconi, Akanshu Jain, and Bapi Reddy Karri, and operates as a full-stack execution layer for DeFi. Rather than functioning as a conventional crypto wallet, Brahma provides a unified smart account infrastructure that allows users — and autonomous agents — to batch complex DeFi transactions, including swaps, lending, bridging, and collateral posting, into a single programmable flow. The platform has processed over $1 billion in transaction volume across more than 13,000 accounts and secured upwards of $100 million in user assets, all without a single publicly disclosed security incident. Its investor roster includes Framework Ventures, Lightspeed Venture Partners, Maven 11 Capital, and Safe (formerly Gnosis Safe).
According to the ChainCatcher report citing Fortune, Brahma will terminate its existing projects with other partners following the acquisition. Its team will integrate into Polymarket with a specific mandate: optimising user experience across wallet creation, asset deposits and conversions, and result token exchanges, while leveraging Brahma’s DeFi expertise to bring greater liquidity to Polymarket’s niche contract markets.
Polymarket CEO Shayne Coplan — who became the world’s youngest self-made billionaire at age 27 following a $2 billion strategic investment from Intercontinental Exchange (ICE) in October 2025, which valued Polymarket at $9 billion — stated that the Brahma team has the capability “to design, operate, and scale complex products”. Polymarket is now reportedly seeking a fresh funding round that could push its valuation to $20 billion, up from the $9 billion set at the ICE investment.
The acquisition is Polymarket’s most infrastructure-oriented move to date. Its previous deals included QCEX, a U.S.-licensed derivatives exchange that enabled the platform’s re-entry into the American market following earlier regulatory difficulties, and Dome, a Y Combinator-backed startup that built a unified API layer for prediction markets, acquired in February 2026. Each acquisition has addressed a different layer of the stack: regulatory access, developer infrastructure, and now onchain execution.
Crucially, Polymarket has always operated on a blockchain architecture rather than the fiat-based systems used by its main competitor Kalshi. The acquisition of Brahma deepens that native onchain advantage, particularly as prediction markets increasingly attract algorithmic traders and AI-driven bots — a dynamic recently documented by Phemex, which found that bots dominate the top-performing accounts on Polymarket, underscoring the growing importance of programmable, low-friction execution infrastructure.
The deal arrives at a moment of intense scrutiny for prediction markets broadly. Polymarket has faced questions about insider trading — most visibly when a single account made $553,000 betting on events related to Iran just before its supreme leader was killed in February. Coplan has acknowledged the platform faces growing backlash as it scales. Acquiring Brahma’s robust, agent-native infrastructure suggests the company is preparing for a future in which its markets serve not just human forecasters, but a much denser ecosystem of automated participants.
Is ETH heading toward new local peaks or will the bears regain control?
The second-largest cryptocurrency has performed quite well over the past seven days, increasing its valuation by double digits despite its Wednesday correction.
According to numerous analysts, the uptrend could continue in the short term, with some envisioning an astonishing increase toward a new all-time high.
The Rally Goes on?
Earlier this week, ETH soared to almost $2,400, or its highest point since the start of February. Currently, it trades at around $2,200, up 8% on a weekly basis.
The renewed upswing caught the eye of many industry participants who believe the valuation has yet to reach fresh local tops. X user Galaxy set $2,400 and $2,600 as the next potential targets, while Trader Tardigrade envisioned a pump to as high as $2,670.
Ted, who often discusses ETH’s performance, chipped in as well. He thinks the price could hit the $2,400 resistance zone, but that might be a “fakeout” and be followed by a substantial decline.
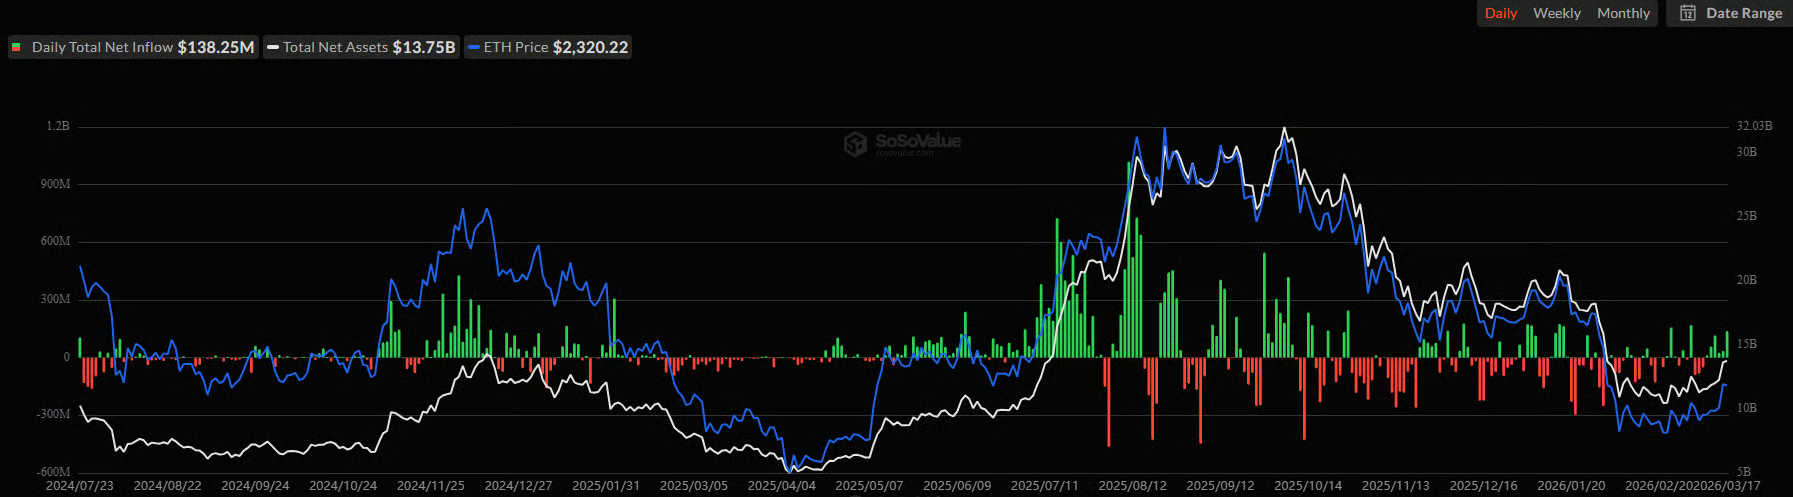
Meanwhile, several on-chain factors support the bullish scenario. The US spot ETH ETFs have been flashing green over the past six days, meaning inflows have dominated outflows. This reflects rising interest among institutional investors in gaining exposure to the asset and could positively impact future price performance.

Next on the list is the amount of ETH sitting on crypto exchanges. Earlier this week, the figure fell to a nearly 10-year low of around 15.85 million coins. This trend signals that investors continue to shift their holdings toward self-custody methods, thus lowering the immediate selling pressure.
You may also like:

Ethereum’s Relative Strength Index (RSI) should also be mentioned. The technical analysis tool, which measures the speed and magnitude of recent price changes, tumbled to 22. This means the asset has entered oversold territory and could be gearing up for a rally.

The Moon Scenarios
According to other analysts, ETH might be on the verge of a much more substantial increase that can take it to uncharted territory. X user ray claimed that $10,000 is “not a dream, just a milestone.”
A few days ago, the renowned investor and one who successfully predicted the 2008 financial collapse, Robert Kiyosaki, sounded the alarm that major banks and institutions are in trouble, hinting that another crash could be on the way.
Later on, he forecasted that “the biggest bubble” is about to burst, foreseeing that once the meltdown is over, BTC, ETH, gold, and silver will emerge as the major winners. As for the second-largest cryptocurrency, he envisioned its price skyrocketing to a (for now) almost unbelievable $95,000 within a year after the catastrophe.
Binance Free $600 (CryptoPotato Exclusive): Use this link to register a new account and receive $600 exclusive welcome offer on Binance (full details).
LIMITED OFFER for CryptoPotato readers at Bybit: Use this link to register and open a $500 FREE position on any coin!

Algorand Foundation cuts 25% of workforce amid crypto market downturn: Algorand Foundation
The Government Wants You to Eat These 5 Invasive Species
Blast from Vikings’ Past Signs with Bears


-
 Crypto World5 days ago
HYPE Token Enters Net Deflation as HyperCore Buybacks Outpace Staking Rewards
-

 Tech3 days ago
Your Legally Registered ‘Motorcycle’ Might Not Count Under Proposed US Law
-

 Fashion5 days ago
Weekend Open Thread: Addict Lip Glow
-
Sports4 days ago
Why Duke and Michigan Are Dead Even Entering Selection Sunday
-
 Tech1 day ago
Are Split Spacebars the Next Big Gaming Keyboard Trend?
-

 Business3 days ago
Search for Savannah Guthrie’s Mother Enters Seventh Week with No Arrests
-

 Business5 days ago
US Airports Launch Donation Drives for Unpaid TSA Workers as Partial Government Shutdown Enters Fifth Week
-
Crypto World4 days ago
Coinbase and Bybit in Investment Talks: Could Bybit Finally Enter the US Crypto Market?
-

 Business3 days ago
Australian shares drop as Iran war enters third week
-

 Business5 days ago
Country star Brantley Gilbert enters growing non-alcoholic beer market
-

 Crypto World3 days ago
Crypto Lender BlockFills Enters Chapter 11 with Up to $500M in Liabilities
-

 Sports5 days ago
College Basketball Best Bets: Conference Tournament Semifinal Picks
-

 Politics16 hours ago
The House | The new register to protect children from their abusers shows Parliament at its best
-

 Crypto World7 days ago
Three Binance Charts May Be Hinting at Bitcoin’s Next Move
-

 Business6 days ago
Trump demands Powell cut rates as Iran conflict raises energy prices
-

 Crypto World6 days ago
Senate Votes to Include CBDC Ban in Bipartisan Housing Bill
-

 Fashion3 days ago
25 Celebrities with Curly Hair That Are Naturally Beautiful
-

 News Videos8 hours ago
RBA board divided on rate cut, unusually buoyant share market | Finance Report | ABC NEWS
-

 NewsBeat6 days ago
Deane Road crash near Bolton colleges and university
-

 News Videos6 days ago
Tom Lee: The 100x Opportunity EVEN Bigger Than Bitcoin (New Ethereum Prediction 2026)


You must be logged in to post a comment Login