
Crypto World
Will MicroStrategy Share Prices Drops Below $100 Soon?
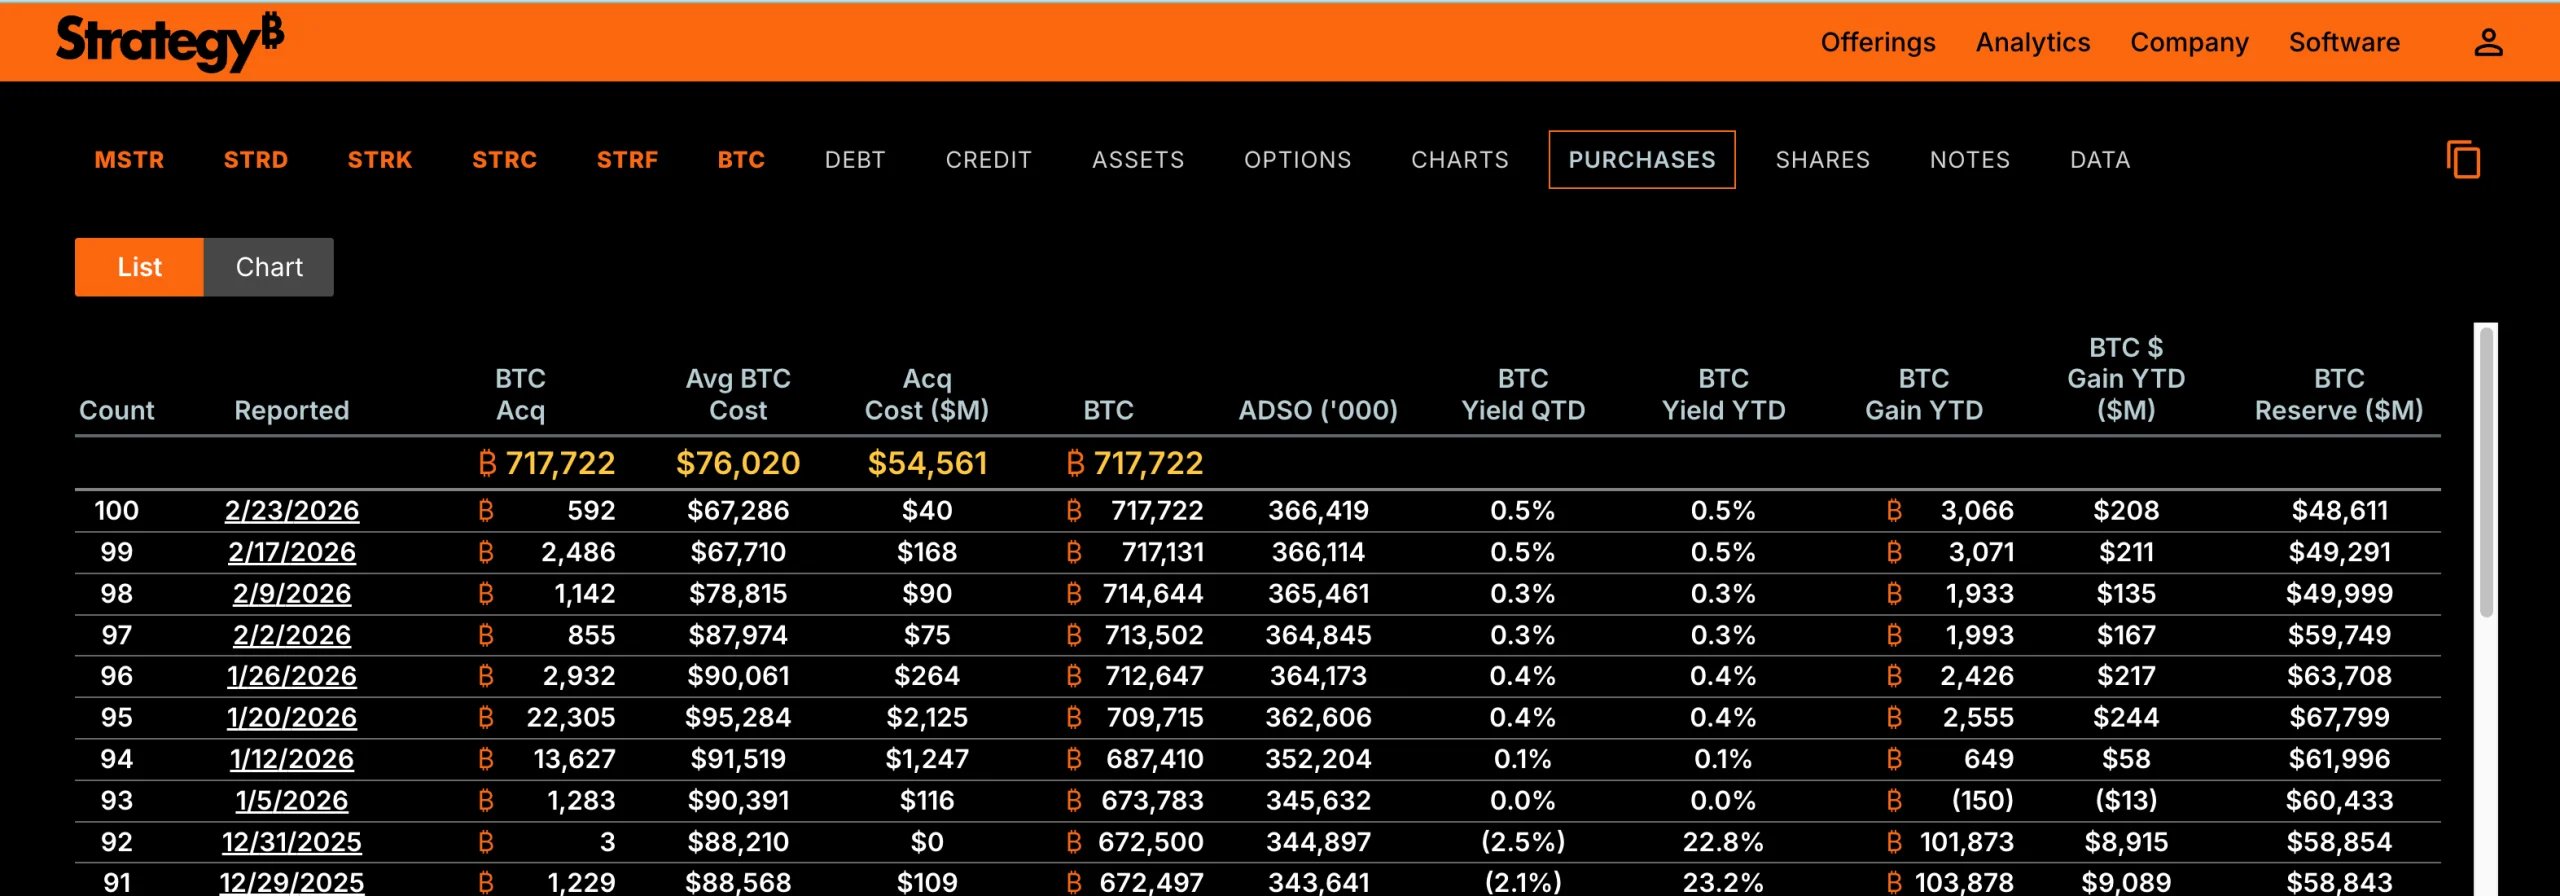
The MicroStrategy stock price couldn’t continue its upswing despite the company continuing to buy more Bitcoin. Its latest $40 million purchase, on February 23, came just as the stock began sliding again. But that wasn’t the entire story.
While MSTR stock dipped by over 9% on February 24, a 16% bounce followed on February 25, showing excitement. At press time, it’s down over 3% since yesterday’s close. The stock is now down about 4% from last Friday’s high and almost 63% over six months, raising fresh concerns about a deeper breakdown, all while the BTC stash was loaded again.
Latest $40 Million Bitcoin Buy Fails to Stop MSTR’s Slide
MicroStrategy added 592 Bitcoin on February 23, spending about $40 million at an average price near $67,286. This pushed its total holdings to 717,722 Bitcoin, with an overall average cost basis of $76,020.
Normally, such aggressive buying supports investor confidence because it signals long-term conviction in Bitcoin’s future.

Want more token insights like this? Sign up for Editor Harsh Notariya’s Daily Crypto Newsletter here.
But at this time, the MicroStrategy stock price continued to fall rather than stabilize, moving steadily on its bear-flag breakdown path that started on February 19, despite a few rebounds. This weakness closely reflects Bitcoin’s own behavior.
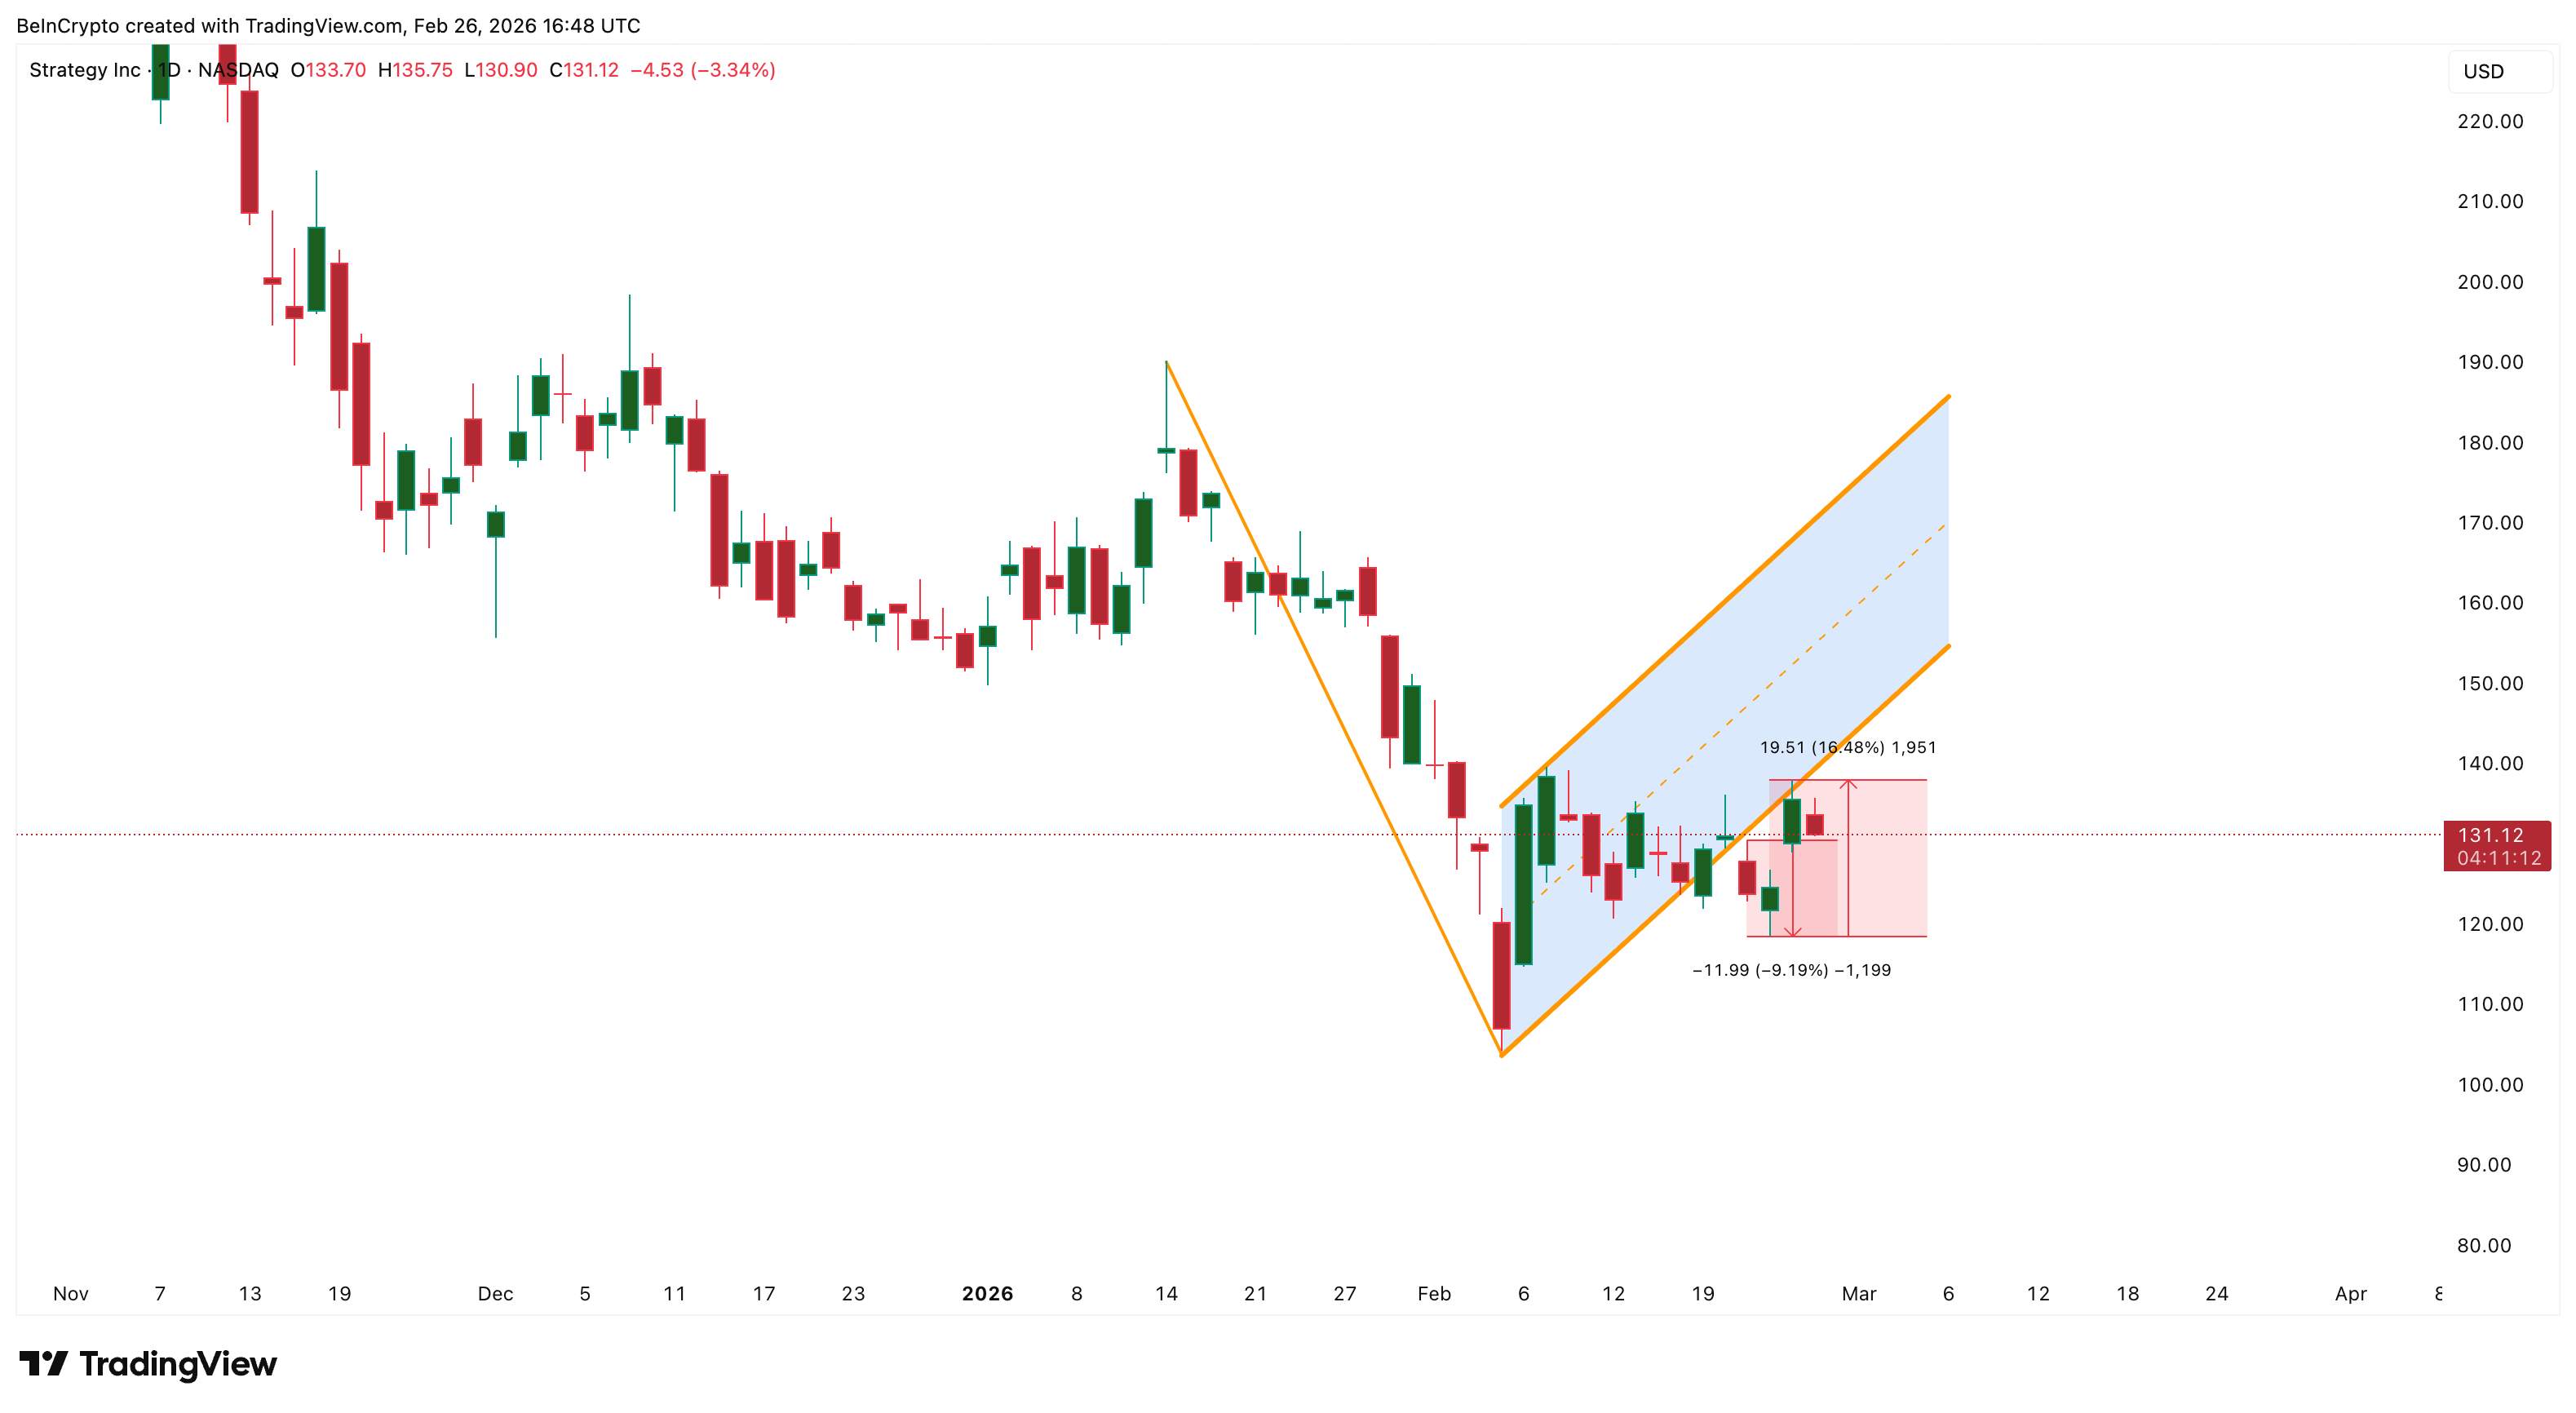
The stock had briefly rallied to $137 on February 25, riding Bitcoin’s rebound from $64,500 to $69,400, a 2.5% move. However, as Bitcoin cooled again, MicroStrategy immediately reversed lower, showing how tightly its performance remains tied to Bitcoin’s direction.
This shows MicroStrategy is still trading like a leveraged Bitcoin proxy. When Bitcoin pauses or weakens, MicroStrategy often falls faster because its valuation already assumes strong upside from its Bitcoin holdings.
The latest Bitcoin purchase did not change that dynamic, raising a more important question: whether institutional investors still support the stock.
Institutional Money Flow Signals Growing Exit Risk
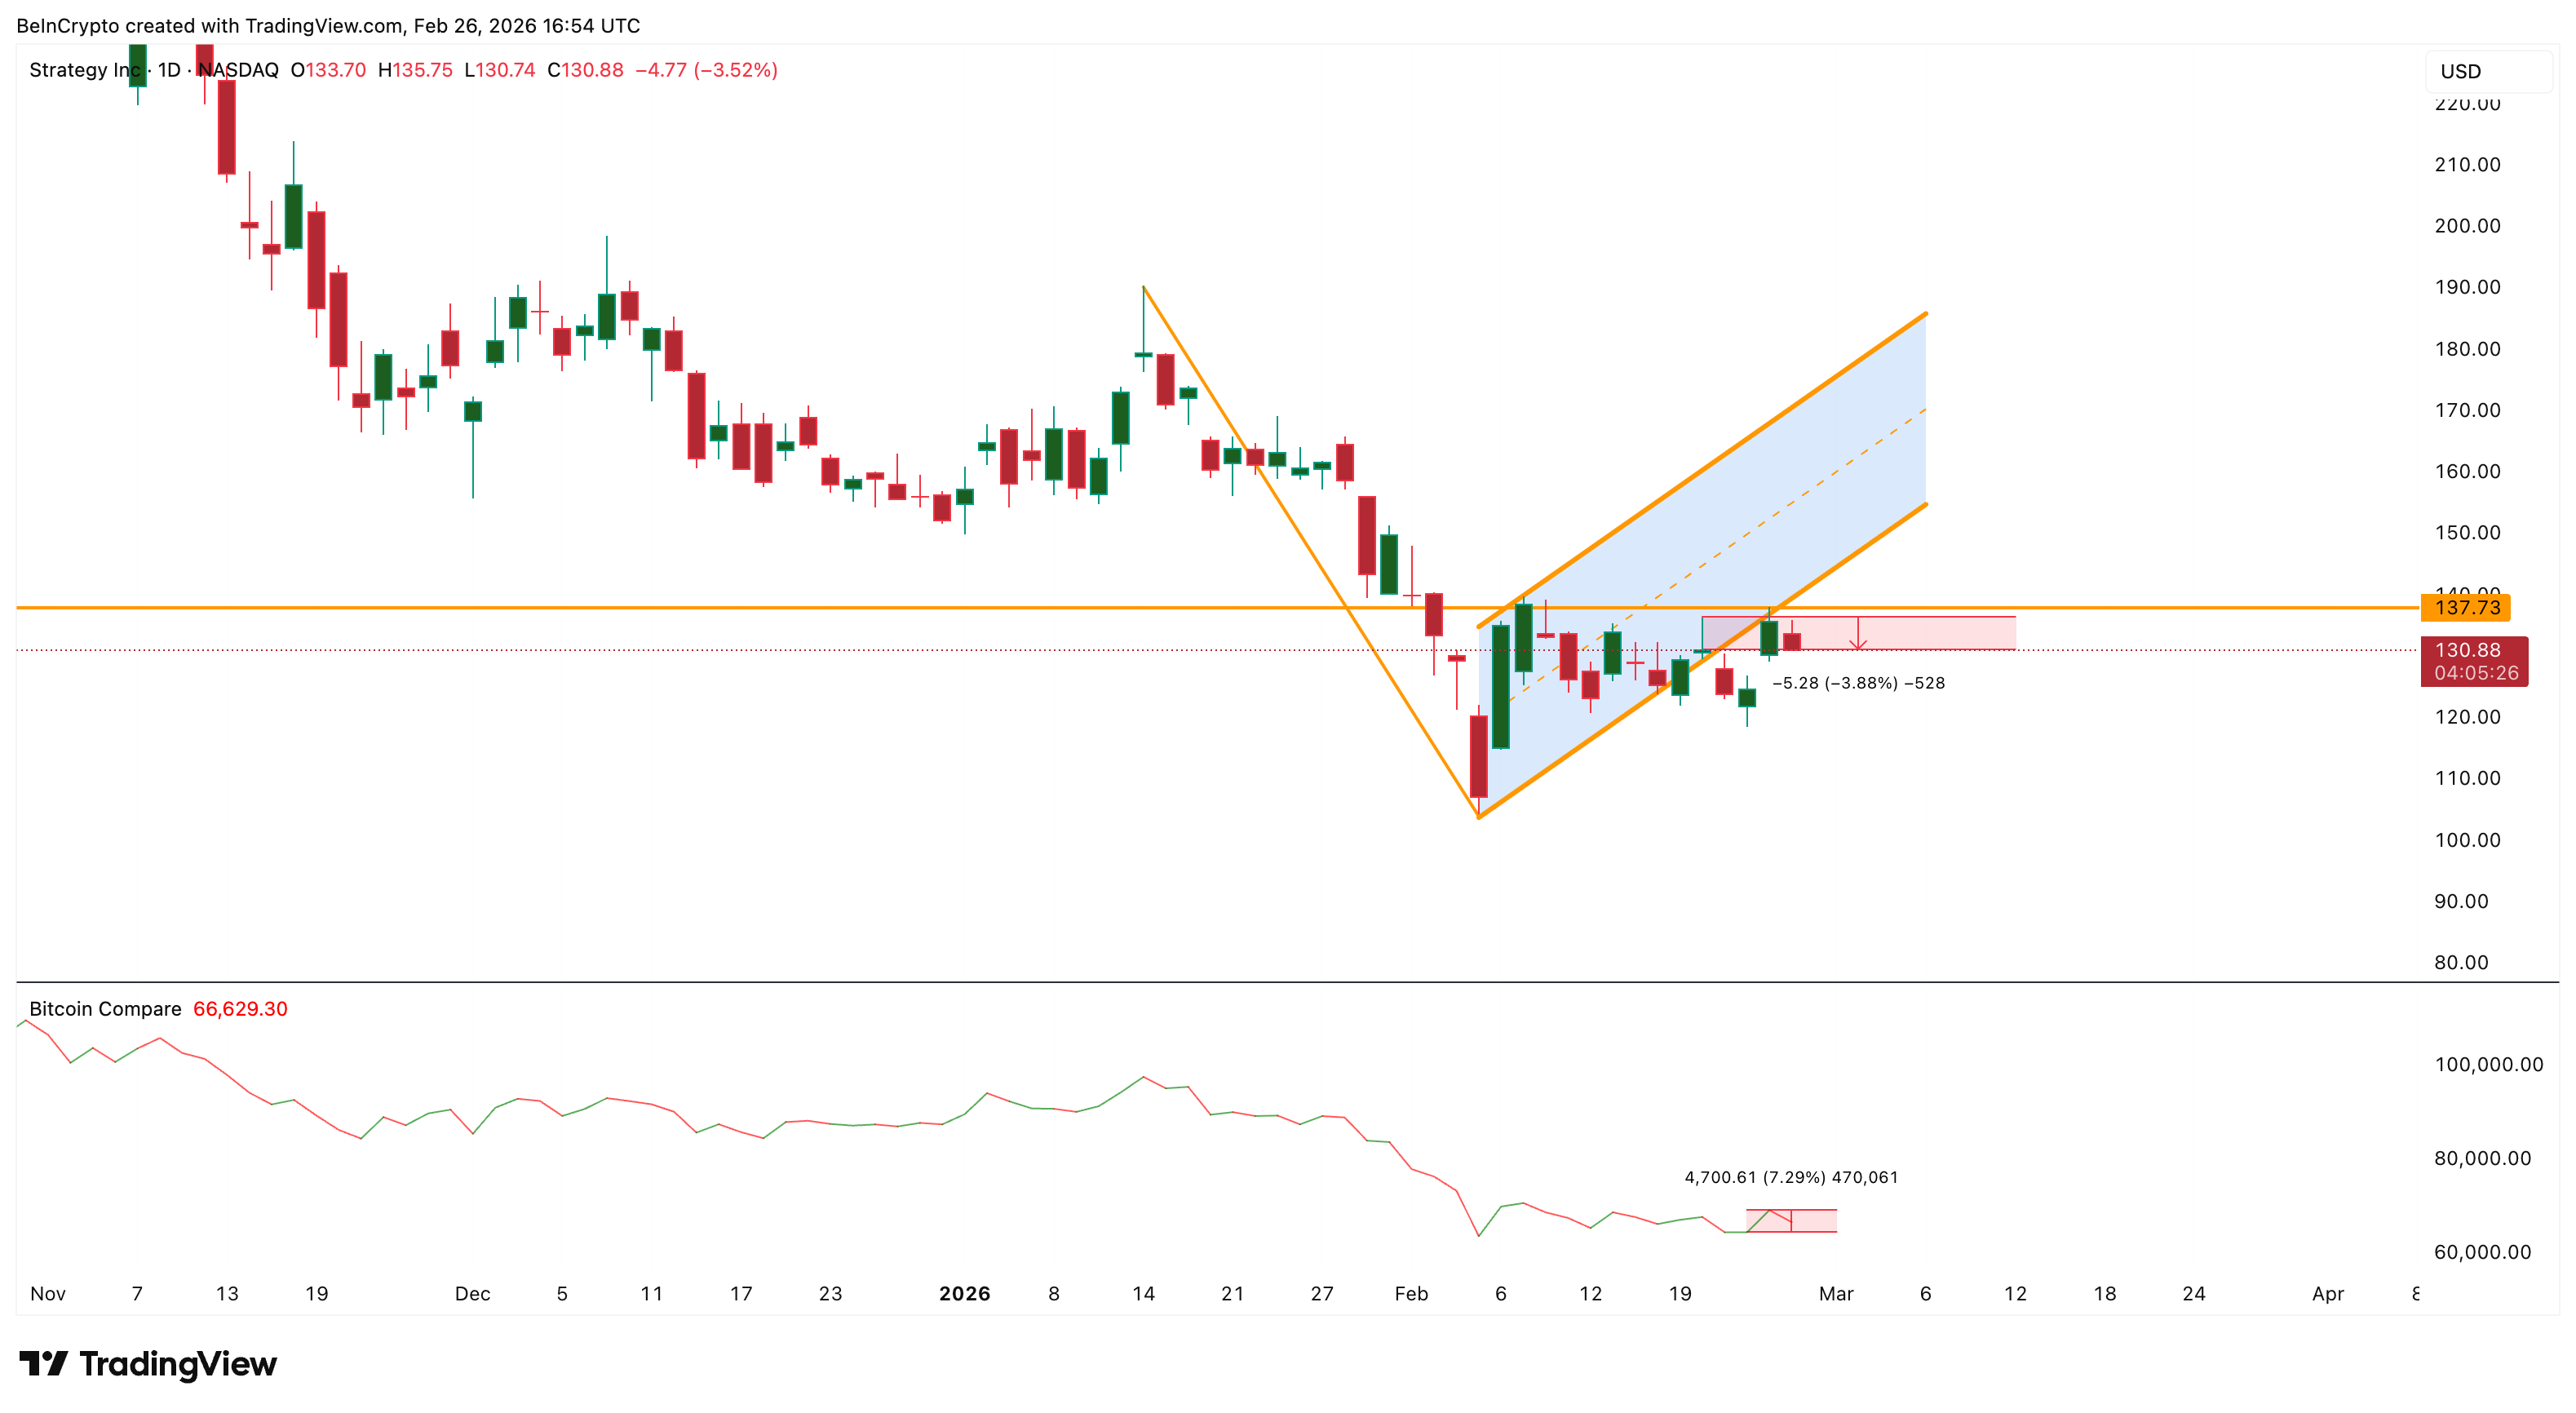
The Chaikin Money Flow (CMF) indicator is now flashing a warning sign. CMF measures whether large investors are buying or selling by combining price and volume.
When CMF rises above zero, it signals accumulation, meaning institutional investors are buying. When it drops below zero, it signals distribution, meaning capital is leaving the asset.
Earlier, between January 12 and February 23, CMF rose while MicroStrategy’s stock price fell, with a few bounces above the zero line. This bullish divergence showed that institutional investors were quietly accumulating shares during weakness. That accumulation even translated into net positive flows at times, leading to sizeable rebounds.
It even helped fuel a 33% rebound between February 5 and February 25. However, the situation is different now. The CMF has flatlined, hugging the zero line. This shows institutional money is undecided at the moment.
What’s troubling is that the shift happened immediately after MicroStrategy announced its latest Bitcoin purchase on February 23. CMF suggests institutional investors may not be accumulating MicroStrategy stock despite its Bitcoin buying.
This disconnect weakens the bullish case and suggests confidence in the stock itself may be fading. The next direction the CMF line takes might decide the fate of the MSTR stock price.
At the same time, momentum indicators show that the recent drop (between February 25 and February 26) was not unexpected, as underlying strength had already been weakening.
Bearish Divergence Warned of MSTR Stock Price Drop
The Relative Strength Index (RSI), which measures momentum strength on a scale from 0 to 100, showed a bearish divergence before the recent drop.
Between December 9 and February 25, the MicroStrategy stock price formed a lower high, while RSI formed a higher high. This pattern signals weakening momentum because the price is rising without strong buying support.
This type of divergence often appears before major pullbacks. Similar divergences have appeared multiple times in recent months, and each one led to sharp corrections.
For example, a previous divergence completed in mid-Jan triggered a 45% crash, forming the major downtrend that still defines the stock’s broader structure.
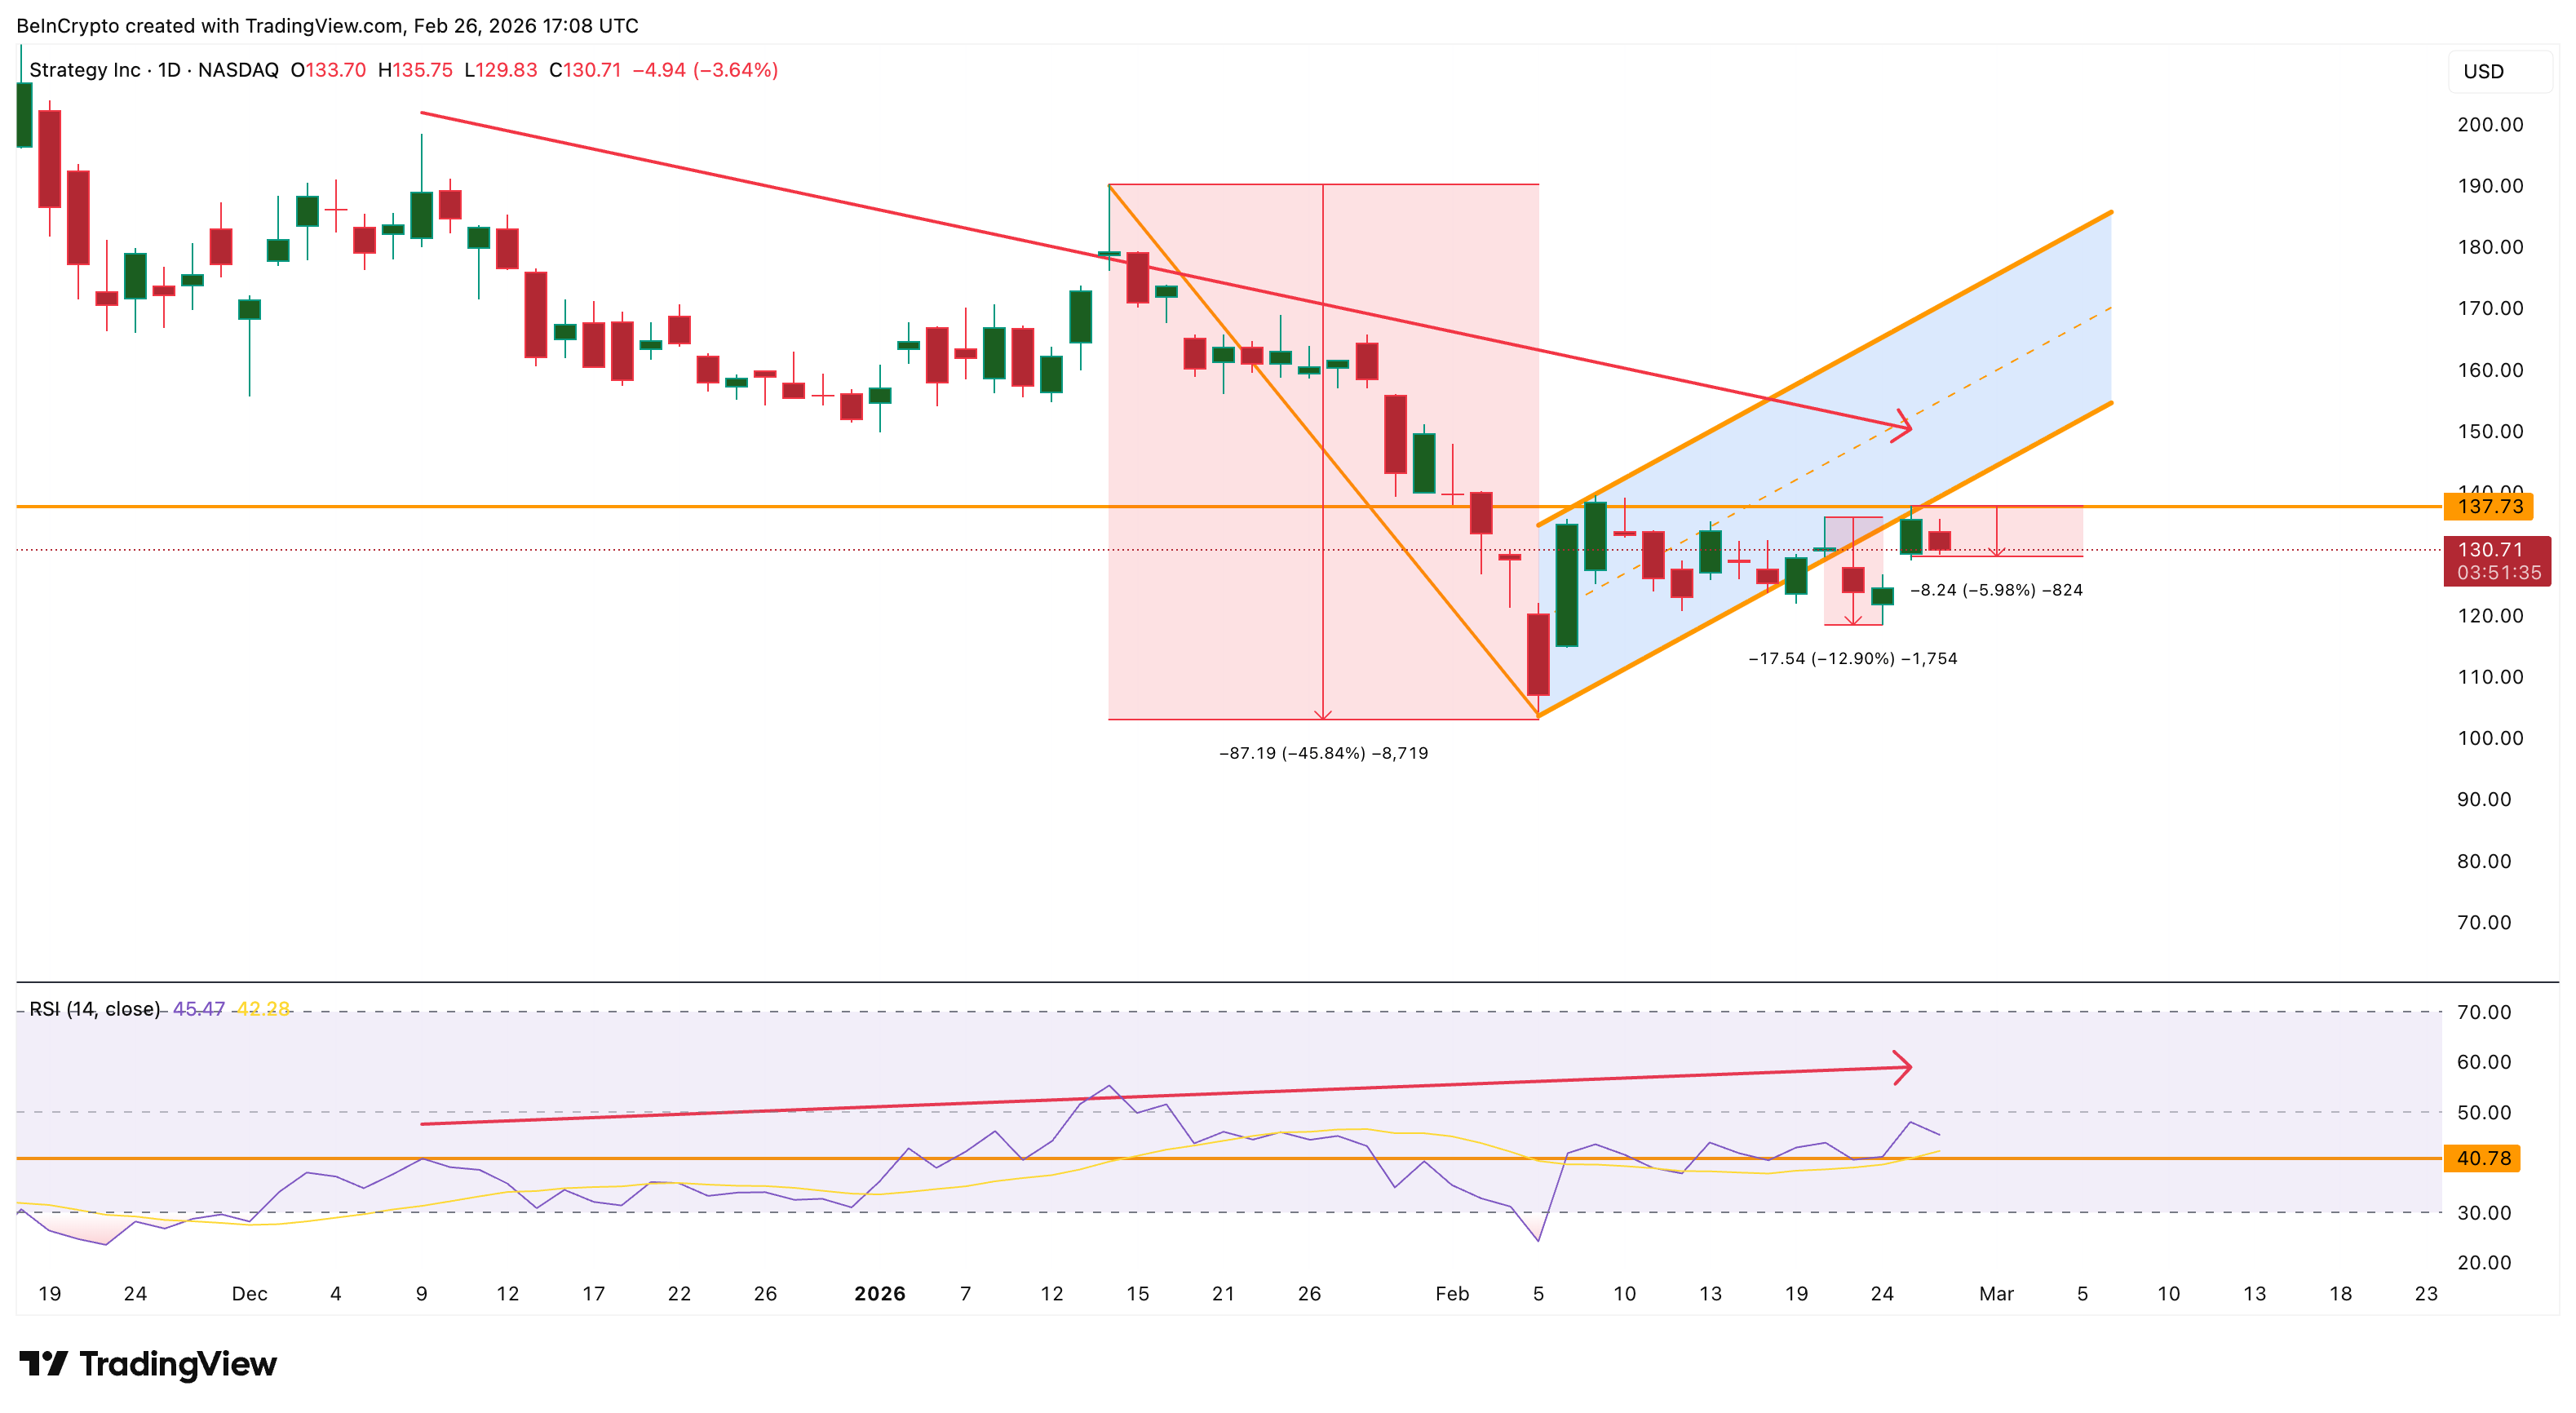
A recent one, concluding on February 20, led to a near 13% dip. The current one has already eaten into 6% of the gains, but because the broader bearish pattern remains active, this decline may be only the early stage of a larger move lower. That wouldn’t be great news for the MicroStrategy shareholders.
MicroStrategy Stock Price Breakdown Structure Points Toward $70
The MicroStrategy stock price has already broken below a bear flag pattern, which is a continuation pattern that forms during temporary rebounds inside larger downtrends. When this pattern breaks down, it usually leads to another strong leg lower.
Right now, the most important support level sits near $119. If this level fails, the next support appears near $106, followed by a stronger technical level near $85.
However, the full breakdown projection based on Fibonacci retracement levels points toward the $71 (the $70 zone) region, which aligns with the 0.786 Fibonacci level and pole’s projected 45%+ dip.
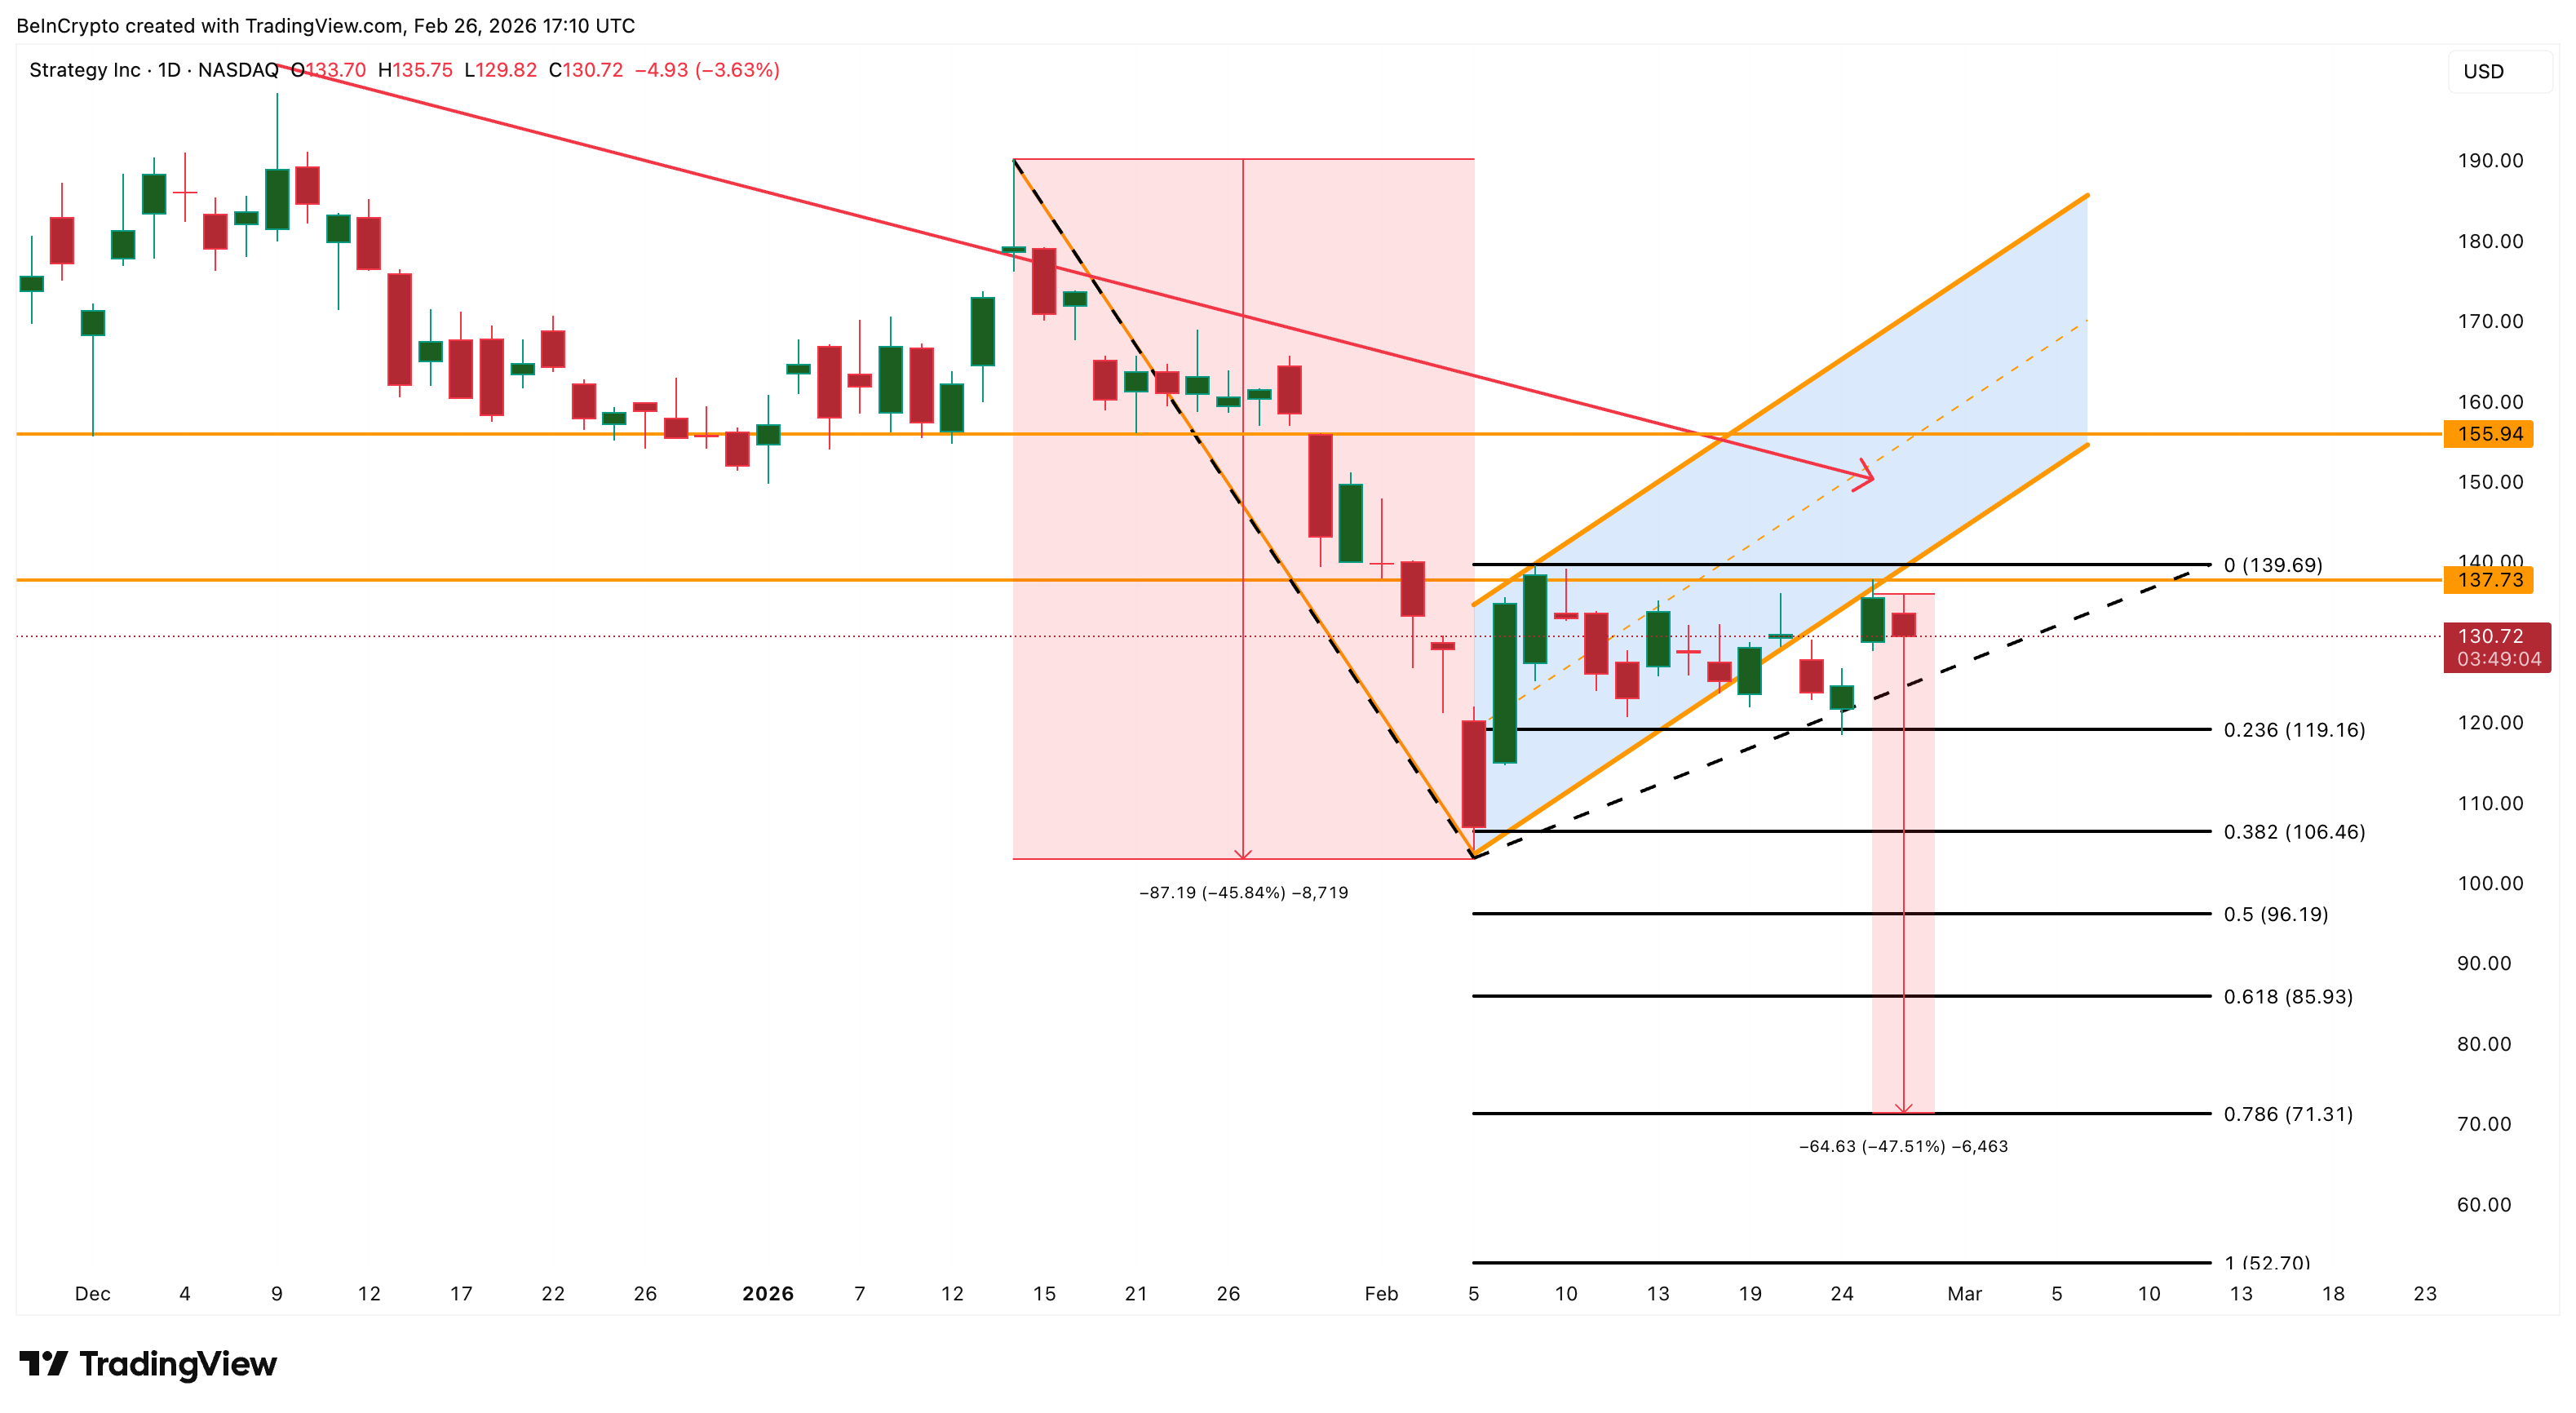
On the upside, the first sign of strength would only appear if MicroStrategy reclaims $139. However, the broader bearish structure would remain intact unless the stock breaks above $155, which would invalidate the breakdown pattern and signal a potential trend reversal.
Until those resistance levels are reclaimed, the current structure suggests MicroStrategy remains vulnerable to further downside, with the $70 zone now emerging as a realistic technical target if $85 gives way, given Bitcoin’s continued weakness.

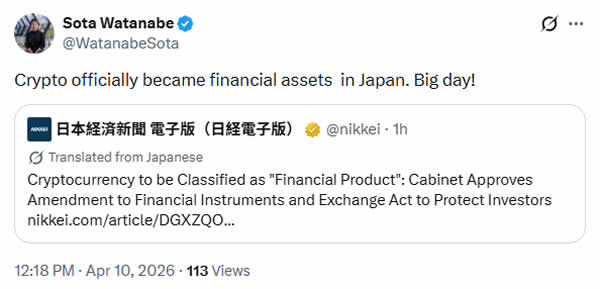
The Japanese government amended the Financial Instruments and Exchange Act on Friday to classify crypto assets as financial instruments.
The amendment also bans insider trading and other activities that involve buying and selling based on undisclosed information, Nikkei reported.
The amended act will also now require cryptocurrency “issuers” to be more transparent and disclose information once a year.
Japan’s Financial Services Agency has previously regulated crypto assets under the Payment and Settlement Act, citing their potential use as a means of payment. However, the regulations and classifications have been updated to reflect increasing institutional investment in the asset class.
By reclassifying crypto as a financial instrument rather than just a payment method, Japan is moving crypto out of the experimental payments category and into the same league as its stock market.

Crypto under the TradFi umbrella
“We will expand the supply of growth capital in response to changes in financial and capital markets, and ensure market fairness, transparency, and investor protection,” said Finance Minister Satsuki Katayama at a press conference after the Cabinet meeting.
Fines and sentences for unregistered crypto exchanges have also increased under the amendment.
Related: Prediction markets are testing legal limits in strict Asian markets
Japan signaled that it was bringing crypto under the same umbrella as traditional finance in January when Katayama said, “To ensure citizens benefit from digital and blockchain-based assets, the role of exchanges and market infrastructure will be essential.”
The government backed plans in December to significantly reduce Japan’s maximum tax rate on crypto profits, with a flat rate of 20% across the board.
Crypto ETFs coming to Japan
Japan is also planning to legalize crypto exchange-traded funds (ETFs) by 2028, marking a major shift toward mainstream crypto adoption, according to a January report.
Major financial groups, including Nomura Holdings and SBI Holdings, are among the first companies expected to develop crypto-linked exchange-traded products.
Asia Express: Phantom Bitcoin checks, China tracks tax on blockchain


A New York judge couldn’t decide yesterday whether or not to acquit Tornado Cash co-founder Roman Storm on conspiracy charges relating to his role in the creation of the non-custodial crypto mixer.
Storm was convicted last year of conspiracy to operate an unlicensed money transmitting business, however, a jury was unable to come to a decision on more serious conspiracy to launder money and conspiracy to evade US sanctions charges.
As such, the question of whether or not to acquit Storm fell to Judge Katherine Polk Failla.
“This is a lot,” she said after hearing arguments from both Storm’s defence and government prosecutors.
As reported by The Block, Storm’s defence argued that Tornado Cash is legal, and that his work to update and maintain his legal business used by ordinary people doesn’t make him guilty of abetting the criminal money launderers who also use it.
General Counsel of Solana Policy Institute, Patrick Wilson, called this expansive claim “alarming,” and noted that, “Once criminals use a noncustodial tool at sufficient (though unspecified) scale, even otherwise lawful activity can be recast as illegitimate.”
Government prosecutors argued, however, that his work means he not only helped but profited from money launderering. One prosecutor caused a brief stir in the courtroom after implying that anyone whose funds were mixed with criminal funds via Tornado Cash may also be liable.
The CEO of the DeFi Education Fund, Amanda Tuminelli, attended the hearing and claimed that the government “still does not understand the tech at issue.”
Read more: Ethereum dev arrested in Turkey ups Roman Storm donation to $500K
“The lack of nuance, the misrepresentations about how a UI functions, and the equivocation between different technologies is really disheartening at this point in the case,” she said.
“It was good to see the judge digging in and asking detailed questions, but there is no way to predict how she will rule on Storm’s motion. Given that she was focused on dates for retrial at end of 2026, I think we can expect to see the case continue,” Tuminelli added.
The Rage reports that the topic of the First Amendment was barely touched upon, as well as the subject of unlicensed money transmission. The choice of New York as the venue was debated, however.
The prosecution claimed that the location of a Tornado Cash hacker, investors, and an attorney acting on behalf of a hacked crypto exchange, are all based in New York. Storm’s defence hit back, claiming that the investor’s funding was irrelevant and that the hacker didn’t use Tornado Cash for illegal purposes.
Prosecutors further claimed that an Ethereum cloud service used by Tornado Cash, which used a Manhattan bank, also constituted a New York venue.
Storm’s defence argued, however, that the payments to this cloud service cannot constitute an act aiding criminal conspiracy.
Roman Storm faces an October retrial
After last year’s trial, Storm filed for a pre-trial motion under Criminal Rule 29 that would acquit him on all counts.
His defence argues that the prosecution’s evidence wasn’t legally sufficient, and claims that, if his acquittal isn’t granted, the government “would criminalize the publication of decentralized software in violation of the first amendment.”
Read more: Roman Storm says he’s been ‘financially cancelled’ after payroll firm axe
Government prosecutors have requested that a retrial be scheduled for October so that the two remaining charges can be decided upon.
Storm currently remains free on a $2 million bail.
Got a tip? Send us an email securely via Protos Leaks. For more informed news and investigations, follow us on X, Bluesky, and Google News, or subscribe to our YouTube channel.

Quick Summary
- Tesla’s Q1 2026 electric vehicle deliveries reached 358,023 units, falling below analyst projections of 370,000.
- Shares have declined 23% in 2026 and are approaching their eighth consecutive weekly decline.
- The automaker manufactured 408,300 vehicles while delivering only 358,023, resulting in an unprecedented inventory surplus.
- Derivative trading patterns that historically bolstered share prices have weakened throughout 2026.
- Wall Street forecasts Tesla will experience negative free cash flow exceeding $6 billion during the current year.
Tesla’s first quarter 2026 delivery figures came in below expectations, accompanied by a concerning accumulation of unsold vehicles.
The electric vehicle manufacturer reported deliveries of 358,023 units during the opening quarter, undershooting analyst consensus of 370,000. While this represents a nominal 6% increase compared to the first quarter of 2025, that baseline itself reflected a 13% year-over-year decline, making the comparison less meaningful.
Tesla manufactured 408,300 vehicles during the three-month period while delivering 358,023 units. This differential of approximately 50,000 vehicles marks the company’s largest ever accumulation of unsold inventory.
JPMorgan analyst Ryan Brinkman highlighted the inventory accumulation as a significant drain on free cash flow, noting that undelivered vehicles consume capital until they reach customers.
Cash Flow Challenges Mount
The situation is complicated by timing factors. Tesla increased its capital expenditure forecast to $20 billion for 2026, a substantial jump from $8.5 billion spent in 2025. The majority of this investment targets artificial intelligence infrastructure and humanoid robotics manufacturing.
Wall Street analysts compiled by Visible Alpha project Tesla will generate negative free cash flow surpassing $6 billion in the current year, followed by additional negative cash flow exceeding $1.2 billion in 2027.
William Blair analyst Jed Dorsheimer noted “global EV demand ex-China remains under pressure,” suggesting that Tesla is “actively sacrificing its EV business in favor of a fully autonomous future.”
Market headwinds extend beyond Tesla. Intensifying competition, tariff policies from the Trump administration, and the elimination of the $7,500 federal electric vehicle tax credit have dampened demand throughout the sector.
The Model 3 and Model Y accounted for 97% of total Q1 deliveries, underscoring the company’s continued dependence on these two product lines.
Derivative Market Activity Weakens
Beyond fundamental factors, technical market dynamics have shifted. GLJ Research analyst Gordon Johnson has monitored options market activity surrounding Tesla and observed that retail investors have reduced aggressive call option purchasing in 2026.
Historically, substantial call buying compelled market makers to hedge positions by acquiring shares. This purchasing activity generated what market participants term a “gamma squeeze,” creating a self-reinforcing cycle that elevated share prices independent of underlying business performance.
Johnson contends this technical support mechanism has diminished, exposing the stock more directly to fundamental performance. He maintains a Sell rating with a $25.28 price target—significantly below consensus estimates and representing a contrarian position.
Nevertheless, his analysis of options market dynamics provides relevant insight into technical influences.
Entering Friday’s session, Tesla traded at $344.82 during premarket hours, declining approximately 0.2%. The stock currently trades at roughly 170 times projected 2026 earnings.
Full-year 2025 deliveries totaled 1.64 million units, down from 1.79 million in 2024.


Bittensor subnet developer Covenant AI said Friday that it is leaving the decentralized artificial intelligence network, accusing Bittensor of operating under a concentrated governance structure that undermines its decentralization claims.
In a Friday post on X, Covenant AI founder Sam Dare said the team could no longer build on or raise for Bittensor because its governance was not meaningfully distributed.
“It is decentralization theatre,” Dare said. “Jacob Steeves maintains effective control over the triumvirate, resists any meaningful transfer of authority, and deploys changes unilaterally whenever he chooses, without process and without consensus.”
The dispute cuts to the core of Bittensor’s decentralization pitch. Covenant AI alleged that founder Jacob Steeves, known as Const, exerts outsized influence over governance and network operations, an accusation Steeves denied.
Bittensor’s governance documents describe a transitional system in which a “Triumvirate” of Opentensor Foundation employees holds root permissions alongside a senate, rather than a fully open governance model.

Covenant AI claims subnet emissions were suspended, Bittensor founder denies allegations
Covenant AI said Steeves had taken several actions against the project in recent weeks, including suspending emissions to its subnet, restricting moderation powers in community channels and applying “direct economic pressure” through visible token sales during the dispute.
Steeves rejected the allegations, claiming that he cannot suspend subnet emissions and that he does not hold “any privilege beyond what normal TAO holders have.”
In a Friday X response, Steeves said he sold some of his “alpha holdings on his three subnets because they were not running and were on near 100% burn code,” which changed the emissions the same way “all buys and sells on Bittensor do.”

Steeves also denied stripping Covenant AI of its moderation rights, saying he only temporarily removed the team’s ability to delete posts before restoring it. He added that large token sales would have been visible onchain.
“Less than 1% of what i had invested in his teams. Visibility is impossible to avoid in my position. I reserve my right to buy and sell tokens which is what underpins the entire system of dTao,” he added.
Bittensor previously garnered mainstream attention after Nvidia CEO Jensen Huang praised the decentralized training run on Bittensor Subnet 3, calling Covenant’s milestone of pre-training the largest decentralized LLM a “remarkable technical achievement,” during the All-In Podcast on March 19.
Related: Bittensor’s TAO price may plunge 40% within five weeks: Fractal data
TAO’s sales volume skyrockets ahead of Covenant AI’s departure announcement
The governance dispute also weighed on Bittensor’s (TAO) token, which was down around 18% over the previous 24 hours as of Friday morning, according to market data.

However, sell volume on TAO rose to its highest level since December 2024, about 24 hours before Covenant AI announced its departure. “If you think that’s a coincidence, you don’t understand the game you’re playing. This was a calculated exit and execution,” wrote crypto analyst Ardi in a Friday X post.
Cointelegraph reached out to Covenant AI and Bittensor for comment but had not received a response by publication.

The dispute raises wider concerns for projects striving for decentralization, according to David and Daniil Liberman, co-creators of the decentralized layer-1 blockchain Gonka protocol.
“Decentralized networks that want serious builders have to answer one question: can the infrastructure you build on be used against you? If the answer is yes, the decentralization is cosmetic,” they told Cointelegraph.
Magazine: Michael Heinrich loves AI coins Goat, Turbo & Aethir… but not TAO


- Toncoin whales have accumulated over 189,700 TON in three months.
- Heavy accumulation comes as TON activates the Catchain 2.0 upgrade.
- TON price rose to intraday highs of $1.32, could eye $1.89-$2.40 next.
Toncoin (TON), the cryptocurrency token of the Telegram-supported TON Blockchain, is trading higher on the day amid signs of renewed investor interest.
On Friday, the Toncoin price hovered at $1.30 as large holders, or “whales,” scooped up more tokens. The accumulation comes amid a tentative broader market recovery.
Toncoin price tests $1.30 zone amid whale accumulation
Toncoin’s price has climbed 4% in the past 24 hours, hovering near the critical $1.30 resistance zone.
The token reached an intraday high of $1.32 during the Asian trading session.
Buyers helped push trading volume up, with the metric spiking 104% as of writing to $160 million, marking a 45% increase from the previous day’s average.
This uptick arrives as Bitcoin holds above $71,000 amid bets on a new leg to $80,000.
Notably, TON’s momentum aligns with this backdrop, particularly as the network’s 100 largest whale addresses have collectively scooped up an additional 189,730 $TON over the past three months.
This accumulation persists despite broader market headwinds.
Analysts at Santiment highlighted what’s likely bullish in a post:
“Even with the #29-ranked coin in crypto losing two-thirds of its market cap since its local top in early August 2025, this heavy accumulation is a promising sign that a relief rally may come quickly once crypto markets finally turn the page from this bear cycle.”
Whale activity often points to fresh confidence in a project, and the aggressive buying shows interest in Toncoin’s underlying ecosystem.
The token is tied to the Telegram-integrated TON blockchain, which continues to expand through decentralized applications and mini-apps.
TON price is looking to bounce higher as the community cheers the Catchain, an upgrade designed to boost network throughput and block processing capacity.
In a post on X, Telegram CEO Pavel Durov commented on how bullish this upgrade is for Toncoin, noting that it marks the first step in a 7-stage Make TON Great Again (MTONGA) vision.
The TON blockchain just got upgraded and is now 10× faster.
Block rate increased 6×.
Transactions are now instant, subsecond.
This was step 1 of 7 to Make TON Great Again (MTONGA).
Next step: cut the already low transaction fees by 6×.
— Pavel Durov (@durov) April 9, 2026
What’s next for Toncoin price?
Such large-scale buying often precedes price reversals, as these investors position for potential rebounds.
Toncoin’s technical picture indicates that the price remains entrenched in a downtrend that began in June 2025, when it peaked above $8.20.
Persistent selling has resulted in a 84% decline in its value.

Bulls are not out of the woods yet, but a decisive break above $1.35 could ignite fresh upside momentum.
In this case, a potential target in a fresh rally would be the next resistance cluster around $1.89-$2.00. Significant supply pressure could follow at $2.40, an area of prior profit-taking deals.
Conversely, if sellers regain control, primary support levels beckon at $1.15.
A drop below $1.00 could accelerate selling toward $0.85, the multi-month low.

Key takeaways
-
Impersonation scams can be low-tech yet highly effective, using fake websites that closely mimic trusted cryptocurrency platforms to deceive users.
-
The CoinDCX case shows how a 7.16 million rupee fraud complaint escalated into legal action before it was identified as an impersonation case.
-
The fake domain coindcx.pro, not the real platform, was used to mislead the victim and carry out the fraud.
-
Scammers built a complete fake ecosystem using websites, Telegram channels and social media to create credibility.
While coverage of the cryptocurrency industry often focuses on market volatility, smart contract vulnerabilities and shifting government policies, some serious threats are remarkably low-tech. Deception often wears a familiar face. A fraudulent website that perfectly mirrors a legitimate exchange can cause both financial and reputational damage.
The CoinDCX impersonation incident is a stark case study of this pattern. What began as a 7.16 million rupee ($77,000) fraud complaint eventually escalated into police proceedings against the exchange’s leadership. However, the court’s intervention ultimately shifted the blame away from the actual platform, revealing that the culprit was a sophisticated digital facade operated by scammers.
A fake CoinDCX, but a real complaint
The case originated from a complaint filed by a 42-year-old insurance consultant based in Mumbra, a suburb in the Thane district within the Mumbai metropolitan region. The complainant alleged that he had been defrauded of about 7.16 million rupees. During the scam, he believed he was dealing with CoinDCX, which was presenting investment opportunities to him.
The offer allegedly included assurances of 10% to 12% monthly returns and references to a crypto franchise-style model linked to the platform. These elements, namely the promise of high returns and the apparent legitimacy of the brand, formed the core of the alleged fraud.
What sets this case apart is what happened next. Instead of being identified as an impersonation scam, the complaint escalated into legal action that led to the arrest of the company’s co-founders, Sumit Gupta and Neeraj Khandelwal.

The role of coindcx.pro in this case
Central to the incident was a counterfeit website, coindcx.pro, which the victim interacted with instead of the real CoinDCX website, coindcx.com.
Such fake domains are a common method in impersonation scams. They appear visually similar, seem trustworthy and deliberately exploit the brand’s established credibility.
According to statements issued by CoinDCX, no money connected to this matter was processed through its exchange systems. The scam did not originate within the platform itself. Instead, external actors allegedly used its name and reputation as bait.
Did you know? Domain impersonation scams often use subtle tricks, such as replacing letters, for example “o” with “0,” or adding extra words, to make fake websites nearly indistinguishable from real ones at a glance.
How the fraudsters built a fake ecosystem
The impersonation reportedly extended well beyond a single domain. The scammers also built supporting infrastructure, such as Telegram channels and social media accounts, to reinforce the illusion of legitimacy. This reflects a broader trend in crypto scams today, where perpetrators no longer rely on a single deceptive element but instead build an entire parallel ecosystem.
For the victim, this setup created a seamless and consistent experience: a website, an associated community and representatives, all seemingly connected to a recognized brand.
How the case escalated
The complaint was filed at the Mumbra police station in Thane on March 16, 2026. As the investigation progressed, CoinDCX’s co-founders were taken into custody in Bengaluru.
This turn of events highlights a key complexity in impersonation cases. When victims mention a prominent company in a complaint, it can take time to distinguish genuine involvement from misuse of the brand name. In fast-moving investigations, this lack of clarity can sometimes lead to action against legitimate companies before all the facts are established.
The case reached a critical stage when it came before a Thane magistrate court. The court granted bail to CoinDCX’s co-founders and noted that no prima facie case had been established against them. It observed that the complainant had been deceived by individuals impersonating the company’s promoters, not by the company itself. The victim also admitted having had no interaction with the company’s co-founders.
Did you know? Cybercriminals often buy expired or similar-looking domains in bulk, enabling them to launch multiple fake versions of a popular crypto platform within hours once a scam template proves effective.
A wider pattern of fake domains
The CoinDCX case is not an isolated incident.
According to the company, it reported more than 1,200 fake websites impersonating its platform between April 2024 and January 2026. This suggests that, for fraudsters, impersonation is not a sporadic tactic but a scalable strategy.
CoinDCX also stated that the first information report (FIR) filed against its co-founders was false.

Creating a domain that closely mimics a well-known platform is relatively inexpensive. When combined with messaging apps and social media, it allows fraud networks to recreate an appearance of trust at scale.
Why high monthly returns remain a key trigger
A central feature of the alleged scam was the promise of 10% to 12% monthly returns.
Such claims are a common element in financial fraud. In the cryptocurrency space, they are often paired with urgency, exclusivity or an association with a recognized platform.
From a behavioral perspective, these promises serve two key roles:
In many cases, the perceived legitimacy of the brand helps overcome doubts that might otherwise arise from the unusually high returns.
Did you know? Many impersonation scams reuse the same scripts and layouts across different brands, allowing a fake site built for one exchange to be repurposed for another within days.
Legal and reputational fallout of the CoinDCX incident
Although the court found no case against CoinDCX’s co-founders, the incident highlights the wider consequences of impersonation scams.
For companies and their executives, such events can result in:
For users of any exchange, seeing it associated with negative news can be unsettling. Those who have invested through the platform may fear financial loss. Even when a recovery process exists, few would want to become involved in a difficult and often lengthy procedure.
The case also raises important questions about how law enforcement handles digital impersonation, where identities can be replicated far more quickly than they can be verified.
CoinDCX’s response
In the aftermath of the incident, CoinDCX announced a 100 crore rupee ($10.76 million) initiative called the Digital Suraksha Network (DSN), focused on fraud prevention and user awareness.
The reported measures include:
-
An AI-driven WhatsApp helpline
-
APIs for sharing fraud-related data
-
Collaboration with law enforcement for training and improved response
While these steps cannot completely eliminate the risk of impersonation, they reflect a move toward more proactive defense and stronger coordination across the ecosystem.
What users should take away
The CoinDCX impersonation case offers several practical lessons:
-
Verify domains carefully. Even minor variations can indicate a fraudulent site.
-
Be cautious of promises of fixed or unusually high monthly returns.
-
Treat Telegram groups and social media handles as unverified unless they are officially confirmed.
-
Ensure that all transactions are conducted only through official platforms.
In many cases, the difference between a legitimate service and a scam is not advanced technology but careful verification.
Crypto World
ServiceNow (NOW) Stock Plunges Nearly 8% Amid Geopolitical Chaos and AI Disruption Concerns

Key Takeaways
- ServiceNow (NOW) shares plummeted approximately 7.86% on Friday, April 10, 2026, settling near $89.81.
- Renewed Middle East conflict following a ceasefire breakdown sparked widespread market anxiety and contributed to the decline.
- Anthropic unveiled Managed Agents, fully autonomous AI tools capable of handling complex workflows, sparking concerns over traditional SaaS model obsolescence.
- Famed short seller Michael Burry briefly posted (then removed) commentary suggesting Anthropic poses a competitive threat to Palantir, amplifying SaaS sector concerns.
- Year-to-date, NOW has declined 38.3% and currently trades 56% beneath its 52-week peak of approximately $211.
ServiceNow (NOW) faced a brutal trading session Friday, with shares collapsing nearly 8% to close around $89.81 as twin headwinds slammed the enterprise software provider in an already shaky market environment.
SaaS investors endured a particularly punishing day across the board.
The initial pressure originated from geopolitical developments. News emerged of a ceasefire violation in the Middle East, sparking renewed investor anxiety and triggering broad risk-off sentiment. This stood in stark contrast to the situation just ten days prior, when NOW had rallied 6.2% following President Trump’s comments about constructive diplomatic engagement with Iran. Friday’s session wiped away most of those gains.
The second blow struck more directly at ServiceNow’s core business model. Anthropic rolled out Managed Agents, a new class of autonomous artificial intelligence systems designed to execute sophisticated, multi-stage workflows independently. Market participants viewed this development as potentially disruptive to conventional SaaS platforms that rely on human operators to manage business processes.
Burry’s Brief Commentary Intensifies Selling Pressure
Michael Burry, the prominent investor famous for prescient contrarian positions, briefly published and subsequently removed a social media statement asserting that Anthropic was “eating Palantir’s lunch.” Though fleeting, the remark highlighted growing investor concerns about established SaaS companies’ exposure to emerging AI-native competitors and added momentum to Friday’s downturn.
While Burry’s quickly-deleted commentary offered no new hard data about ServiceNow’s operations, it resonated in an already nervous trading environment.
NOW shares have now surrendered 38.3% of their value year-to-date. Trading at $89.81, the stock languishes more than 56% below its 52-week high of $211.48 achieved in mid-2025. An investor who purchased $1,000 of NOW stock five years ago would currently hold approximately $858 in value.
The stock has experienced 11 single-day moves exceeding 5% over the past twelve months, indicating Friday’s sharp decline, while severe, fits within recent volatility patterns.
Fundamental Performance Remains Robust
Despite the stock’s punishing performance this year, ServiceNow’s core business metrics continue showing strength. The company reported full-year 2025 revenue of $13.3 billion, representing 21% growth versus the prior year. Subscription revenue, which provides stable recurring cash flows, contributed $12.9 billion to that figure.
ServiceNow closed 2025 with $28.2 billion in remaining performance obligations—a forward-looking indicator of committed future revenue—reflecting 27% year-over-year expansion.
The company has also taken proactive steps to counter the AI competitive threat. ServiceNow has established partnerships with both Anthropic and OpenAI, and earlier this year completed the acquisition of Moveworks, an AI agent technology provider serving major enterprises including Toyota and Unilever. That acquisition’s technology has been integrated into Autonomous Workforce, a product introduced in February that ServiceNow claims can autonomously handle 90% of routine IT support requests.
Shares last changed hands at $89.81, having touched a session low of $88.66.
Update April 10, 2026, 10 am UTC: This article has been updated to add more details from the announcement.
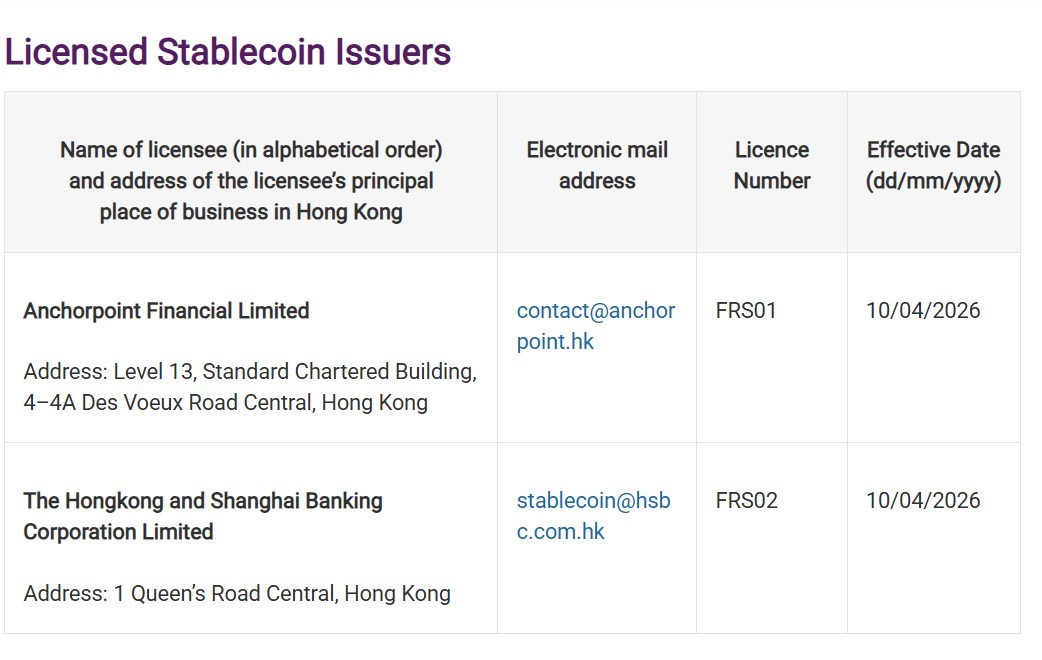
Hong Kong has issued its first stablecoin issuer licenses, approving Anchorpoint Financial and the Hongkong and Shanghai Banking Corporation under a new regulatory framework overseen by the Hong Kong Monetary Authority (HKMA).
The HKMA announced the initial batch of licensees on Friday, marking the first approvals under its stablecoin regime.
Anchorpoint Financial is the stablecoin joint venture formed by Standard Chartered Bank (Hong Kong), Animoca Brands and Hong Kong Telecommunications. The Hongkong and Shanghai Banking Corporation Limited is HSBC’s Hong Kong-based banking entity and one of the city’s three note-issuing banks.
The first approvals highlight Hong Kong’s cautious approach, with regulators appearing to favor bank-linked and institution-backed issuers in the regime’s opening phase.
The announcement comes after weeks of unconfirmed reports about potential licensees and a missed March timeline, marking a cautious start to Hong Kong’s stablecoin licensing rollout. HKMA Chief Executive Eddie Yue said in February that a very small number of issuers would be licensed in March, a timetable the HKMA ultimately missed before granting the first approvals.
Hong Kong’s stablecoin regime took effect on Aug. 1, 2025, and requires issuers of fiat-referenced stablecoins to obtain an HKMA licence and meet rules covering reserve backing, redemption, governance and Anti-Money Laundering controls.

Hong Kong rolls out stablecoin regime after delays
The stablecoin regime also gives the HKMA power to investigate violations and take enforcement action, including fines, suspensions and license revocations.
Yue said the new regime gives stablecoin issuers a regulated framework to operate in Hong Kong while requiring safeguards around user protection and risk management.
The licensed issuers are expected to launch their operations in the coming months, according to the HKMA.
Related: Hong Kong, Shanghai authorities to test blockchain for cargo trade data
On April 1, the HKMA said it was actively advancing the licensing process after missing its earlier March timeline.
Earlier media reports also pointed to possible frontrunners. On March 13, HSBC and a Standard Chartered-backed venture were tipped as likely recipients, but the regulator had not confirmed any names at the time.
Cointelegraph reached out to the HKMA for more information, but had not received a response by publication.
Magazine: Asia Express: Phantom Bitcoin checks, China tracks tax on blockchain
BEIJING — China’s ties with countries such as Iran and Russia have raised expectations of a bigger diplomatic role, but Beijing remains focused on protecting its own domestic interests, including global exports.
That stance underpins Beijing’s circumspect acknowledgment of reports that it pushed Iran toward this week’s temporary ceasefire. A New York Times report cited three Iranian officials as saying China played a role, while AFP cited U.S. President Donald Trump.
China has made “active efforts” to end the conflict, Foreign Ministry Spokesperson Mao Ning said Wednesday, when asked by the press about the reports. She emphasized that Foreign Minister Wang Yi had made 26 phone calls to representatives of countries including Russia, Saudi Arabia, Germany and Iran since the U.S.-Israel strikes on Iran began on Feb. 28.
But Beijing stopped short of confirming direct mediation.
China called for an “immediate stop” to military operations after U.S.-Israel strikes against Iran in late February. When asked on March 3 about Iran’s counterattacks, China’s Foreign Ministry did not mention Tehran specifically, urging instead for “all parties” to prevent the conflict from spreading.
“What Beijing did is not really about direct intermediation,” said Zongyuan Zoe Liu, a senior fellow for China studies at the Council on Foreign Relations.
“What Beijing did is, more precisely, broker[ed], facilitated the ceasefire,” she said Friday on CNBC’s “The China Connection. “From that perspective there’s nothing [that has] changed with regards to Beijing’s foreign policy. It does not mean Beijing is becoming more active.”
Instead, she noted Beijing is concerned about the risk of a global downturn from the war that would hurt its export-oriented economy.
Net exports contributed to about one-third of China’s GDP last year, despite heightened U.S. tariffs, leaving its economy exposed to disruptions in global trade.
IMF Managing Director Kristalina Georgieva warned Thursday that global growth would slow even if the ceasefire holds, citing lingering uncertainty around the Strait of Hormuz.

The strait handles about one-fifth of global oil supply, connecting the Persian Gulf on the coast of Saudi Arabia with the rest of the world. While China is the primary buyer of Iranian oil and relies on the waterway for just under half of its seaborne oil imports, that represents just 6.6% of China’s total energy consumption.
Still, China faces “immense pressure due to rapidly rising energy costs, and hopes the Strait of Hormuz will be reopened soon,” said Hai Zhao, a director of international political studies at the Chinese Academy of Social Sciences, a state-affiliated think tank.
As of January, Beijing held enough crude stockpiles to meet demand for three to four months, according to estimates. Data show that Iran has been sending oil through the strait to China since the war began.
However, gasoline prices in China jumped 11% in March from the prior month, and authorities have raised the official domestic gasoline prices twice in six weeks, by a total of 1,580 yuan per metric ton, or about 60 cents per U.S. gallon. The average price in the U.S. has gone up by more than $1 per gallon during that time.
Higher energy costs are also squeezing factory margins, adding to price pressures across China’s manufacturing sector.
Globally traded Brent crude futures remained below $100 a barrel on Friday, despite limited signs of a recovery in shipping through the Strait of Hormuz. Recent Iran attacks on a crucial Saudi pipeline have also slashed the kingdom’s oil output, Saudi Arabia’s state news agency said Thursday.
The backdrop
China’s diplomatic positioning builds on its role in restoring diplomatic ties between Iran and Saudi Arabia three years ago, ending three decades of animosity. The move was notable given U.S. interests in the Middle East, while elevating China’s profile in the region.
That history means Beijing can play the role of mediator once both sides are willing to reduce conflict, Zhao said.
But he noted that China lacks the capability or inclination to pressure either side into negotiating. Instead, China’s support gives Pakistan’s mediation efforts more heft, he said.
Pakistan, which shares borders with China and Iran, is set to host Iranian and U.S. leaders in Islamabad this weekend for ceasefire talks. The extent of Beijing’s involvement with the summit remains unclear.
Subscribe now
“We support the mediation efforts by countries including Pakistan,” Chinese Foreign Ministry Spokesperson Mao said this week. She noted Beijing has called on all parties to end hostilities as soon as possible, for regional peace. “China has made active effort to this end.”
In late March, China and Pakistan published a plan for “restoring peace and stability” in the Middle East, including a ceasefire, peace talks and the restoration of normal passage of ships through the Strait of Hormuz.
Pakistan abstained from voting on a UN Security Council resolution this week that would have encouraged countries to coordinate their defensive efforts in order to reopen the strait. Veto-wielding Security Council members China and Russia objected and planned to issue an alternative resolution.
Iran has made clear that ships must obtain its permission to pass through the strait, Sultan Ahmed Al Jaber, CEO of Abu Dhabi National Oil Co., said Thursday in a social media post. “The Strait of Hormuz is not open. Access is being restricted, conditioned and controlled.”
Before the war, Iran had occasionally harassed, attacked or seized vessels transiting the strait as tensions with the U.S. escalated.
“China welcomes any chance to present itself as a constructive, responsible power while the Trump administration is seen as the source of the instability,” CFR’s Liu said.
But she warned that the broader geopolitical dynamics remain unchanged.
“The underlying structural tension between Beijing’s dependence on a rules-based global order and Washington’s growing willingness to disrupt that order remains entirely unresolved,” she said.
“That is the story worth tracking beyond the immediate ceasefire.”
— CNBC’s Asriel Chua contributed to this report.


Japan’s cabinet has approved a draft amendment that would classify cryptocurrencies as financial products, marking a shift in how the country regulates the sector.
The proposal brings crypto assets under the Financial Instruments and Exchange Act, a framework used for stocks and other securities, Nikkei reported. If passed during the current parliament session, the law could take effect as early as fiscal 2027.
Until now, Japan has treated crypto mainly as a payment tool under the Payment Services Act. That approach focused on custody, anti-money laundering checks and exchange registration. The new rules would ban insider trading and require issuers to publish annual disclosures.
Penalties would also rise. Operating without registration could bring up to 10 years in prison, up from three, and fines could increase to 10 million yen ($62,800). The Securities and Exchange Surveillance Commission would gain broader authority to police the market.
In a press conference, Minister for Financial Services Satsuki Katayama said the move will “expand the supply of growth capital in response to changes in the financial and capital markets, ensuring market fairness, transparency, and the protection of investors.”

Japan regulates crypto assets as financial instruments

Too many women are being remanded into custody
Grand National Free Bets & Betting Offers 2026


-

 Fashion7 days ago
Weekend Open Thread: Spanx – Corporette.com
-

 Business4 days ago
Three Gulf funds agree to back Paramount’s $81 billion takeover of Warner, WSJ reports
-

 Sports6 days ago
India men’s 4x400m and mixed 4x100m relay teams register big progress | Other Sports News
-

 Business6 days ago
Expert Picks for Every Need
-

 Tech3 days ago
How Long Can You Drive With Expired Registration? What Florida Law Says
-

 Business5 days ago
No Jackpot Winner, Prize to Climb to $231 Million
-

 Fashion4 days ago
Massimo Dutti Offers Inspiration for Your Summer Mood Board
-

 Fashion3 days ago
Let’s Discuss: DEI in 2026
-
Politics7 days ago
Wings Over Scotland | The quality of mercy
-

 Crypto World2 days ago
Bitcoin recovers as US and Iran Agree a Ceasefire Deal
-

 Business5 days ago
Akebia Therapeutics, Inc. (AKBA) Discusses Pipeline Progress and Strategic Focus on Kidney Disease Treatments at R&D Day – Slideshow
-

 Crypto World23 hours ago
Canary Capital Files SEC Registration for PEPE ETF
-

 Fashion7 days ago
Frugal Friday’s Workwear Report: Hammered Metallic Button Sweater Vest
-

 Politics6 days ago
The UK should not pay a penny in slavery reparations
-

 Tech4 days ago
Samsung just gave up on its own Messages app
-

 Tech4 days ago
Haier is betting big that your next TV purchase will be one of these
-

 Fashion7 days ago
Tory Burch’s Spring 2026 Campaign Goes on a Getaway
-

 Fashion7 days ago
Weekly News Update, 4.3.26 – Corporette.com
-

 NewsBeat7 days ago
Kemi Badenoch talks ‘spring cleaning’ Reform defections
-

 Tech4 days ago
Gamer Restores the Original PlayStation Portal From Two Decades Ago
You must be logged in to post a comment Login