
CryptoCurrency
Will the Fed Crash Bitcoin (BTC) or Spark a $100K Rally?

Bitcoin (BTC) is holding shakily above $90,000 as traders assess the next move ahead of the US Federal Reserve’s final meeting of the year. Some market participants are watching for a possible year-end rally, while others see signs of weakness.
Key Resistance in Focus
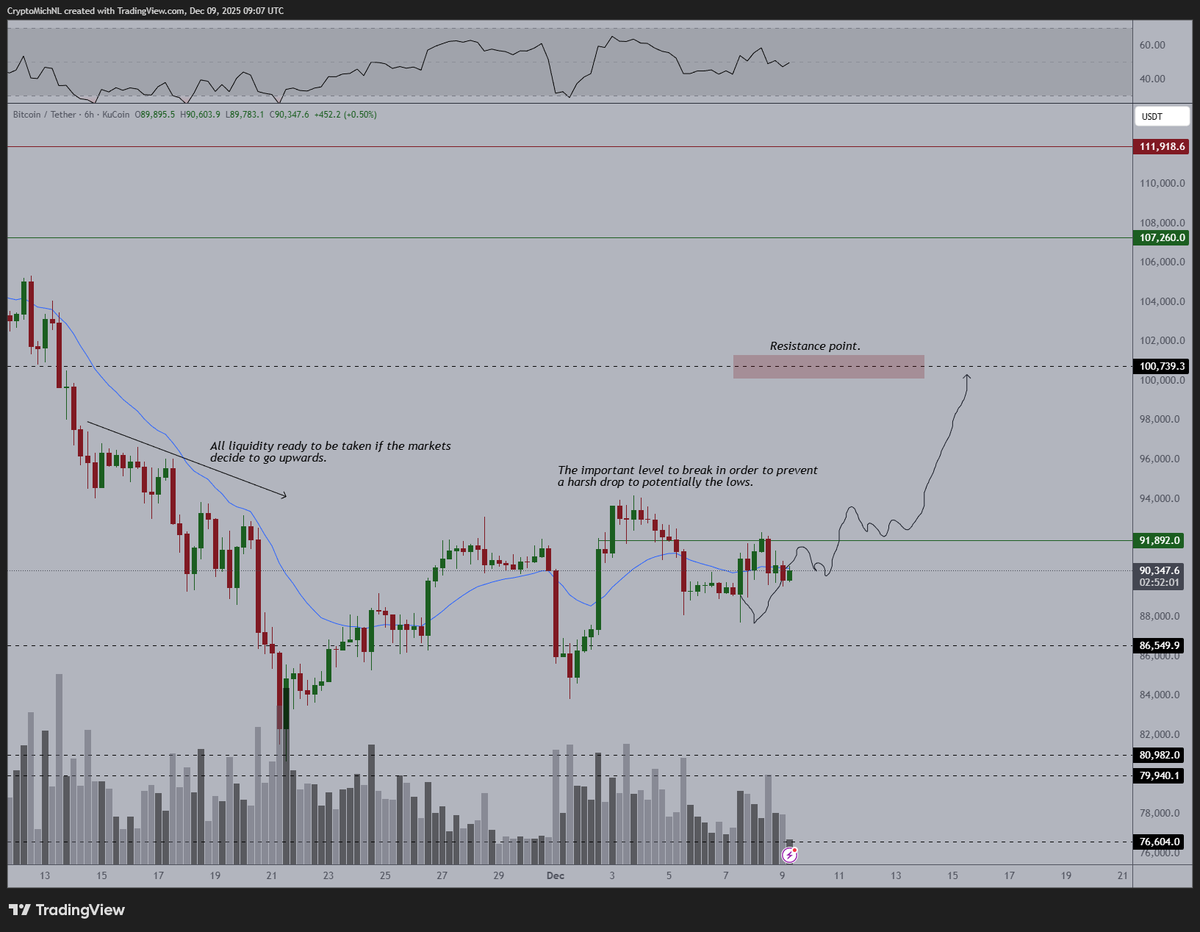
Crypto analyst Michaël van de Poppe says Bitcoin is still trading along a bullish path. He pointed to $91,892 as a level that needs to be cleared to maintain upward momentum. If that happens, the next major resistance is around $100,793. A move through this zone could open the way to $100,000 before the end of December.
Van de Poppe said,
“It’s all depending on the open in the US, if that’s going to be causing the standard correction, then it’s time to buy the dip.”
He also flagged a rejection at $92,000, saying it “doesn’t look great in the short-term,” but left open the chance of a breakout. If the market fails to hold current levels, he expects a possible drop to between $78,000 and $82,000 before a rebound.
Bitcoin has gained over 4% in the past week, despite a slight decline of 2% over the last 24 hours. Current price sits around $90,330, with volume above $43 billion.
Fed Meeting Adds Uncertainty
Attention is now on the Federal Reserve’s upcoming policy meeting on December 10. In a recent video, analyst Ali Martinez pointed out that Bitcoin has reacted negatively after most FOMC meetings this year. Out of seven meetings so far, six were followed by corrections, with only one short-lived rally in May.
Market data shows expectations for a rate cut are high, with current projections at over 87%. Still, Fed Chair Jerome Powell may take a cautious stance. Van de Poppe warned,
“I wouldn’t be surprised if… Powell says ‘I don’t know whether we’ll proceed with rate cuts’ and the market does a classic sell-off.”
Traders are preparing for either outcome, with some anticipating a final move lower before a potential reversal into year-end.
Bearish Flag Pattern Raises Doubts
A chart shared by Ali suggests Bitcoin may be forming a bearish flag. If confirmed, this setup could lead to a move down toward $70,000. The pattern follows a sharp drop, with a consolidation phase forming below key resistance. A break below the lower trendline would suggest continued weakness.
Meanwhile, other analysts are watching short-term structure. DamiDefi noted that Bitcoin remains under a downward trendline on the 4-hour chart. He said a breakout above $94,000 would confirm strength, but if recent lows are lost, further downside is likely.
“Until $BTC clears this downtrend, you’re not buying a dip, you’re buying a downtrend,” he said.
Although there is a conflict of opinion regarding the short-term direction, on-chain information indicates that Bitcoin is still moving out of centralized exchanges. The trend usually indicates a long-term holding nature and can decrease the selling pressure.
The post Will the Fed Crash Bitcoin (BTC) or Spark a $100K Rally? appeared first on CryptoPotato.


