
Crypto World
XBR/USD Analysis: Brent Crude Rises Above $110
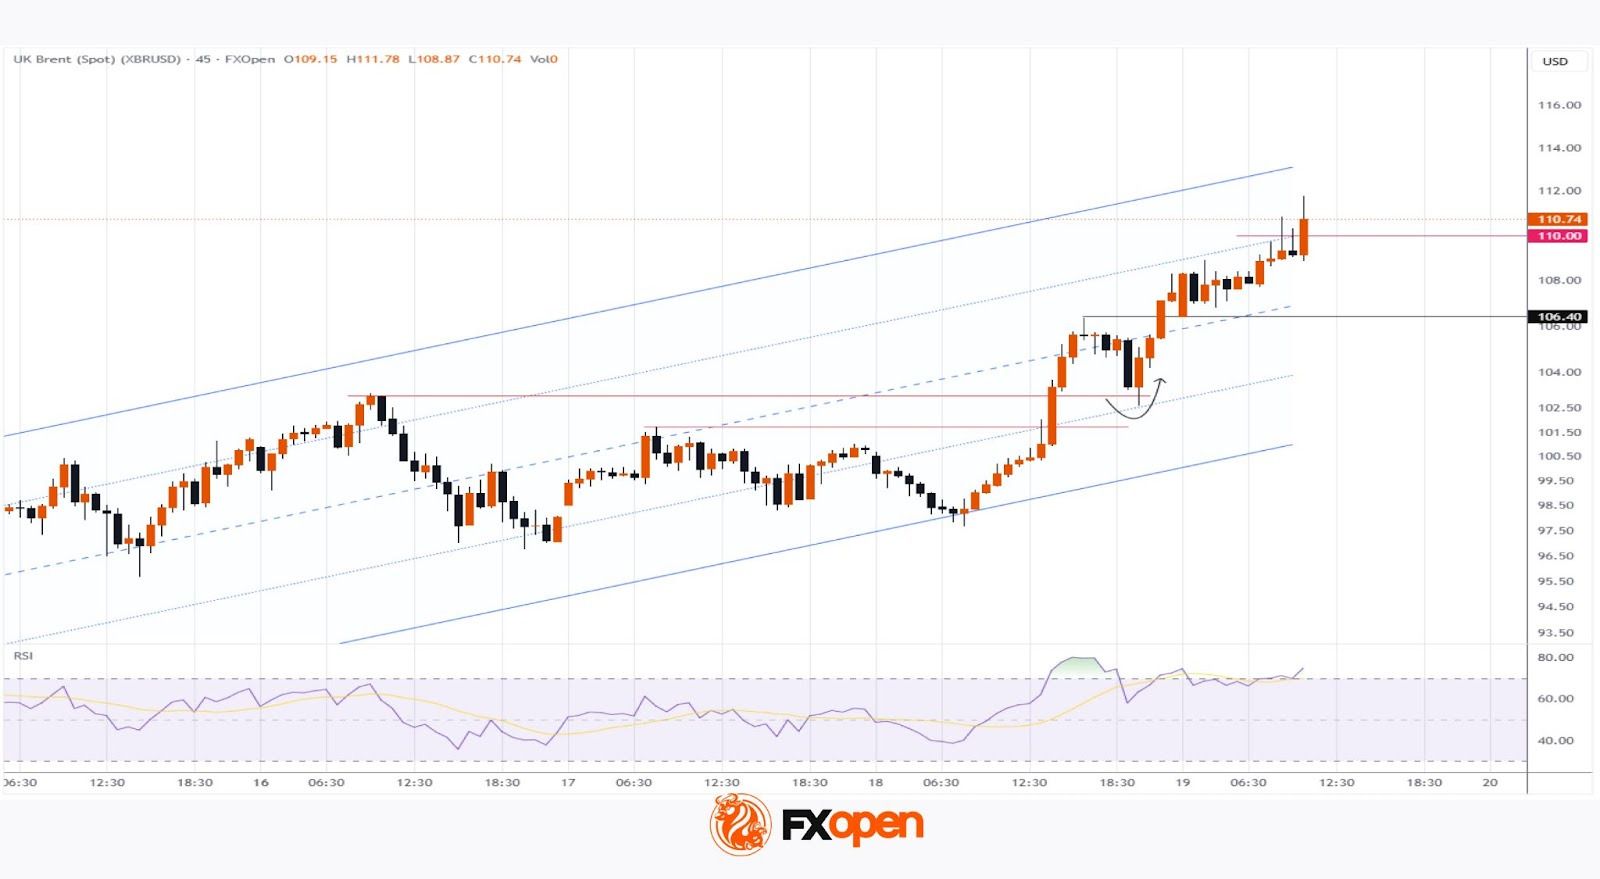
Yesterday, Brent crude prices moved sharply higher, with the XBR/USD chart showing breakouts above local resistance levels. Today, the price has climbed above the $110 mark, bringing it close to the multi-year high recorded on 9 March.
The bullish sentiment in the oil market is being driven by ongoing military tensions in the Middle East. According to recent media reports:
→ US President Donald Trump stated that Israel was responsible for the attack on Iran’s South Pars gas field;
→ Iranian missile strikes on Qatar’s key liquefied natural gas facilities caused significant damage.

Technical Analysis of XBR/USD
Recent price action allows for the construction of an ascending channel on the XBR/USD chart, reflecting heightened concerns over further escalation.
From a bullish perspective (as indicated by the arrows):
→ yesterday’s V-shaped rebound near the line dividing the lower half of the channel suggests strong buying pressure;
→ bulls showed confidence by breaking above the $106.40 level;
→ price remains in the upper half of the channel, with the median line potentially acting as support.
From a bearish perspective:
→ the RSI indicator is hovering near overbought territory;
→ long upper wicks around the $110 level point to selling pressure;
→ the upper boundary of the channel may act as resistance.
Taking the above into account, Brent prices remain under the control of buyers. As such, any pullbacks are likely to be limited in depth. A meaningful reversal would require significant changes in the geopolitical landscape.
Start trading commodity CFDs with tight spreads (additional fees may apply). Open your trading account now or learn more about trading commodity CFDs with FXOpen.
This article represents the opinion of the Companies operating under the FXOpen brand only. It is not to be construed as an offer, solicitation, or recommendation with respect to products and services provided by the Companies operating under the FXOpen brand, nor is it to be considered financial advice.


The DOJ crypto conflict reached a formal accusation this week when six Democratic senators told Deputy Attorney General Todd Blanche he had a “glaring conflict of interest” after ProPublica reported he held between $158,000 and $470,000 in Bitcoin, Ethereum, and Solana when he issued the memo disbanding the National Cryptocurrency Enforcement Team.
Summary
- Blanche signed an ethics agreement in February 2025 promising to divest within 90 days and not to participate in matters affecting his digital asset interests, then issued the enforcement rollback memo in April 2025 before divesting, during which window his Bitcoin holdings alone appreciated 34 percent
- When Blanche eventually divested, he transferred holdings to his adult children and a grandchild rather than liquidating them outright, a move ethics experts told ProPublica is technically legal but against the spirit of conflict of interest law
- Senators Warren, Hirono, Durbin, Whitehouse, Coons, and Blumenthal set a February 11 deadline for Blanche to produce all communications with ethics officials and the crypto industry around the time of the memo; the Campaign Legal Center simultaneously filed a complaint with the DOJ Inspector General
ProPublica’s investigation documents that Blanche’s memo, titled Ending Regulation by Prosecution, disbanded the NCET, halted Biden-era investigations into crypto companies, and directed the DOJ to assist Trump’s crypto working group. The memo benefited the crypto industry broadly, including Blanche’s own portfolio. A DOJ spokesperson told ProPublica the actions were “appropriately flagged, addressed and cleared in advance,” without specifying who cleared them or how. The senators wrote directly to Blanche: “At the very least, you had a glaring conflict of interest and should have recused yourself.”
The NCET was established in 2022 and led the Binance investigation that resulted in a $4.3 billion settlement. Blanche’s memo disbanded it entirely and directed the Market Integrity and Major Frauds Unit to cease cryptocurrency enforcement in order to focus on other priorities including immigration and procurement fraud. Going forward, the DOJ would only pursue crypto cases involving terrorism, narcotics, human trafficking, hacking, and cartel financing. The senators cited a January 2026 Chainalysis report showing illicit crypto activity surged 162 percent the prior year, arguing their predictions about the consequences of the rollback had proven correct.
The Divestiture Problem
When Blanche transferred his crypto holdings to family members rather than selling them outright, ethics experts told ProPublica this approach was at odds with the spirit of the law. The Campaign Legal Center argued the transfers did not eliminate his potential financial interest because his family retained the appreciated assets. ProPublica calculated his Bitcoin holdings rose 34 percent between the date of the memo and the date he divested, a gain that reached approximately $105,000 on that position alone.
What the Senators Demanded and What Comes Next
As crypto.news has reported, the DOJ conflict question has become a live variable inside CLARITY Act negotiations, where Democratic senators are pushing for ethics language barring government officials from profiting from crypto. As crypto.news has noted, the federal regulatory framework is being rebuilt through financial regulators rather than criminal enforcement, a structural shift Blanche’s memo accelerated. The Inspector General complaint filed by the Campaign Legal Center remains open, and the DOJ has not responded publicly to the senators’ demand for documentation.
Shares of stablecoin issuer Circle Internet Group fell sharply Thursday following a Wall Street downgrade and reports tied to a legal probe connected to a recent crypto exploit.
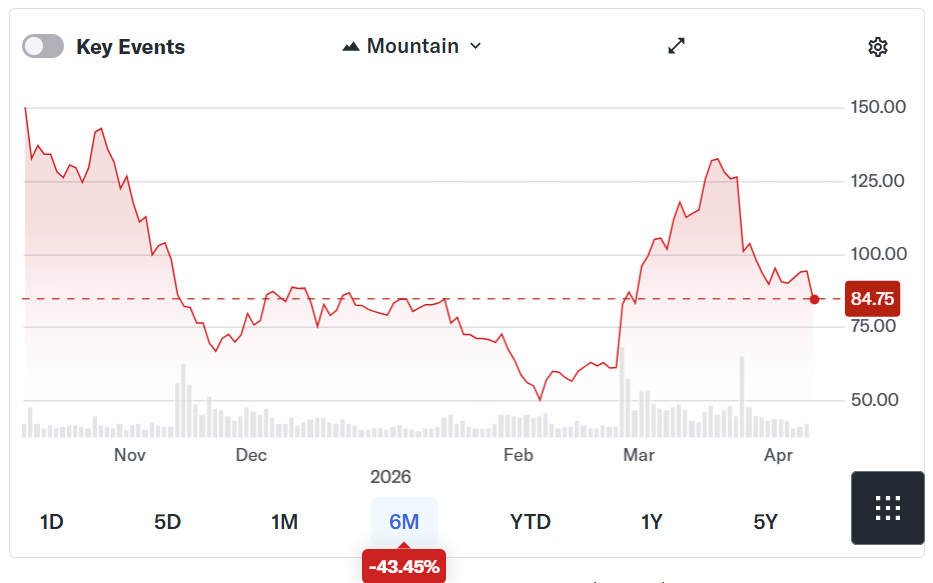
Circle’s stock price closed near session lows in Nasdaq trading, falling 9.9% to $85.10.
The decline adds to a broader slide in the company’s shares, which are down nearly 24% over the past month and about 43% over the past six months, reflecting continued volatility after Circle’s high-profile public debut last year.

However, the latest pullback may also reflect profit-taking after Circle shares surged between February and March, driven largely by growing stablecoin adoption.
Nevertheless, some analysts are urging caution. On Thursday, Compass Point downgraded Circle to “sell” from “neutral” and issued a $77 price target, implying roughly 9% downside from current levels.
Circle has also faced pressure from regulatory uncertainty in the United States. Progress on market structure legislation has stalled, while banking industry groups continue to lobby against yield-bearing stablecoins.
Analysts at Bernstein said the concerns are overstated, noting that Circle’s underlying business remains unaffected and pointing to growing USDC (USDC) adoption and strong reserve income.
Related: Crypto investor sentiment will rise once CLARITY Act is passed: Bessent
Fallout from Drift Protocol exploit continues to weigh on crypto markets
Separately, legal scrutiny tied to the recent exploit of decentralized exchange Drift Protocol has added another layer of uncertainty to the broader crypto market, indirectly weighing on sentiment toward Circle.
According to a notice circulated this week, investors affected by the $280 million Drift exploit are being urged to contact the Oakland, California law firm Gibbs Mura for potential financial recovery. The outreach signals the early stages of a possible class-action investigation tied to losses from the incident.

While Circle is not directly implicated in the exploit, the episode has renewed concerns about counterparty risk and the stability of decentralized finance platforms — an overhang that can spill over into publicly traded crypto-linked equities.
The perpetrator of the Drift exploit moved the stolen assets into USDC, prompting speculation over whether the funds could have been frozen by Circle, though no action was taken.
Related: Crypto hacks fall to $49M in February as attackers shift to phishing scams
CAEX, a crypto platform linked to the Vietnam Prosperity Joint Stock Commercial Bank (VPBank) ecosystem, said OKX Ventures and HashKey are backing the company as it seeks to qualify for Vietnam’s pilot regime for crypto exchanges.
CAEX said Friday that the two offshore companies will join VPBank Securities (VPBankS) and technology partner LynkiD as shareholders.
According to a release shared with Cointelegraph, their investment is intended to help CAEX reach Vietnam’s minimum charter capital threshold of 10 trillion dong (about $380 million), a key condition for participating in the pilot program.
Vietnam pilot sets high bar
The move comes as Vietnam’s Ministry of Finance and State Securities Commission press ahead with a five-year crypto pilot that will admit only a limited number of licensed digital asset service providers. Officials have said no more than five enterprises will be allowed to operate exchanges under the pilot, which opened its licensing window on Jan. 20.
The framework also caps foreign ownership at 49% and requires at least 65% of capital to be held by institutional shareholders, creating high barriers to entry even for bank-backed contenders.
Authorities have also signaled they may block access to unlicensed overseas platforms once the first onshore exchanges are operational, raising the stakes for foreign firms seeking a compliant route into the market.
A spokesperson for OKX told Cointelegraph they could not disclose the size of the investment or the companies’ stakes in CAEX, nor whether the investment confirms the exchange’s selection in the pilot, saying it would “not be appropriate to comment further on the regulatory process.” However, they said the investment would enable CAEX to meet the capital requirements to pursue entry into Vietnam’s regulated crypto pilot program.
CAEX is part of VPBank’s broader financial ecosystem and previously said it was in the final stages of raising its charter capital to 10 trillion dong to qualify for the pilot, while VPBank is one of Vietnam’s largest private lenders.
The OKX spokesperson said that, as a strategic partner, the company would work with the other shareholders “as appropriate” to ensure CAEX has “the financial strength and technical know-how” to meet user expectations and regulatory standards. Potential areas of collaboration include technical infrastructure, security systems, compliance and risk management, they said.
Related: Banks want to run Vietnam’s crypto exchanges, Boyaa’s $70M BTC plan: Asia Express
Vietnam’s crypto market has boomed, but regulation is tightening
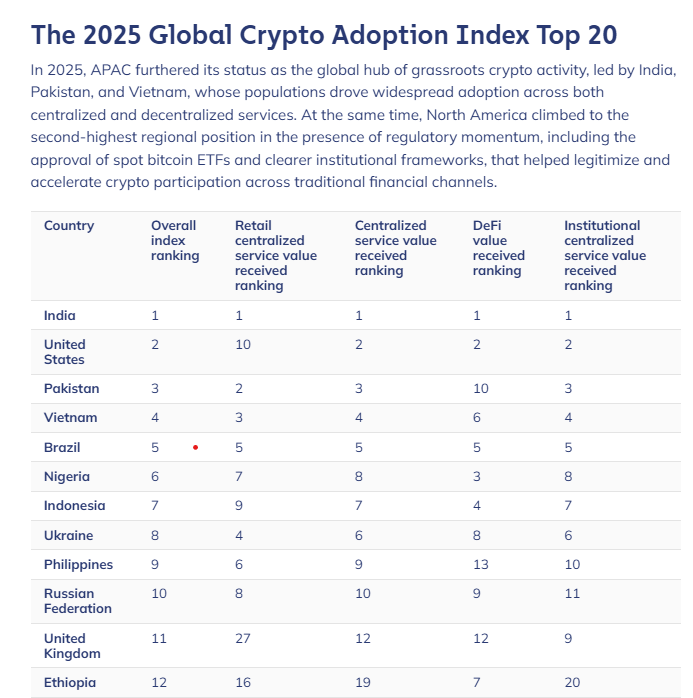
Vietnam’s crypto market has boomed in recent years, with Chainalysis ranking the country fourth in global crypto adoption in 2025. However, that growth has been marred by several high-profile scams and fraud investigations, giving regulators additional impetus to tighten control.

In March 2026, Vietnamese authorities detained multiple ONUS-linked suspects after alleging they used false promotions and manipulated token trading to misappropriate billions of dollars of investor funds through the crypto platform.
The spokesperson said Vietnam is an important market for digital asset innovation, and that the “development of a regulated framework” is a “constructive step” for the country’s industry.
Big Questions: Is China hoarding gold so yuan becomes global reserve instead of USD?

TLDR
- Changpeng Zhao says U.S. crypto exchanges spent millions to block his pardon.
- Zhao made the claim in his memoir, which runs more than 300 pages.
- He also criticized reporting from The Wall Street Journal and Bloomberg.
- Politico reported that Binance paid lobbying firms to support Zhao’s pardon effort.
- Binance.US recently named Stephen Gregory as chief executive to expand in the U.S. market.
Changpeng Zhao says several U.S. crypto exchanges funded efforts to stop his presidential pardon, according to his memoir. He wrote that rivals feared Binance could return to the U.S. market after his legal case ended. Trump granted Zhao a pardon last October, after Zhao pleaded guilty in 2023 and left Binance’s top role.
Changpeng Zhao Details Pardon Fight in His Memoir
Zhao wrote that friends told him rival exchanges backed lobbying campaigns against his pardon. He said they feared stronger competition if Binance re-entered the United States.
He wrote, “They paid millions in lobbying fees to block the pardon, in fear of business competition.” He also said those efforts clashed with Trump’s push to make “America the crypto capital.”
Zhao also attacked media coverage tied to his legal case and pardon process. He called Wall Street Journal reports “false news” and Bloomberg stories “smear articles.”
In 2023, Zhao pleaded guilty to failing to maintain adequate anti-money-laundering controls at Binance. He also stepped down as chief executive after the plea.
Zhao wrote that prison time surprised him because earlier enforcement cases often ended with deferred prosecution or home confinement. He did not identify the exchanges that allegedly opposed the pardon.
Lobbying Records and Binance.US Plans
Politico reported that Binance spent hundreds of thousands of dollars while seeking Zhao’s pardon. The report said one firm received $450,000 for one month of work.
Politico described that firm as run by “a hunting buddy of Donald Trump Jr.” Binance used outside lobbyists while Zhao pursued clemency.
Zhao’s memoir also includes endorsements from BlackRock chief executive Larry Fink and Bridgewater founder Ray Dalio. Dalio praised Zhao for helping expand access to alternative forms of money.
He wrote, “As a great admirer of CZ for his contributions to making alternative monies accessible.” The memoir presents those testimonials alongside Zhao’s account of legal and political pressure.
Last month, Binance.US hired former Currency.com chief executive Stephen Gregory to lead the exchange. The company has said it wants a larger share of the U.S. market, where Coinbase leads.
That appointment came about one year after Binance.US restored fiat deposits and withdrawals for U.S. customers. The company had paused those services due to regulatory pressure.


Key Highlights
- Analysts believe that further decline in XRP’s price will result in its breakout.
- Market specialists are hesitant, attributing weak ETF flows and uncertain signs for its recovery.
- The price movements of XRP largely depend on Bitcoin’s performance.
Mixed Sentiment for XRP as the Market Bounces Back
There is evident optimism in the crypto market since Bitcoin managed to climb above the $70,000 mark, which boosted other coins’ prices.
Ethereum also demonstrated its growing value, thus raising hopes for a potential milestone. Yet, despite this positive outlook in the market, there remains controversy over the future prospects for XRP.
Indeed, while some cryptocurrencies have managed to demonstrate their recovery capabilities, XRP does not seem to be on a consistent rising trajectory just yet. The coin is being traded in a narrow range without any definite upward dynamics.
Analyst: Price Decline May Mean a Greater Breakout
In light of the volatility surrounding XRP, an analyst has provided his own contrarian opinion, saying that any price fall in XRP may increase the possibility of a great breakout in the long run. This is due to the fact that an extended drop means a bigger accumulation period, which would result in an even greater rise after resistance is breached.
Technical analysis dictates that any extended period of sideways trading or falling prices eventually leads to a strong breakout, with the downside providing greater gains than a breakout on the upside. Hence, the analyst suggests that the longer the period of decline, the more gains one would reap from such a breakout.
The analyst adds that should XRP break out at its current price levels, the upside gains may be relatively smaller in comparison to a breakout after an extended price decline period.
Experts Still Question the Potential for XRP Recovery
While this optimistic perspective holds true, some notable experts are still skeptical concerning the future success of XRP in recovering itself. Ric Edelman, financial advisor, recently revealed his skepticism toward XRP by saying that he does not believe XRP will achieve its past heights once again.
Furthermore, Edelman referred to the rather low levels of capital flowing into XRP-based exchange-traded funds, indicating that institutional investors have not shown much enthusiasm about the cryptocurrency. The absence of substantial investment indicates that any potential price rally is difficult to sustain.
Another ETF expert, Eric Balchunas, also suggested that XRP is directly dependent on the performance of Bitcoin. Although Balchunas predicted a price increase, he implied that more positive news is needed to ensure a noticeable price change, including regulatory support or wider acceptance around the world.
Will XRP Be Able to Break Out and Create a New ATH
The main concern for the investors will be the ability of XRP to break out of its consolidation stage and establish a new all-time high in this market cycle. Despite the positive patterns on the charts, the absence of any solid catalysts has restrained expectations.
For XRP to break out, multiple factors have to work in favor of the crypto asset. Stable performance by both Bitcoin and Ethereum might provide the necessary environment for XRP to rise, along with increased adoption and institutional presence. Developments related to regulations could be another significant driver for XRP in the future.
Meanwhile, XRP traders continue monitoring important support and resistance zones for signals about a breakout direction. Either way, XRP is expected to see more volatility in the near term.
The future of XRP is still uncertain but optimistic and skeptical at the same time. Some experts argue that a more substantial decline in price would create room for a robust breakout; however, some doubt if the coin can reassert its dominance amid heightened competition.
As the overall cryptocurrency market seems to be recovering, the next action for XRP may well depend on technical and non-technical factors alike. For the time being, traders and investors keep monitoring the coin’s progress, weighing the opportunities and risks involved.
$XRP – the lower we go, the higher the measured breakout will be! If we break out now, price target will be lower!
Regardless, Im ready to take more profits to retire whole family bloodline!
RT for updates! Make sure to take more profits on top of the #XRPArmy #XRPCommunity 🫡 pic.twitter.com/lHfQV8YByR
— JD 🇵🇭 (@jaydee_757) April 8, 2026
Solana (SOL) price trades at $82.20 on April 9, down 3% in 24 hours and 34% year-to-date. Yet leveraged traders are betting heavily on a bounce.
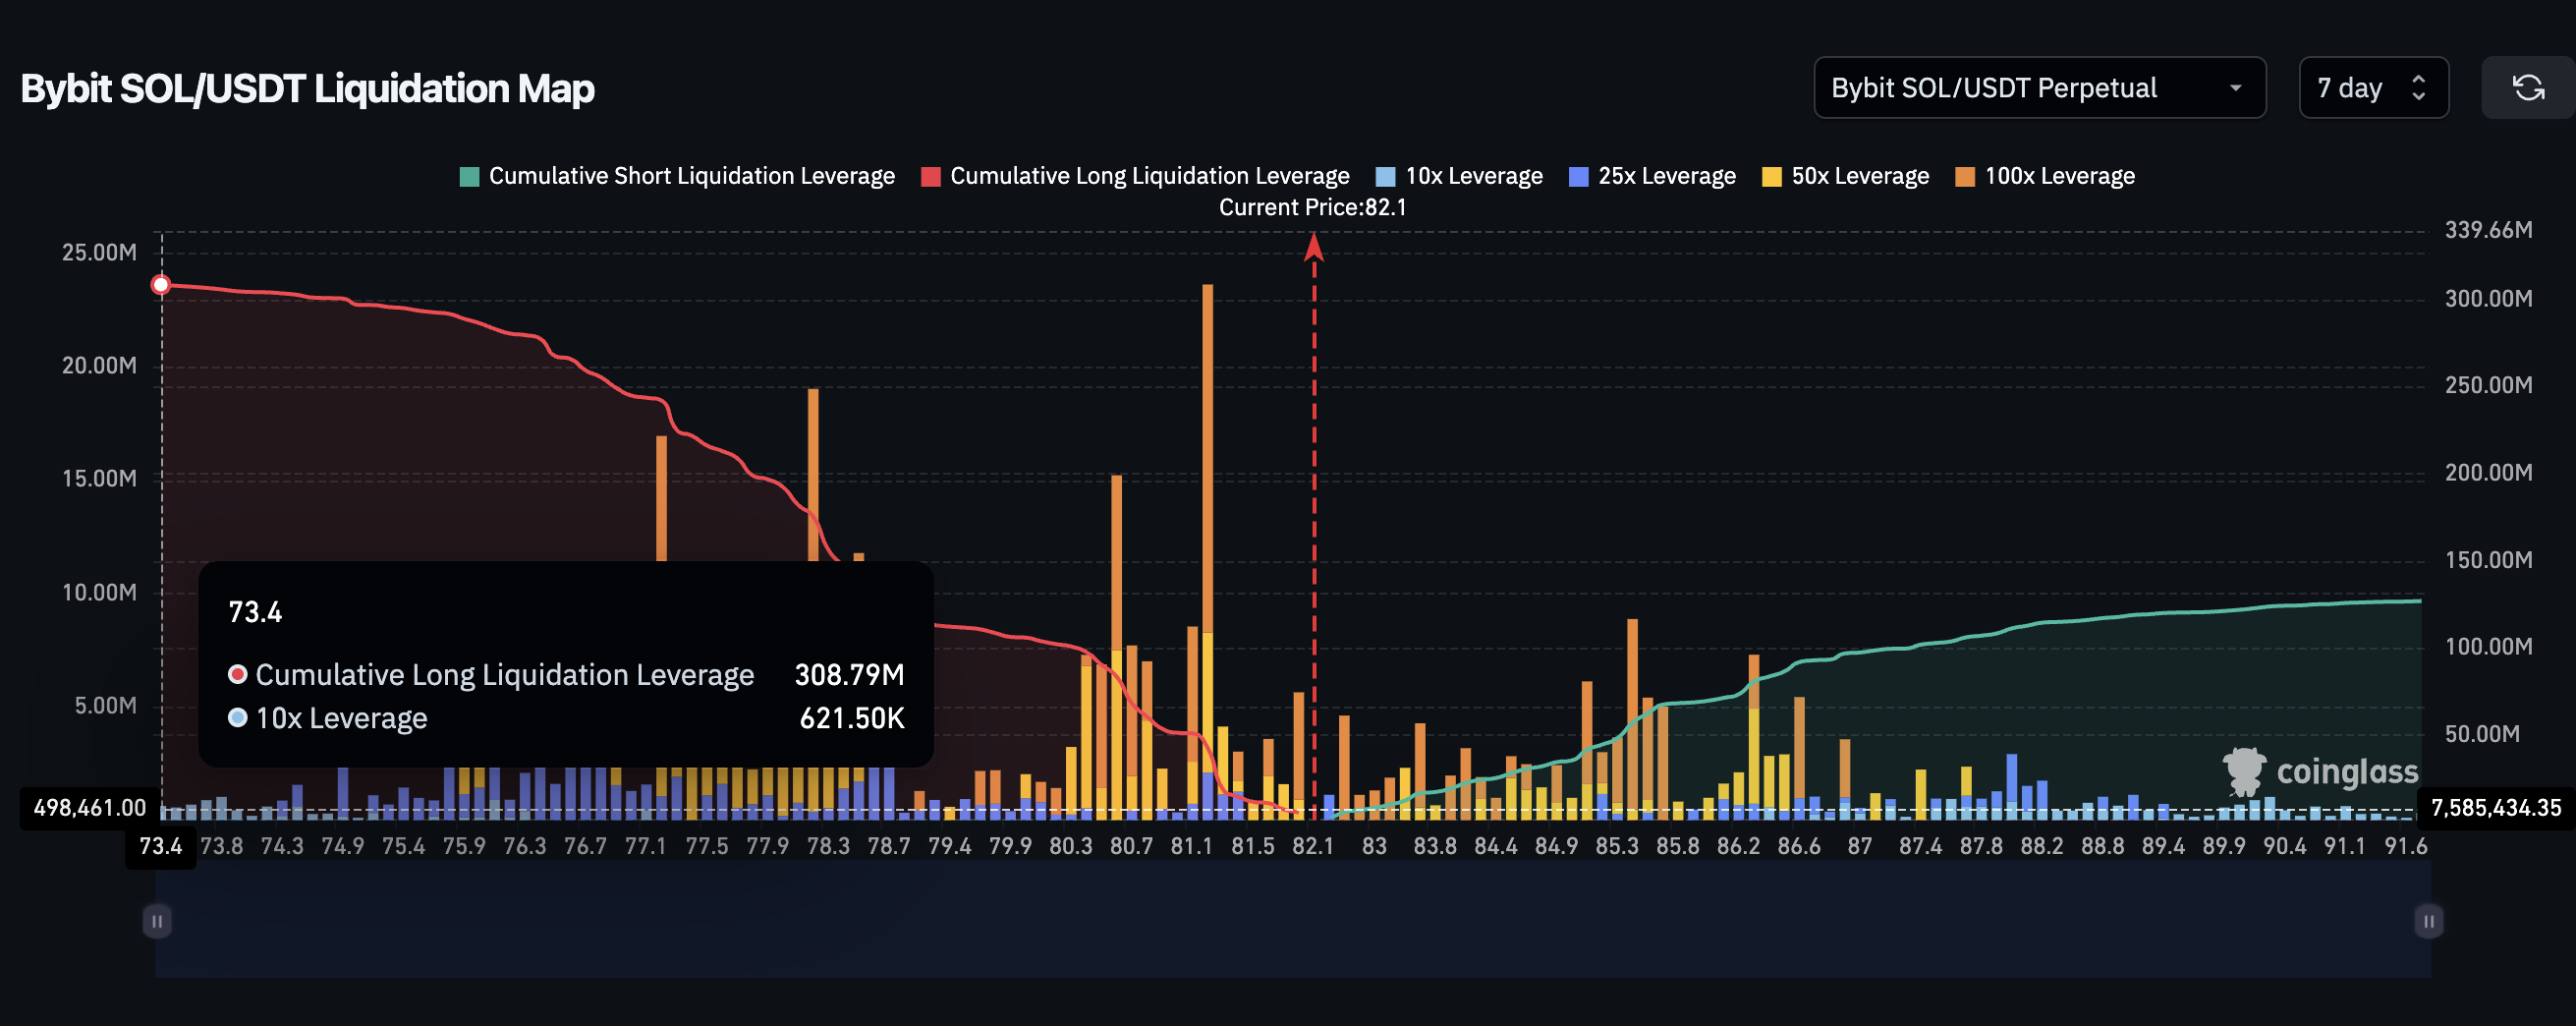
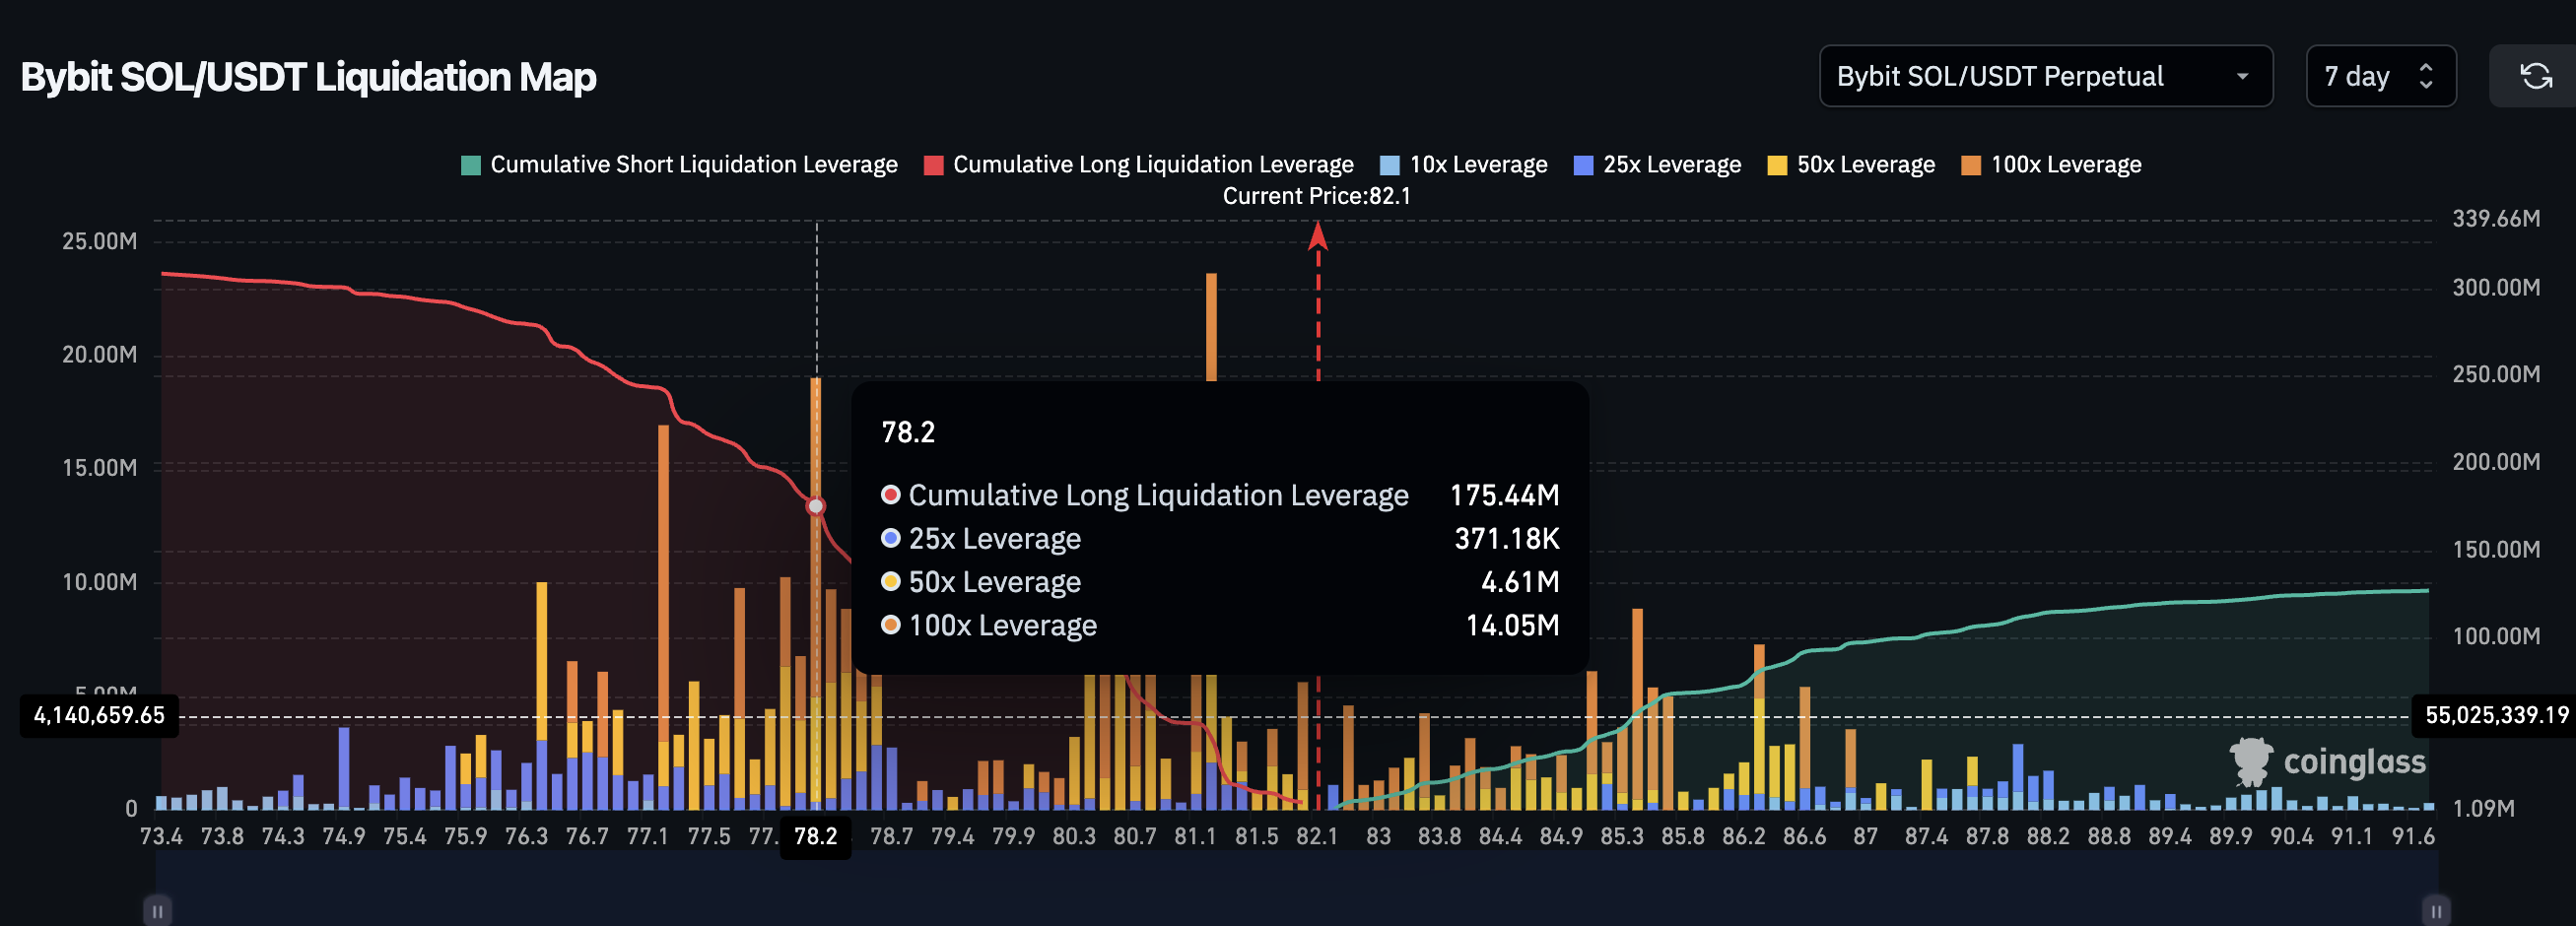
The seven-day liquidation map on Bybit shows $309 million in cumulative long leverage against just $127 million in shorts, a 2.4x mismatch that defies the price weakness. A bullish reversal pattern on the 12-hour chart and an on-chain supply wall may explain why the crowd refuses to turn bearish on Solana price despite the sustained bleed.
Price Weakness Meets a 2.4x Long Bias as a Reversal Pattern Takes Shape
Solana price has dropped almost 5% over the past 30 days while the broader market digested ceasefire uncertainty and capital rotation into equities. The 34% year-to-date decline makes SOL one of the weaker performers among top tokens.
The leverage picture tells a completely different story. On Bybit’s SOL/USDT perpetual market, cumulative long liquidation leverage stands at $308.79 million. Short liquidation leverage sits at $127.02 million. Longs outweigh shorts by roughly 2.4 to 1.
Want more token insights like this? Sign up for Editor Harsh Notariya’s Daily Crypto Newsletter here.
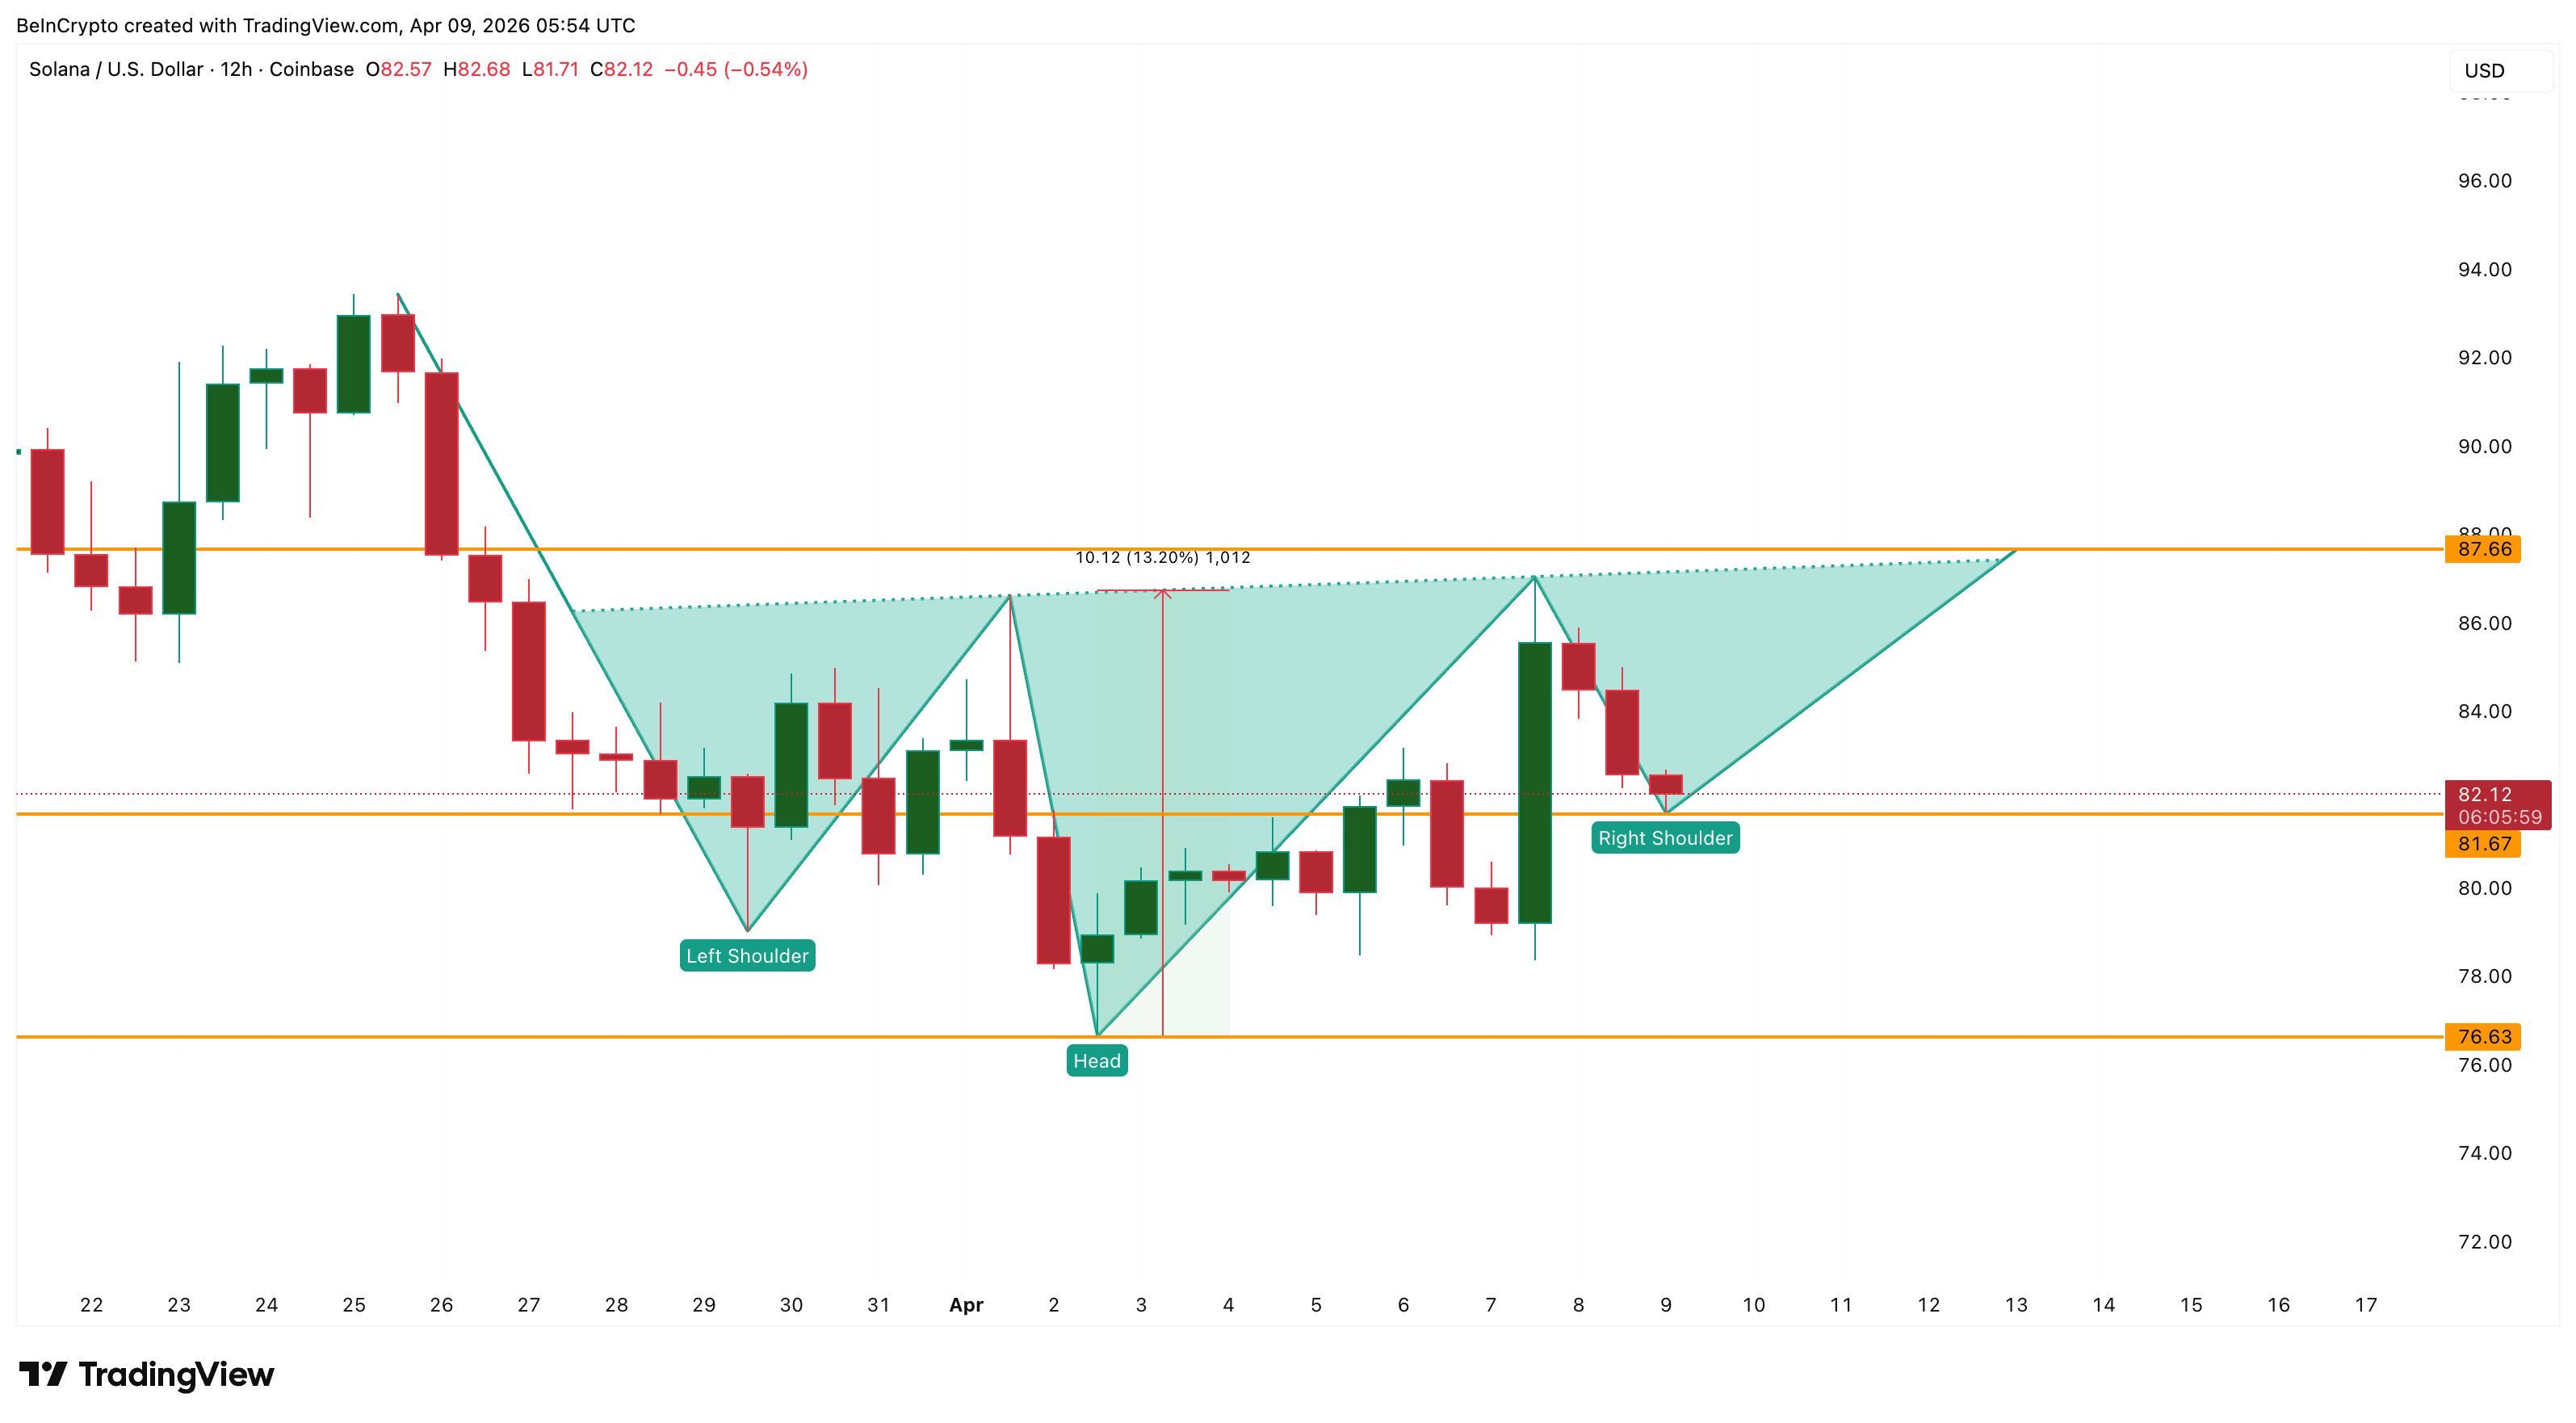
The mismatch becomes less puzzling when the 12-hour chart is considered. SOL is forming an inverse head and shoulders, a bullish reversal pattern. The right shoulder is currently taking shape, and the price is sitting near its base. As long as the pattern remains valid (SOL stays above $76.63), the leveraged crowd appears to be betting that the current dip is the final leg of the right shoulder before a breakout.
However, a pattern alone does not justify $309 million in directional bets. The on-chain picture reveals where that conviction is coming from.
17.5 Million SOL Accumulated at the Exact Level Where the Right Shoulder Sits
The cost basis distribution heatmap from Glassnode shows the densest supply cluster sitting between $81.16 and $81.98. Approximately 17.47 million SOL has been accumulated at this range, making it the strongest holder concentration zone on the chart.
The right shoulder’s lowest wick sits at $81.67, directly inside this cluster. The alignment is not a coincidence. Traders and holders who bought between $81.16 and $81.98 are defending their cost basis. Every dip into this zone gets absorbed because selling here would mean realizing losses for a large portion of the supply.
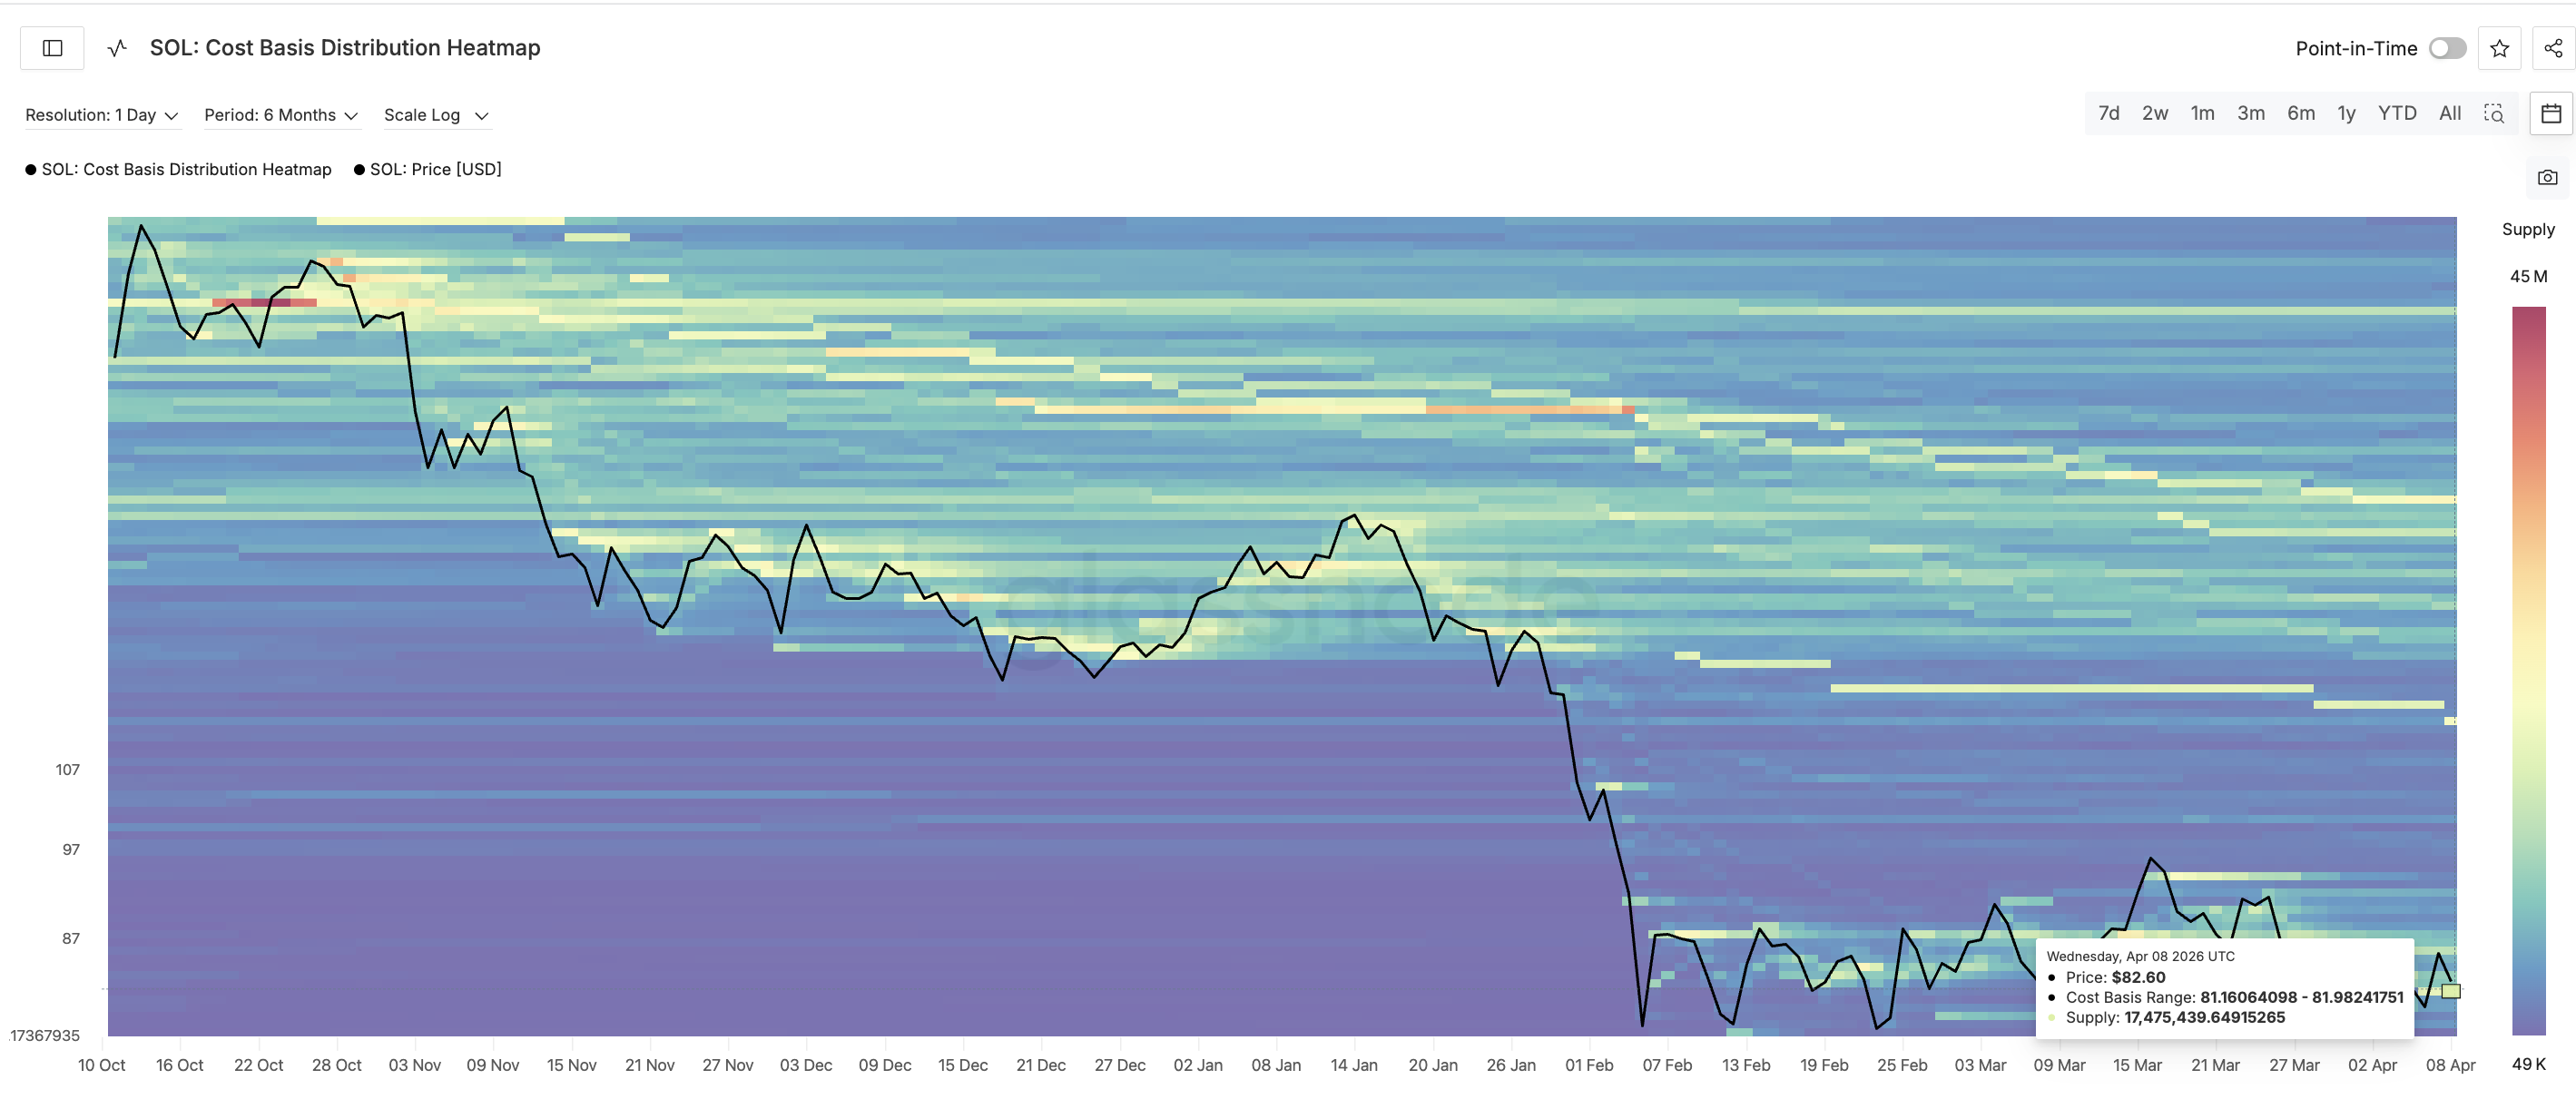
This on-chain wall gives the inverse head and shoulders its structural credibility. The pattern is holding because a real supply base supports it, not just speculative leverage. The longs on Bybit appear to be reading the same signal and positioning accordingly.
However, a $175 million long liquidation cluster sits around $78. If the cost basis wall fails and Solana price drops through $78, the resulting cascade could wipe out the bullish thesis rather quickly.
The SOL price levels now determine which outcome plays out.
Solana Price Levels That Decide if the Longs Are Right
SOL trades at $82.20. The first hurdle sits at $84.12 at the 0.236 Fibonacci level. A 12-hour close above $84.12 would suggest the right shoulder was completed earlier and buyers are now pushing toward the neckline.
The neckline zone sits between $86.86 at the 0.5 level and $88.09 at the 0.618 level. A daily close above $88.09 would confirm the breakout and activate the 13.2% measured move projection from the neckline. That targets $98.47-$98.80, per target projection.
On the downside, $81.67 is the right shoulder floor and almost the base of the 17.5 million SOL supply wall. A 12-hour close below $81.67 would deepen the right shoulder and raise questions about the pattern’s validity.
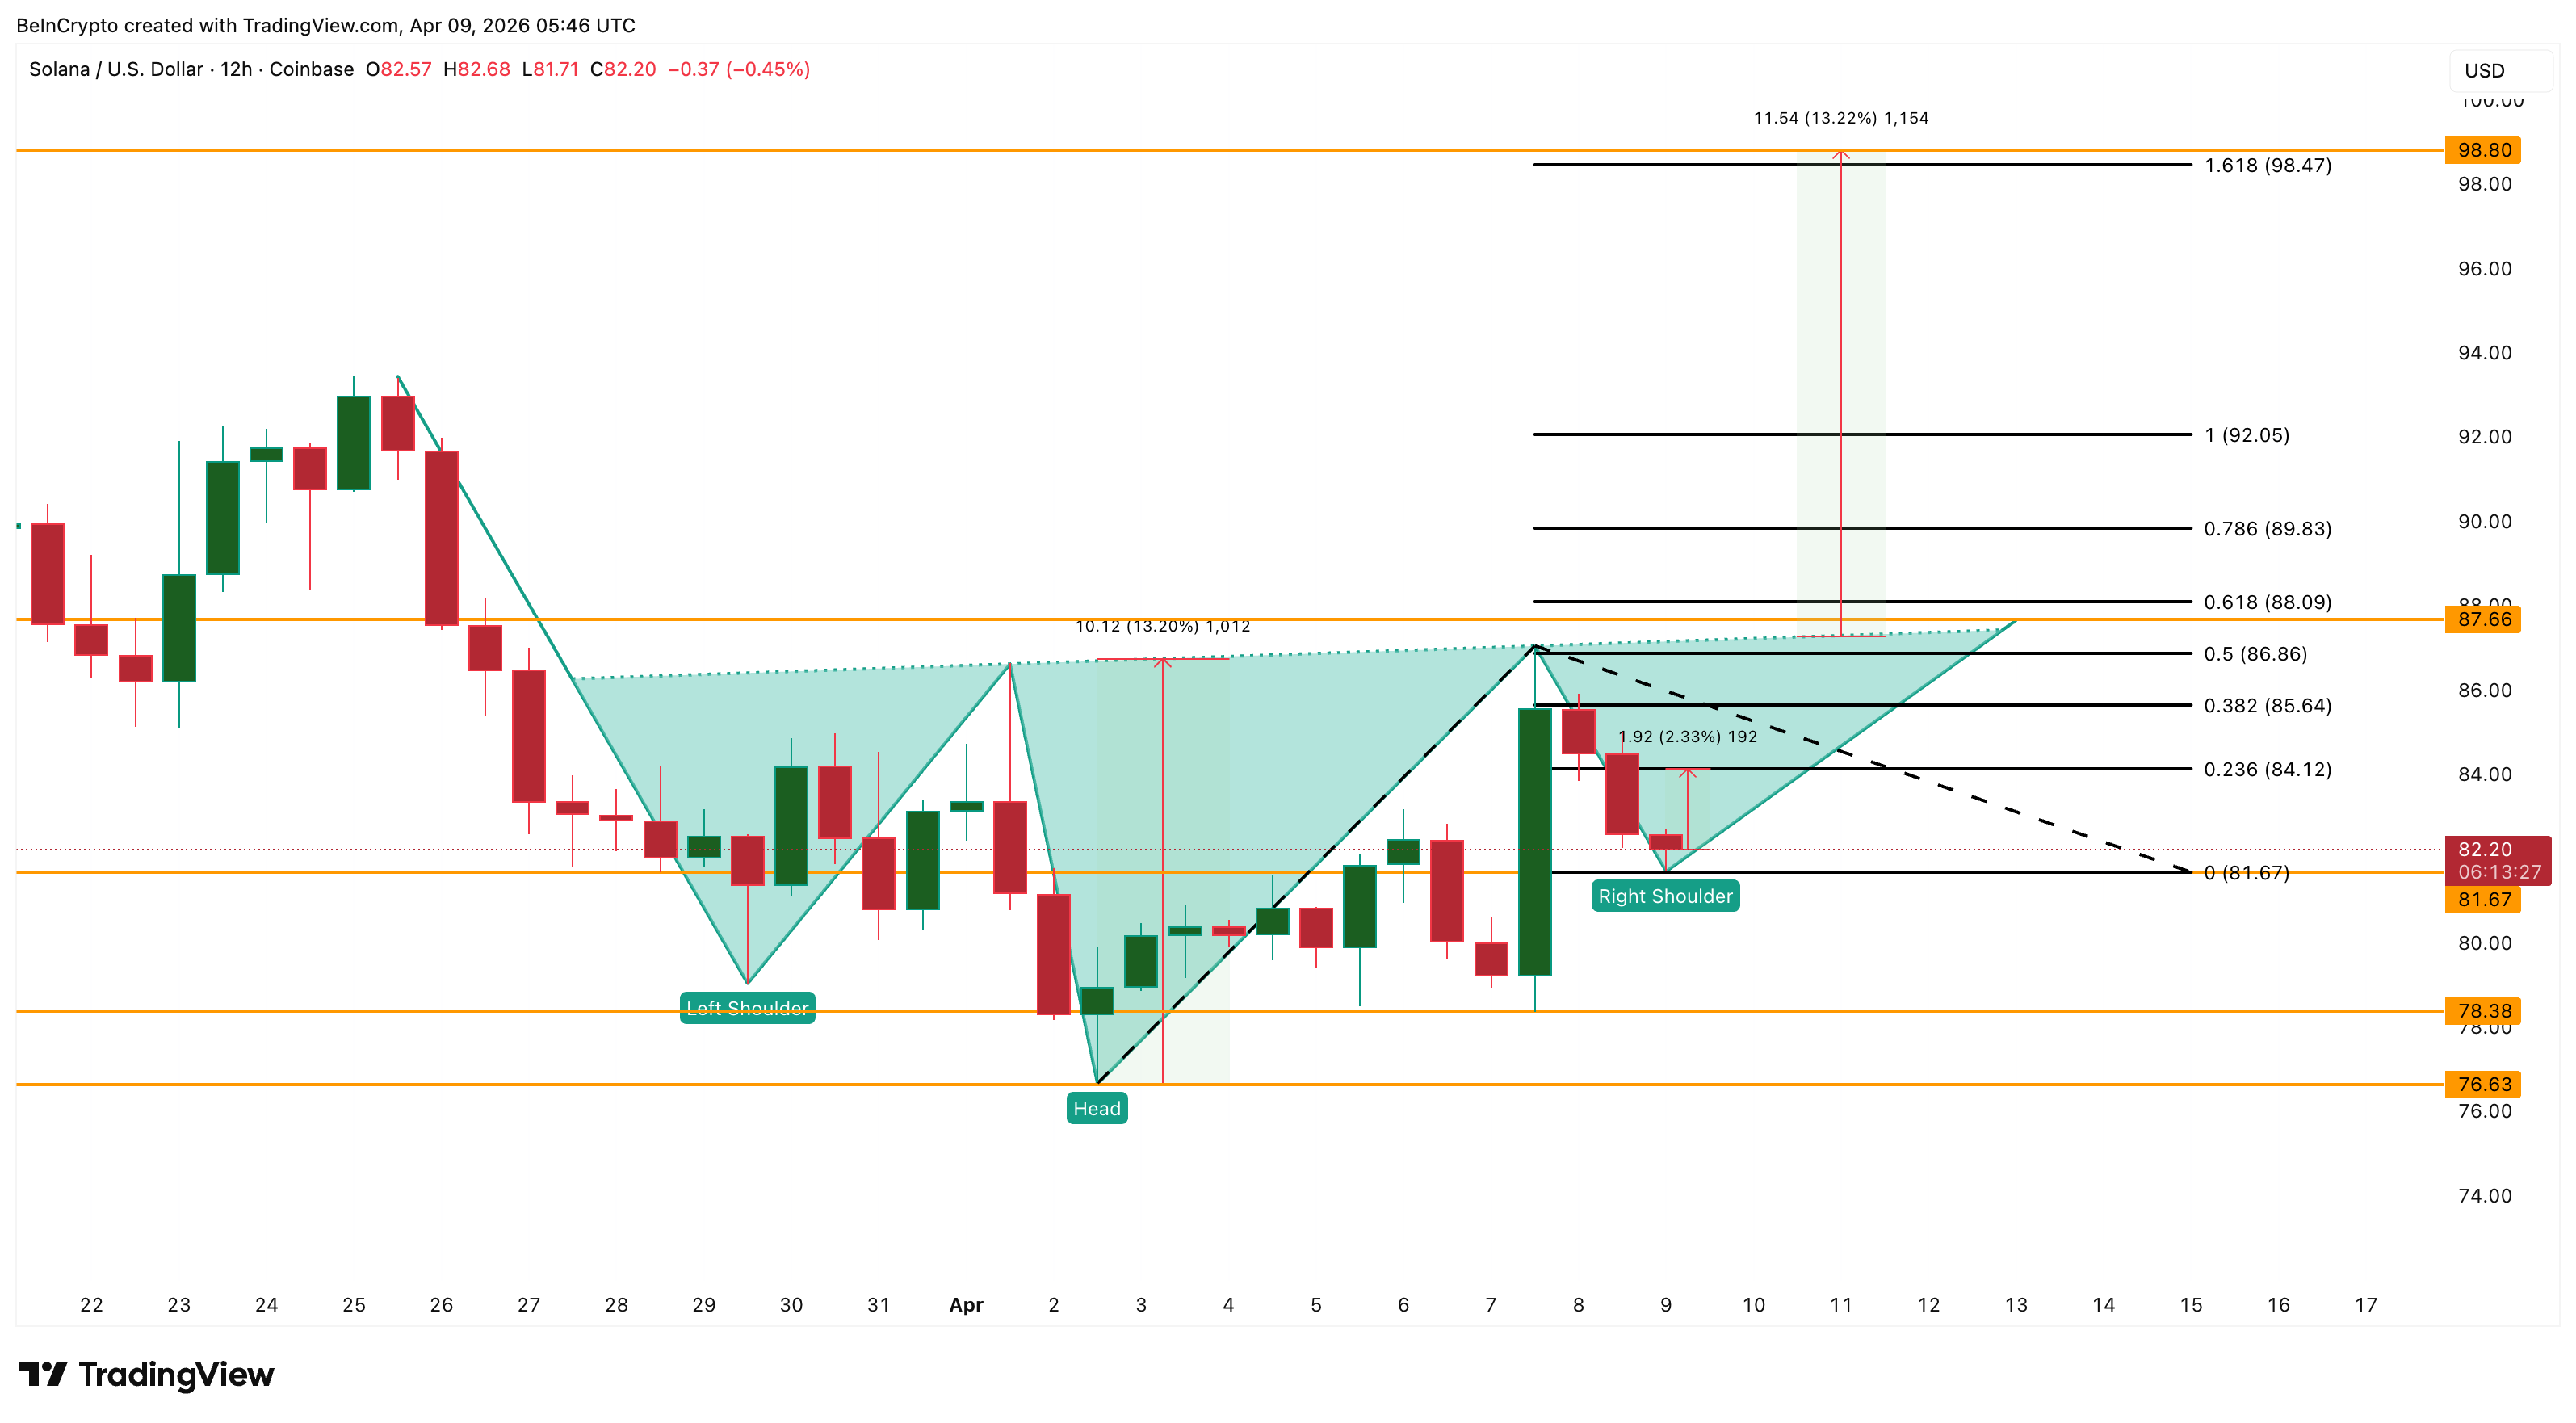
Below that, $78.38 offers the next technical support. However, the $78 zone is where roughly $175 million in long liquidations are clustered. If SOL reaches that level, forced selling from liquidated positions would likely accelerate the decline and damage the pattern significantly. A break below $76.63 at the head invalidates the inverse head and shoulders entirely.
For now, $88.09 separates a confirmed breakout toward $98.80 from a failed right shoulder that risks triggering $175 million in long liquidations below $78.
The post Solana Price Drops 3% but Longs Keep Piling In: 17 Million SOL Explain Why appeared first on BeInCrypto.
A mechanical hand is on display at the Robot Mall, world’s first embodied intelligent robot 4S store, on August 13, 2025 in Beijing, China.
Vcg | Visual China Group | Getty Images
BEIJING — Alibaba Cloud is investing in a new type of artificial intelligence designed to better replicate the real world using a different approach from chatbots such as OpenAI’s ChatGPT.
The shift recognizes the limits of “large language models” trained primarily on text. Instead, developers are starting to focus more on “world models” built on videos and real-life physical scenarios.
To jump on the trend, Alibaba led a 2 billion yuan ($290 million) investment in ShengShu, the startup behind the AI video generation tool Vidu, the company announced Friday. TAL Education and Baidu Ventures also participated in the series B funding round.
The investment comes about two months after ShengShu raised 600 million yuan from Qiming Venture Partners and other backers. The startup declined to disclose its valuation.
ShengShu said the latest funding will support the development of a “general world model” that uses AI to bridge two currently separate domains: the digital world of games and AI-generated video, and the physical world of autonomous driving and robots.
“ShengShu believes that a general world model, built on multimodal data such as vision, audio, and touch, more naturally captures how the physical world works than large language models,” the three-year-old startup said in a statement.

“We aim to connect perception and action,” Zhu Jun, founder of ShengShu, added in a statement, allowing AI systems to better model and predict real-world behavior consistently.
ShengShu’s latest Vidu Q3 Pro model, released in January, ranks among the top 10 AI models for generating videos from text and images, according to Artificial Analysis.
The company launched Vidu globally months before OpenAI made its now-shuttered Sora tool for AI video generation widely available. Chinese short-video companies Kuaishou and ByteDance have also released similar competing AI tools for generating videos.
World model competition
Alibaba has expanded its investments in related startups.
The Chinese tech giant and Baidu Ventures last month led a $50 million investment in Tripo AI, a platform that uses AI to quickly generate digital 3D models from photographs. Tripo said it is also moving away from techniques used by language models toward AI tools grounded in physical space and is developing its own world model.
In September, Alibaba also led a $60 million investment in PixVerse, which released an AI world model earlier this year that allows users to direct how a video unfolds while it is being generated.
Alibaba, which got its start in e-commerce, has also released free, open-source AI models for video generation and, in February, launched one for powering robots.
Subscribe now
Shengshu said Friday it has strategic partnerships with companies developing embodied AI — systems such as humanoid robots that interact with the physical world — for use across industrial, commercial and home settings.
World models are critical for robotics because the technology needs more than LLMs to work, Kevin Kelly, co-founder of the U.S. tech magazine Wired, wrote last month on his Substack.
Ultimately, to replicate human intelligence, AI will need three things: reasoning, an understanding of the physical world and continuous learning, Kelly said. While AI for the learning category hasn’t been developed yet, LLM-powered chatbots have created the knowledge element, he said, making world models a key area requiring a breakthrough.


Mythos’ AI scare is real — enough for U.S. regulators to call an urgent meeting and assess what Anthropic’s advanced artificial intelligence model it could mean for banks.
The meeting happened Tuesday, with Treasury Secretary Scott Bessent and Fed Chair Jerome Powell sitting down with Wall Street bank CEOs to discuss possible cybersecurity risks linked to Mythos, people familiar with the matter told Bloomberg.
Participants included chief executives from Citigroup Inc, Morgan Stanley, Bank of America Corp.’, Wells Fargo & Co.’s, and Goldman Sachs Group Inc.’s. All these are designated as systemically important, meaning disruptions to their operations could have global repercussions.
Mythos, an advanced artificial intelligence model developed by Anthropic, is designed to identify and exploit vulnerabilities in software systems when prompted. Unlike typical consumer-facing AI tools, Mythos is geared toward cybersecurity software engineering and cybersecurity tasks. Its specialty is identifying critical software vulnerabilities and bugs, but it can also assemble sophisticated exploits.
The episode highlights a fundamental change in how regulators are framing AI risk, not merely as a technological challenge, but as a potential catalyst for systemic events.
This has already raised red flags in crypto, where experts are worried that Mythos’ capability of discovering and exploiting zero-day vulnerabilities in real-time at a low cost poses risk to the DeFi infrastructure.
Anthropic, therefore, has taken a cautious approach, releasing the product only for small group of large technology and financial firms under “Project Glasswing.”
Anthropic has previously disclosed that it consulted with U.S. officials ahead of Mythos’ release regarding both its defensive and offensive cyber capabilities. The company is also separately engaged in a legal dispute with the Pentagon, which has designated it a supply-chain risk — a classification Anthropic is contesting in court.
The US Central Intelligence Agency said it will embed “AI co-workers” directly into its analytics platforms to assist analysts with detecting spies and anticipating hostile moves by foreign adversaries.
“Within the next couple of years, we will have AI co-workers built into all of the agency’s analytic platforms — a kind of classified version of generative AI that will help our analysts with basic tasks,” CIA deputy director Michael Ellis reportedly said on Thursday during an event hosted by the Special Competitive Studies Project in Washington, DC.
According to Politico, Ellis said the AI co-workers would assist intelligence officers with drafting key judgments, testing analytical conclusions and identifying trends in intelligence that the agency gathers from abroad.
However, he said humans would continue to be the ones making the “key decisions.”

The CIA’s AI plans come amid a feud between the US Department of Defense and AI firm Anthropic. Despite having a $200 million contract with the Department of Defense, Anthropic prevented the use of its flagship AI product, Claude, for mass domestic surveillance and fully autonomous weapons.
US President Donald Trump ordered all federal agencies to immediately cease using Anthropic’s technology in March, while the Department of Defense declared Anthropic a supply chain risk.
The parties remain locked in a legal dispute over the designation, with a US appeals court on Wednesday denying Anthropic’s emergency request to temporarily pause the label.
While Ellis didn’t point out Anthropic, he said the CIA “cannot allow the whims of a single company” to constrain its capabilities.
The CIA has already adopted AI for other intelligence tasks, having tested about 300 AI projects last year to “bring new capabilities to our mission,” such as processing large data sets and language translation, Ellis said.
Ellis also noted that the CIA recently created its first intelligence report with AI while predicting that AI’s role in the agency’s work would continue to grow.
Related: North Korean cyber spies are no longer just remote threats
A major motivation for the CIA is to stay ahead of China, Ellis said, noting that the once-large gap between the US and China has narrowed significantly.
“Five to ten years ago, China was nowhere near America, in terms of technological innovation,” Ellis said. “That’s just not true today.”
Ellis likes the transparency of Bitcoin, crypto
In May, Ellis said Bitcoin and crypto were matters of national security, adding that the agency looks at blockchain data to assist with its counterintelligence operations.
“It’s another area of technological competition where we need to make sure the United States is well positioned against China and other adversaries.”
Magazine: ‘Dystopian death market’: Anger over Polymarket’s Iran war be

Morgan Stanley launches lowest-fee bitcoin ETF, intensifying market rivalry. Advisor network gives MSBT strong distribution edge over competitors. BlackRock retains liquidity lead despite new fee pressure from MSBT.
Wall Street competition intensified as Morgan Stanley launched its spot bitcoin ETF on April 8. The new product targets dominance in a fast-growing U.S. market. It directly challenges BlackRock and its leading fund.
The fund trades under the ticker MSBT on NYSE Arca with a 0.14% expense ratio. This pricing sets a new low across spot bitcoin ETFs. It signals a clear shift toward aggressive fee competition among issuers.
Bitcoin ETF Competition Shifts Toward Cost and Access
Bitcoin traded around recent market levels as ETF competition intensified across major issuers. MSBT entered the market with the lowest fee structure available. This move puts pressure on established players to reconsider pricing strategies.
BlackRock Continues to Dominate Through Its iShares Bitcoin Trust
The fund holds tens of billions in assets and leads in trading activity. Its liquidity supports large transactions and active strategies.
Morgan Stanley offers a different advantage through distribution strength. Its wealth division manages trillions in client assets. Advisors can now allocate capital directly into an in-house product.
Advisor Networks Drive Structural Market Shift
Financial advisors now play a larger role in ETF adoption and portfolio allocation. Earlier inflows came mainly from self-directed participants seeking liquidity. Now, integrated advisory platforms influence new capital flows more strongly.
Morgan Stanley allows advisors to allocate a portion of portfolios to bitcoin exposure. Internal guidance permits allocations based on client risk tolerance. This approach simplifies recommendations and reduces friction.
As a result, MSBT may attract flows through existing advisory relationships. BlackRock maintains an advantage in market depth. Replicating that liquidity may take time despite strong distribution channels.
Expansion Signals Broader Crypto Strategy
The MSBT launch marks a shift in how banks approach digital assets. Morgan Stanley now builds its own crypto investment vehicles, whereas previously it focused on distributing third-party ETF products.
The bank has also filed for additional crypto products linked to Ethereum and Solana. These filings suggest a long-term expansion strategy across digital asset classes. The firm continues to build infrastructure around custody and trading services.
The bank plans to integrate crypto trading into its E*Trade platform, connecting digital assets with its broader financial ecosystem. It reflects a wider trend among banks entering crypto markets directly.
The ETF market has already absorbed significant inflows since early 2024. MSBT now tests whether distribution strength can compete with established liquidity leaders. This competition may accelerate fee reductions across the sector.
Councillor hits out after badges depicting controversial bonfire go on sale

senators flag conflict of interest

Jack Black’s Face In Photo From When He Was 23 Stuns Fans


-

 Fashion6 days ago
Weekend Open Thread: Spanx – Corporette.com
-

 Business4 days ago
Three Gulf funds agree to back Paramount’s $81 billion takeover of Warner, WSJ reports
-

 Sports5 days ago
India men’s 4x400m and mixed 4x100m relay teams register big progress | Other Sports News
-

 Business6 days ago
Expert Picks for Every Need
-

 Tech2 days ago
How Long Can You Drive With Expired Registration? What Florida Law Says
-

 Business5 days ago
No Jackpot Winner, Prize to Climb to $231 Million
-

 Fashion4 days ago
Massimo Dutti Offers Inspiration for Your Summer Mood Board
-

 Fashion2 days ago
Let’s Discuss: DEI in 2026
-
Politics7 days ago
Wings Over Scotland | The quality of mercy
-

 Crypto World2 days ago
Bitcoin recovers as US and Iran Agree a Ceasefire Deal
-

 Business5 days ago
Akebia Therapeutics, Inc. (AKBA) Discusses Pipeline Progress and Strategic Focus on Kidney Disease Treatments at R&D Day – Slideshow
-

 Politics7 days ago
Why so many children are now classified as ‘disabled’
-

 Crypto World14 hours ago
Canary Capital Files SEC Registration for PEPE ETF
-

 Politics6 days ago
The UK should not pay a penny in slavery reparations
-

 Politics7 days ago
Nuclear rockets, moon bases and NASA’s Mars plan
-

 Tech7 days ago
The Threadless Ball Screw Never Took Off, But Don’t Write It Off
-
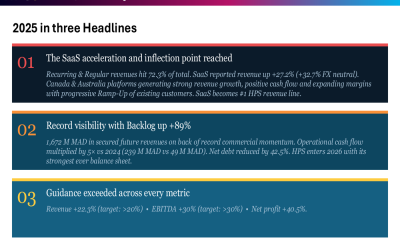
 Business7 days ago
HPS FY 2025 slides: SaaS inflection drives 22% revenue growth
-

 Fashion7 days ago
Tory Burch’s Spring 2026 Campaign Goes on a Getaway
-

 Fashion7 days ago
Frugal Friday’s Workwear Report: Hammered Metallic Button Sweater Vest
-

 Fashion6 days ago
Weekly News Update, 4.3.26 – Corporette.com
You must be logged in to post a comment Login