
CryptoCurrency
XRP Maintains $2 Support as Volume Metrics Show Balanced Market Conditions

TLDR:
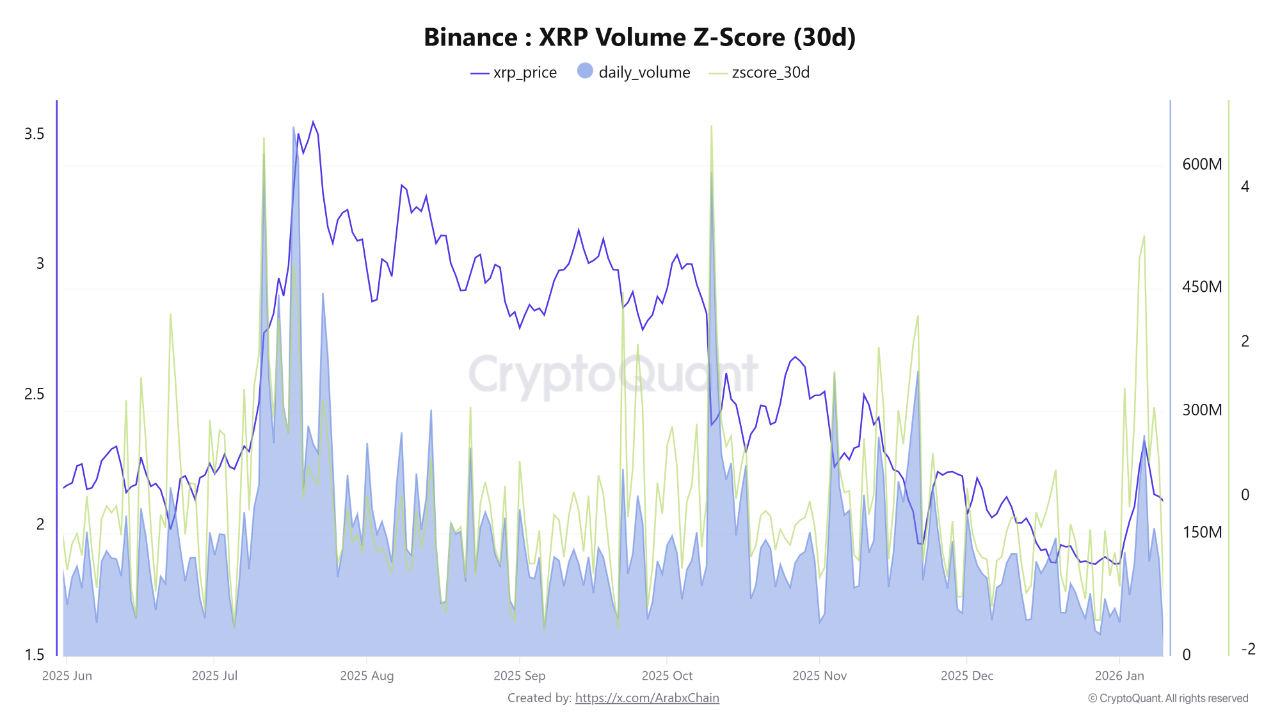
- XRP’s 30-day volume Z-score stands at 0.44, reflecting slightly above-average activity within the normal range.
- Current trading volume indicates balanced buyer-seller dynamics rather than speculative-driven price movements.
- Z-score readings above 1.5 or 2 would signal new liquidity inflows and potentially stronger upward momentum ahead.
- The market appears to be in a consolidation phase, requiring clear volume confirmation before any significant directional move.
XRP maintains its position above the $2 threshold as Binance data reveals a moderate trading volume Z-score of 0.44.
The metric suggests balanced market conditions without speculative excess, indicating a period of stability rather than heightened volatility.
Trading Volume Remains Within Normal Range
The 30-day Z-score for XRP trading volume currently stands at 0.44, according to Binance exchange data. This reading indicates that current trading activity exceeds the 30-day average by a modest margin.
However, the volume level remains firmly within normal parameters and shows no signs of unusual market behavior.
Z-score values above +2 typically represent significant capital inflows or sharp speculative surges in the cryptocurrency markets.
Source: Cryptoquant
Conversely, negative readings point to clear signs of reduced trading activity and market disengagement. The current 0.44 reading falls into what analysts classify as the positive neutral zone.
The absence of elevated Z-score readings suggests XRP’s recent price stability above $2 stems from balanced trading dynamics.
Market participants on both sides appear relatively matched in their activities. This pattern differs markedly from price movements driven by speculative frenzies or panic selling.
Market Consolidation Phase Potentially Underway
The current volume characteristics point to a possible consolidation or accumulation phase following earlier volatility periods.
Such Z-score levels frequently emerge during anticipation phases before larger directional moves materialize. Market observers note these conditions often precede significant price action once clarity emerges.
A subsequent price increase accompanied by Z-score readings climbing above 1.5 or 2 would signal fresh liquidity entering the market.
This combination typically marks the beginning of stronger upward trends with sustainable momentum. Traders often monitor these threshold crossings as confirmation signals for position adjustments.
Alternatively, declining trading volume and Z-score readings approaching zero or negative territory could indicate shifting market dynamics.
Such conditions may lead to increased downward price pressure or extended sideways trading patterns. The market would likely require external catalysts to break from range-bound behavior under these circumstances.
The present Z-score reading offers no definitive directional signal for immediate trading decisions. Rather, it confirms relative market stability at current price levels.
Any substantial move forward will require clear volume confirmation before technical analysts can validate the trend. Market participants should monitor both price action and volume metrics for emerging patterns.


