
Crypto World
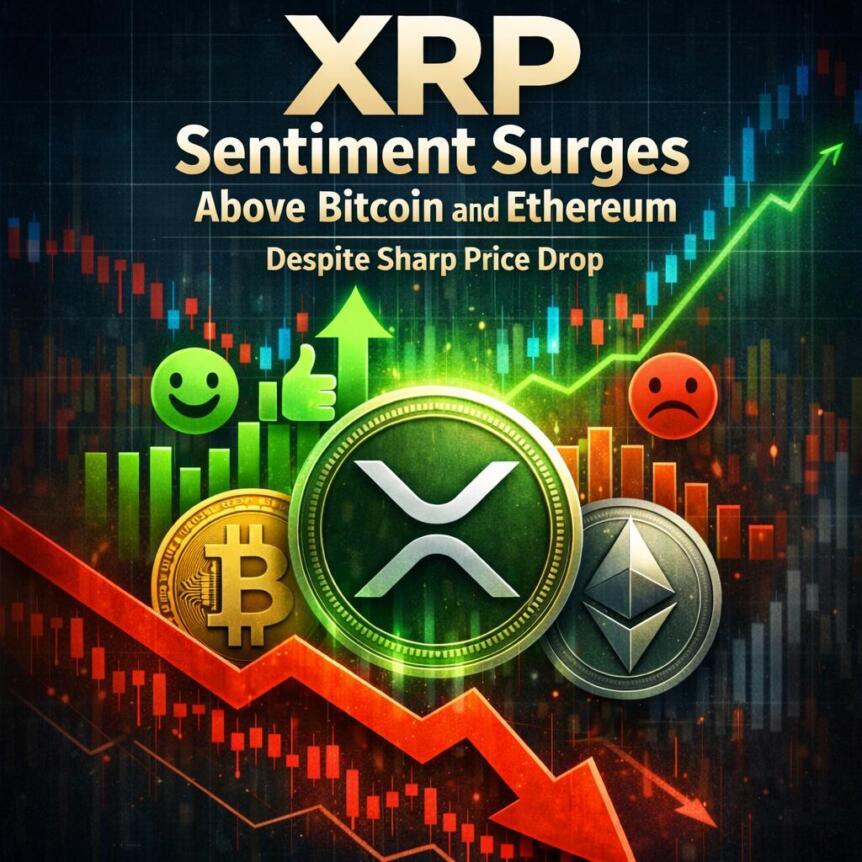
XRP Sentiment Beats Bitcoin and Ethereum Despite Price Drop
TLDR
- XRP sentiment beats BTC and ETH even as price drops and sell pressure rises
- Strong XRP optimism clashes with losses and heavy exchange inflows
- XRP mood surges above rivals while on-chain data signals weakness
XRP shows stronger trader sentiment than major rivals even as prices slide across the crypto market. Recent analytics place XRP well above Bitcoin and Ethereum on social mood indicators. Price action and on-chain signals still reflect pressure, and momentum remains uneven.
XRP Sentiment and Market Structure
Santiment data ranks XRP with a Positive/Negative sentiment score far above competing large-cap assets. The reading stands above Ethereum and Bitcoin even after a notable weekly decline. Yet XRP lost more value than both peers during the same period.
The price fell over six percent during the past week, and losses exceeded market averages. However, social platforms continue to reflect higher confidence around XRP than other major tokens. This divergence creates tension between sentiment readings and real trading behavior.
On-chain metrics add pressure because unrealized losses now outweigh profits across many wallets. Glassnode data shows XRP approaching levels associated with capitulation cycles in past downturns. Meanwhile, loss-heavy transactions dominate flows, and panic selling continues to outpace profitable exits.
Bitcoin Holds Preference During Market Weakness
Bitcoin sentiment trails XRP, yet market structure still favors Bitcoin during broad risk-off conditions. The Altcoin Season Index places the market firmly inside a Bitcoin-dominated phase. Traders prefer relative stability, and capital rotates toward larger assets during stress.
The Crypto Fear and Greed Index recently printed one of its lowest readings in months. That score signals strong fear, and it reflects hesitation across the wider crypto environment. Such conditions often appear near short-term bottoms, yet volatility remains elevated.
Market commentators note that weakness has persisted for several weeks across major tokens. Some analysts frame the period as an extended cooling phase after earlier rallies. Even so, Bitcoin continues to anchor liquidity, and it attracts defensive positioning during uncertainty.
Ethereum Tracks Broader Risk Sentiment
Ethereum sentiment sits between Bitcoin and XRP, yet it fails to match XRP’s social strength. Weekly performance shows Ethereum declining close to five percent alongside Bitcoin. This parallel movement confirms Ethereum’s alignment with overall market direction.
Network activity remains steady, yet speculative appetite has cooled across decentralized finance segments. Lower transaction enthusiasm reflects reduced risk tolerance, and capital rotates toward safer positions. Ethereum mirrors that caution because traders scale back aggressive exposure.
Exchange flows across major assets show rising balances that often precede additional selling pressure. XRP recorded significant inflows, and Ethereum followed a similar exchange pattern. Unless buying activity returns, both assets may struggle to establish firm support levels.


Key Takeaways
- Red Cat shares rose approximately 12% Wednesday, nearing the 52-week peak of $18.78
- Fourth-quarter revenue projections range from $24M to $26.5M, representing a 1,842% increase from last year’s $1.3M
- Fiscal 2025 revenue outlook of $38M–$41M represents more than double the $15.6M recorded in 2024
- The company’s SRR Tranche 2 agreement with the U.S. Army has grown to approximately $35M in value
- Wall Street analysts maintain a consensus “Hold” rating with a mean price target of $19.33
Red Cat Holdings experienced another strong trading session on Wednesday, with shares advancing roughly 12% during intraday action. The stock reached the $18.10–$18.13 zone as investors awaited the company’s fourth-quarter financial results scheduled for release after market close.
The market’s enthusiasm stems from impressive preliminary figures. In January, the drone manufacturer issued Q4 revenue projections of $24M to $26.5M. Analyst consensus estimates entered the quarter at roughly $23.95M, placing the company’s own forecast comfortably above Street expectations.
To put this in perspective, fourth-quarter 2024 revenue totaled just $1.3M. The projected year-over-year expansion rate of 1,842% is extraordinary by any measure.
For the full 2025 fiscal year, Red Cat anticipates revenue between $38M and $41M — a significant jump from 2024’s $15.6M, exceeding the guidance parameters established last November.
The Growth Catalysts Behind Red Cat’s Performance
The company’s revenue acceleration traces primarily to its U.S. Army Short Range Reconnaissance (SRR) Tranche 2 agreement. Initially secured as a Limited Rate Production contract in July 2025, this deal has expanded to roughly $35M in total value. The contract focuses on Red Cat’s Teal drone technology.
Third-quarter results already telegraphed the coming momentum shift. That period delivered $9.6M in revenue — a 646% year-over-year jump and 200% sequential increase — surpassing analyst forecasts. Following those results, management upgraded Q4 guidance, with CEO Jeff Thompson stating the upcoming quarter would generate “more revenue in one quarter than we have ever done in a 12 month period.”
Thompson also emphasized the Black Widow drone platform as the current primary revenue generator. This system recently gained approval for inclusion in the NATO NSPA catalog, enabling procurement by NATO member states and allied nations.
Beyond terrestrial applications, the company has diversified into new verticals. Its newly launched Blue Ops maritime division represents what Thompson called “perhaps the most exciting strategic expansion” for the business.
Wall Street and Institutional Positioning
Ladenburg Thalmann lifted its RCAT price objective from $15 to $20 in a March 3 research note, maintaining a “Buy” recommendation. Needham reaffirmed its “Buy” rating with a $16 target on March 2. Northland Securities maintains the most bullish outlook with a $22 target established in January, while Weiss Ratings takes a contrarian “Sell” position.
The aggregated analyst view stands at “Hold” with a mean price objective of $19.33.
Institutional investors increased their exposure during the fourth quarter of 2024. Invesco expanded holdings by 36.3%, Janus Henderson grew its stake by 29.5%, and Caitong International Asset Management surged its position by more than 1,800%. Institutional ownership currently represents approximately 38% of shares outstanding.
Technically, the stock trades well above both its 50-day moving average of $13.55 and 200-day moving average of $11.00. Wednesday’s 12% advance positions RCAT just below its 52-week high of $18.78.
CFO Chris Ericson observed that the company’s financial metrics demonstrate enhanced operational leverage as manufacturing capabilities expand to accommodate increasing demand.
The post Red Cat Holdings (RCAT) Stock Surges 12% Near 52-Week Peak on Strong Earnings Outlook appeared first on Blockonomi.


The Federal Reserve held its benchmark fed funds rate range steady at 3.50%-3.75% on Wednesday, as expected.
Down nearly 4% ahead of the anticipated decision following a surge in oil prices and poor inflation data earlier on Wednesday, bitcoin remained sharply lower at $71,600 in the moments following the news.
U.S. stocks remain lower for the day, with the Nasdaq and S&P 500 each down by 0.55%. The 10-year Treasury yield remains higher by a tick at 4.21%.
“The implications of developments in the Middle East for the U.S. economy are uncertain,” said the central bank in its accompanying statement.
The vote to hold policy steady was 11-1, with Stephen Miran voting to trim rates by 25 basis points.
The Fed also updated its economic projections. Of particular note was a sizable rise in inflation expectations — now seen at 2.7% for 2026 versus 2.4% previously. Inflation, however, is expected to drop to 2.2% in 2027 against 2.1% projected earlier.
The so-called “dot plot” continues to show expectations for one 25-basis-point rate cut in 2026 and one more in 2027.
The U.S. central bank must balance what appears to be a slowing employment market with inflation that remains well above its 2% target. Adding to that is the March attack against Iran, which has sent the price of oil to nearly $100 per barrel versus less than $60 earlier this year.
Investors will now turn their attention to Federal Reserve Chair Jerome Powell’s post-meeting press conference at 2:30 pm ET for further insight into the central bank’s outlook.


The decentralized finance sector is well accustomed to lightning-fast exploits, with hackers making off with millions in the blink of an eye. However, a recent attack on Venus Protocol was neither quick, nor profitable.
Indeed, the months-long exploit ended with the attacker down $4.7 million… on-chain, at least.
The latest analysis of Sunday’s hack from audit firm BlockSec states that “the on-chain picture is more complex” than the widely-reported $3.7 million hack, and that “both the protocol and the attacker ended up losing money.”
Read more: Oracle error adds to turmoil at DeFi giant Aave
The attack itself was long-planned and involved accumulating Thena’s THE token over nine months. Allez Labs’ technical post mortem describes how the hacker built up considerable THE positions, funded via Tornado Cash.
They then surpassed Venus’ THE supply cap, manipulated the value of their THE used as collateral, and borrowed assets worth almost $15 million against it.
However, BlockSec’s analysis of the on-chain profit-and-loss found that the hacker “invested $9.92 million and retained only ~$5.2 million after all liquidations, an on-chain net loss of ~$4.7 million.”
Despite the on-chain loss incurred, their payoff may have come from off-chain positions, such as centralized exchange accounts.
Venus Protocol itself was left with $2.1 million of bad debt as liquidation bots sold THE collateral into thin liquidity. Allez Labs also notes that the attack vector “was flagged in a 2023 Code4rena audit but dismissed as having ‘no negative side effects.’”
One security researcher claims to have made $15,000 shorting THE whilst tracking the exploit.
Read more: Whitehat hacker accuses Injective of ghosting after $500M bug disclosure
Venus: Too close to the sun
Venus Protocol is the largest lending platform on BNB Chain (formerly Binance Smart Chain), with $1.45 billion in total value locked.
Launched in 2020, it’s seen more than its fair share of trouble over the years.
In September, fears of a $27 million hack turned out to be a Venus user falling for a phishing scam. The protocol was paused and the user’s position was liquidated to recover the stolen funds.
Read more: DeFi exploiter targets lending protocols with oracle tricks
A year ago, the platform incurred $900,000 of bad debt “from an oracle manipulation attack that nobody saw coming… except everyone should have.”
The incident’s post mortem report put the blame on “Mountain’s WUSDM Exchange Rate Oracle.”
In 2023, the protocol braced for the liquidation of $150 million in BNB from 2022’s $600M hack of the BNB Bridge.
Venus was one of many protocols affected by the fallout of 2022’s LUNA meltdown. It accrued $14 million in bad debt when a Chainlink price feed for LUNA bottomed out.
Finally, volatility on its native token XVS led to $200 million in liquidations and caused $90 million in bad debt back in 2021.
Got a tip? Send us an email securely via Protos Leaks. For more informed news and investigations, follow us on X, Bluesky, and Google News, or subscribe to our YouTube channel.
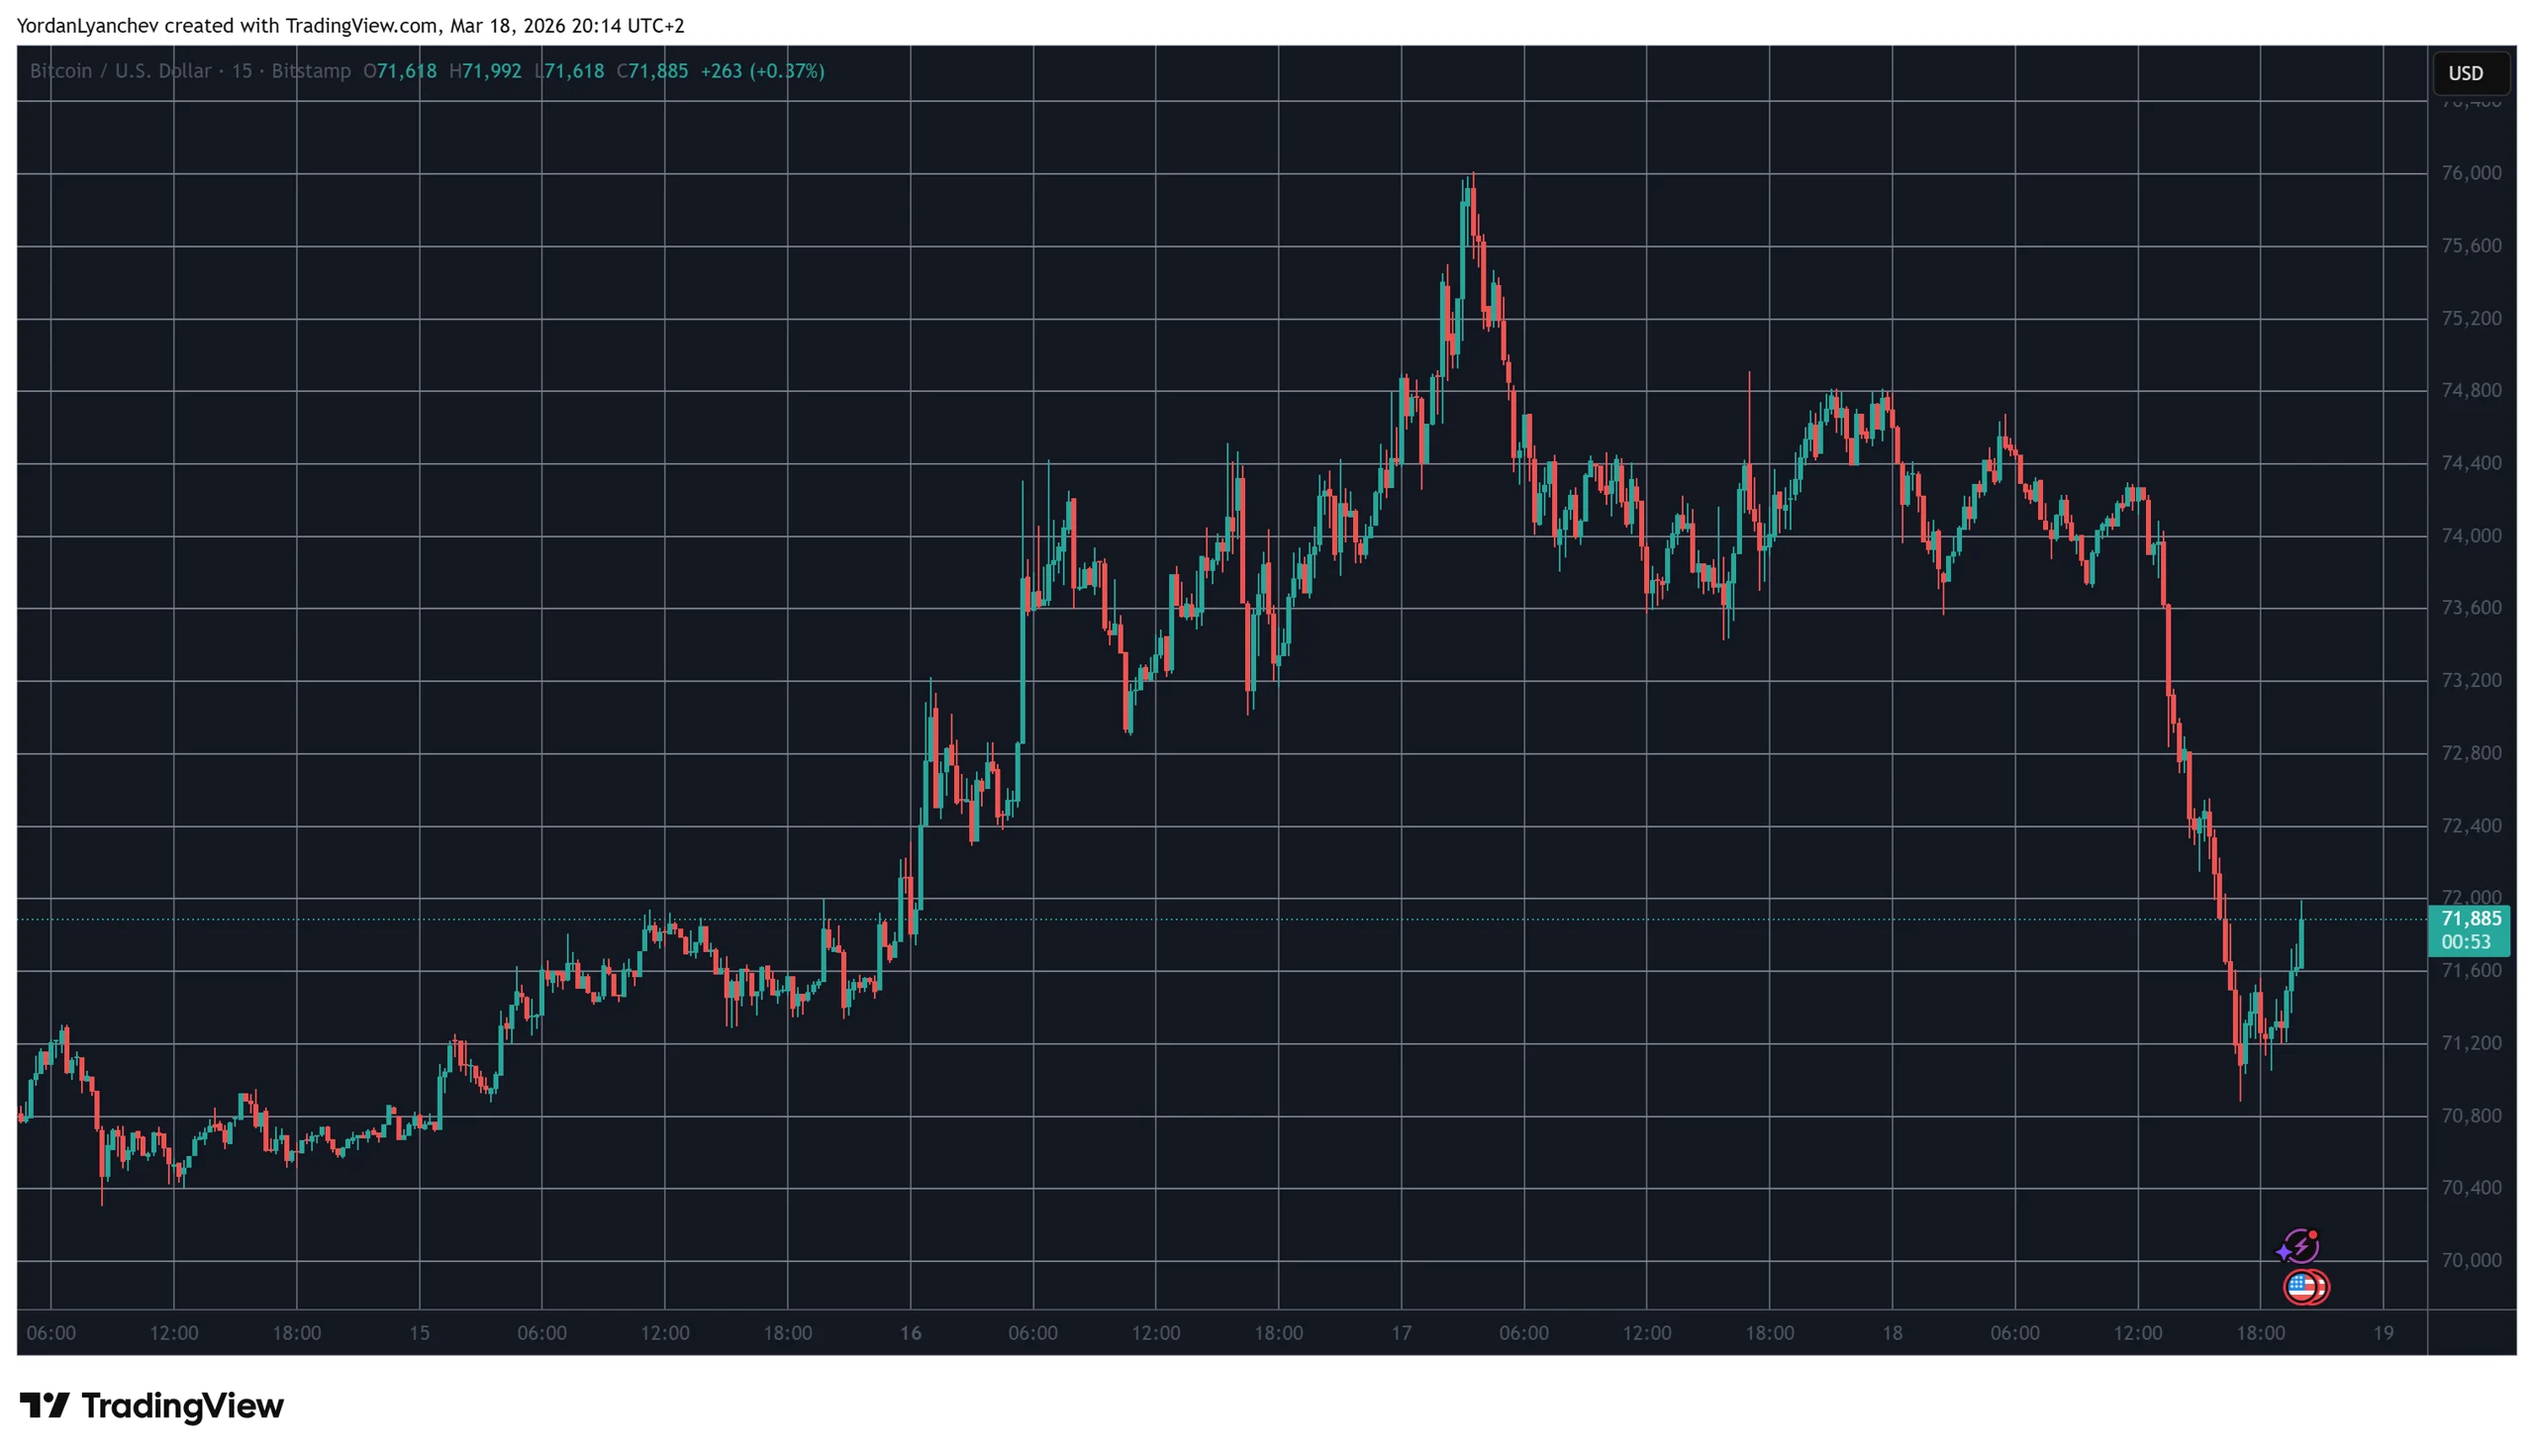
Bitcoin’s (BTC) bullish start to the week faced a halt on Wednesday, as BTC dropped 3.4% to $70,900 alongside an overarching sell-off in US stocks.
The correction followed a hotter-than-expected Producer Price Index (PPI) report, which was 0.7% higher than the 3.4% year-on-year estimate. Despite the selling, data shows BTC spot market demand holding steady, with buyers stepping in to absorb the selling pressure and proof of this appetite being reflected by Bitcoin reclaiming $72,000 after Federal Reserve minutes highlighted their decision to leave interest rates unchanged.
While the market consensus had tilted toward the Fed choosing to pause on interest rate changes, market volatility in oil prices, equity markets, and persistent tension over the recently started US and Israel-Iran war had traders on edge.
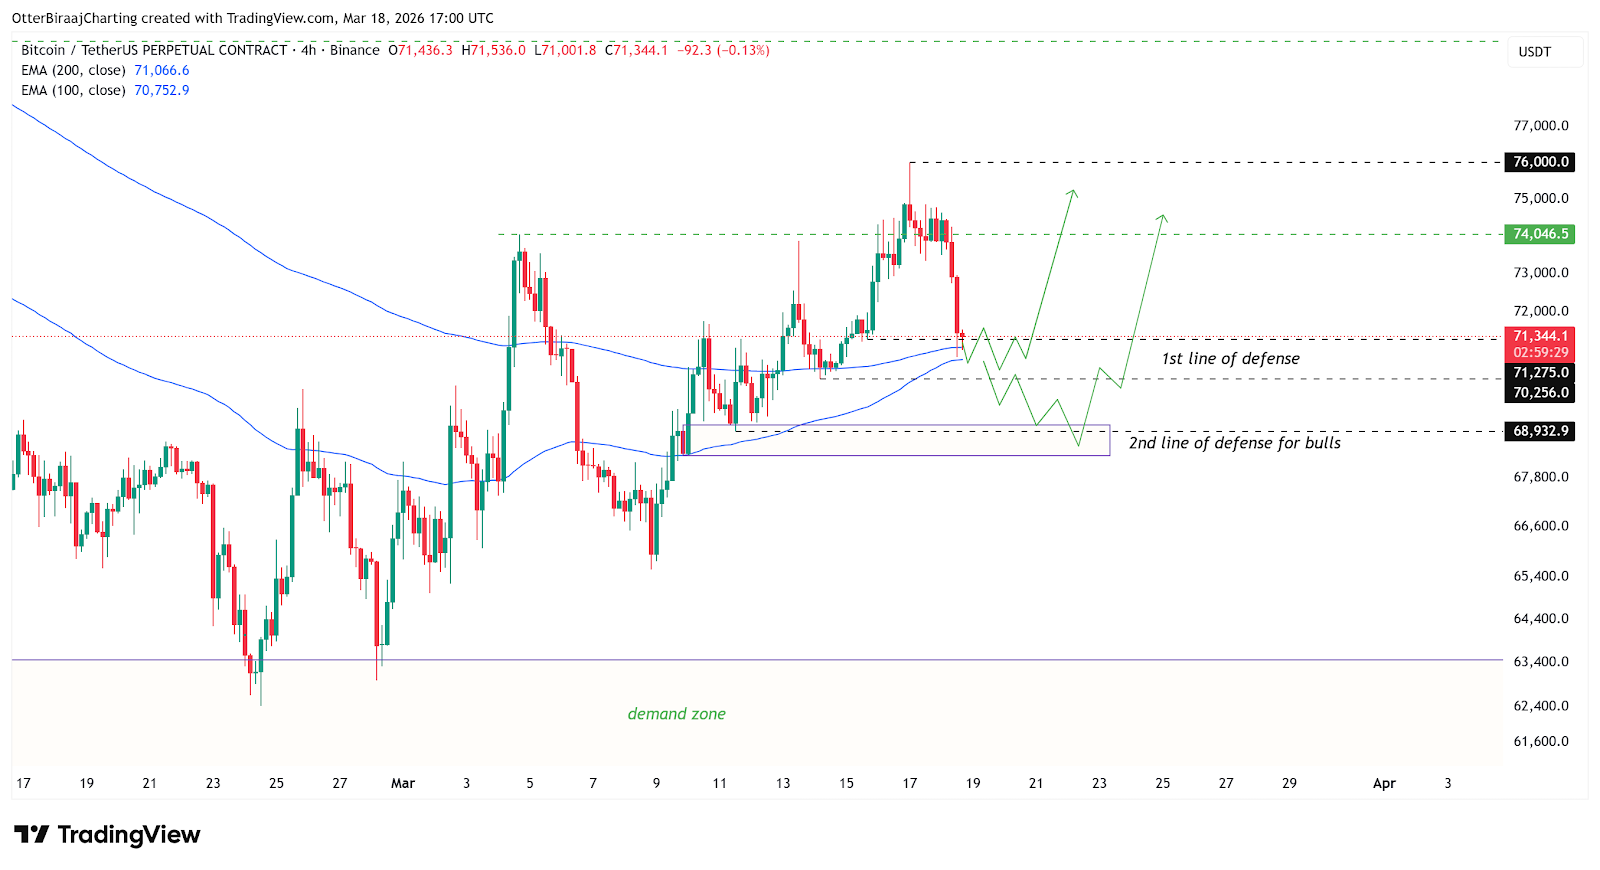
Bitcoin bulls need to defend these price levels
On the four-hour chart, Bitcoin shows a higher low pattern, keeping the short-term uptrend intact. The price action is holding above both the 100- and 200-period exponential moving averages (EMAs), which are acting as dynamic support.
These moving averages track the average prices over time and define the trend direction when aligned below the price.
The confluence may allow BTC to stabilize near $71,000, forming a potential base after today’s sell-off.

From a technical standpoint, BTC needs to defend the $70,250 to $71,275 range, which marks the internal liquidity levels built during Monday’s breakout.
This zone represents the areas where orders were previously filled, possibly attracting a liquidity sweep again.
Losing this range exposes the next liquidity pocket near $68,900. That level aligns with a small order block between $68,300 and $69,100, where prior demand briefly absorbed the selling pressure.
Maintaining these levels keeps the lower time frame trend structurally bullish for BTC, with higher lows signaling continued demand on dips.
Related: Bitcoin tests fresh decoupling trade as tech correlation drops to 2018 lows
Bitcoin profit-taking meets bid absorption under $74,000
Prior to today’s correction, Bitcoin onchain data pointed to rising sell-side activity from short-term holders (STHs) on Tuesday. According to crypto analyst Darkfost, over 48,000 BTC in profit moved to exchanges in a single day as the price approached $75,000. This indicated that the buyers continued to lock in gains, treating the price rebounds as exit opportunities.
At the same time, CoinGlass data shows passive bids being filled during the drop to $71,000 from $74,000. Similar absorption patterns over the past two weeks have preceded short-term recoveries, highlighting consistent demand at lower levels.

Meanwhile, BTC’s reaction to the previous Federal Reserve meetings added insight. Market analyst Sherlock said that since June, 2025, Bitcoin has declined after each of the last six Federal Open Market Committee (FOMC) meetings, regardless of rate direction.
With the markets pricing in another hold on interest rates, traders’ attention may shift to how Bitcoin price reacts around current liquidity clusters, especially near $71,000.

Related: Bhutan offloads an additional $72.3M Bitcoin amid market downturn
This article does not contain investment advice or recommendations. Every investment and trading move involves risk, and readers should conduct their own research when making a decision. While we strive to provide accurate and timely information, Cointelegraph does not guarantee the accuracy, completeness, or reliability of any information in this article. This article may contain forward-looking statements that are subject to risks and uncertainties. Cointelegraph will not be liable for any loss or damage arising from your reliance on this information.
Bitcoin’s price tumbled before the news went out but it staged a minor recovery.
In alignment with most experts’ beliefs, the United States Federal Reserve kept the key interest rates unchanged for the second consecutive time in 2026.
BTC already experienced some volatility in the hours leading up to the second FOMC meeting of the year, dropping by $5,000 at one point. However, it has bounced toward $72,000 since the news went out.
America’s central bank maintained the federal funding rate, meaning what banks are charging each other for short-term loans, in the current range between 3.50% and 3.75%.
Experts noted before today’s announcement that the likely justification for this is the war that began in the Middle East, which has immediately impacted oil prices.
“The conflict with Iran has dramatically altered the backdrop to the March Federal Open Market Committee (FOMC) meeting and significantly increases the risks to inflation and the economy,” commented Oxford Economics’ chief US economist, Michael Pearce.
Bitcoin’s price reacted immediately to the news, even though it was expected. The asset had lost $5,000 earlier today in the hours leading up to the second FOMC meeting of the year, but bounced to $72,000 after the Fed’s decision went live.
Binance Free $600 (CryptoPotato Exclusive): Use this link to register a new account and receive $600 exclusive welcome offer on Binance (full details).
LIMITED OFFER for CryptoPotato readers at Bybit: Use this link to register and open a $500 FREE position on any coin!

Key Takeaways
- Cryptocurrency exchange Kraken postpones its anticipated $20 billion public offering due to unfavorable market conditions.
- Strategic acquisitions and platform expansion remain priorities as the company prepares for eventual market debut.
- Reduced trading activity and falling cryptocurrency valuations influence the timing delay.
- While some crypto companies proceed with listings, Kraken opts to wait for improved market sentiment.
- The exchange continues bolstering its infrastructure through key acquisitions ahead of future IPO attempt.
The cryptocurrency exchange Kraken has decided to postpone its public offering plans as digital asset markets experience an extended period of weakness. Following the submission of a preliminary S‑1 registration document to the Securities and Exchange Commission this past November, the company now faces challenging conditions characterized by depressed asset valuations and diminished trading activity.
Payward, the entity behind Kraken, achieved a $20 billion valuation following a successful $800 million capital raise. The financing round included a substantial $200 million investment from Citadel Securities, demonstrating institutional confidence in blockchain technology development. However, the cryptocurrency sector’s turbulence following Bitcoin’s peak price levels has created an unfavorable environment for public offerings.
Executives at the exchange have indicated plans to reconsider the public listing when market fundamentals demonstrate sustainable improvement. The combination of compressed valuations and subdued trading volumes has directly influenced decisions regarding IPO timing. Numerous cryptocurrency enterprises are carefully monitoring market dynamics before proceeding with their own public market debuts.
Cryptocurrency Sector Public Offering Landscape
The previous year witnessed an explosion of crypto-related IPO activity in 2025, with companies collectively securing $14.6 billion in capital. Notable participants included Circle, Bullish, and Gemini. This figure represented a dramatic leap from the modest $310 million accumulated during 2024. Positive regulatory developments from the SEC during that period created momentum for digital asset firms seeking public markets.
Currently in 2026, companies emphasizing infrastructure and compliance capabilities are leading the charge in public offering preparations. These organizations emphasize regulatory adherence, operational stability, and predictable revenue streams. Such characteristics resonate more effectively with conventional public market investors and meet stricter governance requirements.
BitGo emerged as 2026’s inaugural significant cryptocurrency public listing, successfully raising $213 million with shares priced at $18. Subsequently, the stock price declined roughly 44% amid broader market headwinds. This performance demonstrates how sensitive investor sentiment remains to cryptocurrency market fluctuations.
Strategic Positioning and Future Public Market Plans
Kraken has aggressively pursued strategic acquisitions to enhance platform capabilities, completing transactions for NinjaTrader and Backed Finance. The exchange also secured token management specialist Magna to diversify its digital asset service portfolio. Additionally, Kraken launched tokenized equity perpetual futures trading through its xStocks platform for international clients.
The postponement of public listing plans corresponds with organizational restructuring, including the earlier departure of CFO Stephanie Lemmerman this year. Leadership continues assessing optimal market timing for the eventual public debut. The acquisition strategy serves to strengthen operational infrastructure and market positioning ahead of renewed IPO efforts.
Meanwhile, other cryptocurrency platforms such as Securitize are advancing with public offering timelines despite challenging market dynamics. Securitize anticipates receiving SEC clearance and completing its Nasdaq listing during the second quarter. The company’s $225 million private investment in public equity (PIPE) financing provides financial cushioning amid ongoing market uncertainty.
Kraken’s public offering remains suspended as cryptocurrency markets work toward stabilization. Industry observers expect more favorable conditions will eventually emerge, catalyzing additional public offerings. The exchange’s current emphasis centers on operational excellence and sustainable expansion before ultimately pursuing its public market ambitions.

Crypto World
Kalshi co-founder fights back against Arizona’s ‘overstep’ in what a lawyer calls a federal-state turf war


Kalshi co-founder Tarek Mansour has called Arizona’s criminal case against the company a “total overstep,” casting the move as an attack on a federally regulated exchange rather than a standard gambling enforcement action.
Mansour said the charges “have nothing to do with gambling or the merits” and argued that Arizona is trying to short-circuit a broader court fight over who controls prediction markets. Speaking to Bloomberg, he said Kalshi will continue to defend the business even as the legal battle expands.
Kalshi didn’t reply to CoinDesk’s request for comments.
Arizona Attorney General Kris Mayes filed 20 criminal counts against Kalshi this week, accusing the company of operating an illegal gambling business and offering election wagering in the state.
Her office said Arizona law bars both unlicensed wagering operations and election betting.
Kalshi lets users trade contracts tied to real-world outcomes such as elections, sports and economic data. The company says those products are event contracts overseen by the Commodity Futures Trading Commission (CFTC), which recently signaled a more supportive federal stance toward these platforms. Kalshi, along with Polymarket, accounts for the lion’s share of prediction market activity, commanding more than 90% of notional volume, according to Dune data.
In a post on social media, CFTC Chairman Mike Selig called the matter a jurisdictional dispute and said criminal prosecution was “entirely inappropriate.” He said the agency is watching closely and evaluating its options.
The Arizona Attorney General today filed criminal charges against one of our registered exchanges related to prediction markets. This is a jurisdictional dispute and entirely inappropriate as a criminal prosecution. The @CFTC is watching this closely and evaluating its options.
— Mike Selig (@ChairmanSelig) March 17, 2026
State officials in Arizona and elsewhere have argued that some of them look more like wagers and should fall under state gambling rules.
That split now sits at the center of a larger national fight involving various states, including New York, Tennessee, and Massachusetts. Most state actions against Kalshi so far have relied on cease-and-desist orders, injunction requests or civil claims. Arizona’s case goes further by bringing criminal charges.
“It’s not surprising at all that states would bring new tools to bear in attempting to chill the federally regulated markets,” Aaron Brogan, founder and managing attorney of Brogan Law PLLC, told CoinDesk. “Because there is a fundamental conflict between states, which regulate and draw tax revenue from state-regulated gambling markets, and these federally regulated markets that are outside of state control.”
To Brogan, the question is ultimately whether or not federal law applies, meaning at the end of the day, “ this is a dispute between the federal government and state government and that’s where it should be determined.”


Visa Crypto Labs has launched an experimental product that lets AI agents make payments directly from the command line, without API keys or pre-funded accounts.
Visa has unveiled Visa CLI, the first product out of its newly branded Visa Crypto Labs division, targeting the emerging market for AI agent payments. The tool is currently in closed beta, with access available by request through GitHub authentication.
The product positions Visa’s payments infrastructure as a native layer for “command line commerce” — a term Cuy Sheffield, Visa’s head of crypto, has used to describe a new era in which AI agents transact autonomously rather than humans navigating web interfaces. The CLI tool is designed to let agents pay for external API calls on demand, removing the need for pre-configured accounts or credentials.
Initial use cases listed on the product page include image-generation APIs, music-generation endpoints, and proprietary data feeds, such as market data and research databases, locked behind paywalls.
The launch arrives as incumbent payment networks converge on agentic commerce from multiple angles. Stripe’s Tempo blockchain launched its mainnet today, simultaneously unveiling the Machine Payments Protocol, an open standard for agent-to-service micropayments that lets agents authorize a spending limit upfront and stream payments continuously.
Mastercard last week unveiled Verifiable Intent, an open trust framework co-developed with Google that creates a cryptographic record of what a user authorized when an AI agent acts on their behalf.
Meanwhile, Circle launched Nanopayments on testnet last week, built on the x402 standard, designed for sub-cent, gas-free USDC transactions for AI agents paying for pay-per-call APIs without accounts or credentials.
The competing approaches reveal a fault line emerging in how the industry envisions settling agent payments. Traditional finance players are building trust layers on top of existing payment rails, while crypto proponents argue blockchain infrastructure is better suited to a world where AI agents are first-class economic actors — a point underscored by Coinbase CEO Brian Armstrong, who noted that AI agents can own crypto wallets but cannot open bank accounts.
Visa CLI straddles that divide: card network rails with a developer-native, command-line interface designed for the same autonomous agent use cases crypto protocols are targeting.
This article was written with the assistance of AI workflows. All our stories are curated, edited and fact-checked by a human.

Crypto cards have gained attention as a convenience layer for spending digital assets, but a prominent founder argues they’re a transitional interface built on legacy rails. In a recent perspective, Vikram Arun, co-founder and CEO of Superform, makes the case that the real innovation lies in on-chain credit—where users can spend against productive, yield-bearing assets without selling them, and where risk is governed in public, transparent ways.
Arun’s central thesis is simple: the card is not the product. The true value comes from a credit line calibrated against a user’s on-chain balance sheet. As wallet infrastructure matures and on-chain credit becomes more capable, crypto cards risk becoming obsolete as a spender’s primary connection to value, replaced by systems that treat the card as a thin interface atop robust on-chain lending primitives.
Key takeaways
- Current crypto cards force asset liquidation to enable spending, creating taxable events and a false choice between liquidity and ownership.
- On-chain credit allows users to deposit yield-bearing assets, borrow against them, and spend without selling, so assets keep earning while debt increases with usage.
- Yield-bearing assets—such as certain stablecoins and DeFi positions—can provide meaningful returns (roughly 5% yield on staking-like yields, with DeFi strategies fluctuating around 5%–12%).
- Collateral can be diverse and productive, including vault shares, yield-bearing dollars, U.S. Treasuries, and strategy positions, enabling continuous earning until liquidation is required.
The problem with current crypto cards
According to Arun, today’s crypto cards rely on traditional financial rails: banks issue the cards, Visa or Mastercard anchor the networks, and compliance standards mirror conventional finance. This arrangement pushes users toward liquidating crypto to fiat to cover everyday purchases, which undermines the very premise of holding crypto-as-ownership.
From a tax perspective, the U.S. Internal Revenue Service treats conversions from cryptocurrency to fiat as taxable disposals. In practice, that means many routine purchases can trigger capital gains reporting, extracting value from productive holdings rather than letting assets compound. Even the revenue model for card issuers hinges on interchange fees—roughly 1% to 3% per transaction plus fixed fees—sustained by the existing interchange ecosystem. In short, the underlying architecture remains tethered to legacy liquidity and fee structures that reward selling over earning.
While the surface may appear decentralized, the dependencies run deep. The system’s friction comes not only from taxation and spend mechanics but from the incentive alignment that privileges immediate liquidity over long-term yield. The consequence is a spend interface that is compelling in the moment but structurally negative-sum for asset holders over time.
On-chain credit fixes these issues
The proposed alternative flips the paradigm. Instead of liquidating holdings to spend, users deposit yield-bearing assets and access a credit line against them. As the card is swiped, the user’s debt rises, yet the deposited assets continue to earn, and no asset is sold unless repayment fails. In this model, the “card” serves as an authorization surface, while the true product is the on-chain credit line, governed by transparent, programmable rules.
With on-chain credit, the spend is backed by a continually priced balance sheet. There are no forced conversions and no idle balances draining potential returns. Yield-bearing stablecoins can deliver about 5% yields, and DeFi lending and staking protocols historically offer roughly 5% to 12% returns depending on demand and incentive structures. This arrangement keeps users’ purchasing power intact while their assets keep generating value.
Crucially, this approach expands the set of eligible collateral beyond cash equivalents. Vault shares, yield-bearing dollars, Treasury-backed tokens, and strategy positions can all serve as collateral, allowing productive assets to compete for inclusion. The result is a system where the objective is to maximize productive use of capital, not simply convert assets into spendable fiat.
The card is just an interface
Under on-chain credit, the card becomes one of many possible interfaces to access credit. The essential question shifts from “What can I spend?” to “What can safely secure my credit?” Eligibility hinges on continuous pricing of collateral, risk bounds that are defined and enforced on-chain, and deterministic liquidation rules rather than discretionary, opaque risk assessments.
As Arun points out, the interface—whether a card, API, or wallet integration—can evolve without altering the core credit mechanism. If credit logic lives on-chain, cards become optional conveniences rather than essential rails. The same real-time authorization and risk checks can operate through programmable interfaces, while the collateral remains under the user’s control and continues to earn yield.
Visa’s recent coverage on crypto card usage—where spending surged in a growing ecosystem—illustrates both demand and friction: users want convenience, but the underlying model still adheres to traditional financial incentives. The move toward on-chain credit seeks to align incentives with user value: spending should not force asset liquidation, and risk should be transparent and governed by the community rather than a closed committee.
Managing risk through transparency
Risk and volatility are the immediate questions raised by any on-chain credit design. If collateral fluctuates, how can users avoid liquidation during a grocery run? The proposed solution is governance-driven conservatism: pre-set loan-to-value ratios that cap borrowing against collateral, paired with continuous pricing to reflect real-time risk. As collateral accrues yield, the buffer against liquidation can grow automatically, reducing sudden forced liquidations.
Unlike traditional credit models that mask risk behind adjustable rates and opaque terms, on-chain credit makes risk explicit. Governance parameters determine acceptable collateral types, pricing models, risk tolerances, and liquidation triggers. This transparency allows participants to opt in with a clear understanding of how their assets are protected (or liquidated) under stress scenarios.
In this framework, the card ceases to be the central product and becomes a user-friendly access point to a broader, programmable credit system. The long-term implication is a shift away from closed payment rails toward interoperable credit primitives that can be accessed via cards, wallets, or APIs, all anchored to on-chain governance and real-time risk management.
As Arun emphasizes, crypto cards won’t vanish simply because they fail; they’ll fade as on-chain credit proves to be a more productive, efficient, and transparent way to convert value into spendable power. The evolution—wallet-native credit with cards as optional interfaces—reads as a pathway to a more fluid, resilient on-chain economy where spending doesn’t require surrendering ownership prematurely.
Opinion by: Vikram Arun, co-founder and CEO of Superform.
The conversation around on-chain credit is ongoing. As wallets become more capable and the broader ecosystem experiments with programmable lending, readers should watch how governance frameworks mature, how collateral types expand, and how real-world spending adapts to a system that prioritizes continuous yield and transparent risk.

SBI Holdings’ crypto arm, SBI VC Trade, is rolling out a USDC lending product in Japan, enabling retail users to lend Circle’s stablecoin to the platform under fixed-term agreements in exchange for interest. The offering limits per-user exposure to 5,000 USDC, with the loan treated as an asset to SBI VC Trade rather than a traditional bank deposit. As such, customers bear counterparty risk, and funds cannot be withdrawn or transferred during the fixed term. SBI noted that borrowed USDC may be re-lent as part of its operational use.
The launch represents another step in Japan’s ongoing stablecoin rollout, bringing a consumer-accessible USDC yield product to market via a licensed domestic platform. While the product offers yield relative to typical cash deposits, it carries different protections and risk profiles compared with traditional deposits, a distinction SBI emphasized in its communication with users.
Key takeaways
- SBI VC Trade introduces a USDC lending product in Japan, offering fixed-term yields to retail users with a maximum of 5,000 USDC per offering.
- Participants lend USDC directly to SBI VC Trade, meaning they assume counterparty risk rather than enjoying bank-like deposit protections.
- Funds are not withdrawable or transferable during the fixed term, and SBI may re-lend the borrowed USDC as part of its operations.
- The move aligns with Japan’s broader strategy to expand stablecoin use, building on regulatory approvals that allowed a full-scale USDC launch in March 2025 and related partnerships to promote USDC adoption.
- Past milestones include a Circle joint venture announced in August to widen USDC usage in Japan and a December agreement with Startale to explore a yen-denominated stablecoin for tokenized assets and cross-border settlement.
A new yields channel within Japan’s stablecoin push
According to SBI VC Trade, the new USDC lending product is designed as a fixed-term loan to the trading platform. Retail users who participate will receive periodic interest payments, with the caveat that their principal remains tied up for the term’s duration. The 5,000 USDC cap per offering provides a practical limit intended to balance retail participation with the platform’s liquidity management.
From SBI’s perspective, the arrangement enables the company to monetize borrowed USDC through its business operations, which could include further lending or other use of the stablecoin within its ecosystem. For users, the arrangement differentiates itself from a traditional bank deposit by not offering typical deposit protections or insurance and by introducing explicit counterparty risk. The lack of withdrawal or transfer capability during the term further underscores the product’s fixed nature and the need for careful risk assessment by potential participants.
Japan’s evolving stablecoin landscape and SBI’s strategic cadence
Japan’s stablecoin framework has gradually matured over the past year, with USDC receiving regulatory clearance to operate as a fully licensed dollar stablecoin in the country. Circle announced that approval enabled USDC to be used as a fully approved global dollar stablecoin in Japan, marking a notable policy shift toward formalized stablecoin use in consumer and business finance.
In parallel with the USDC licensing progress, SBI has been advancing its broader stablecoin strategy. The firm previously disclosed plans in November to pursue a USDC lending product and to explore exchange-traded fund (ETF) offerings via its domestic network. The trajectory continued with a March 2025 milestone: SBI VC Trade launched a full-scale USDC service in Japan after receiving regulatory clearance earlier in the month, signaling a more formalized entry of USDC into Japan’s financial fabric.
Additionally, SBI’s collaboration slate includes notable partnerships aimed at expanding USDC utility in Japan. In August, SBI announced a joint venture with Circle to accelerate USDC adoption and develop new use cases for the stablecoin within the Japanese market. Later in December, SBI partnered with Startale to develop a regulated yen-denominated stablecoin intended for tokenized assets and settlement on a global scale, with a planned launch in 2026’s second quarter. These developments illustrate SBI’s multi-pronged approach to integrating stablecoins into everyday finance and cross-border settlement workflows.
What this means for users and the market
For retail participants, the new lending product offers a structured pathway to earn interest on USDC holdings, presenting a tangible yield option beyond cash equivalents. However, the fixed-term and counterparty-risk profile differ from traditional deposits. Users should weigh the potential yield against the absence of typical bank protections and the inability to react to market shifts during the term.
From a market perspective, the move reinforces Japan’s position as a testing ground for regulated stablecoins with consumer-facing products. It also underscores SBI’s ongoing commitment to expanding stablecoin infrastructure and use cases—aligning with regulatory clearances and partnerships that broaden USDC’s reach in Japan. For traders and builders, the evolving framework highlights a growing ecosystem where stablecoins can be leveraged beyond transfers and payments, into yield-bearing and asset-financing structures that require robust risk disclosures and clear regulatory alignment.
As SBI continues to expand its stablecoin footprint, observers will be watching for further details on risk management, liquidity provisions, and protection measures for users in future offerings. Market participants will also be keen to see how other licensed players in Japan respond—whether more fixed-term lending or yield-bearing products emerge, and how these services interact with evolving regulatory expectations and consumer protections.
Overall, SBI VC Trade’s USDC lending pilot reflects a broader shift toward productized stablecoin utilities in regulated markets, where consumer access to yields sits alongside explicit risk disclosures and the necessity for strong counterparty governance. The coming months should reveal how this model scales and how users balance return opportunities with the attendant risk framework in one of the world’s most scrutinized crypto jurisdictions.

‘I’m heartbroken’: Sadiq Khan hits back at Tory MP who said mass Muslim prayer he joined was ‘not welcome’

Hewlett Packard Enterprise's AI Story Moved To The Network Layer
Red Cat Holdings (RCAT) Stock Surges 12% Near 52-Week Peak on Strong Earnings Outlook

Smart energy pays enters the US market, targeting scalable financial infrastructure

Why Israel is blocking foreign journalists from entering

Bitcoin: We’re Entering The Most Dangerous Phase

Are Students Ready for $100K in Debt? | Financial Literacy & College Reality | About Your House Radi

Crypto Gold Live Trading 10 March – stock_learners

RIA RICIS BAGI THR BUAT ORANG TERTENTU #youtubeshort #riaricisbagiTHR #money #moneymindset #uangasli
-
Crypto World5 days ago
HYPE Token Enters Net Deflation as HyperCore Buybacks Outpace Staking Rewards
-

 Tech3 days ago
Your Legally Registered ‘Motorcycle’ Might Not Count Under Proposed US Law
-

 Fashion5 days ago
Weekend Open Thread: Addict Lip Glow
-

 Sports7 days ago
PWHL, Senators discussing plan to keep Charge in Ottawa
-
Sports4 days ago
Why Duke and Michigan Are Dead Even Entering Selection Sunday
-

 Business3 days ago
Search for Savannah Guthrie’s Mother Enters Seventh Week with No Arrests
-
 Tech1 day ago
Are Split Spacebars the Next Big Gaming Keyboard Trend?
-

 Business4 days ago
US Airports Launch Donation Drives for Unpaid TSA Workers as Partial Government Shutdown Enters Fifth Week
-
Crypto World4 days ago
Coinbase and Bybit in Investment Talks: Could Bybit Finally Enter the US Crypto Market?
-

 Business4 days ago
Country star Brantley Gilbert enters growing non-alcoholic beer market
-

 Business2 days ago
Australian shares drop as Iran war enters third week
-

 Crypto World2 days ago
Crypto Lender BlockFills Enters Chapter 11 with Up to $500M in Liabilities
-

 Sports5 days ago
College Basketball Best Bets: Conference Tournament Semifinal Picks
-

 Politics9 hours ago
The House | The new register to protect children from their abusers shows Parliament at its best
-

 Crypto World7 days ago
Three Binance Charts May Be Hinting at Bitcoin’s Next Move
-

 Business6 days ago
Trump demands Powell cut rates as Iran conflict raises energy prices
-

 Crypto World6 days ago
Senate Votes to Include CBDC Ban in Bipartisan Housing Bill
-

 Fashion2 days ago
25 Celebrities with Curly Hair That Are Naturally Beautiful
-

 News Videos2 hours ago
RBA board divided on rate cut, unusually buoyant share market | Finance Report | ABC NEWS
-

 NewsBeat6 days ago
Deane Road crash near Bolton colleges and university


You must be logged in to post a comment Login