
Crypto World
XRP signals recovery as higher lows and ETF inflows boost bullish momentum


- XRP price forms higher lows, signalling growing buying interest.
- XRP ETF inflows show steady institutional accumulation.
- The key levels to watch are the support at $1.13 and the resistance at $1.46–$1.83.
XRP is showing signs of a potential recovery after recent price action indicated that buyers are stepping in at key support levels.
The cryptocurrency recently bounced off the $1.33–$1.35 zone, forming higher lows over the past week. This pattern suggests that sellers are losing strength, while buyers are gaining confidence.
Trading activity has also increased, with a notable surge in spot purchases on major exchanges. Retail investors are showing renewed interest, pushing buy orders above sell orders in several short-term periods.
Institutional flows are adding further support with XRP-linked ETFs attracting consistent inflows, indicating that larger players are accumulating the token.
This combination of retail buying and institutional accumulation creates a favourable environment for a potential upswing.
Technical signals suggest price stabilisation
From a technical standpoint, XRP has established a short-term support around $1.13. This level has held firm despite some volatility, preventing further downside.
If this support continues to hold, it could act as a springboard for higher prices.

On the upside, the $1.5121 level has emerged as a key resistance.
Breaking above this zone could pave the way for moves toward $1.66, with a further resistance level at $1.83.
Historical price behaviour shows that surpassing $1.51 often opens the door for more substantial gains.
Below the short-term support, another historical support exists around $0.8475. This deeper level could act as a safety net if XRP were to face selling pressure.
For now, however, the token remains above its critical floors, suggesting that the market is stabilising.
Volume trends reinforce the positive outlook.
Recent surges in buying activity have been accompanied by elevated trading volume, a strong indicator that the momentum is supported by actual market participation rather than isolated trades.
Higher lows, in particular, signal that buyers are willing to step in at progressively higher prices.
This is a classic indicator of strengthening market sentiment and often precedes more sustained upward movements.
XRP price outlook
Overall, the combination of higher lows, robust ETF inflows, and strong trading volume points to a market that is gradually recovering.
According to analysts, the immediate support sits at $1.13, with $0.8475 as a more distant buffer, while the key resistance levels to monitor include $1.46, $1.66, and $1.83.
A break above $1.46 could trigger further gains toward higher targets, while holding support at $1.13 may confirm that the market has stabilised.
Conversely, a drop below $1.13 could see XRP retest lower support zones, potentially putting short-term momentum at risk.

Crypto World
CoreWeave (CRWV) Stock Surges 11% on Major Anthropic and Meta Contracts Despite Executive Share Sales

Key Takeaways
- CoreWeave shares surged nearly 11% to $102 following a strategic cloud partnership with Anthropic and a massive $21B Meta contract expansion
- Chief Operating Officer Sachin Jain offloaded 3,953 shares at $92 per share on April 8, generating proceeds of $363,676 through a pre-scheduled trading plan
- Executive Brian Venturo liquidated 61,747 shares at $89.22 each for approximately $5.51M, trimming his holdings by over 21%
- Quarterly revenue jumped 110.4% to reach $1.57B, though earnings per share fell short of expectations with continued losses
- The company issued $3.5B in convertible debt plus $1.75B in senior notes carrying a 9.75% rate, intensifying balance sheet concerns
Shares of CoreWeave (CRWV) reached $102 on April 11, marking an increase of approximately 11% from the $92 level where its Chief Operating Officer had liquidated shares mere days before. Market activity spiked dramatically with 83.2 million shares changing hands — far exceeding the typical daily volume of 22.6 million.
CoreWeave, Inc. Class A Common Stock, CRWV
The share price surge stemmed from a pair of significant business developments. The company announced a multiyear cloud services agreement with Anthropic to support the computational needs of Claude AI models. Infrastructure capacity associated with this partnership is scheduled to become operational in the latter half of this year.
Additionally, CoreWeave revealed a $21 billion extension to its current arrangement with Meta, pushing total Meta-related commitments to $35.2 billion extending through 2032. Meta’s contracts now represent approximately 40% of the company’s pro-forma backlog, which totals roughly $87.8 billion.
Cantor Fitzgerald initiated research coverage during the week with an Overweight recommendation and established a $149 price objective, highlighting the Anthropic agreement as a near-term growth driver. Evercore ISI maintained its Outperform stance with a $120 target following the announcement.
Skepticism remains among certain analysts, however. Sanford C. Bernstein maintains an Underperform rating with a $56 price objective. Stifel assigned a Hold recommendation alongside a $110 target. Across the analyst community of 32 firms, 19 recommend buying, 11 suggest holding, and 2 advise selling — producing a consensus price target of $121.65.
Executive Stock Sales Draw Scrutiny
Even as shares climbed, two company insiders executed notable transactions. COO Sachin Jain disposed of 3,953 shares on April 8 at $92 each, realizing proceeds of $363,676. That identical day, insider Brian Venturo sold 61,747 shares at an average price of $89.22, generating $5.51 million and reducing his position by 21.64%.
Both transactions occurred under previously established Rule 10b5-1 trading arrangements, which allow executives to schedule sales in advance to avoid allegations of trading based on material nonpublic information. Jain maintains direct ownership of 122,691 shares following the sale. Venturo continues to hold 223,580 shares worth approximately $19.9 million.
The magnitude of these dispositions has attracted investor attention despite their pre-scheduled nature.
Elevated Leverage Introduces Financial Risk
CoreWeave recently completed pricing on a $3.5 billion convertible senior note offering, expanded from an originally planned $3 billion. The company simultaneously issued $1.75 billion in senior notes maturing in 2031 with a 9.75% coupon, increased from an initial $1.25 billion target. This substantial coupon rate introduces considerable interest obligations to a business that has yet to achieve profitability.
The firm’s debt-to-equity ratio currently registers at 4.46. Both its quick ratio and current ratio stand at 0.46, suggesting constrained near-term liquidity.
During the fourth quarter, CoreWeave generated revenue of $1.57 billion — representing 110.4% growth compared to the prior year. However, the company reported a loss per share of $0.89, missing analyst consensus expectations of $0.61 by $0.28. Net margin settled at negative 22.75%.
The stock has traded between $33.51 and $187.00 over the past 52 weeks. Its 50-day moving average currently sits at $85.40, while the 200-day moving average is positioned at $94.92.
Institutional investment activity has accelerated, with multiple funds establishing or expanding positions during recent reporting periods. ARK Invest has been identified among the institutional buyers.

Crypto World
SanDisk (SNDK) Gains Nasdaq-100 Entry After 2,640% Rally as Wall Street Upgrades Pour In

Key Takeaways
- Nasdaq-100 will add SanDisk (SNDK) and remove Atlassian (TEAM) effective April 20, 2026
- Wall Street analysts boost price objectives: Jefferies to $1,000, Bernstein to $1,250
- The memory stock has exploded 2,640% in twelve months, hovering near $855 peak
- Company commits $1 billion to Nanya Technology partnership, securing roughly 3.9% ownership
- Strengthening NAND pricing and artificial intelligence applications drive bullish outlook
SanDisk (SNDK) has secured a coveted spot in the Nasdaq-100, marking a significant milestone for the memory storage giant. The exchange operator confirmed Friday evening that SanDisk will join the prestigious index when markets open on April 20, 2026, taking the place currently held by Atlassian (TEAM).
This elevation places SanDisk within the exclusive group of the Nasdaq’s 100 biggest non-financial corporations—a designation that carries substantial market implications.
The Nasdaq-100 serves as the foundation for more than 200 investment vehicles, including the widely-held Invesco QQQ Trust. These tracking products collectively manage north of $600 billion worldwide, ensuring that index rebalancing events generate significant automated capital flows.
For SanDisk, inclusion means guaranteed inflows as index-tracking funds recalibrate their portfolios. Conversely, Atlassian will experience programmatic selling as it exits the benchmark. The software collaboration platform makes way as the index composition tilts toward semiconductor and infrastructure companies.
SanDisk’s addition reflects the existing Nasdaq-100 selection criteria, which remain active until April 30, 2026. Market participants are closely monitoring anticipated weighting adjustments before the April 20 implementation.
Wall Street Elevates Expectations
The index announcement arrives amid intensifying bullish sentiment from equity research teams covering SNDK.
Jefferies upgraded its valuation target from $700 to $1,000 while maintaining its Buy recommendation. The investment bank highlighted ongoing customer contract discussions and artificial intelligence infrastructure buildout as factors supporting continued NAND pricing strength and upward earnings adjustments before SanDisk’s quarterly report scheduled for April 30.
Jefferies analyst Blayne Curtis constructed the four-figure price objective using a 10x earnings multiple against projected 2028 earnings per share of $95.26. Curtis also identified forthcoming QLC eSSD deliveries to two major cloud providers as potential catalysts for expanding data center market position.
Bernstein took an even more aggressive stance, escalating its target from $1,000 to $1,250. The firm retained its Outperform rating, emphasizing that NAND flash pricing has exceeded prior expectations as the primary justification.
Morgan Stanley reaffirmed its Overweight stance after recent volatility in semiconductor memory equities, characterizing the pullback as routine consolidation rather than fundamental deterioration. BofA Securities maintained its Buy rating with a $900 valuation, highlighting robust appetite from hyperscale cloud operators and AI inference workloads.
Remarkable Performance and Strategic Investments
SNDK has delivered extraordinary returns. The shares have rocketed 2,640% during the trailing twelve months and currently change hands around $851.77, marginally beneath the 52-week peak of $855. InvestingPro’s Fair Value framework suggests current pricing exceeds intrinsic value.
Consensus estimates project fiscal 2026 earnings per share reaching $42.37, with profitability expected throughout the current year.
On the strategic front, SanDisk disclosed a $1 billion capital commitment to Nanya Technology via private placement. The transaction delivers approximately 139 million Nanya shares to SanDisk, equating to roughly 3.9% of the memory manufacturer’s equity.
SanDisk executives have not issued revised financial guidance in recent investor communications.

Key Takeaways
- Zoom (ZM) finished Thursday’s session down 5.7% at $79.24, significantly worse than the S&P 500’s modest 0.11% decline
- Enterprise software sector weakness stemmed from concerns that AI agents from Anthropic and OpenAI could threaten traditional business models
- Year-to-date, ZM has declined 6.8% and currently trades 19.3% beneath its 52-week peak of $96.22
- Analysts anticipate EPS of $1.41 for the coming quarter, representing a 1.4% year-over-year decline, while revenue is expected to reach $1.22 billion
- The stock trades at a forward P/E of 14.32, notably below the industry benchmark of 17.88
Zoom (ZM) experienced significant selling pressure on Thursday, shedding 5.7% to settle at $79.24. This steep decline stood in stark contrast to broader market performance — the Nasdaq climbed 0.35% while the S&P 500 edged down a mere 0.11%.
The weakness wasn’t isolated to Zoom alone. Enterprise software stocks across the board faced substantial headwinds as market participants grew increasingly anxious about emerging managed AI agents developed by companies like Anthropic and OpenAI. The fundamental concern centers on a simple question: if AI agents can autonomously perform functions currently handled by enterprise software platforms, what happens to the sector’s pricing power and long-term viability?
Zoom found itself swept up in this broader industry downdraft. Beyond sector-wide pressures, the video communications platform continues wrestling with its own unique challenges — persistent competitive threats and lingering uncertainty about sustainable growth trajectories as pandemic tailwinds fade into memory.
Despite Thursday’s setback, a longer view reveals more encouraging momentum. Over the preceding 30 days, ZM climbed 12.13%, substantially outpacing both the Computer and Technology sector’s 0.88% advance and the S&P 500’s 0.51% uptick. While Thursday’s decline put a dent in that rally, it didn’t completely reverse the recent gains.
It’s worth noting that volatility of this magnitude remains relatively uncommon for Zoom. Throughout the past year, the stock has registered just five daily moves exceeding 5%. When such pronounced swings occur, they typically signal meaningful shifts in market sentiment.
Earnings Performance and Analyst Expectations
The most recent comparable move came five months earlier — but in the opposite direction. ZM surged 13.5% following third-quarter results that exceeded Wall Street expectations on both revenue and earnings. The company posted $1.23 billion in revenue against a consensus estimate of $1.21 billion, marking 4.4% year-over-year growth. Adjusted earnings per share reached $1.52, topping analyst projections of $1.44. Management also boosted full-year adjusted EPS guidance to a midpoint of $5.96.
Those solid results provided meaningful support for the stock. Thursday’s reversal suggests investors are once again questioning the durability of that positive momentum.
Looking forward, Wall Street consensus calls for earnings per share of $1.41 in the upcoming quarter — representing a 1.4% contraction versus the prior-year period. Revenue projections stand at $1.22 billion, implying 4.16% year-over-year expansion. For the full fiscal year, analysts are modeling $5.87 in EPS and $5.06 billion in total revenue.
From a valuation perspective, ZM appears attractively priced. The forward price-to-earnings ratio stands at 14.32, meaningfully below the sector average of 17.88. However, the price-to-earnings-growth (PEG) ratio paints a less compelling picture at 3.23 versus an industry norm of 1.0 — indicating skepticism about whether anticipated earnings expansion warrants the current valuation.
Technical Position and Analyst Ratings
From a year-to-date perspective, ZM has surrendered 6.8%. Trading at $79.24, the stock remains 19.3% below its 52-week high of $96.22, established in January 2026.
Zoom currently carries a Zacks Rank of #3 (Hold), with consensus earnings estimates holding steady over the past month.
The Internet – Software industry occupies the 95th position among the 250-plus industries monitored by Zacks, landing it in the top 39% of all tracked sectors.

Key Takeaways
- On April 20, 2026, SanDisk (SNDK) enters the Nasdaq-100, taking Atlassian’s (TEAM) position
- Analyst firms elevate price targets: Jefferies to $1,000 and Bernstein to $1,250
- The memory manufacturer’s shares have skyrocketed 2,640% annually, hovering around $851.77 near the $855 peak
- A $1 billion strategic investment in Nanya Technology secures SanDisk roughly 3.9% equity stake
- Wall Street points to artificial intelligence demand and strengthening NAND pricing as primary growth drivers
The memory storage specialist SanDisk (SNDK) has secured its position among elite tech companies, earning admission to the prestigious Nasdaq-100 index. The exchange operator confirmed Friday evening that the company will take its place in the benchmark before trading begins on April 20, 2026, displacing Atlassian (TEAM) from the roster.
This placement positions SanDisk within the exclusive circle of the top 100 largest non-financial enterprises trading on the Nasdaq exchange — a designation with significant market implications.
The Nasdaq-100 serves as the foundation for more than 200 investment vehicles, most notably the popular Invesco QQQ Trust. Collectively, these financial instruments command over $600 billion in total assets worldwide, ensuring that SanDisk’s index entry will spark substantial automated purchases from index-tracking funds.
Conversely, Atlassian confronts inevitable selling momentum as the same passive investment vehicles rebalance their portfolios. The software-as-a-service provider exits as the index composition tilts toward hardware and foundational technology companies.
The addition adheres to the present Nasdaq-100 selection framework, which remains operational until April 30, 2026. Market observers are closely monitoring anticipated index weighting adjustments before the April 20 implementation.
Wall Street Elevates Price Expectations
This benchmark inclusion arrives during a period of heightened analyst optimism surrounding SNDK.
Investment bank Jefferies upgraded its valuation target from $700 to $1,000 while maintaining its Buy recommendation. The research team highlighted continuing negotiations for extended supply agreements and artificial intelligence-fueled demand as factors supporting additional NAND memory price appreciation and favorable earnings adjustments before SanDisk’s April 30 quarterly results.
Analyst Blayne Curtis at Jefferies calculated the $1,000 projection using a 10x earnings multiple against a projected 2028 EPS figure of $95.26. The analysis also noted anticipated QLC eSSD deliveries to two major customers in upcoming quarters as a potential catalyst for expanding Data Center market position.
Bernstein demonstrated even greater confidence, increasing its target from $1,000 to $1,250. The firm retained its Outperform designation, emphasizing NAND pricing exceeding previous forecasts as the central factor.
Morgan Stanley reaffirmed its Overweight stance following recent volatility in memory semiconductor equities, characterizing the pullback as normal market adjustment rather than deteriorating business fundamentals. BofA Securities preserved its Buy rating with a $900 objective, highlighting robust demand from cloud computing giants and AI processing workloads.
Extraordinary Returns and Strategic Investments
SNDK has delivered exceptional shareholder returns. Shares have appreciated 2,640% during the trailing twelve months and presently change hands near $851.77, marginally beneath the 52-week maximum of $855. According to InvestingPro’s Fair Value framework, current pricing suggests the stock trades above intrinsic value.
Fiscal 2026 earnings per share consensus stands at $42.37, with the Street projecting SanDisk will achieve profitability during the current fiscal period.
From a strategic perspective, SanDisk disclosed a $1 billion capital allocation to Nanya Technology via private share placement. This transaction delivers approximately 139 million Nanya shares to SanDisk, equating to roughly 3.9% of total shares outstanding.
Company executives refrained from issuing revised financial guidance throughout recent discussions with the investment community.
Crypto World
Bitcoin (BTC) market is splitting in two. Here’s who is buying and selling amid the war
Six weeks of war have split the bitcoin market into two camps. The institutional buyers who keep accumulating regardless of conditions, and everyone else, who is leaving.
The result is a market that looks stable on the surface, with bitcoin holding a $65,000 to $73,000 range through five weeks of conflict headlines, $600 million liquidation events, and the worst sentiment readings since the 2022 bear market, but is narrowing underneath in ways that matter for what comes next.
Here is who is on each side and what their behavior tells us about where conviction actually sits.
The mandated buyers
Three entities account for nearly all of the sustained buying pressure in the bitcoin market right now, and all three are buying because their business model requires it rather than because they’ve made a discretionary call on price.
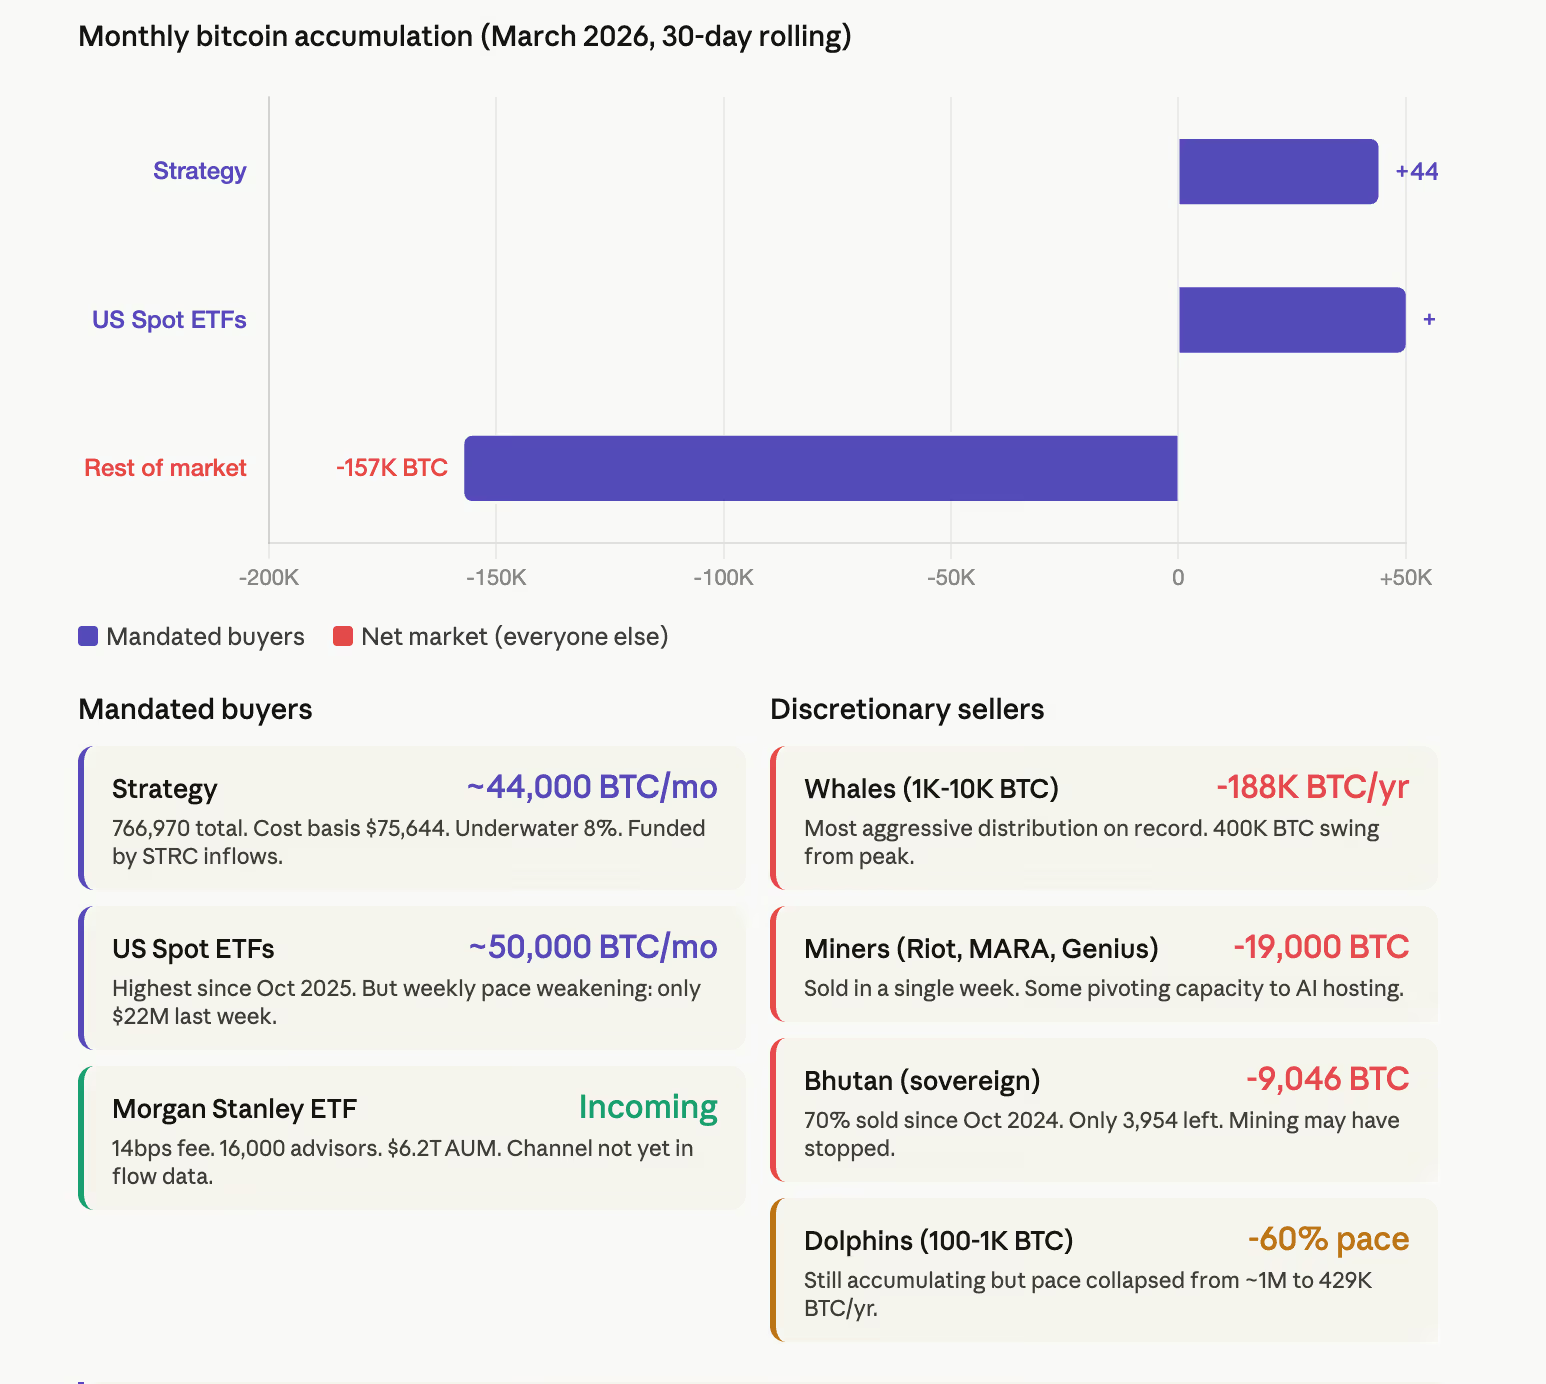
Strategy has been the most visible. The company disclosed its latest purchase on April 5, adding 4,871 BTC for approximately $329.9 million at an average of $67,718 per coin.
Total holdings now stand at 766,970 BTC acquired for $58.02 billion at a blended cost basis of $75,644. The position is underwater by roughly 8% at current prices, but Strategy continues buying below its average, pulling the breakeven lower with each purchase.
A CoinDesk report last week showed Strategy’s 30-day accumulation holding steady at approximately 44,000 BTC through March.
Strategy’s STRC preferred equity product saw hundreds of millions in new inflows around its recent ex-dividend date, providing the capital for continued accumulation. As long as investor appetite for that yield product holds, Strategy keeps buying. If STRC inflows slow, so does the bid.
Meanwhile, U.S. spot bitcoin ETFs absorbed approximately 50,000 BTC in March’s 30-day rolling window, the highest monthly pace since October 2025.
But the broader ETF industry data tracked on a weekly basis tells a less bullish story. CoinShares reported only $22 million in U.S. spot ETF inflows last week out of $107 million in total bitcoin ETP flows globally. Meanwhile, most flows came from one country – Swiss-listed products pulled in $157 million alone, accounting for 70% of the global ETP inflow of $224 million.
The institutional channel is open but the flow tis highly concentrated and is slowing on a weekly basis.
Meanwhile, Bitmine Immersion Technologies, while primarily an ether play, represents the same structural dynamic on the ETH side.
The company bought 71,252 ETH last week, its largest single-week purchase since December 2025, and now holds 4.8 million tokens worth roughly $10 billion.
Chairman Tom Lee called the stock market bottom this week while his company was actively spending hundreds of millions accumulating the asset he was publicly talking up.
The discretionary sellers
Everyone with a choice is running for the exit.
Whales holding 1,000 to 10,000 BTC have turned from the market’s largest buyers into its largest sellers. The one-year change in whale holdings has swung from roughly positive 200,000 BTC at the 2024 bull market peak to negative 188,000 BTC, a nearly 400,000 BTC reversal that CryptoQuant described as one of the most aggressive large-holder distribution cycles on record. The 365-day moving average continues to decline, confirming the selling is structural rather than reactive to any single event.
Mid-tier holders, wallets with 100 to 1,000 BTC, are still technically accumulating but the pace has collapsed more than 60% since October 2025, from nearly 1 million BTC in annual additions to 429,000. They have not flipped to selling yet, but the trajectory points that direction.
Listed bitcoin miners are liquidating treasury. Riot Platforms, MARA Holdings, and Genius Group disclosed selling more than 19,000 BTC from their treasuries in a single week earlier this month.
Some are facing operational strains, with bitcoin near $70,000 and difficulty at all-time highs and rising energy costs. The likes of Core Scientific, Iris Energy, and Hut 8, are pivoting capacity to AI hosting where contracted revenue replaces the volatility of mining income.
Bhutan, the only sovereign nation that built a bitcoin position through its own hydropower-backed mining operation, has sold 70% of its holdings since October 2024, from roughly 13,000 BTC to 3,954. The kingdom moved another 319.7 BTC to exchange-linked wallets this week. Its last mining inflow exceeding $100,000 was recorded over a year ago, suggesting the operation may have stopped entirely. Strategy now buys more bitcoin in a typical week than Bhutan has left.

The sentiment gap
The gap between what mandated buyers are doing and what the rest of the market feels is historically unusual.
The Fear and Greed Index spent over a month pinned between 8 and 14, the most sustained period in extreme fear territory since the 2022 bottom. It only climbed out of single digits this week after the ceasefire was announced.
Santiment data showed five bearish social media posts for every four bullish ones last weekend, the most negative skew since the war began.
Yet through all of that, ETFs were buying 50,000 BTC a month, Strategy was buying 44,000, and bitcoin never broke below $65,000. The floor held because the mandated buyers were absorbing what the discretionary sellers were dumping. The question is whether that absorption is sustainable.
What the ceasefire changed and what it didn’t
The ceasefire announcement Tuesday produced the sharpest single-day rally in over a month, with bitcoin surging past $72,000 and $427 million in shorts getting liquidated. Open interest in BTC and ETH perpetuals expanding by $2.1 billion and $2.2 billion respectively in 24 hours, with coin-denominated OI also rising, confirming net new long positions rather than just short liquidations.
The Coinbase Premium turned positive for both bitcoin and ether for the first time since October’s all-time high, reversing months of persistent negative readings. If it holds, that is the first sign of genuine U.S. buyer re-engagement since the war began.
But the ceasefire has not changed the structural dynamics underneath. Whether it converts into a trend reversal depends on whether the two-week truce becomes permanent, and whether the institutional flows that held the floor through the war can push through the $73,000 ceiling that has rejected every rally since late February.
In conclusion, a read across all of the data is that bitcoin’s buyer base has been narrowing for months.
The number of entities providing sustained buying pressure can be counted on one hand. Strategy, ETFs, and to a lesser extent Morgan Stanley’s new channel. Everyone else is either selling, slowing down, or leaving.

TLDR
- Tesla’s Q1 2026 vehicle deliveries reached 358,000 units, marking a 6% yearly increase but falling short of the 365,000 analyst consensus
- TSLA shares have declined 29% from record highs amid weakening EV demand, tax credit expiration, and intensifying competition
- Bank of America resumed coverage with a $460 target price, highlighting Tesla’s camera-based robotaxi technology as a scalable competitive edge
- Morgan Stanley calculates Tesla’s cost-per-mile advantage at $0.81, significantly undercutting Waymo’s $1.43 and conventional rideshare’s $1.71
- Tesla’s Energy Storage division substantially underperformed — delivering 8.8 GWh against expectations of 14.4 GWh, representing a 40% gap
Tesla’s first-quarter 2026 delivery report showed 358,000 vehicles handed over to customers, representing a 6% improvement versus the prior year but narrowly missing Wall Street’s 365,000-unit forecast. This marked the second straight quarter where actual deliveries trailed analyst projections.
The electric vehicle manufacturer has encountered substantial headwinds. The elimination of federal tax incentives, escalating competitive pressures, and CEO Elon Musk’s controversial political involvement have all dampened consumer appetite. Throughout 2025, Tesla relinquished its position as the globe’s leading EV manufacturer, with deliveries, revenue, and profitability all trending downward.
TSLA shares currently trade 29% beneath their all-time peak. Yet two prominent Wall Street institutions have issued optimistic assessments — and their focus centers on future opportunities rather than recent performance.
Bank of America analyst Alexander Perry resumed coverage in March with a $460 valuation target, suggesting approximately 33% appreciation potential from the current $345 price level. This target aligns with the median forecast among 56 analysts tracking the stock, per The Wall Street Journal data.
Perry’s fundamental thesis revolves around autonomous vehicle technology. Tesla presently operates robotaxi services in only two American cities — Austin and San Francisco — placing it considerably behind Alphabet’s Waymo, which maintains operations across 11 cities. However, Perry identifies Tesla’s camera-exclusive methodology as the critical distinguishing factor.
Most autonomous taxi providers employ a combination of cameras, lidar sensors, and radar systems. Tesla relies exclusively on cameras. While technically more challenging, this approach dramatically reduces costs. The strategy eliminates expensive sensor installations and removes the requirement to pre-map urban environments with lidar before entering new markets.
“Tesla’s camera-only approach is technically harder but much cheaper and leverages a consumer-fleet data engine. Tesla’s strategy should allow it to scale more profitably compared to robotaxi competitors,” Perry said.
Cost Advantage Could Be Decisive
Morgan Stanley analyst Andrew Percoco reinforces this perspective. His analysis estimates Tesla’s robotaxi operating cost at $0.81 per mile, contrasted with $1.43 for Waymo and $1.71 for conventional rideshare services. He anticipates this metric will decrease further once Cybercab manufacturing achieves scale.
Percoco additionally identifies the robotaxi deployment as creating a reinforcing cycle: expanded ride volume produces enhanced real-world operational data, which refines Tesla’s artificial intelligence systems, which advances the Full Self-Driving (FSD) capabilities offered to traditional vehicle purchasers, which stimulates demand in the primary automotive business.
Musk has indicated the autonomous transportation network could extend to “dozens of major cities” encompassing between one-quarter and one-half of the United States by year’s conclusion. Morgan Stanley forecasts Tesla will secure 25% of U.S. autonomous transportation trips annually by 2032, trailing Waymo’s projected 34% market share.
Energy Storage Was the Real Miss
While automotive delivery figures dominated headlines, Tesla’s Energy Storage division experienced a challenging quarter. Megapack installations totaled merely 8.8 GWh, a 40% shortfall compared to the 14.4 GWh consensus projection. This represented Tesla’s first year-over-year contraction in storage deployments since 2022.
Analysts characterize this as an isolated occurrence, attributing it to the irregular timing inherent in large-scale utility agreements and project schedules. Nevertheless, this metric warrants continued monitoring.
Morgan Stanley has revised its full-year 2026 delivery projection to 1.60 million vehicles, still indicating a 2.2% year-over-year decrease. The firm’s extended-term framework anticipates a mid-teens volume compound annual growth rate through 2030, propelled by upcoming model introductions including a prospective “Model YL” and a refreshed Cybertruck.


Ripple’s native token traded at $1.35 on April 11 after posting a slight daily gain and a 3% weekly rise.
Summary
- XRP held near $1.35 as traders prepared for a busy week around Congress and crypto policy.
- Market focus shifted to the CLARITY Act as lawmakers returned after a two-week recess.
- Analyst EGRAG CRYPTO shared long-range XRP targets, while traders weighed price history and market size.
The US Congress is due to reconvene on April 13. Traders are watching that date closely because the CLARITY Act may return to the agenda during the coming week.
The Senate Banking Committee could review changes to the bill before another vote takes place. That process has kept XRP in focus because Ripple’s token often reacts to US crypto policy news and market sentiment tied to regulation.
Recent support for the bill from financial officials, White House economists, and some lawmakers has added to market attention. That setup has increased expectations of a busy week for digital assets.
XRP may see stronger price swings if lawmakers move the discussion forward. Traders often react quickly when policy headlines affect the outlook for the broader crypto market.
Analyst shares wide XRP price targets
At the same time, analyst EGRAG CRYPTO shared a new long-term XRP outlook. The analyst said the chart structure points to several possible targets across different time frames.
In the post, EGRAG wrote that the targets are “NOT random numbers” and described them as “harmonic targets from different scales.” The analyst listed a non-logarithmic measured move in the $4 to $7 range and larger expansion targets at $13 and $27.
The post also referred to a macro repricing case of $100 and a measured move of $225. EGRAG said that “$225 is TA… it’s a SYSTEM SHIFT bet,” placing the higher target in a separate category from the near-term projections.
Those levels have drawn attention because XRP has a large and active community that often follows bold market calls. The latest post added another round of discussion around long-range XRP forecasts.
Market watches price history and bill progress
Even the lower end of EGRAG’s target range would require a sharp move from current levels. XRP has delivered strong rallies before, but those gains came when the asset had a smaller market profile.
Recent commentary around the forecast said the framework relies on a broad multi-year structure rather than a short-term setup.
Similar past analysis from the same analyst used large formations and Fibonacci expansion levels, including a prior call that placed XRP at $27 by August 2027.
Disclosure: This article does not represent investment advice. The content and materials featured on this page are for educational purposes only.


Iran is demanding cryptocurrency payments from tankers transiting the Strait of Hormuz. Hamid Hosseini, spokesperson for Iran’s Oil, Gas and Petrochemical Products Exporters’ Union, specifically named Bitcoin (BTC) in a recent statement.
However, Chainalysis suggests that stablecoins could be the instrument of choice, consistent with how the Islamic Revolutionary Guard Corps (IRGC) has historically moved money.
Stablecoins Fit Iran’s Playbook
Chainalysis argues that stablecoins, not BTC, will likely serve as the IRGC’s toll collection instrument. The firm pointed to the regime’s well-documented preference for dollar-pegged tokens across years of illicit trade.
The reasoning is straightforward. Dollar-pegged stablecoins preserve value in ways BTC cannot. Iran’s rial has lost substantial value against the dollar, making price stability essential for large-scale commercial revenue.
Bitcoin’s regular volatility would expose toll proceeds to unpredictable losses between collection and conversion.
“The regime has leveraged stablecoins because their backing by the US dollar guarantees preservation of value and provides the liquidity necessary for use at scale,” the report read. “Bitcoin, by contrast, experiences regular price volatility.”
Chainalysis noted that the IRGC has historically relied on stablecoins across oil sales, weapons procurement, and proxy financing. Bitcoin, by contrast, has served a different function within Iran’s crypto operations.
The report primarily linked it to Iranian cyber actors running ransomware campaigns and other malicious operations. That is a fundamentally different use case from high-volume, commerce-oriented toll collection.
Follow us on X to get the latest news as it happens
Billions Already on Chain
The scale of the IRGC’s existing crypto operations reinforces why stablecoins may be the likely choice. Chainalysis estimated that IRGC-associated wallet addresses received over $2 billion in 2024.
That figure spiked above $3 billion in 2025, representing roughly half of Iran’s total crypto ecosystem by the fourth quarter.
Those numbers are considered lower-bound estimates. They include only addresses identified through OFAC designations and Israel’s National Bureau for Counter Terror Financing seizure lists. The full network of shell companies and intermediary wallets remains larger.
Before the closure, the Strait of Hormuz handled around 20 million barrels of oil per day, roughly 20% of the global seaborne oil trade. At $1 per barrel, even partial toll collection on current volumes could generate billions annually. Stablecoins offer the throughput and liquidity that kind of scale demands.
“These oil shipments could generate sorely needed revenue for the regime during the most severe threat to the Islamic Republic in decades,” Chainalysis added.
However, stablecoins carry their own risk for Tehran. Unlike BTC, stablecoin issuers can freeze assets held in designated wallets. Chainalysis flagged this as a key intervention point for regulators and law enforcement if the stablecoin toll program materializes.
Subscribe to our YouTube channel to watch leaders and journalists provide expert insights
The post Iran’s Hormuz Toll Could be In Stablecoins, Not Bitcoin appeared first on BeInCrypto.
Key Takeaways
- The WLFI token plunged 12% to reach an all-time low since its 2025 debut
- The project leveraged its native WLFI tokens as collateral for stablecoin loans on the Dolomite platform
- This borrowing activity exhausted Dolomite’s USD1 liquidity pool, preventing other users from accessing withdrawals
- Tron’s Justin Sun saw his locked WLFI position decline by more than $11 million within 24 hours
- Treasury repurchase operations are currently underwater by approximately 48%
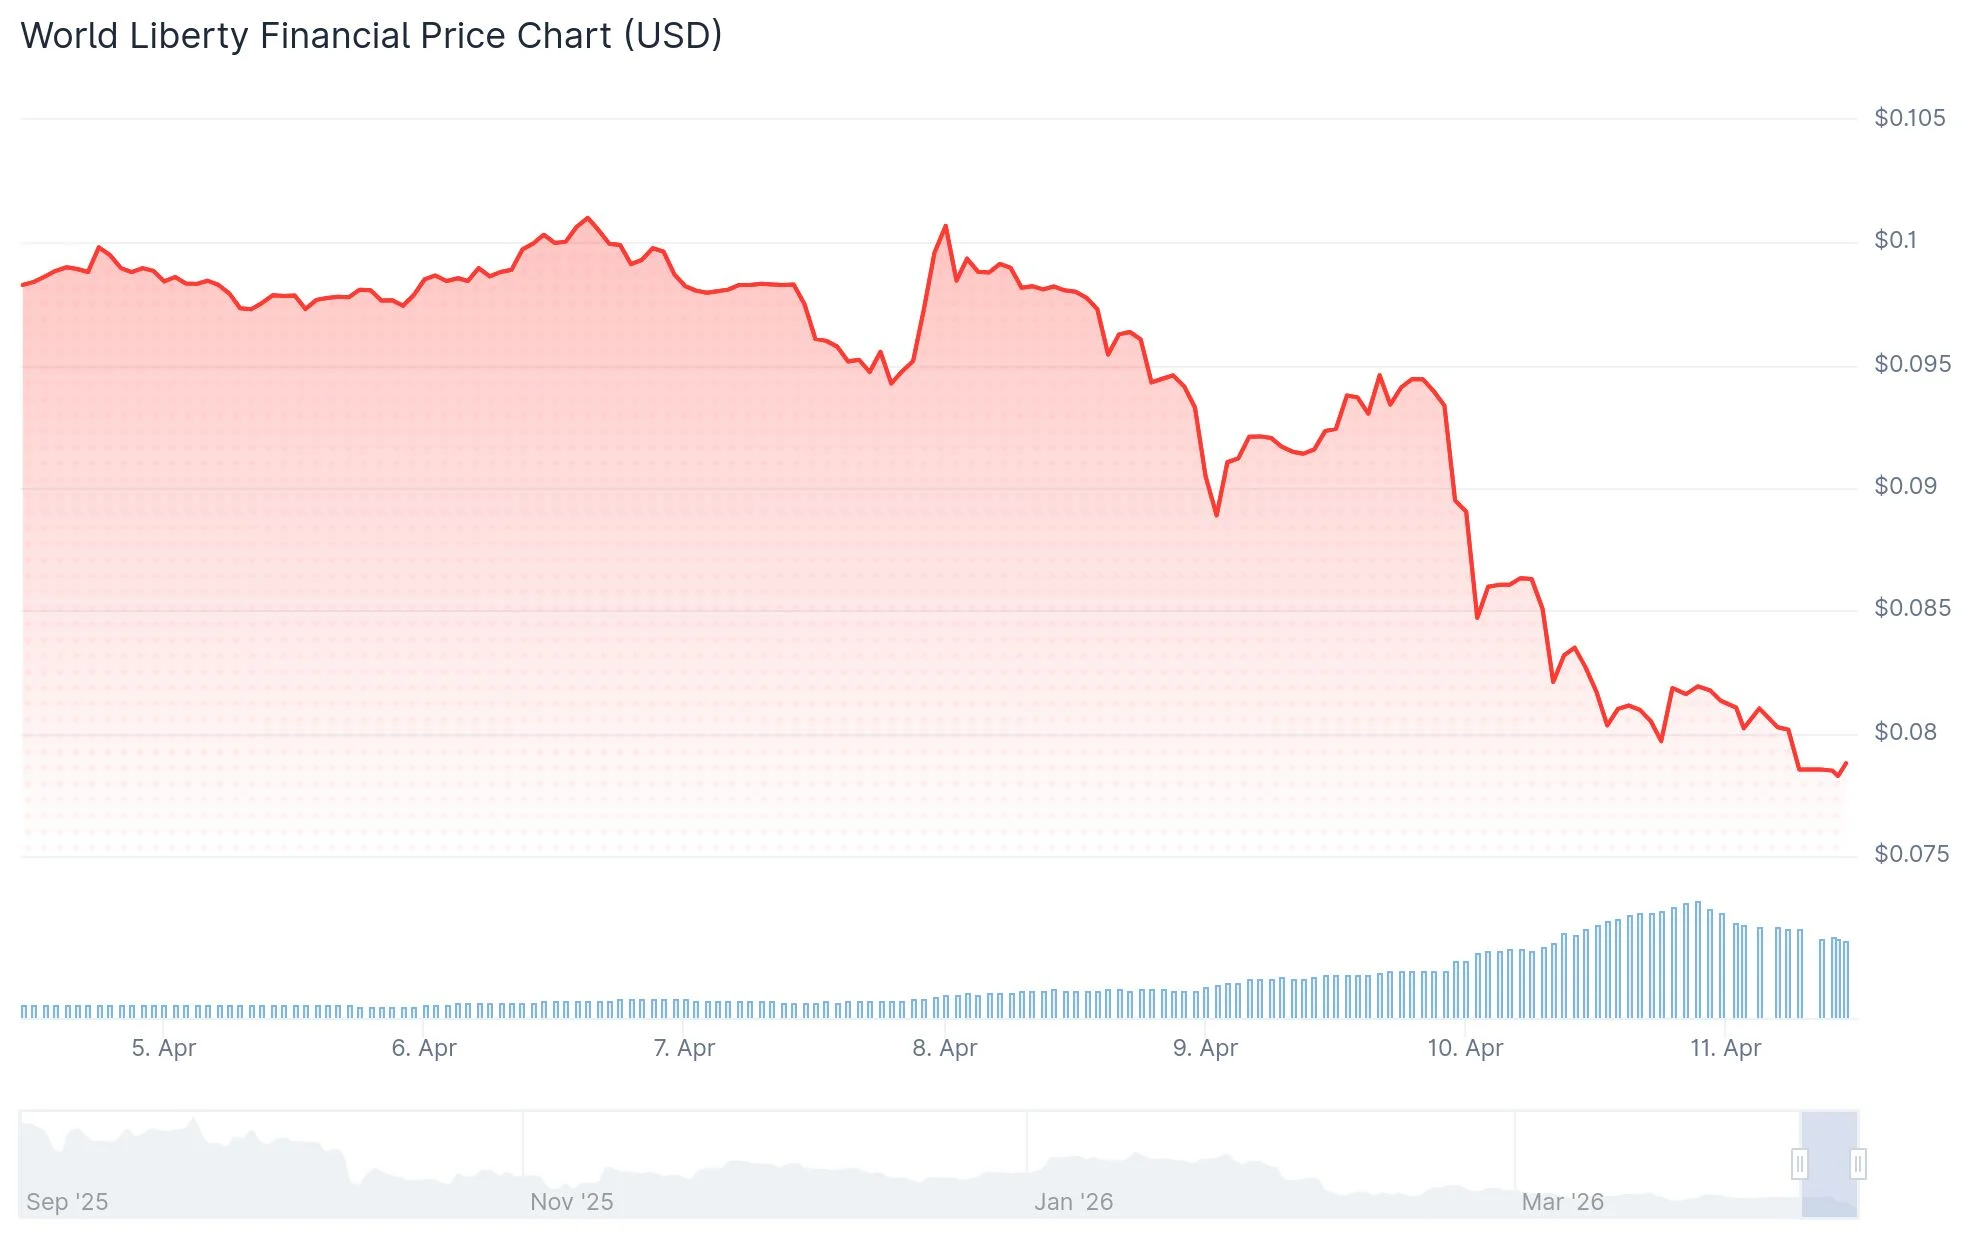
The World Liberty Financial token experienced a sharp 12% decline over a 24-hour period, reaching its lowest valuation since its 2025 introduction. The digital asset traded around $0.0818, compounding weekly declines of 15% and monthly losses totaling 17%.

The dramatic price movement followed a CoinDesk investigation revealing that WLFI had pledged billions of its proprietary governance tokens as collateral within the Dolomite lending infrastructure. Using this collateral base, the initiative secured substantial stablecoin loans, including USDC and its proprietary USD1 token, totaling tens of millions of dollars.
Blockchain intelligence from Arykham verified that a project-controlled wallet deposited 5 billion WLFI tokens as collateral on Dolomite, facilitating approximately $75 million in stablecoin borrowings. Subsequently, more than $40 million of these borrowed assets were moved to Coinbase Prime.
This substantial borrowing activity maxed out Dolomite’s available lending capacity, creating a liquidity crisis that temporarily prevented other protocol participants from accessing their deposited capital.
Project Team Addresses Growing Concerns
World Liberty Financial published a detailed response thread on X, characterizing the criticism as baseless fearmongering. The organization emphasized that liquidation risks remain minimal.
“In the event of significant market volatility against our position, we maintain the capability to supply additional collateral,” the team explained. However, skeptics noted that pledging more WLFI tokens to support existing WLFI-backed positions—particularly on a platform where a WLFI advisor holds leadership—compounds circular risk rather than mitigating it.
Adding to the controversy, Dolomite co-founder Corey Caplan simultaneously serves in an advisory capacity for World Liberty Financial, intensifying questions about potential conflicts of interest among industry observers.
According to project disclosures, WLFI allocated $65.58 million toward repurchasing 435.3 million tokens across six months, achieving an average acquisition price of $0.1507. With current market prices hovering near $0.078, these buyback initiatives represent unrealized losses of roughly 48%.
Significant Losses for Justin Sun
Justin Sun, the founder of Tron, witnessed his immobilized WLFI holdings depreciate by over $11 million in a single trading session. Sun initially committed $30 million to World Liberty Financial during late 2024, subsequently expanding his stake to approximately $75 million.
Following the movement of roughly $9 million in WLFI from Sun’s wallet last year, World Liberty Financial blacklisted his address, effectively freezing his token holdings. According to blockchain analytics provider Bubblemaps, Sun currently possesses approximately 545 million frozen WLFI tokens valued at roughly $45 million—representing a decline exceeding $80 million from previous valuations.
An additional 3 billion WLFI tokens remain in an intermediary wallet following treasury operations conducted on April 2 and April 7, presently valued at approximately $234 million.
Technical indicators show the Relative Strength Index approaching 30, nearing oversold conditions, while the MACD reflects persistent bearish momentum. Immediate support is positioned at $0.079, with potential downside objectives at $0.075 and $0.070 should selling intensity persist.
WLFI, the native token of World Liberty Financial—the Donald Trump–backed platform—took a deeper slide over the weekend as new on-chain disclosures raised questions about the project’s use of its own tokens as loan collateral. Trading near $0.078, WLFI marked an all-time low after sinking roughly 83% from its September peak around $0.46, according to data tracked by CoinMarketCap. The fresh selloff followed revelations that wallets tied to World Liberty Financial deposited substantial WLFI holdings on Dolomite, a DeFi lending protocol co-founded by the project’s chief technology officer, Corey Caplan, and then used those tokens as collateral to borrow USD1 and USDC stablecoins. The proceeds were partly moved to Coinbase Prime, fueling concerns about liquidity and risk in a relatively obscure DeFi niche.
On-chain analytics from Arkham show a wallet associated with World Liberty Financial placing a colossal 5 billion WLFI tokens on Dolomite. The same wallet subsequently borrowed about $75 million in USD1 and USDC and transferred more than $40 million to Coinbase Prime. The size of the position ignited debate among DeFi observers about whether WLFI’s price could withstand a material move in liquidation risk should the token’s liquidity prove insufficient to cover a rapid margin call.
Key takeaways
- WLFI traded around $0.078 after hitting an all-time low near $0.077, marking an 83% decline from its September high of about $0.46 (CoinMarketCap).
- On-chain data from Arkham indicates a wallet linked to World Liberty Financial deposited roughly 5 billion WLFI on Dolomite and used the collateral to borrow around $75 million in USD1 and USDC, with more than $40 million moved to Coinbase Prime.
- Dolomite’s footprint remains modest within DeFi, ranking about 19th by total value locked (TVL) among lending protocols, per DefiLlama.
- World Liberty acknowledges its lending activity, asserting that its positions sit well above liquidation thresholds and characterizes itself as an “anchor borrower” intended to generate yield for users amid low traditional-market activity.
- A governance proposal is planned to implement a phased unlock schedule for WLFI held by early retail buyers, replacing immediate access with a long-term vesting plan subject to community vote.
On-chain activity and the liquidity question
The core concern centers on the scale of WLFI used as collateral and what a price move could trigger for lenders on Dolomite. Analysts have warned that a 5% or larger forced sale of WLFI from such a large collateral position could compress liquidity quickly, given WLFI’s market depth and the token’s relatively modest liquidity profile. While World Liberty’s public communications emphasize that the loan book remains well above liquidation thresholds, observers note that a sudden price shock or a cascade of liquidations could expose both the Dolomite pool and other users who rely on its lending markets.
Dolomite’s standing in the DeFi universe is notable but not outsized. It sits far below leaders by TVL, a reality that can complicate risk management for lenders that rely on single-asset collateral with limited trading liquidity. This backdrop amplifies the importance of robust risk controls and transparent governance, especially when a token possesses a high narrative premium but limited natural liquidity.
World Liberty’s stance and the governance plan ahead
World Liberty Financial responded to the disclosures through social channels, arguing that the firm’s positions are prudent and that the strategy serves as a mechanism to provide outsized stablecoin yields in an environment where traditional assets often yield little. The project described itself as an “anchor borrower,” a role intended to stabilize the WLFI ecosystem while delivering yield to everyday users who participate in the platform’s offerings.
In a move to address investor concerns about token dynamics, World Liberty said on X that it would soon submit a governance proposal aimed at altering token unlock mechanics. The plan would replace the immediate access enjoyed by early retail WLFI holders with a phased unlock schedule, implemented through a community-driven vote. If approved, the long-term vesting framework could help reduce the likelihood of abrupt, large-scale WLFI selling pressure tied to token distribution, potentially easing some market anxiety in the near term.
Broader implications for WLFI holders and DeFi markets
The episode underscores several recurring themes in crypto markets: the tension between tokenomics and practical liquidity, the risk of using a highly concentrated or illiquid token as the backbone for large-margin loans, and the sensitivity of retail holders to governance decisions that affect token accessibility.
For investors and traders, the development highlights a few practical considerations. First, even seemingly large, high-profile projects can face liquidity strains when a significant portion of the supply is deployed as collateral on a single DeFi venue. Second, governance proposals—especially those that affect vesting and unlock schedules—can materially shape perceived risk and price dynamics. Third, the ongoing move to clarify and formalize unlock mechanics signals a maturation process in a sector where tokenized projects have historically offered broad access with less emphasis on long-term holder alignment.
From a market structure perspective, the Dolomite exposure calls into question the risk budgeting of smaller DeFi lending platforms that might rely on a handful of large positions. While Dolomite remains a relatively small player by TVL, the event illustrates how collateral quality and token liquidity can become systemic concerns when a project is positioned as a solar-anchored yield generator for a broad user base.
In the context of broader regulatory and market developments, observers will be watching for how governance shifts are implemented and whether additional disclosures accompany on-chain activity into future quarters. The balance between encouraging user-friendly yields and maintaining robust risk controls will likely shape both WLFI’s trajectory and the wider DeFi lending landscape as platforms evaluate collateral standards and liquidity risk frameworks.
As WLFI navigates this period of scrutiny, investors should monitor price action, liquidity cues, and the outcomes of forthcoming governance discussions. The unfolding narrative will help determine whether the project can restore confidence in its tokenomics, or whether tighter risk management and more transparent capital practices will become the baseline expectation for participants in WLFI’s ecosystem.
Source notes: WLFI’s price data tracked by CoinMarketCap; on-chain activity and collateral details drawn from Arkham analytics; the project’s DeFi footprint cited via DefiLlama; official responses and governance plans referenced through World Liberty Financial’s public statements.
CoreWeave (CRWV) Stock Surges 11% on Major Anthropic and Meta Contracts Despite Executive Share Sales
The P/PTSD Perspective: AVG Clone for MIN, Darrisaw Update, and WR Meeting

Amazon Leo satellite internet is nearing launch, and it already has big customers to rival Starlink

Why Israel is blocking foreign journalists from entering

Bitcoin: We’re Entering The Most Dangerous Phase

Alan Cumming Brands Baftas Ceremony A ‘Triggering S**tshow’

Stock Market, Gold & Silver Astrology Prediction: Big Turning Point Ahead? | Prashant Kapoor LIVE

Emas batangan vs Perhiasan #tipskeuangan #samasamabelajar #finance

Btc prediction | Bitcoin price prediction in Hindi #india #btc #crypto #bitcoin
-

 Business6 days ago
Three Gulf funds agree to back Paramount’s $81 billion takeover of Warner, WSJ reports
-

 Sports7 days ago
India men’s 4x400m and mixed 4x100m relay teams register big progress | Other Sports News
-

 Politics18 hours ago
US brings back mandatory military draft registration
-

 Fashion18 hours ago
Weekend Open Thread: Veronica Beard
-

 Tech4 days ago
How Long Can You Drive With Expired Registration? What Florida Law Says
-

 Business6 days ago
No Jackpot Winner, Prize to Climb to $231 Million
-

 Fashion5 days ago
Massimo Dutti Offers Inspiration for Your Summer Mood Board
-
 Sports19 hours ago
Man United discover Nico Schlotterbeck transfer fee as defender reaches Dortmund agreement
-

 Fashion4 days ago
Let’s Discuss: DEI in 2026
-

 Crypto World3 days ago
Bitcoin recovers as US and Iran Agree a Ceasefire Deal
-

 Crypto World2 days ago
Canary Capital Files SEC Registration for PEPE ETF
-

 Business15 hours ago
Tesla Model Y Tops China Auto Sales in March 2026 With 39,827 Registrations, Beating Cheaper EVs and Gas Cars
-

 Business7 days ago
Akebia Therapeutics, Inc. (AKBA) Discusses Pipeline Progress and Strategic Focus on Kidney Disease Treatments at R&D Day – Slideshow
-

 Business1 day ago
OpenAI Halts Stargate UK Data Centre Project Over Energy Costs and Copyright Row
-

 Tech5 days ago
Gamer Restores the Original PlayStation Portal From Two Decades Ago
-

 Tech5 days ago
Haier is betting big that your next TV purchase will be one of these
-

 Tech5 days ago
The Xiaomi 17 Ultra has some impressive add-ons that make snapping photos really fun
-

 Tech5 days ago
Samsung just gave up on its own Messages app
-

 Politics1 day ago
Malcolm In The Middle OG Turned Down ‘Buckets Of Money’ To Appear In Reboot
-

 Tech5 days ago
Save $130 on the Samsung Galaxy Watch 8 Classic: rotating bezel, sleep coaching, and running coach for $369
You must be logged in to post a comment Login