
Crypto World
Zcash Price Warning: Another Major Crash Incoming?
Zcash price remains under heavy pressure as bearish momentum continues to build across the market. After losing nearly 35% since late January, Zcash (ZEC) is now slipping deeper inside a falling channel that has guided prices lower for months.
Weak volume, fading whale interest, and shrinking derivatives activity are all reinforcing the downside trend. With multiple indicators flashing warning signs, charts now suggest that Zcash may be entering another breakdown phase.
Falling Channel and OBV Breakdown Show Sustained Selling Pressure
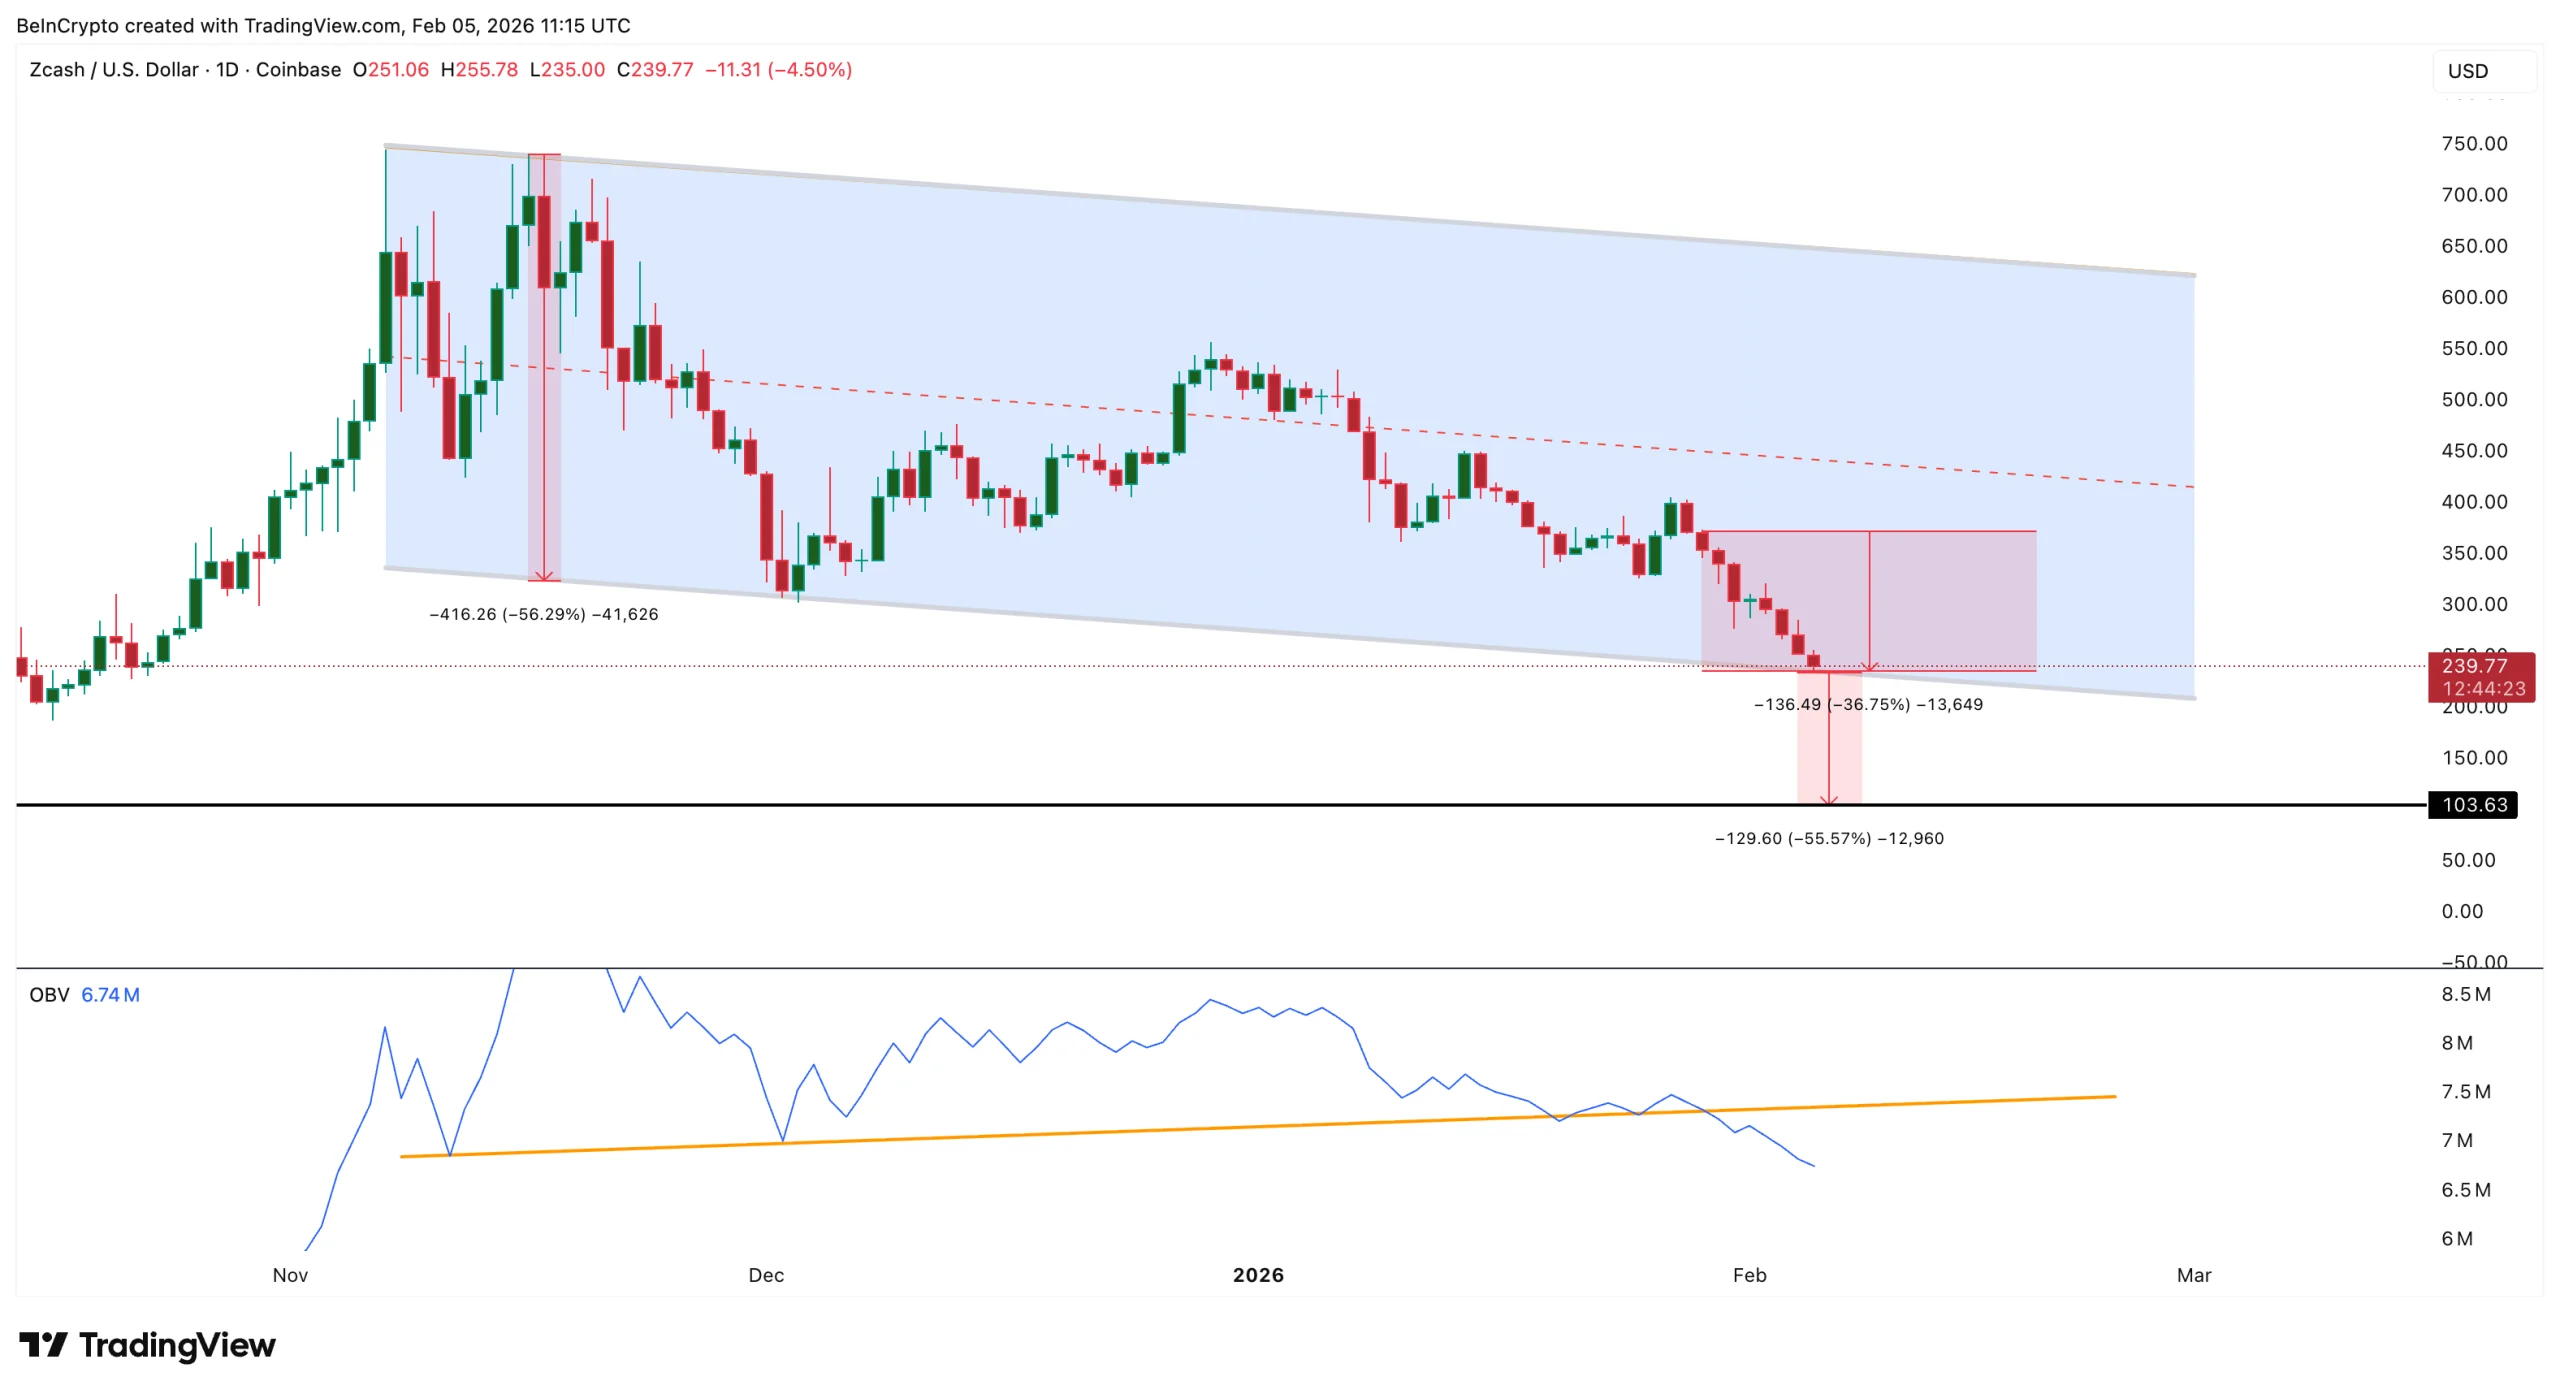
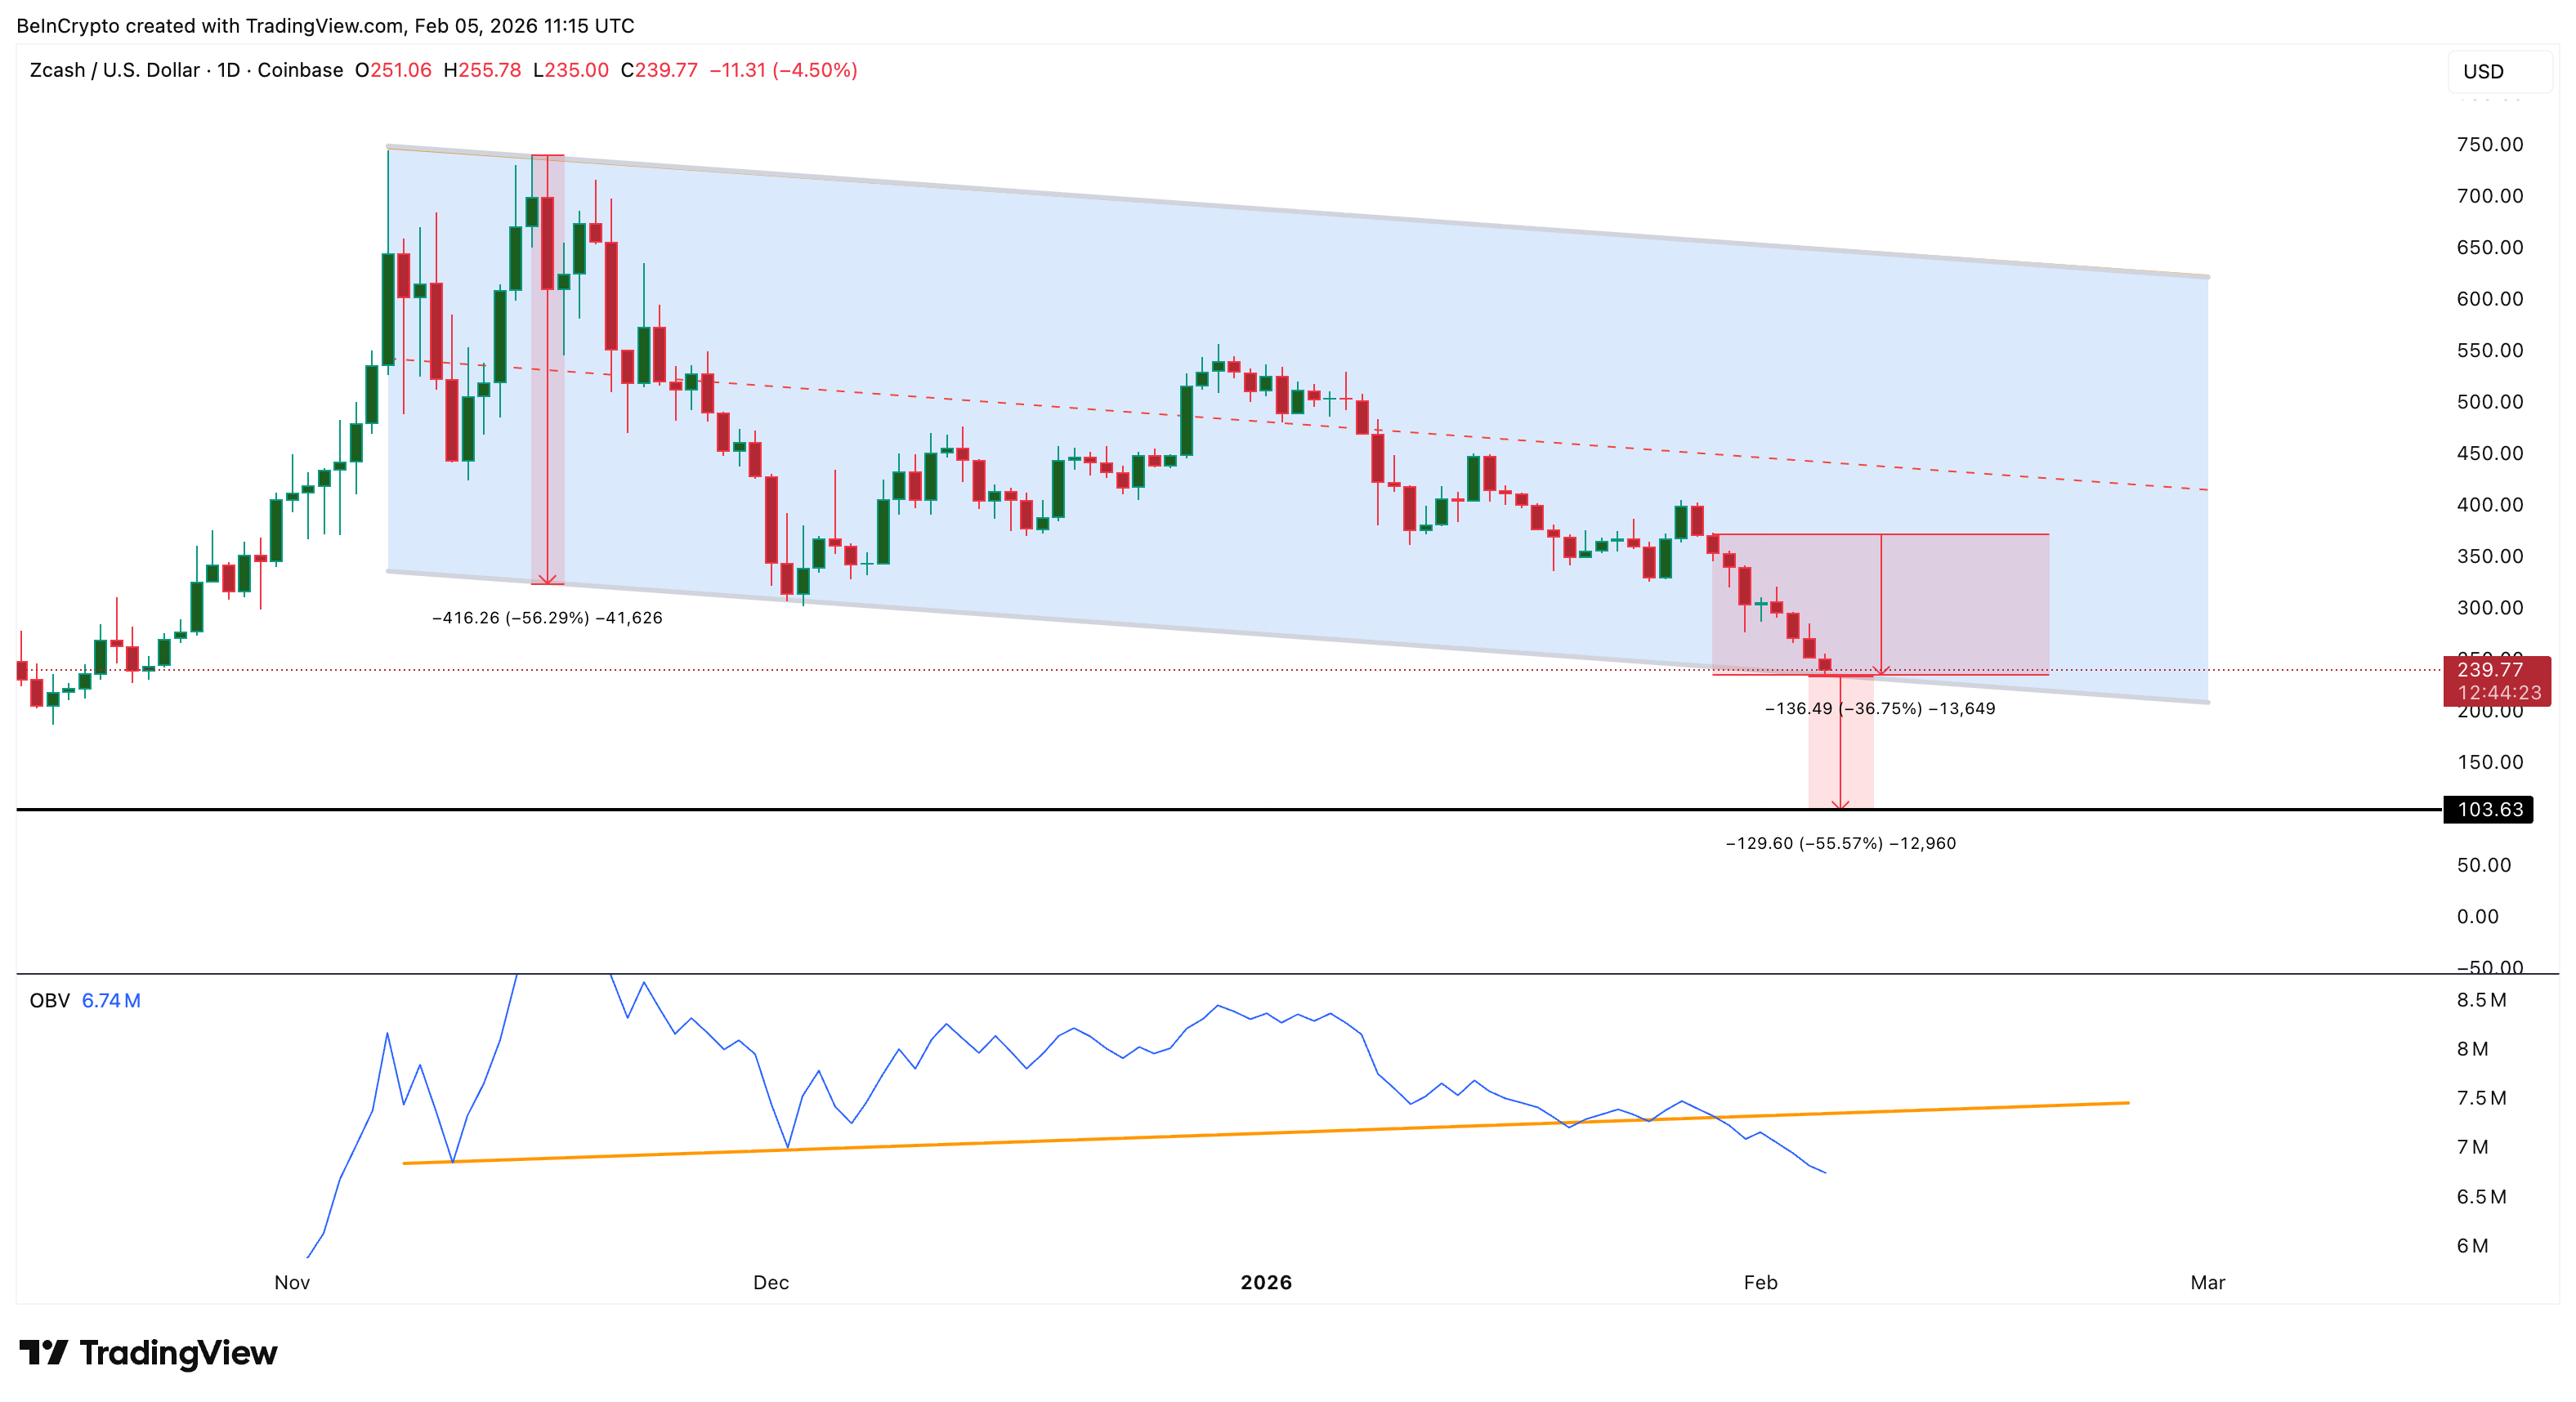
Zcash has been trading inside a clear falling channel since November, marked by consistent lower highs and lower lows.
Sponsored
Sponsored
After peaking above $740, ZEC entered this declining range and has already experienced one major collapse of more than 56% inside the channel, also the breakdown target. Each rebound has become weaker, showing that buyers are unable to shift momentum.
The weakening structure is confirmed by On-Balance Volume (OBV) tracks buying and selling pressure by adding volume on up days and subtracting it on down days. Rising OBV suggests accumulation, while falling OBV signals distribution.
From early November through late January, Zcash’s OBV was forming an ascending trendline. This showed that some Zcash buyers were still trying to accumulate, even as the price traded inside a falling channel.
Want more token insights like this? Sign up for Editor Harsh Notariya’s Daily Crypto Newsletter here.
That support finally failed on January 29. Since this breakdown, Zcash has already fallen nearly 36%. This validates the OBV signal and shows that the loss of volume support directly translated into lower prices.
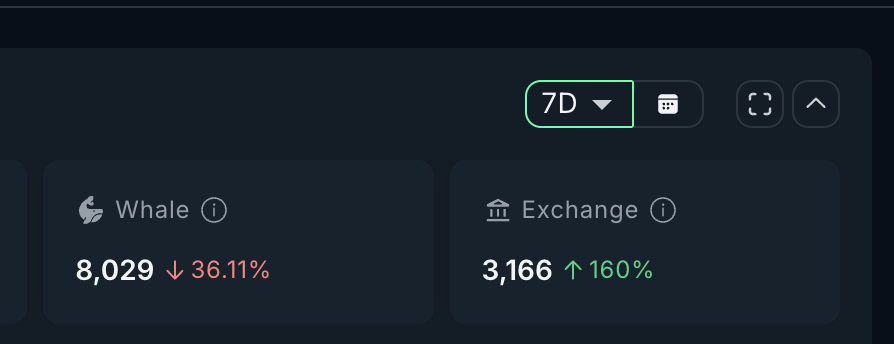
On-chain behavior reinforces this trend. Over the past seven days, whale holdings have declined by around 36%, with large wallet counts falling toward the 8,000 range. This suggests that major holders are trimming exposure rather than accumulating.
Sponsored
Sponsored
At the same time, exchange balances have surged by nearly 160%. Rising exchange supply usually means more tokens are being prepared for sale, increasing immediate selling pressure.
Together, the falling channel, OBV breakdown, whale reduction, and exchange inflows point to sustained distribution. Retail participation is weakening, long-term holders are reducing exposure, and supply is moving toward selling venues. This combination explains why ZEC continues to struggle to hold support.
Derivatives Activity Weakens as Remaining Long Positions Add Risk
With spot participation fading, the next question is whether derivatives can push prices up, as they have during past short squeezes.
So far, the data suggests limited support.
Zcash open interest peaked near $1.13 billion in December. It has now dropped to around $395 million, a decline of nearly 65%. This shows that speculative interest has cooled sharply, with many traders closing positions and moving to the sidelines.
Sponsored
Sponsored
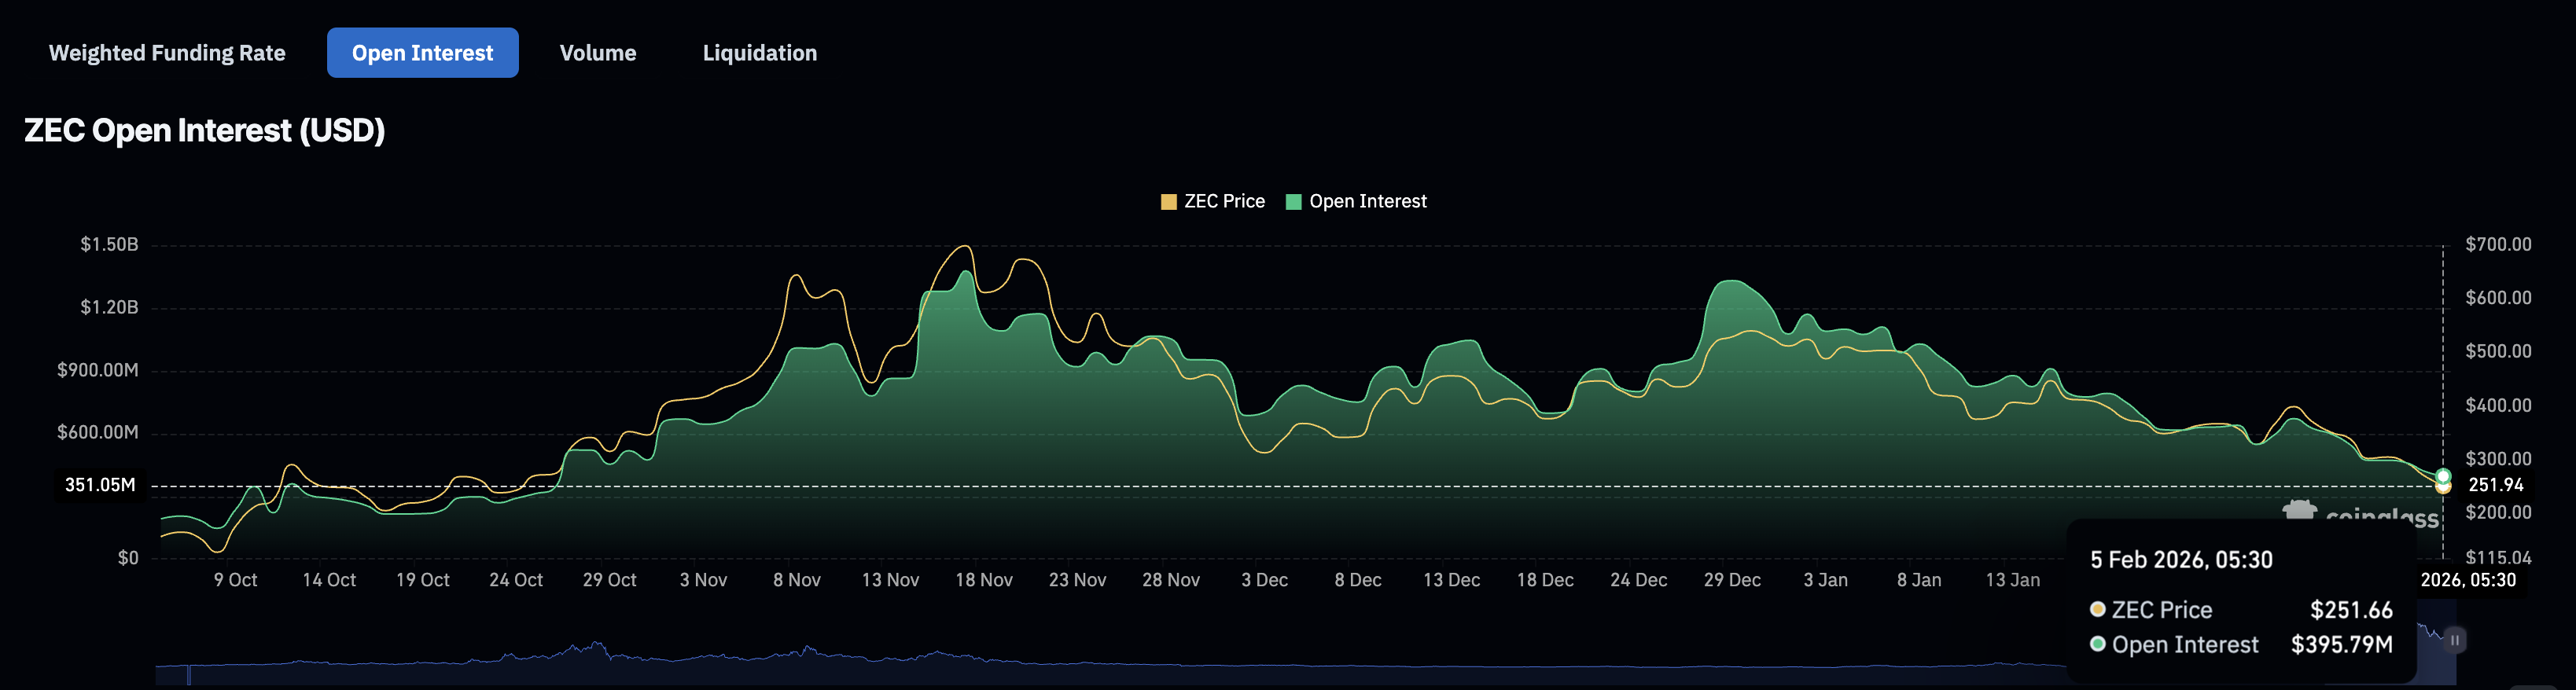
When open interest falls this much, it signals reduced conviction. There is less leverage in the system to drive strong rebounds, and fewer traders willing to defend key levels.
At the same time, funding rates have cooled since October but remain slightly positive. Positive funding means that long positions still dominate, even though overall participation is shrinking. In simple terms, fewer traders are active, but many of those who remain are still betting on higher prices.
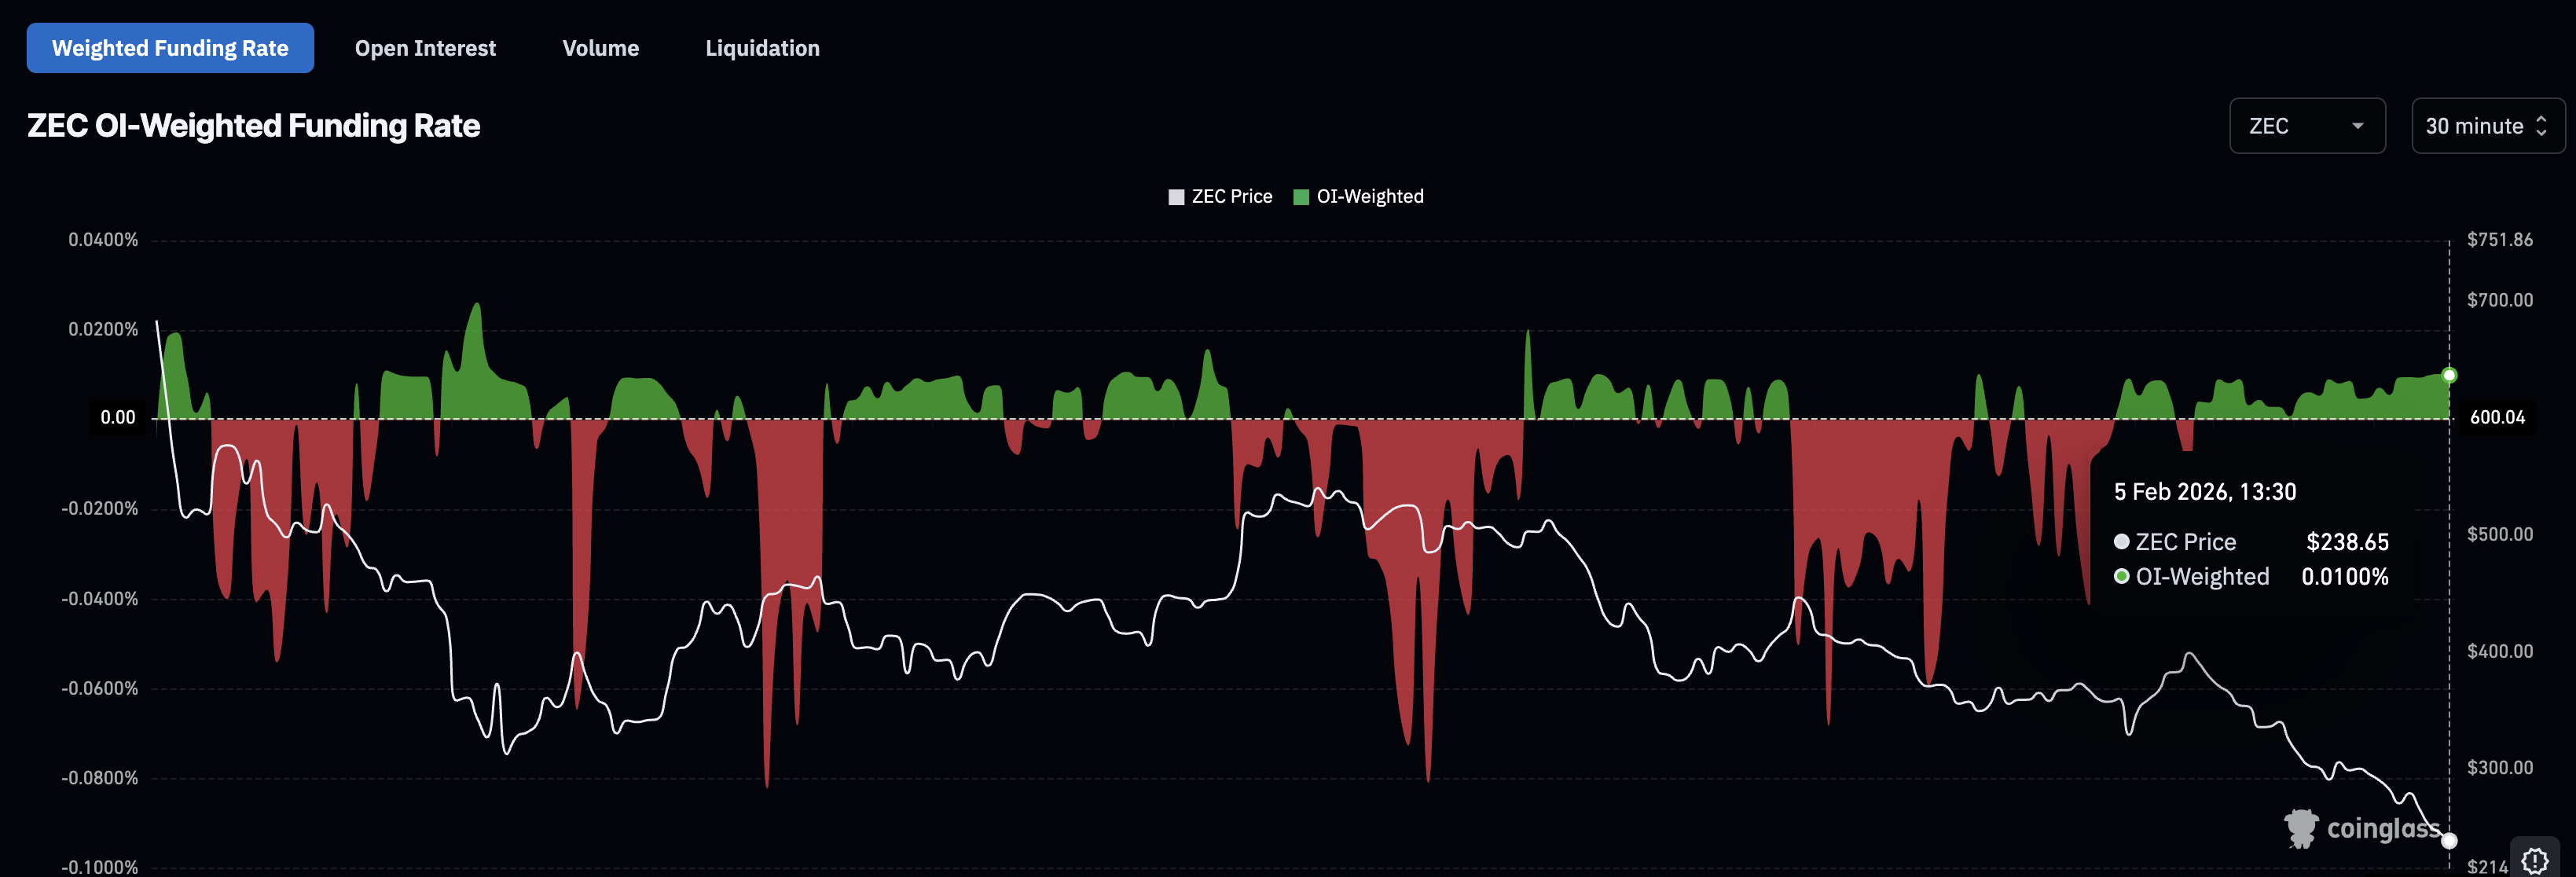
This creates a fragile setup. If prices fall further, these remaining longs become vulnerable to liquidation. When liquidations occur in low-liquidity conditions, they can trigger rapid downside moves.
So even though derivatives no longer have enough “fuel” to drive a major rally, the presence of exposed long positions still amplifies breakdown risk. Instead of supporting price, leverage now increases the chance of accelerated selling.
Sponsored
Sponsored
Key Zcash Price Levels Show Why the $100 Zone Remains in Focus
The Zcash price remains trapped inside its falling channel, with the lower trendline continuing to guide the price lower. The first major support zone sits at $230.
A sustained daily close below $230 would expose the next support near $212, but not without triggering a trendline breakdown.
If $212 fails, the channel projection and Fibonacci extensions both point toward the $103 region. This zone represents the full downside move implied by the current structure.
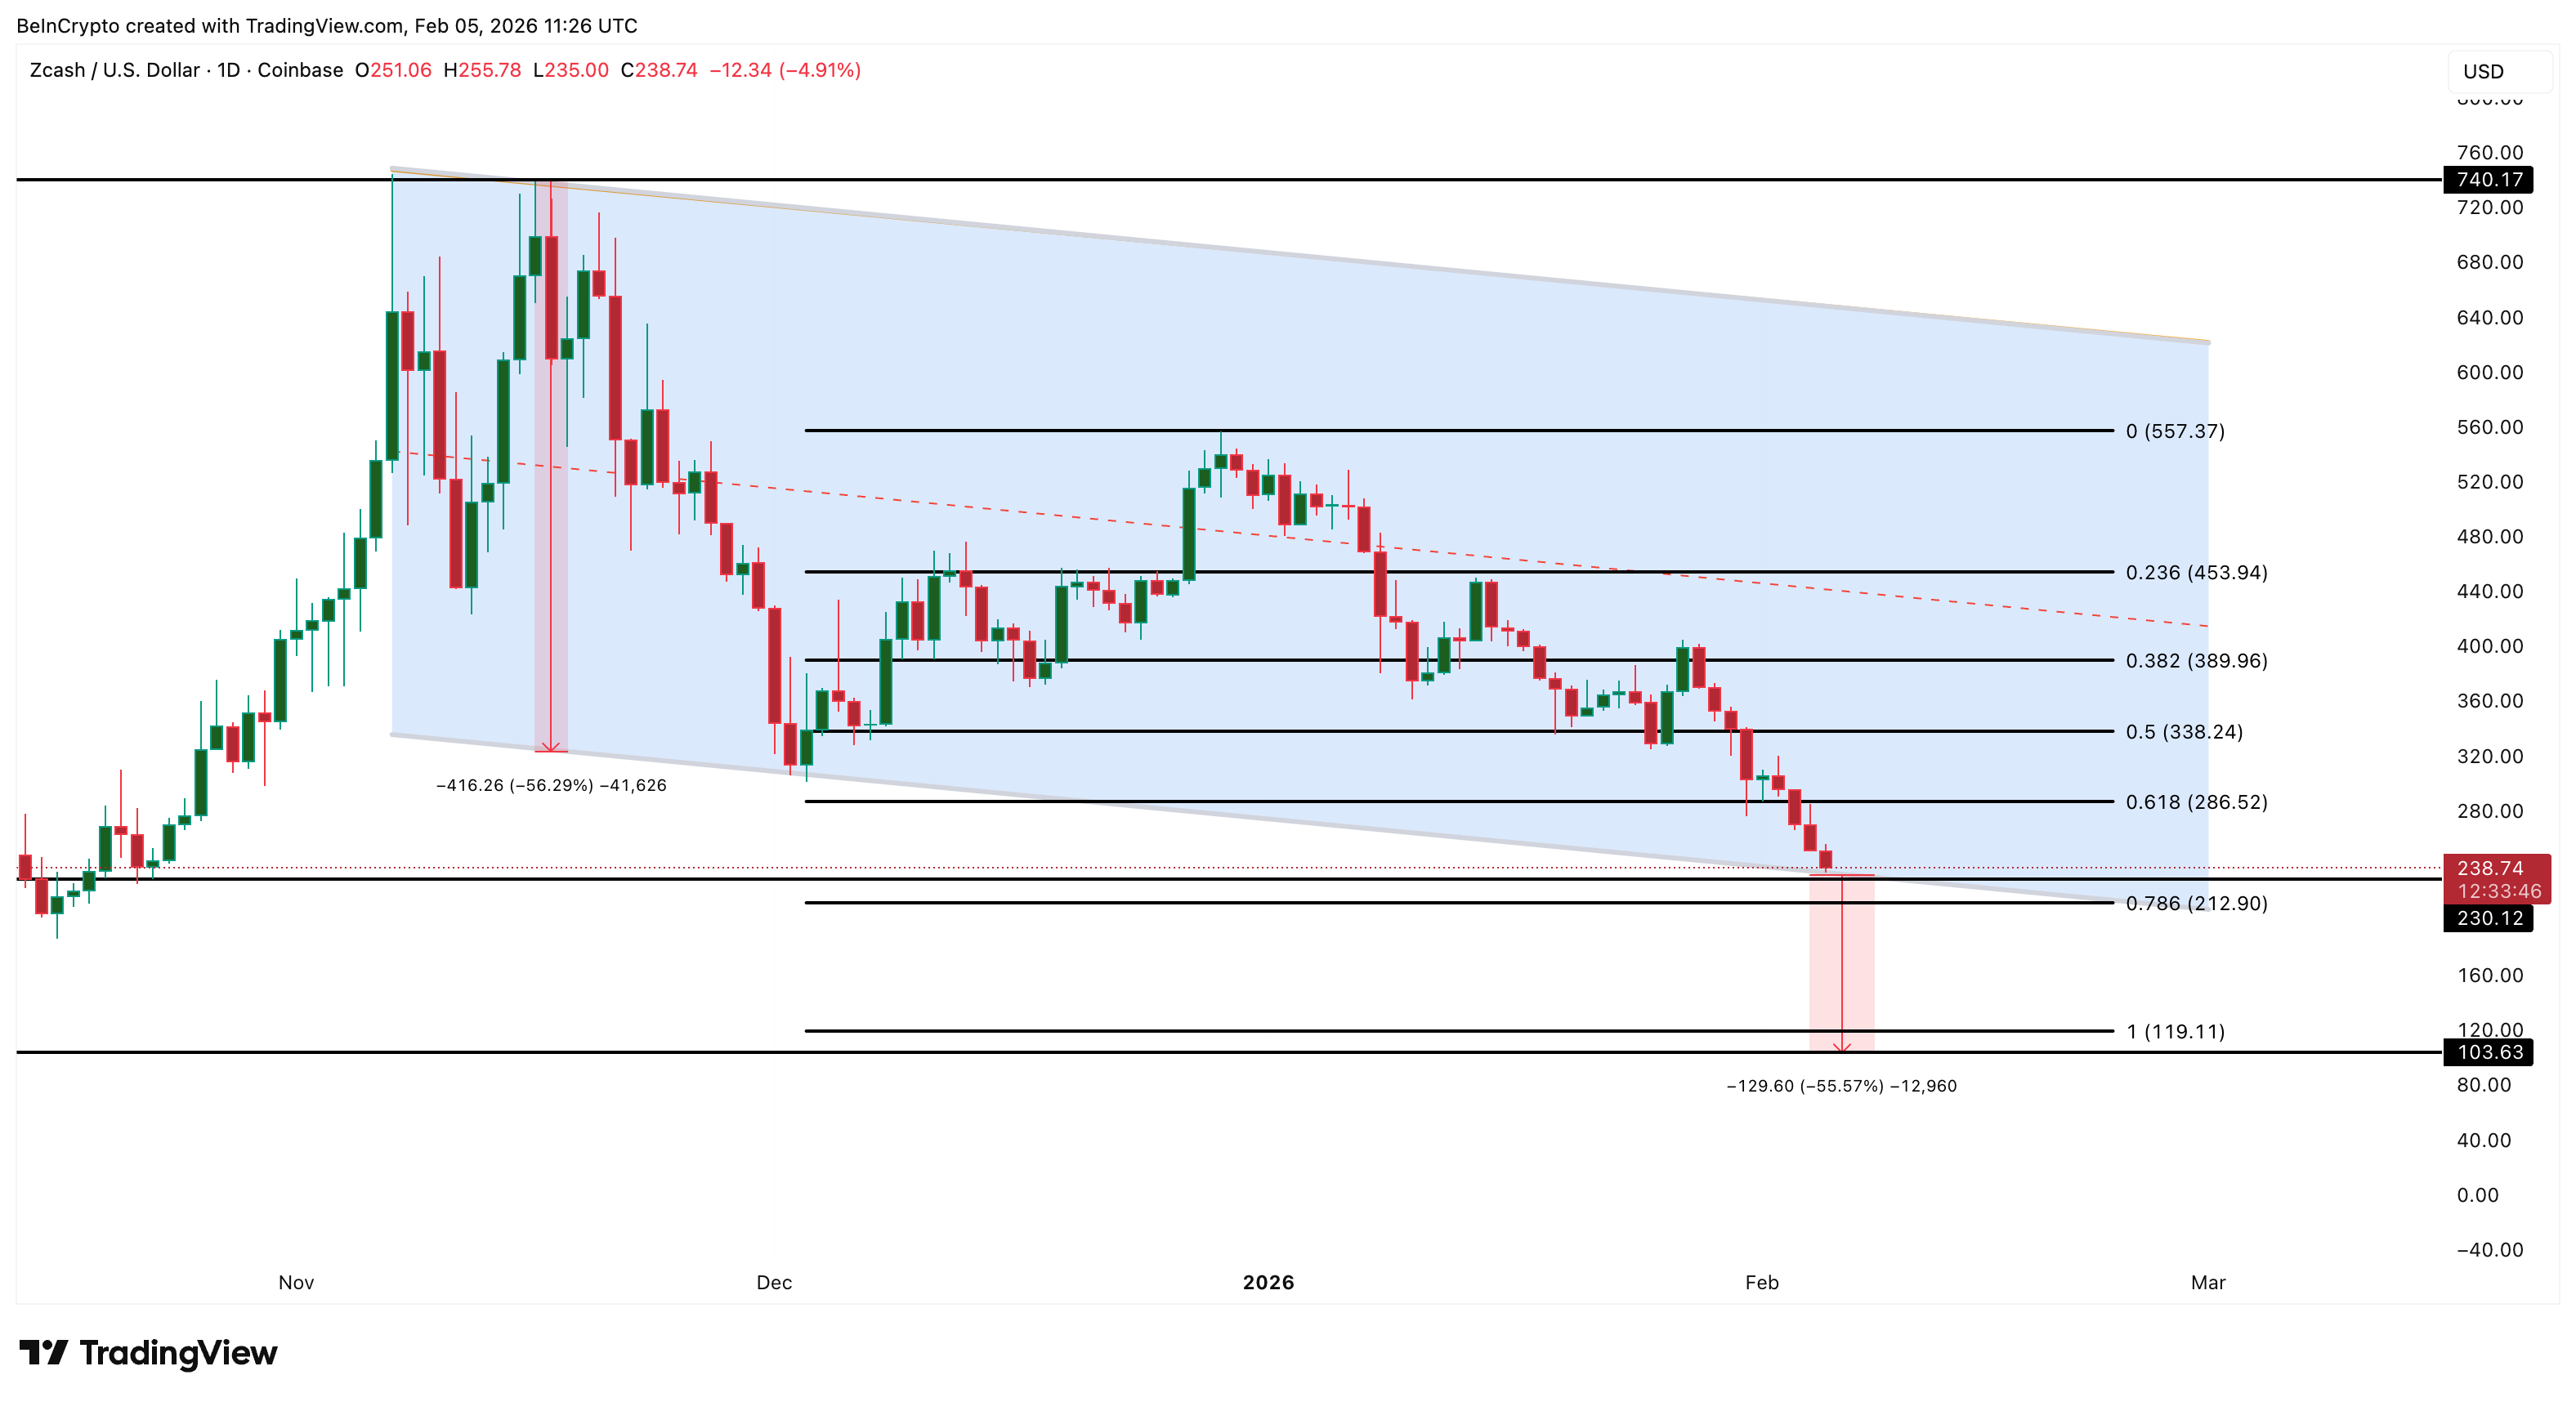
On the upside, recovery remains difficult. ZEC must first reclaim $286 to regain short-term stability. A move above $389 is needed to improve the medium-term structure. A rally toward $557 would require a major revival in volume, whale accumulation, and derivatives participation, making it unlikely under current conditions.
As long as Zcash remains below $230 and fails to hold $212, downside risks dominate. Without renewed participation and capital inflows, the charts continue to favor a move toward the $100 zone.


Institutional demand for digital assets remains resilient even as markets endure ongoing turbulence. New data show that large investors are preparing to increase allocations despite a sharp sell-off since October, signaling that institutions see crypto as part of a diversified, regulated portfolio rather than a short-term trade. In parallel, stablecoins are expanding their footprint beyond trading floors into regulated financial channels, with Japan moving forward on regulated USDC lending products and new models tying digital assets to real-world assets taking shape. At the same time, traditional capital markets are increasingly a venue for crypto enterprises, as Abra pursues Nasdaq listing plans via a SPAC merger. Taken together, these developments suggest a crypto market that continues to mature through regulated, compliant pathways even as volatility and policy questions persist.
On the investor side, sentiment remains constructive. A January survey of 351 investors conducted with Coinbase and EY-Parthenon found that a majority plan to increase their digital asset exposure this year, with 73% indicating they would buy more and 74% expecting price Appreciation over the next 12 months. Bitcoin and Ether continue to anchor entry points for many, but interest is widening into stablecoins and tokenized assets. Notably, roughly two-thirds of respondents expressed a preference for gaining exposure via regulated vehicles, such as exchange-traded products, underscoring a demand for structures that blend crypto access with traditional oversight.
Key takeaways
- Institutional appetite for crypto persists despite volatility: a January survey found 73% of respondents plan to buy more digital assets this year, with 74% anticipating higher prices over the next 12 months.
- Regulated access remains central: two-thirds favor exposure through regulated vehicles like exchange-traded products, signaling a continued shift toward compliant crypto investment avenues.
- Japan expands regulated USDC use: SBI’s USDC lending efforts illustrate a move beyond trading into retail-friendly, regulated stablecoin products in a mature market.
- Crypto firms press for public-market access: Abra is pursuing Nasdaq listing via a SPAC merger, reflecting a broader interest in traditional capital markets amid uneven IPO activity.
- Real-world assets enter yield-enabled crypto models: Theo launches a $100 million gold-linked yield stablecoin vault, a sign that asset-backed and yield-bearing structures are becoming more mainstream.
Institutional demand endures amid volatility
Despite a broad crypto market trough since October, institutional investors appear undeterred about the medium-term trajectory. The Coinbase–EY-Parthenon survey paints a picture of continued capital deployment into digital assets, with participants signaling readiness to scale exposure even as price volatility remains a defining feature of the current cycle. While BTC and ETH remain the core entry points, institutions are increasingly exploring stablecoins and tokenized collateral as part of diversified portfolios. A notable share also indicates a preference for regulated vehicles—such as exchange-traded products—as a preferred channel for gaining crypto exposure—an indicator that risk controls and governance frameworks are expected to accompany future inflows.
The persistence of institutional demand matters for several reasons. First, it helps sustain liquidity and depth in established markets, even when spot prices swing. Second, it accelerates the adoption curve for regulated products and custodial solutions that can meet more conservative risk profiles. Finally, it supports longer-term price discovery that is anchored in institutional participation rather than speculative retail flows alone. As this dynamic unfolds, market participants will be watching how custody, compliance, and reporting standards evolve to accommodate an increasingly diversified investor base.
Japan advances regulated USDC lending and stablecoin use
In Japan, the regulated pathway for stablecoins is expanding beyond trading desks. SBI’s Vic Trade arm has moved forward with a retail USDC lending service, a development that aligns with regulatory clarity already established for Circle’s USDC in the country. The platform will let users lend USDC in exchange for yield, marking one of the first retail-facing products of its kind in Japan and signaling broader institutional confidence in dollar-backed tokens within a controlled framework. The move comes as licensed players gain greater scope to offer regulated stablecoin services, illustrating how formal regulatory acceptance can catalyze new onramps and product segments for both individuals and institutions.
Japan’s approach reinforces a broader pattern: stablecoins are moving from pure trading tools toward regulated financial products that can fit into everyday financial activity. This transition could influence global standards, as other jurisdictions consider how to balance innovation with consumer protection, tax treatment, and cross-border settlement efficiency. For investors, the development widens the menu of regulated entry points into crypto, potentially improving risk parity for diversified portfolios that include stablecoin yield strategies alongside traditional equities and bonds.
Abra eyes Nasdaq through SPAC amid IPO market ebbs and flows
Abra, a long-running crypto wealth manager, is pursuing a public listing via a merger with New Providence Acquisition Corp., a move that would place the combined company on Nasdaq under the ticker ABRX. The deal values the merged entity at approximately $750 million, reflecting a shift in Abra’s focus toward wealth management services—trading, custody, and yield products—after regulatory constraints constrained its earlier lending operations. The SPAC route provides a faster path to public markets in an environment where traditional IPO activity remains tepid, underscoring a continuing willingness among crypto firms to access public capital through alternative routes when regulatory and market conditions are uncertain.
The Abra strategy highlights a broader trend: crypto firms are increasingly pursuing traditional capital markets access as a means to scale and signal legitimacy, even as scrutiny from regulators remains intense. While SPACs can offer speed, they also bring ongoing governance and disclosure expectations that could shape Abra’s strategy in the coming years. Investors will be watching how the company harmonizes its wealth-management-centric model with the transparency and investor protections demanded by public markets, as well as how it navigates evolving digital-asset custody and compliance benchmarks.
Theo introduces gold-backed yield innovation
Theo, a tokenization platform, unveiled a new $100 million vault tied to a gold-backed, yield-bearing stablecoin. The product combines traditional commodity backing with on-chain financial mechanics to deliver price stability alongside yield opportunities. In this hybrid model, gold serves as the collateral underpinning the token’s value, offering an alternative to fiat-backed stablecoins while expanding the range of on-chain income strategies for users. The vault represents a growing wave of experimentation with yield-bearing stablecoins that move beyond simple price stability, exploring how real-world assets and yield-generation can coexist within a regulated, on-chain framework.
Such innovations underscore a broader industry push to bring real-world collateral and cash-flow mechanics into the crypto ecosystem. As platforms experiment with different collateral mixes and automated yield strategies, investors gain access to a wider set of risk-and-reward profiles. Observers will want to monitor how gold-backed models perform in practice, how liquidity and valuation are maintained across stressed market scenarios, and how regulators respond to asset-backed stablecoins that blur the lines between traditional financial products and crypto innovations.
Looking ahead, the momentum across institutions, regulated stablecoins, public-market access, and yield-focused innovations suggests a crypto landscape that is maturing through structured, compliant channels. Market participants should keep a close eye on regulatory developments in key jurisdictions, the rollout of retail products in regulated markets, and the continued evolution of asset-backed and tokenized yield vehicles as potential catalysts for broader adoption and more diverse investment strategies.


Bitcoin (BTC) stayed near the $70,000 level after a volatile week shaped by geopolitical tensions and the latest Federal Reserve meeting. BTC price traded at $70,672.50 at the time of writing, down slightly over 24 hours and up 0.11% over the past seven days.
Summary
- BTC price stayed above $70,000 after sharp swings tied to macro pressure and Fed remarks.
- Analysts said bitcoin’s valuation and realized price levels now resemble past cycle bottom formations.
- Binance outflows averaged $55 million daily, pointing to steady demand behind bitcoin’s recent resilience.
Bitcoin pushed toward $74,000 twice in recent days before failing to hold that level. Over the weekend, BTC price dropped toward $70,000 after market pressure followed U.S. military action on Iranian infrastructure.
The asset then recovered early in the week and climbed to $76,000 on Tuesday, its highest level in almost six weeks. That rally faded quickly. Bitcoin slipped back to $74,000 on Wednesday and then fell from about $74,400 to $71,200 before the FOMC decision.
The Federal Reserve kept interest rates unchanged, which matched market expectations. Bitcoin briefly rebounded to $72,000 after the decision, but later comments from Fed Chair Jerome Powell on inflation and the economy added pressure and pushed BTC down to $68,800 on Thursday.
Even with those losses, bitcoin avoided a deeper breakdown and moved back above $70,000. That recovery has kept attention on current support levels and near-term trader positioning.
Analysts point to cycle and valuation signals
Crypto analyst Michaël van de Poppe said the valuation of BTC against gold is showing a monthly engulfing signal. He wrote, “It doesn’t mean that we immediately go up from here,” while adding that similar setups in 2015, 2018 and 2020 marked bear market lows.
Another market watcher, CryptosRus, said bitcoin is trading near its realized price, a level that has previously aligned with major cycle lows. He said,
“Every time $BTC reaches this zone, it doesn’t stay here for long.”
Moreover, CryptoQuant analyst burakkesmeci said Binance netflow data suggests steady buying demand behind bitcoin’s recent strength. According to his reading, the Binance BTC Netflow SMA30 has stayed below zero, showing sustained exchange outflows.
He said about $55 million worth of BTC has been leaving Binance daily on average. That trend, he said, helped support bitcoin’s rise from $65,000 to $74,000 and may explain why BTC price has remained firm even as broader markets faced pressure.
Disclosure: This article does not represent investment advice. The content and materials featured on this page are for educational purposes only.
An early Ethereum wallet known as thomasg.eth is steadily rebuilding his exposure, according to Arkham Intelligence data.
Arkham data shows that, over the past week, thomasg.eth built a roughly $19.5 million Ether (ETH) position across Arkham-tracked wallets in spot, wrapped ETH (WETH), and Aave-deposited ETH, capped by a fresh $3 million purchase on March 20.
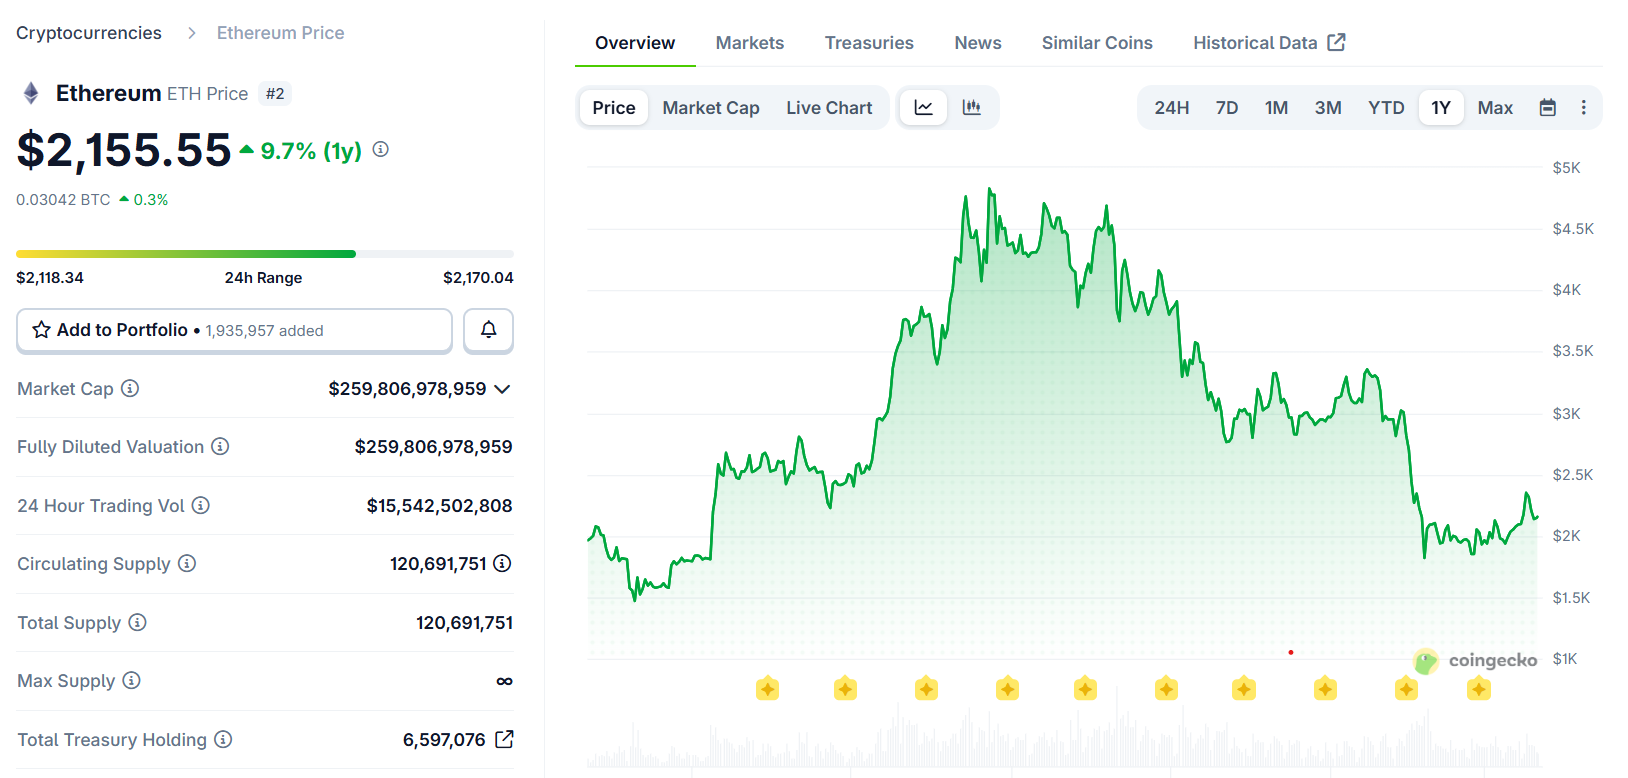
Arkham said the wallet held around $537 million in crypto assets at the 2021 market peak, and has started accumulating again as ETH trades around 56% below its all-time high of $4,946 on Aug. 24, 2025, according to CoinGecko.
The purchases came as US spot Ether exchange-traded funds posted a third straight trading day of net outflows. Data compiled by Farside Investors shows the funds recorded $55.7 million in net outflows on March 18, $136.4 million on March 19 and $42 million on March 20.

Bitmine’s Tom Lee calls ETH bottom
Separately, Bitmine Immersion Technologies, chaired by Fundstrat founder Tom Lee, which holds around 4.6 million ETH, is also doubling down on its conviction. Lee argued this week that the ETH bottom is in, citing analysis from Tom DeMark.
DeMark’s work flags Ethereum’s recent price action as showing a 93% correlation with the Standard & Poor’s (S&P) 500’s recovery after the 1987 crash and 2011 bottom, implying that ETH either bottomed around March 7 or is in the process of bottoming now.
Related: Bitmine speeds pace of Ethereum buys, boosting treasury to 4.6M ETH
Lee also pointed to ETH’s realized price (the onchain average purchase price), currently around $2,241, noting that ETH was trading at a similar discount to that level as at prior major lows in 2022 and 2025.
Over the past decade, he said, ETH has returned roughly 49,000%, far outpacing Bitcoin’s 11,000% and even Nvidia’s parabolic run, arguing that ETH has been a “great store of value” despite brutal drawdowns.
Lee said Bitmine had accelerated purchases in recent weeks because its base case is that Ether is in the final stages of a “mini-crypto winter.”
Magazine: Ethereum’s Fusaka fork explained for dummies — What the hell is PeerDAS?

Key Takeaways
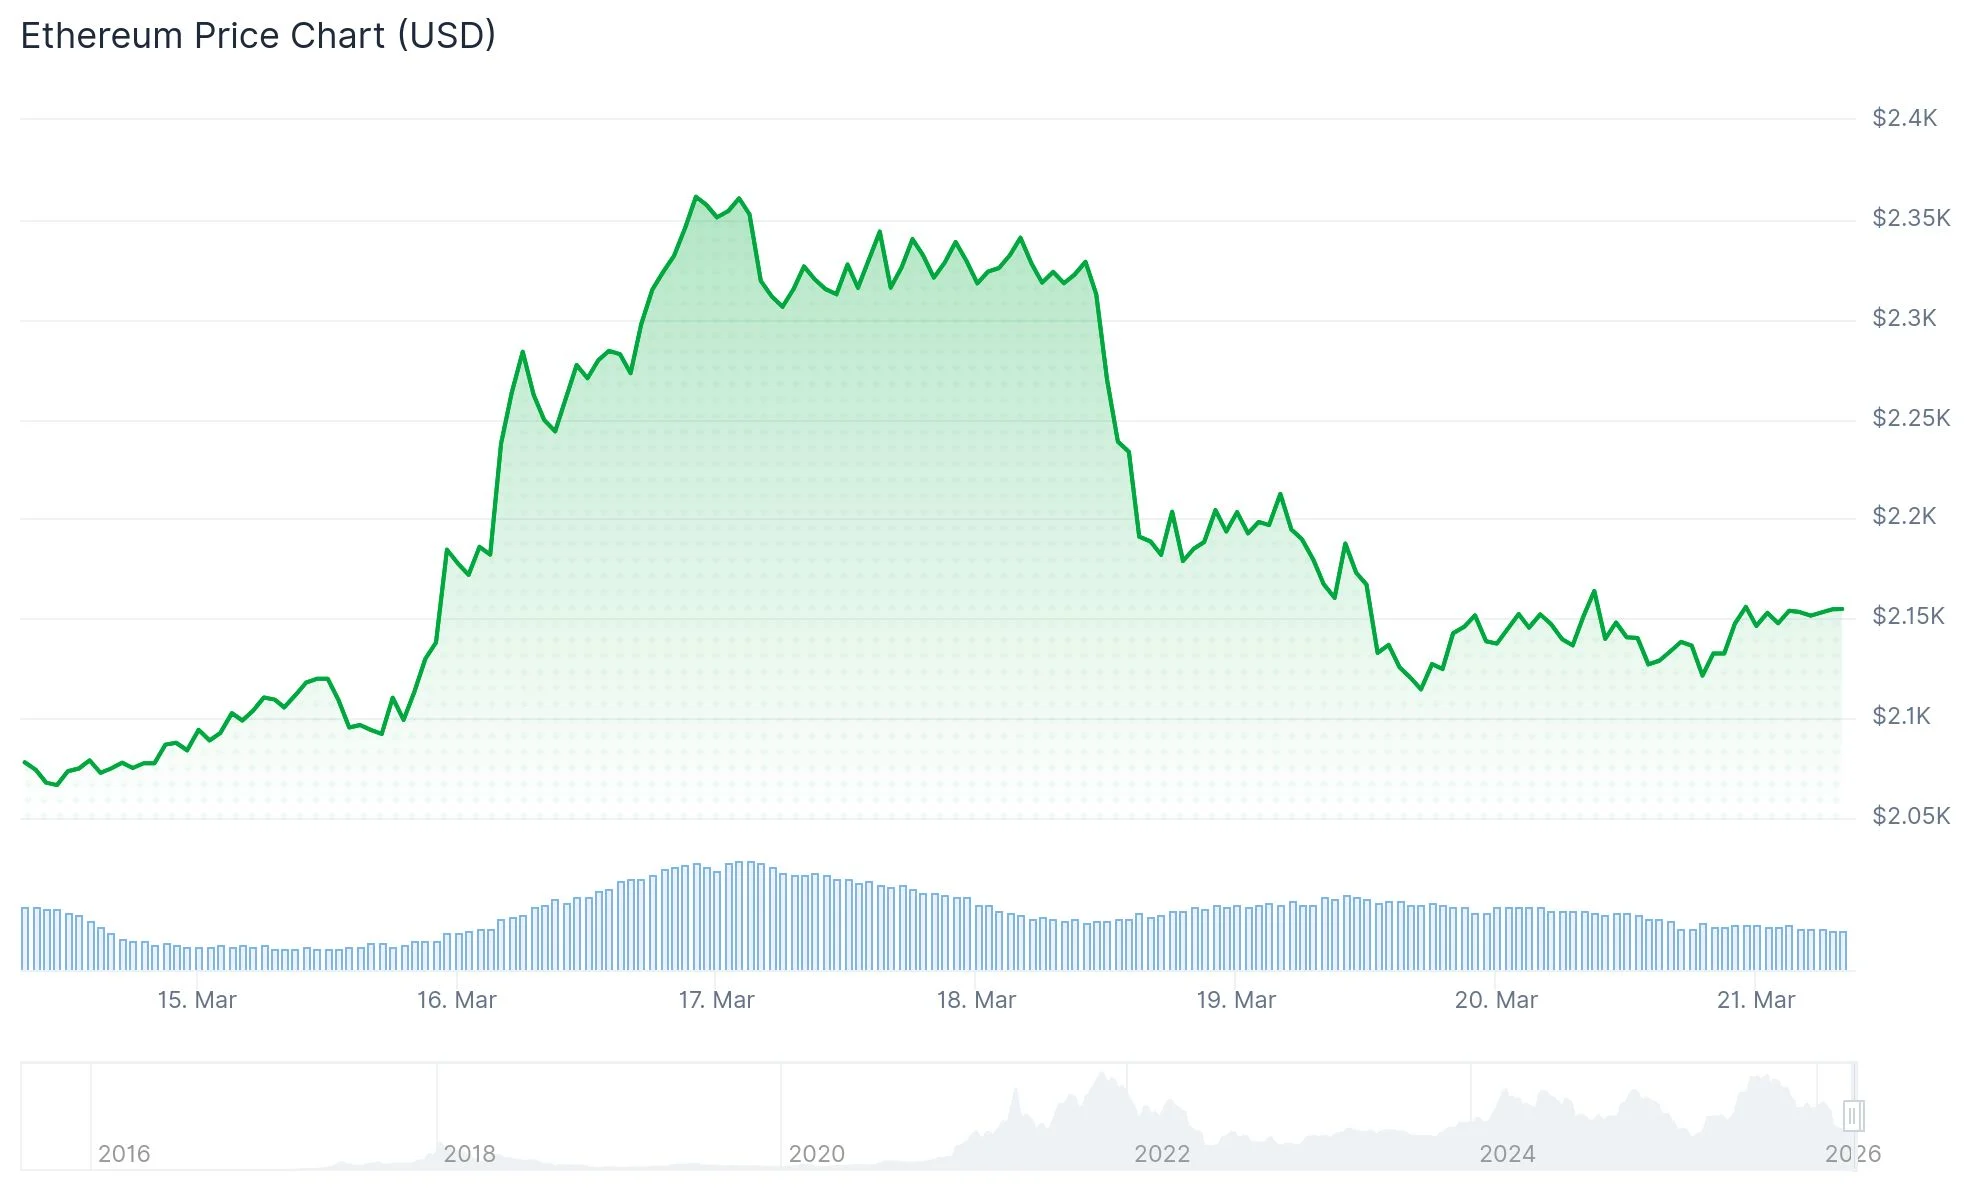
- Ethereum retreated to approximately $2,130 following a peak of $2,390 earlier this week
- BitMine Immersion acquired 60,999 ETH, expanding total reserves to 4.59 million ETH
- Large holders are exiting long positions and establishing short bets while smaller traders buy
- Spot Ethereum ETFs recorded net withdrawals totaling $192.1 million across two consecutive days
- Price filled the CME futures gap at $2,117, with significant buy support clustering near $2,100
Ethereum kicked off the week with impressive upward momentum, surging to $2,390—marking its strongest performance since the beginning of February. The rally was fueled by institutional accumulation, significant whale buying, and heightened activity in the derivatives market.
Early this week, Ethereum treasury company BitMine Immersion (BMNR) announced the acquisition of 60,999 ETH, pushing its cumulative position to 4.59 million ETH. Simultaneously, open interest across ETH derivatives markets reached levels not seen since September of last year.
However, the upward trajectory lost momentum. Escalating geopolitical tensions in the Middle East drove oil prices higher and diminished market expectations for interest rate reductions in 2026, creating a risk-off environment that impacted cryptocurrency valuations.
ETH encountered resistance near its realized price—the average on-chain acquisition cost—hovering around $2,310. This metric has consistently acted as a profit-taking zone during fragile uptrends, as holders reach breakeven points and liquidate positions.
Institutional Outflows Intensify Downward Pressure
Following six consecutive days of capital inflows, US spot Ethereum ETFs reversed course with net outflows. Approximately $192.1 million exited these investment vehicles over a 48-hour period, compounding the selling pressure on ETH.

Within a single 24-hour window, Ethereum experienced $39 million in forced liquidations, with long positions accounting for $21.2 million of that total, based on Coinglass tracking data.
On-chain researcher Boris identified what appears to be a developing liquidity trap. As Ethereum approached the $2,400 threshold, the Whale vs Retail Delta indicator shifted decisively negative. Major holders were systematically closing bullish positions and initiating bearish bets, while retail participants moved in the opposite direction—aggressively accumulating.
Boris observed that although buying demand remained robust temporarily, it was ultimately absorbed by available sell-side liquidity. The market has now transitioned into a consolidation period. Liquidation heatmaps reveal substantial long position accumulation, with critical liquidation zones identified at $1,850 and lower price points.
Futures Gap Closure at $2,117 Level
Market technician CW verified that Ethereum successfully closed its CME futures gap positioned at $2,117. A substantial accumulation zone has developed around the $2,100 price point, which coincides with the 0.382 Fibonacci retracement level. Should a rebound materialize from this area, the subsequent upside target sits at $2,686.
Ethereum is presently challenging the $2,110 support area, which corresponds with the 20-day exponential moving average. A decisive breakdown beneath this threshold could expose deeper support levels at $1,740, followed by $1,524. For bullish continuation, ETH requires a daily candle close above $2,390 to validate renewed upward momentum.
The Relative Strength Index remains positioned near the neutral 50 mark, indicating equilibrium with diminishing bullish pressure.
Cryptocurrency analyst Ted shared his perspective on X: “$ETH bounced back from its $2,100 support zone. The move is looking a bit weak, as spot buyers aren’t here. This means Ethereum could drop below the $2,100 level again given rising macro uncertainty and low institutional demand.”
Current market conditions show ETH maintaining a precarious position just above $2,100, with ETF outflows persisting and macroeconomic headwinds from Middle Eastern geopolitical developments continuing to influence trading sentiment.


XRP price fell back to $1.44 after failing at $1.60, as wallet growth rose but momentum stayed weak.
Crypto World
FBI Issues Urgent Warning as Russian Hackers Target Signal Users and Compromise Thousands of American Accounts

TLDR:
- Russian intelligence-linked hackers have compromised thousands of Signal accounts through targeted phishing campaigns globally.
- High-value targets include current and former U.S. government officials, military personnel, journalists, and political figures.
- Signal’s encryption remains unbroken — Russian hackers bypass it by stealing user credentials through social engineering.
- The FBI urges Americans to never share PINs or 2FA codes and to report suspicious activity to IC3.gov immediately.
The FBI has issued a stark warning about Russian hackers actively targeting Americans who use Signal and other commercial messaging apps.
Working alongside the Cybersecurity and Infrastructure Security Agency, the bureau confirmed that thousands of individual accounts have already been compromised.
The campaign focuses on high-value targets, including current and former U.S. government officials, military personnel, political figures, and journalists. Authorities stress that Signal’s encryption is not at fault — end users are the primary vulnerability.
FBI Confirms Russian Hackers Are Actively Compromising Signal Accounts Across the Globe
Russian hackers linked to the country’s intelligence services have been running a coordinated phishing campaign against Signal users.
The operation involves sending messages disguised as official CMA support communications to unsuspecting targets. Once a user interacts with the message, the attacker gains full access to their account.
FBI Director Kash Patel publicly confirmed the threat, warning Americans through an official statement on X.
After gaining access, Russian hackers can read private messages and browse full contact lists. They can also send messages while posing as the account owner. This creates a chain of trust-based attacks that are difficult for recipients to detect.
The phishing messages are carefully tailored to each target, making them appear legitimate and urgent. Victims are typically asked to click a link, provide a verification code, or submit an account PIN. Any of these actions immediately hands control of the account to the attacker.
Authorities noted that the campaign continues to evolve. Russian hackers may expand their methods to include malware designed to infect victim devices directly. This development moves the threat beyond social engineering into more technically advanced territory.
Signal’s end-to-end encryption remains fully operational and has not been breached. However, the FBI warned that phishing renders encryption irrelevant when attackers access accounts directly. No level of encryption can protect a user who unknowingly hands over their credentials.
What Americans Can Do Right Now to Protect Their Signal Accounts
The FBI and CISA released joint guidance to help Americans defend against the ongoing Russian hacker campaign.
The first step is straightforward: stop all interaction the moment a message feels suspicious. Users should never share PINs or two-factor authentication codes for actions they did not personally initiate.
Any unsolicited message requesting account information should be treated as a potential phishing attempt. Even messages appearing to come from known contacts warrant caution if they contain unusual requests.
When uncertain, users should contact the sender through a completely separate channel before responding.
Group chats also need to be monitored carefully for unauthorized participants. Users should scan participant lists regularly for duplicate or unfamiliar accounts.
Any anomaly should be verified through secure communication outside of the app before further messages are shared.
The FBI reminded Americans that legitimate Signal support never sends verification links through direct messages.
Real support teams communicate exclusively through official email channels and never request codes or PINs inside the app. Any message claiming otherwise is almost certainly a phishing attempt by Russian hackers.
Americans who suspect they have been targeted should report the activity to the Internet Crime Complaint Center at IC3.gov or contact their nearest FBI field office.
Organizational IT and security teams should also be notified immediately. Fast reporting strengthens the FBI’s ability to track the campaign and protect additional accounts from being compromised.

Key Takeaways
- SanDisk (SNDK) shares tumbled 8.08% Friday with no apparent trigger for the decline
- Citi’s Asiya Merchant increased her price target to $875 from $750 while maintaining a Buy recommendation
- The target increase comes after Micron indicated NAND supply will trail demand indefinitely
- SNDK has gained more than 201% year-to-date and approximately 1,200% over the trailing twelve months
- Consensus analyst target of roughly $700 trails the stock’s current level near $734
Shares of SanDisk experienced a steep decline Friday, losing more than 8% of their value, despite receiving an upgraded price target from a prominent Wall Street analyst. The contrasting signals have investors debating whether this represents an attractive entry point or a red flag.
Asiya Merchant from Citi increased her SanDisk (SNDK) price objective to $875, up from her previous $750 target, while reaffirming her Buy recommendation. Her analysis followed Micron’s recent quarterly results, where the company projected NAND demand would outpace available supply indefinitely. Merchant identified this supply-demand imbalance as a fundamental reason for maintaining optimism about SNDK.
Despite the Friday selloff, the stock’s performance has been exceptional. SNDK has climbed approximately 201% since the start of the year and skyrocketed over 1,200% during the past twelve months. The company’s market capitalization currently stands at approximately $114 billion.
The optimistic outlook for SanDisk is rooted in AI-powered demand growth for data storage solutions. Data centers have emerged as the primary purchasers of NAND flash memory, eclipsing traditional markets like smartphones and personal computers. SanDisk’s CEO David Goeckeler noted that data center demand projections were substantially revised upward twice in succession — initially from mid-20% growth to mid-40%, then escalating to mid-to-high 60% growth expectations for calendar 2026.
Goeckeler clarified that AI enterprises aren’t merely reselling storage capacity. Their usage continues expanding independent of NAND pricing trends. “Their business model is not dependent on the volume of NAND they buy,” he stated during a recent industry conference.
Constrained Supply Meets Surging Demand
SanDisk posted 64% quarter-over-quarter revenue growth in its data center segment last quarter, propelled by enterprise SSD certifications at leading hyperscalers translating into actual sales.
Regarding supply dynamics, NAND capital equipment investment has decreased even as market conditions grow tighter. Bringing new production capacity online requires multiple years. SanDisk allocated over $1 billion to secure fabrication facility space extending through 2030 to 2035 — a strategic wager on persistent demand strength.
Executives also highlighted a prospective growth catalyst: key-value cache technology for AI inference workloads. Preliminary projections suggest this application could generate incremental demand of 75 to 100 exabytes in 2027 alone.
Strategic Multi-Year Agreements Taking Shape
Instead of transacting on a quarterly basis, SanDisk is transitioning toward extended contracts with data center clients. These agreements, spanning one to five years, aim to safeguard profit margins throughout market cycles and secure expanding exabyte commitments. The company has finalized one such arrangement and reports additional deals are under negotiation.
Analysts following SNDK project revenue climbing from $7.36 billion in fiscal 2025 to $26.78 billion by fiscal 2027. Earnings per share are anticipated to surge from $2.99 to $87.40 during that timeframe.
Among 21 analysts monitoring SNDK, 14 assign it a Strong Buy rating, one recommends Moderate Buy, and six advise Hold. The mean price target stands at $700.94 — beneath the current trading level around $734. This divergence between the consensus estimate and actual price adds complexity to interpreting Friday’s pullback for potential buyers.
Citi’s $875 projection represents the most aggressive bullish target on Wall Street and substantially exceeds the analyst consensus.
TLDR:
- Gold dropped 10.5% to $4,490, marking its worst weekly performance since the Federal Reserve’s 1982 rate hike era.
- A surging US dollar made gold costlier for international buyers, adding pressure on an already declining price trend.
- CME Group raised margin requirements, forcing leveraged traders to liquidate positions and accelerating the weekly decline.
- After a similar 1982 crash, gold recovered 50% within 12 months, drawing renewed attention from long-term market investors.
Gold has posted its worst weekly performance in 43 years, losing 10.5% to settle at $4,490. The steep decline has caught markets off guard, particularly given the current geopolitical climate.
War, rising inflation, and oil market disruptions are all present in the background. These are conditions that have historically pushed the metal’s price higher, not lower.
The drop against a bullish backdrop has made this one of the most closely watched commodity moves in years.
A Crash With No Historical Parallel
Gold’s biggest crashes in modern history all came with clear bearish catalysts. In 1982, the Federal Reserve raised interest rates to 20% to fight inflation. That policy move directly weakened the metal’s appeal as a reliable store of value during uncertainty.
In 2013, the Fed signaled it would begin tapering its bond-buying program. Markets read that as a shift toward tighter policy, which weighed heavily on prices. The 2022 decline followed a nearly identical script, as aggressive rate hikes cooled demand for the commodity.
March 2026 breaks from that pattern entirely. Crypto and commodity analyst Bull Theory noted on social media that war is ongoing and inflation is rising.
Oil refineries are burning, and three US warships have been deployed to the region. Each of those factors would normally drive investors toward the safe-haven metal.
Yet the commodity fell sharply despite all of it. That disconnect between fundamentals and price action is what makes this week historically unusual. Analysts are calling it one of the most confusing price moves in decades.
Three Market Forces Driving the Drop
Bull Theory identified three forces hitting gold at the same time. The US dollar has surged on safe-haven demand, making the metal more costly for buyers outside the United States. When the dollar rises sharply, prices often come under pressure in non-dollar markets.
At the same time, commodity funds have been selling to cover losses from oil margin calls. When oil trades poorly, fund managers liquidate positions to raise cash quickly. That wave of coordinated forced selling can move prices sharply in a short time.
The CME Group also raised margin requirements during the week. That move forced leveraged traders to sell their positions to meet the new thresholds. Combined with the dollar rally and margin call selling, the three forces created a compounding effect on price.
However, history offers some perspective on what may follow. After the 1982 crash, the metal recovered strongly, gaining 50% over the next 12 months.
Past performance does not guarantee future results, but this historical precedent has drawn attention from long-term investors. Market watchers continue to track whether similar patterns emerge in the months ahead.

Key Takeaways
- CEG shares closed at $281.99, marking a 10.9% decline that significantly outpaced the S&P 500’s 1.51% retreat
- Major technology companies are reportedly scaling back commitments to large-scale power agreements, undermining key growth assumptions
- Federal regulators proposed a rate ceiling for the PJM mid-Atlantic grid that could restrict CEG’s pricing power
- An industrial chemical incident at a Constellation facility resulted in employee hospitalizations, raising operational questions
- Wall Street forecasts remain intact with Q1 EPS projected at $2.70, representing 26% annual growth, and full-year sales estimated at $38.71 billion
Shares of Constellation Energy (CEG) took a beating on Thursday, plummeting 10.9% to finish at $281.99. The decline was particularly brutal given that broader equity indexes faced only modest weakness.
Constellation Energy Corporation, CEG
The stock faced simultaneous headwinds from three distinct angles — each serious enough to move shares on its own.
The most significant development centered on emerging reports that major hyperscale technology firms are reconsidering their long-term power procurement strategies. These agreements had formed a critical pillar of CEG’s investment thesis, particularly around powering next-generation artificial intelligence infrastructure.
With that narrative showing cracks, market participants began reassessing whether the stock’s valuation premium remained justified.
Regulatory developments compounded the damage. News surfaced of a proposed federal cap on electricity rates within the PJM Interconnection, a regional transmission grid spanning the mid-Atlantic where Constellation maintains substantial nuclear generation capacity. Such restrictions would effectively limit the company’s ability to capture higher margins during peak demand periods.
The market’s reaction was swift and unforgiving.
Facility Incident Compounds Negative Sentiment
Operational concerns added another layer of uncertainty. A chemical release at one of the company’s power generation sites resulted in multiple workers requiring medical treatment, introducing safety and operational risk questions into the mix.
While the incident’s scope wasn’t large-scale, its timing couldn’t have been worse. When investor confidence in a growth story is already fragile, even secondary concerns can accelerate selling pressure.
The convergence of demand skepticism, regulatory constraints, and operational mishaps created a perfect storm for shareholders.
Wall Street Forecasts Remain Unchanged
Interestingly, sell-side expectations for the company’s financial performance haven’t shifted materially despite the stock’s tumble. Analysts continue to anticipate first-quarter earnings per share of $2.70, marking a 26% improvement compared to the prior-year period.
For the full fiscal year, consensus estimates project earnings of $11.63 per share on revenue reaching $38.71 billion — which would represent a substantial 51.6% top-line expansion if realized.
The Zacks consensus earnings estimate has actually increased 2.41% during the past 30 days, while CEG maintains a Zacks Rank of #3, indicating a Hold rating.
The company’s forward price-to-earnings multiple stands at 27.22 — notably higher than the industry benchmark of 18.86 — suggesting the market had been pricing in robust growth prospects before this week’s turbulence.
Its PEG ratio of 1.77 sits below the Alternative Energy sector’s 2.0 average, offering some relative value support.
It bears mentioning that prior to Thursday’s collapse, CEG had gained 8.51% over the preceding month — indicating the stock had been building momentum before this abrupt reversal.
Year-to-date performance now registers at -10.3%, illustrating how dramatically sentiment has shifted in early 2026.
Market participants will be scrutinizing the company’s next earnings report for management commentary on the status of technology sector power agreements and any additional details regarding the facility incident.

Quick Overview
- CleanSpark delivered fiscal 2025 revenue expansion exceeding 100% and maintains a Moderate Buy rating from 15 Wall Street analysts
- MARA Holdings receives a Hold rating but brings significant scale plus a Bitcoin balance sheet approach that may prove valuable if crypto remains elevated
- Riot Platforms saw expanding revenue momentum through 2025 while analysts monitor its energy infrastructure and data center operations
- Bitdeer shows the steepest potential gains with analyst targets suggesting 200%+ upside, contingent on successful SEALMINER chip deployment
- Galaxy Digital operates across trading desks, fund management, advisory services, and mining, earning a Moderate Buy from 15 analysts
With Bitcoin showing renewed vigor in 2026, Wall Street has turned its focus back to a select group of cryptocurrency-exposed equities. Five companies have emerged as particularly interesting: CleanSpark, MARA Holdings, Riot Platforms, Bitdeer Technologies, and Galaxy Digital. This cohort represents the full spectrum of Bitcoin mining operations, energy management, proprietary hardware development, and comprehensive digital asset financial services.
CleanSpark
CleanSpark stands out as having among the most compelling operational narratives in the space currently.
The firm delivered fiscal 2025 top-line expansion exceeding 100%. Growth at that magnitude commands investor attention.
According to MarketBeat tracking, the stock holds a Moderate Buy rating based on 15 analyst opinions — comprising 13 buy recommendations, 1 hold, and 1 sell. The thesis centers on consistent operational delivery paired with a valuation multiple that appears attractive when benchmarked against comparable crypto infrastructure businesses.
MARA Holdings
MARA Holdings generates more debate among the analyst community, which is precisely why certain investors identify opportunity.
Marathon Digital Holdings, Inc., MARA
While the company delivered robust annual revenue expansion, it currently holds a Hold rating on MarketBeat based on 7 buy ratings, 3 holds, and 2 sells. The more measured outlook probably stems from the stock’s track record of sharp price swings.
What distinguishes MARA from traditional mining operations is its corporate Bitcoin accumulation approach. Should cryptocurrency valuations hold steady and the company enhance operational margins, analyst sentiment could turn more favorable.
Riot Platforms
Riot Platforms experienced notably stronger revenue momentum throughout 2025. MarketBeat shows a Moderate Buy rating across 18 analysts — broken down as 16 buys, 1 hold, and 1 sell.
Riot’s investment case extends beyond Bitcoin production. Market participants are increasingly focused on its power generation capabilities and expanding high-performance computing facilities.
This strategic diversification may enable the shares to command a premium valuation as investors begin viewing it through an infrastructure lens rather than solely as a cryptocurrency miner.
Bitdeer Technologies
Bitdeer represents the most speculative opportunity within this cohort.
MarketBeat data indicates an average Wall Street price objective of $26.60, suggesting potential appreciation exceeding 200% from current trading levels. Multiple firms maintain constructive ratings despite moderating their price targets recently.
The optimistic scenario hinges on accelerating revenue, expansion of proprietary mining operations, and successful commercialization of its SEALMINER chip technology. Execution challenges are substantial, yet so are the potential returns if management delivers on its roadmap.
Galaxy Digital
Galaxy Digital operates the most diversified business model among these five companies.
Instead of concentrating exclusively on mining or acting as a proxy for exchange activity, Galaxy maintains operations spanning proprietary trading, venture capital, wealth management, corporate advisory, and Bitcoin production. MarketBeat reflects a Moderate Buy consensus including 1 strong buy, 11 buys, 2 holds, and 1 sell. Average analyst price targets cluster between $42.54 and $42.77.
Galaxy’s market capitalization appears modest relative to the breadth of its revenue streams, especially considering its involvement in high-performance computing expansion via its Helios infrastructure project.
Final Thoughts
These five enterprises represent distinct risk-return profiles. CleanSpark and Riot present more balanced propositions. MARA delivers scale but faces ongoing valuation questions. Bitdeer offers the steepest potential appreciation alongside the greatest execution uncertainty. Galaxy provides the broadest exposure across crypto sector verticals.
Key near-term factors influencing this group include Bitcoin price stability, energy cost trajectories, mining hardware efficiency improvements, and advancement of their respective data center initiatives. Among company-specific developments, Galaxy’s Helios buildout and Bitdeer’s SEALMINER deployment timeline represent the most closely monitored milestones as 2026 progresses.
IPL 2026: KKR asked to fix Rinku Singh ‘problem’ | Cricket News
Martin Lewis says ‘demon appliance’ is ‘really expensive’ and bad for energy bills
Potential Red Sea Route Disruption Could Push Oil Even Higher Amid Houthi Threat


-

 Tech6 days ago
Your Legally Registered ‘Motorcycle’ Might Not Count Under Proposed US Law
-

 Politics16 hours ago
Jenni Murray, Long-Serving Woman’s Hour Presenter, Dies Aged 75
-
 Tech4 days ago
Are Split Spacebars the Next Big Gaming Keyboard Trend?
-

 Fashion16 hours ago
Weekend Open Thread: Adidas – Corporette.com
-
Sports7 days ago
Why Duke and Michigan Are Dead Even Entering Selection Sunday
-

 Business6 days ago
Search for Savannah Guthrie’s Mother Enters Seventh Week with No Arrests
-

 Business7 days ago
US Airports Launch Donation Drives for Unpaid TSA Workers as Partial Government Shutdown Enters Fifth Week
-
Crypto World7 days ago
Coinbase and Bybit in Investment Talks: Could Bybit Finally Enter the US Crypto Market?
-
 Crypto World11 hours ago
NIO (NIO) Stock Plunges 6.5% as Shelf Registration Sparks Dilution Worries
-

 Business5 days ago
Australian shares drop as Iran war enters third week
-

 Business7 days ago
Country star Brantley Gilbert enters growing non-alcoholic beer market
-

 Politics3 days ago
The House | The new register to protect children from their abusers shows Parliament at its best
-

 Crypto World5 days ago
Crypto Lender BlockFills Enters Chapter 11 with Up to $500M in Liabilities
-

 News Videos3 days ago
RBA board divided on rate cut, unusually buoyant share market | Finance Report | ABC NEWS
-

 Fashion5 days ago
25 Celebrities with Curly Hair That Are Naturally Beautiful
-

 Tech1 day ago
inKONBINI Lets You Spend Summer Days Behind the Register
-

 Crypto World3 days ago
Canada’s FINTRAC revokes registrations of 23 crypto MSBs in AML crackdown
-
 Politics4 days ago
Real-time pollution monitoring calls after boy nearly dies
-

 Crypto World7 days ago
Crypto Losses Drop 87% in February, But Hackers Are Now Targeting People, Not Code
-
 NewsBeat3 days ago
Residents in North Lanarkshire reminded to register to vote in Scottish Parliament Election


You must be logged in to post a comment Login