

Crypto World
Legal Dispute Emerges Over 61,000 Bitcoin Seized by UK Police

Victims of a Chinese investment fraud are challenging a United Kingdom proposal to compensate them through a Chinese redress scheme, arguing the plan could leave British authorities holding much of the upside from roughly 61,000 Bitcoin seized in a money-laundering investigation.
According to the Financial Times, citing court documents, the dispute has moved into the UK High Court as groups representing victims seek to recover funds linked to the cryptocurrency seized by police in London. The Bitcoin (BTC) haul is now worth about 3.2 billion pounds ($4.3 billion) after rising sharply in value since the assets were confiscated.
Law firm Candey, which represents about 5,700 victims, said the proposed compensation arrangement may not guarantee fair restitution. The fraud scheme itself reportedly affected more than 128,000 investors in China, according to court documents cited by the FT.
The case highlights growing legal questions around crypto seizures, where digital assets can appreciate significantly between confiscation and restitution. The dispute stems from a Chinese investment fraud scheme that ran between 2014 and 2017 and defrauded investors before proceeds were converted into BTC and moved abroad.
Prosecutors say claims could exceed losses
Prosecutors reportedly argued that some of the legal claims could allow a subset of victims and litigation funders to recover sums exceeding their actual losses.
Martin Evans KC, representing the Director of Public Prosecutions, said in court submissions that the claims risk benefiting “a small subset of victims and their litigation funders” while excluding other victims and the Crown, according to the FT.
Related: UK elections: How crypto donation risks are dividing MPs
Candey defended the legal action, saying court proceedings give victims the best chance of securing proper compensation and noting that its legal fees are capped at 18% of any recovered funds.
A preliminary hearing is scheduled for July to determine whether English or Chinese law should govern the claims to the seized Bitcoin. The High Court has also set a May 22 deadline for claimants seeking recovery under Section 281.
Bitcoin seizure linked to London mansion purchase attempt
British authorities seized more than 61,000 BTC during a 2018 raid on a London property linked to Jian Wen, who was later convicted of money laundering, and Zhimin Qian, the mastermind of the scheme, who was sentenced by a UK court to over 11 years in prison in November 2025.
Wen attracted attention after attempting to buy a luxury London mansion using Bitcoin and failing to explain the origin of the funds.

In 2024, victims of the scheme sought assistance from Chinese authorities to recover the seized Bitcoin.
The seized Bitcoin has also drawn policy attention in Britain, with reports in 2025 that officials were exploring how and when such holdings could be sold.
Magazine: UK’s Orwellian AI murder prediction system, will AI take your job? AI Eye


Disclosure: This article does not represent investment advice. The content and materials featured on this page are for educational purposes only.
A $109 billion surge in the crypto market cap signals renewed momentum for Bitcoin and Ethereum while emerging DeFi protocols such as Mutuum Finance gain attention.
Summary
- The total crypto market capitalization has climbed to $2.36 trillion, with strong leadership from Bitcoin near $70,000 and Ethereum around $2,000.
- Continued accumulation by major investment firms and inflows into spot Bitcoin ETFs are reinforcing market confidence and supporting the rebound.
- DeFi platforms like Mutuum Finance are attracting users and capital through non-custodial lending models, testnet activity, and infrastructure designed for automated on-chain liquidity.
The top crypto market is currently experiencing a significant wave of recovery. Following a period of intense volatility and macroeconomic uncertainty, the total cryptocurrency market capitalization has surged by $109 billion within a single 24-hour window.
This brings the total market value to $2.36 trillion, a level that suggests a renewed appetite for risk among both retail and institutional investors. The recovery is notably broad-based, with leadership coming from the industry’s two largest assets while capital begins to rotate into specialized utility-driven projects.
Crypto market update
The recent surge to a $2.36 trillion total market cap highlights the resilience of the digital economy. While the previous weeks were defined by “panic selling” and a flight to the U.S. dollar, the current landscape shows a distinct “buy the dip” mentality.
Institutional demand remains a cornerstone of this recovery; notably, large investment firms like Strategy Inc. have continued aggressive accumulation, recently adding nearly 18,000 BTC to their balance sheets. This level of professional conviction often serves as a floor for the market, encouraging smaller participants to return to the fray.
Furthermore, the stabilization of the total market cap (TOTAL) has allowed the broader altcoin sector to catch a bid. While Bitcoin leads the way, the “Altcoin Season Index” is beginning to tick upward as investors look for higher-beta opportunities in decentralized finance (DeFi) and infrastructure protocols.
Bitcoin
Bitcoin (BTC) is currently trading near the $70,000 psychological threshold, marking a forceful recovery from its recent weekend low of $65,000. The asset has shown remarkable strength by decoupling from traditional equities during the most volatile sessions of the week. Technical analysts are now focused on a primary resistance level at $72,294. A daily close above this mark could trigger a “short squeeze,” as significant liquidation clusters are positioned just above $72,000, potentially catapulting the price toward $75,000.
On-chain data confirms this bullish shift, with cumulative net inflows into U.S. Spot Bitcoin ETFs now exceeding $55 billion. With a market cap of $1.38 trillion, Bitcoin’s dominance remains high, yet its “lower highs” on the short-term charts suggest that the $72,294 barrier remains a heavy structural ceiling. Should the price fail to break out, the $68,800 and $65,600 levels will serve as the immediate support zones to watch.
Ethereum
Ethereum (ETH) is following Bitcoin’s lead, currently trading near $2,000 after a volatile week that saw it dip below the $1,850 mark. The asset is benefiting from a combination of short-covering and renewed interest in its upcoming “Glamsterdam” upgrade. This network improvement aims to further enhance scalability and security, providing a fundamental catalyst for long-term holders.
With a market capitalization of roughly $258 billion, Ethereum continues to play a central role in the decentralized finance ecosystem, accounting for a significant share of the Total Value Locked (TVL) across blockchain networks.
Traders are watching the $2,200 resistance zone closely; flipping this level back into support would signal that the multi-week bearish trend has officially been broken. Conversely, the $2,000 psychological level remains the most critical floor, with large “whale” accumulation noted every time the price approaches this zone.
Utility protocols in Q1 2026
As the cryptocurrency market develops in 2026, increased attention has been placed on protocols designed to deliver specific financial functions within decentralized ecosystems. These platforms typically focus on services such as on-chain liquidity management, lending, and automated yield mechanisms. Within this context, projects such as Mutuum Finance (MUTM), an Ethereum-based non-custodial lending protocol, have reported raising more than $20.7 million and attracting around 19,000 participants.
The core of the Mutuum Finance ecosystem relies on two transparent digital assets that track value and obligations. When a user provides liquidity to the protocol, they receive mtTokens as a digital receipt.
For example, a lender who deposits 1,000 USDT into a pool with a 10% Annual Percentage Yield (APY) will see their mtUSDT grow in value over time. By the end of the year, those tokens would be redeemable for 1,100 USDT, with the interest accrued automatically from the fees paid by borrowers.
On the borrowing side, the system uses Debt Tokens to track the exact amount owed. To protect the protocol from market drops, a strict Loan-to-Value (LTV) ratio is enforced. For example, with a 75% LTV, a user providing $6,000 worth of WBTC as collateral can safely borrow up to $4,000 in stablecoins. This ensures the loan is always over-collateralized, protecting the protocol’s liquidity and providing the borrower with liquidity without forcing them to sell their Bitcoin.
V1 Protocol performance and the road ahead
The technical foundation for these features is the V1 Protocol, which is currently live on the Sepolia testnet. With over $200 million in simulated TVL, the V1 version allows the 19,000 investors to test features like the “one-click” Safe-Mode borrowing, which automatically selects the safest LTV based on current market volatility.
This environment provides a risk-free space where users can interact directly with mtTokens and Debt Tokens, gaining hands-on experience with how interest accrues and how debt is tracked without using real capital. The protocol currently supports liquidity pools for WBTC, LINK, USDT, and ETH, allowing testers to see how different assets behave under various conditions.
To maintain system integrity, the V1 protocol utilizes decentralized oracles to pull accurate, real-time price data, ensuring that collateral values are always precise. This data feeds into the protocol’s Stability Factors, which act as automated safeguards to monitor loan health and protect the system from sudden market shifts. This comprehensive testing phase is the final step before the protocol moves to the Ethereum mainnet.
In conclusion, the $109 billion surge in the crypto market cap signals that the Q1 2026 recovery is in full swing. While Bitcoin and Ethereum provide the necessary stability and institutional appeal, utility protocols are building the functional infrastructure that will likely define the next crypto stage.
Disclosure: This content is provided by a third party. Neither crypto.news nor the author of this article endorses any product mentioned on this page. Users should conduct their own research before taking any action related to the company.

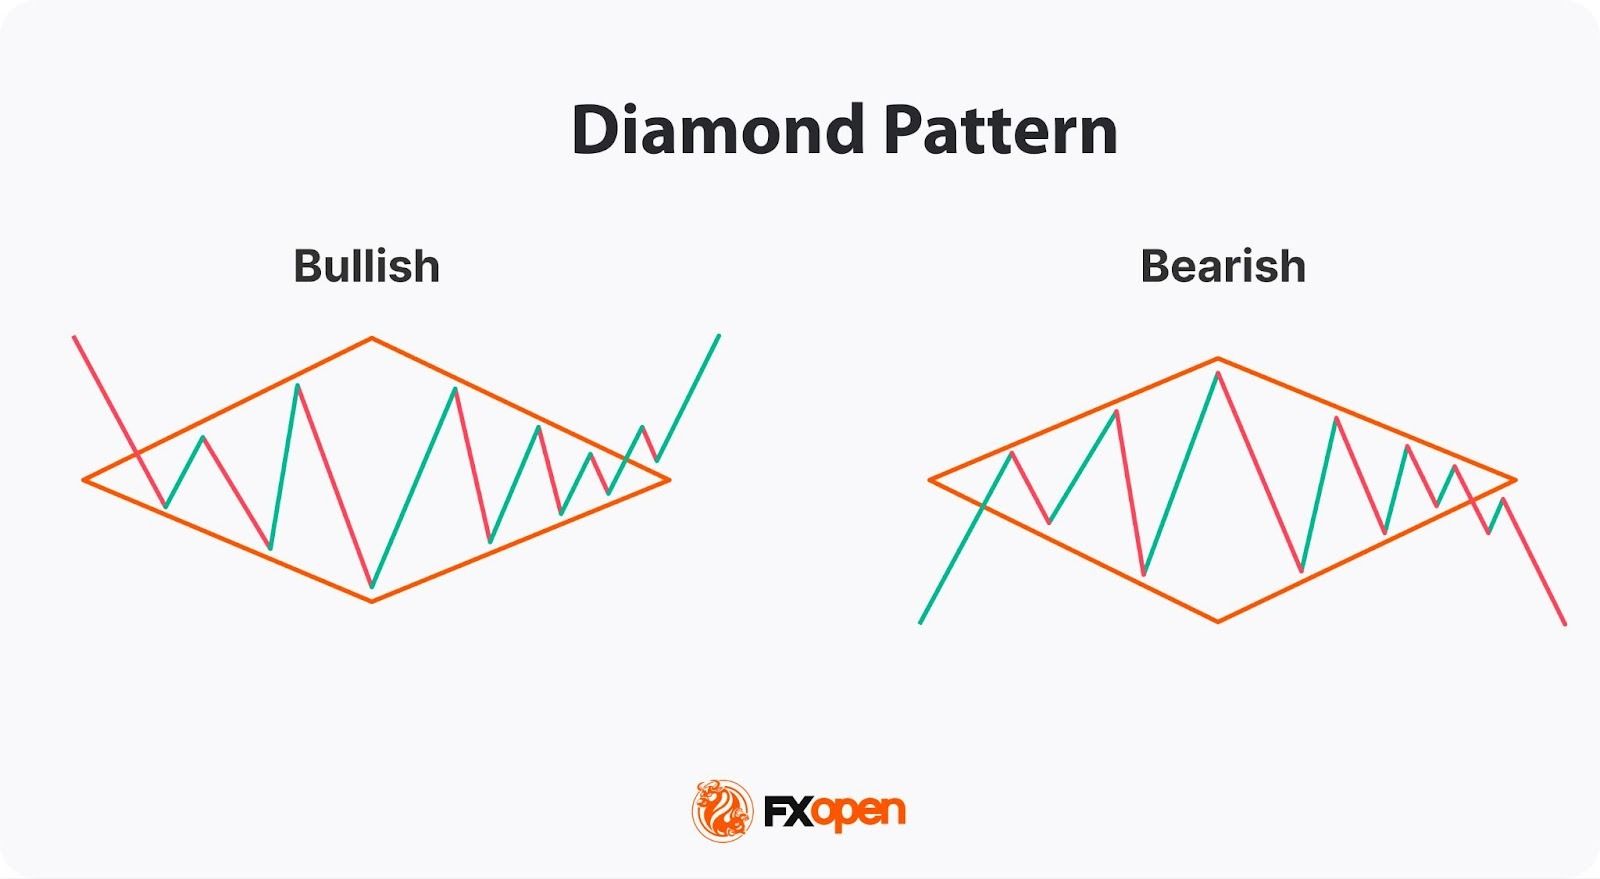
The diamond chart pattern is a technical analysis formation that appears on price charts after a strong trend and often signals a trend reversal. The structure consists of a broadening phase (higher highs and lower lows) followed by a contracting phase (lower highs and higher lows), creating a shape that resembles a diamond. Traders analyse this pattern to identify trend exhaustion, breakout levels, and possible changes in market direction.
This article explains the structure of the diamond chart pattern, the market psychology behind it, and how to trade the diamond pattern.
What Is the Diamond Chart Pattern?
The diamond pattern is a technical analysis formation that develops after a strong trend and often signals a potential market reversal. It forms when price movements first create higher highs and lower lows, producing a broadening structure, and then shift to lower highs and higher lows, creating a contracting structure. Together these movements form a diamond-shaped pattern on the chart.
The diamond pattern can be either bearish or bullish, and it is also known as the diamond top pattern and diamond bottom pattern for trading. Both formations share the same structural characteristics but occur in different market conditions and signal different potential outcomes.
- A bearish diamond pattern occurs during an uptrend and signals a potential reversal to the downside.
- A bullish diamond pattern in trading forms during a downtrend and signals a potential reversal to the upside.
Market Psychology Behind the Diamond Pattern
The diamond pattern in trading reflects a gradual shift in market sentiment. During the expansion phase, price swings become wider as buyers and sellers compete for control of the market. This stage often reflects uncertainty and heightened volatility.
As the formation progresses, volatility begins to contract. Price movements become narrower, suggesting that the market is moving towards a new balance between supply and demand.
The eventual breakout from the pattern typically represents a decisive shift in control. If buyers dominate, the price may break upward. If sellers take control, the breakout may occur to the downside. For this reason, traders often analyse the diamond pattern as a signal of potential trend exhaustion and a possible change in market direction.
How to Identify a Diamond Pattern on a Chart
The diamond pattern has a distinctive but relatively straightforward structure. Traders follow certain steps to spot it on the chart.
- Look for a strong trend – A diamond usually forms after a strong upward or downward trend, when the market begins to lose momentum and volatility increases.
- Identify an expansion phase – Price forms a sequence of higher highs and lower lows, creating a broadening structure and reflecting increasing volatility.
- Identify a contraction phase – Price movements begin to narrow, producing lower highs and higher lows.
- Draw the trendlines – Traders outline the structure with four trendlines that form a diamond shape.
Diamond Pattern Statistics
The diamond chart pattern is less common than formations such as triangles or head and shoulders. However, it can precede significant price movements. Research by technical analyst Thomas Bulkowski shows that diamond bottom patterns break upward about 73–74% of the time, with an average rise of roughly 35–39% after the breakout. Diamond top patterns break downward about 54% of the time, with an average decline of around 17%.
How to Trade the Diamond Reversal Pattern
Like most chart patterns, this formation has particular rules traders can use to build their own trading strategies. These rules can be applied to the diamond pattern in forex, stock, commodity, and cryptocurrency* markets.
Entry
Traders typically buy after the price breaks above the upper boundary of the pattern and sell after the price falls below the lower boundary.
The breakout signals a potential trend reversal.
- If the breakout occurs above the upper trendline after a downtrend, it signals a bullish reversal.
- In the bearish diamond pattern, the breakout occurs below the lower trendline, which signals a bearish reversal.
Traders use several confirmation tools. The first one is rising trading volume. The breakout should be accompanied by an increase in trading volume. Low trading volumes usually signal a false breakout, whereby the price returns to its previous trend. Fakeouts can be caused by market volatility, news events, or other factors that disrupt its validity.
The second tool is multiple timeframe analysis. For example, if a diamond is forming on the hourly chart, traders may look at higher timeframes, such as the 4-hour or daily chart. If the breakout aligns with the trend on multiple timeframes, it may provide a stronger trading signal.
Target
The take-profit target typically equals the width of the diamond setup. Traders measure the vertical distance between the highest high and the lowest low and add that distance to the breakout point in the bullish formation or subtract this distance from the breakout point in the bearish formation.
Stop Loss
Traders typically place stop-loss orders just beyond the level opposite to the breakout. Another approach is to place stop loss beyond the apex, which is the highest point in a diamond top pattern or the lowest point in a diamond bottom pattern.
Special Consideration
Although the diamond is primarily considered a reversal formation, it can also indicate the continuation of an existing trend. Traders can see it appearing within the context of a strong trend and interpret it as a pause before it resumes.
In the case of a diamond continuation pattern, traders go short on the breakout of the lower trendline of the diamond and go long on the breakout of its upper trendline. Still, the profit target and stop-loss point will be calculated similarly to the reversal formation.
To confirm the diamond formation, traders often rely on a combination of technical indicators and fundamental analysis. These tools provide additional layers of validation and may help filter out false signals.
- Volume Analysis: An increase in volume accompanying the diamond pattern breakout suggests strong market interest. Conversely, low volume may indicate a false breakout.
- Momentum Indicators: Divergence—where the indicator moves opposite to the price—can signal a potential reversal and confirm the pattern’s signals.
- Moving Averages: When the price crosses above or below moving averages in conjunction with the diamond reversal pattern, it might offer stronger confirmation of the breakout direction.
- Fundamental News Events: Major economic announcements or geopolitical events can trigger significant price movements that align with a breakout from a diamond. Tracking these events may help us understand the broader context.
Diamond Pattern Trading Strategies
The diamond formation can be used in various trading strategies. Here are some common approaches that traders can utilise.
Diamond Pattern Breakout Trading
One of the most straightforward strategies with the diamond setup is to trade breakouts.
Entry: Traders enter the market in the breakout direction. They wait for the price to break above the upper trendline in a diamond bottom formation or below the lower trendline in a diamond top trading pattern.
Stop loss: Traders usually place a stop-loss order below the lower line in a bullish formation or above the upper line in a bearish formation. Another option is to consider the risk-reward ratio of 1:2 or 1:3.
Take profit: The most common approach is to measure the difference between the diamond’s highest high and lowest low. This distance is added to the breakout point for a bullish breakout and subtracted from the breakout point for a bearish breakout. If traders trade in a solid trend, a take-profit target can be trailed.
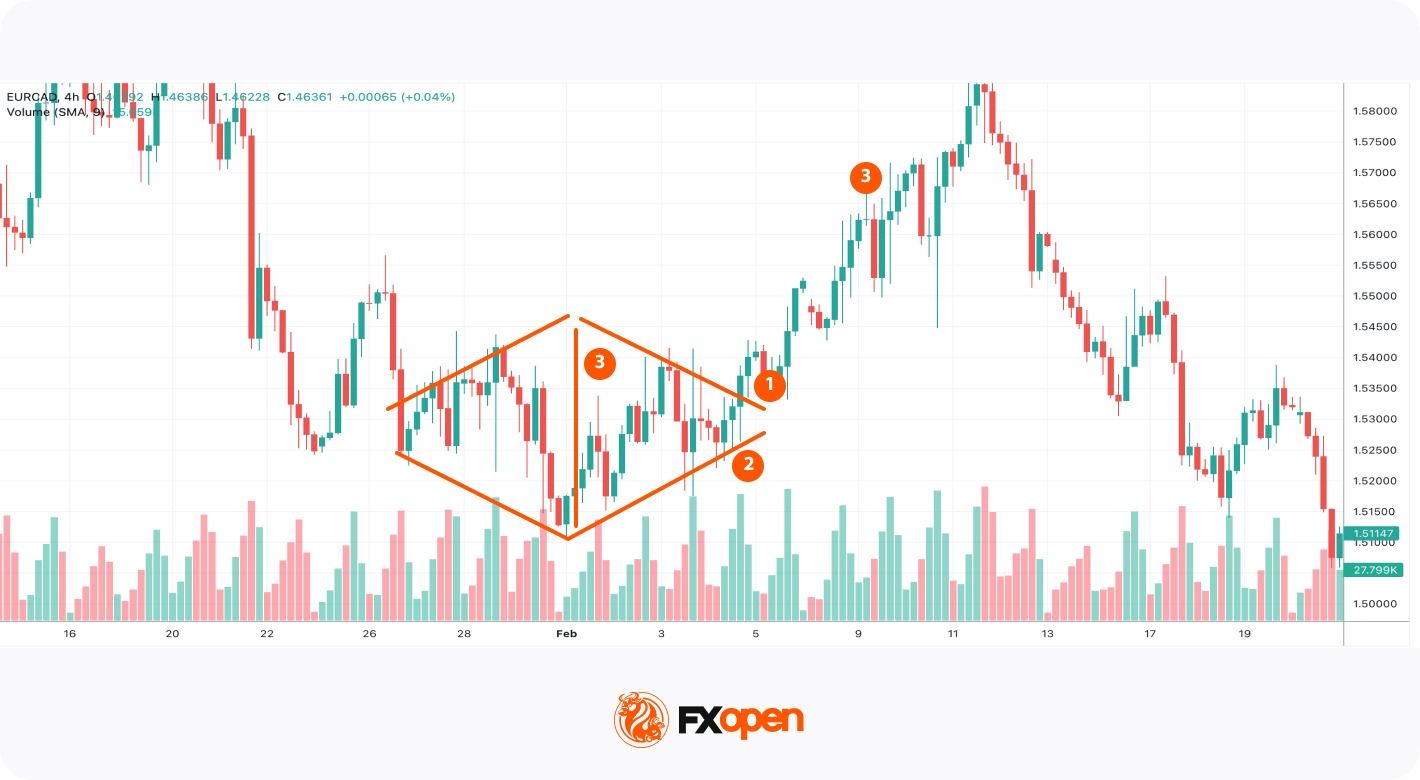
In the chart above, a bullish diamond formed after a prolonged downtrend. The price broke above the upper line (1). The volumes on the breakout increased significantly, so a trader could have expected bulls to push the price higher. A trader could have placed a stop-loss level below the lower line (2). After that, a trader could have measured the distance between the highest and the lowest points and added this to the breakout point (3). The bullish trend was strong, so a trader could have trailed that take-profit target.
Retracement and Reversal Trading
Another strategy is to look for price retracements.
Entry: Traders wait for the price to retest the broken trendline and then enter a trade in the breakout direction. In this approach, traders usually use a limit order.
Stop loss: Stop loss is placed below the retracement level in the bullish pattern and above the retracement level in case of a bearish setup.
Take profit: A profit target is calculated based on the distance between the highest and lowest points. The distance is added to the breakout point in the bullish formation or subtracted from the breakout point in a bearish formation.
Trailing stop-loss and take-profit orders can be applied to this approach.
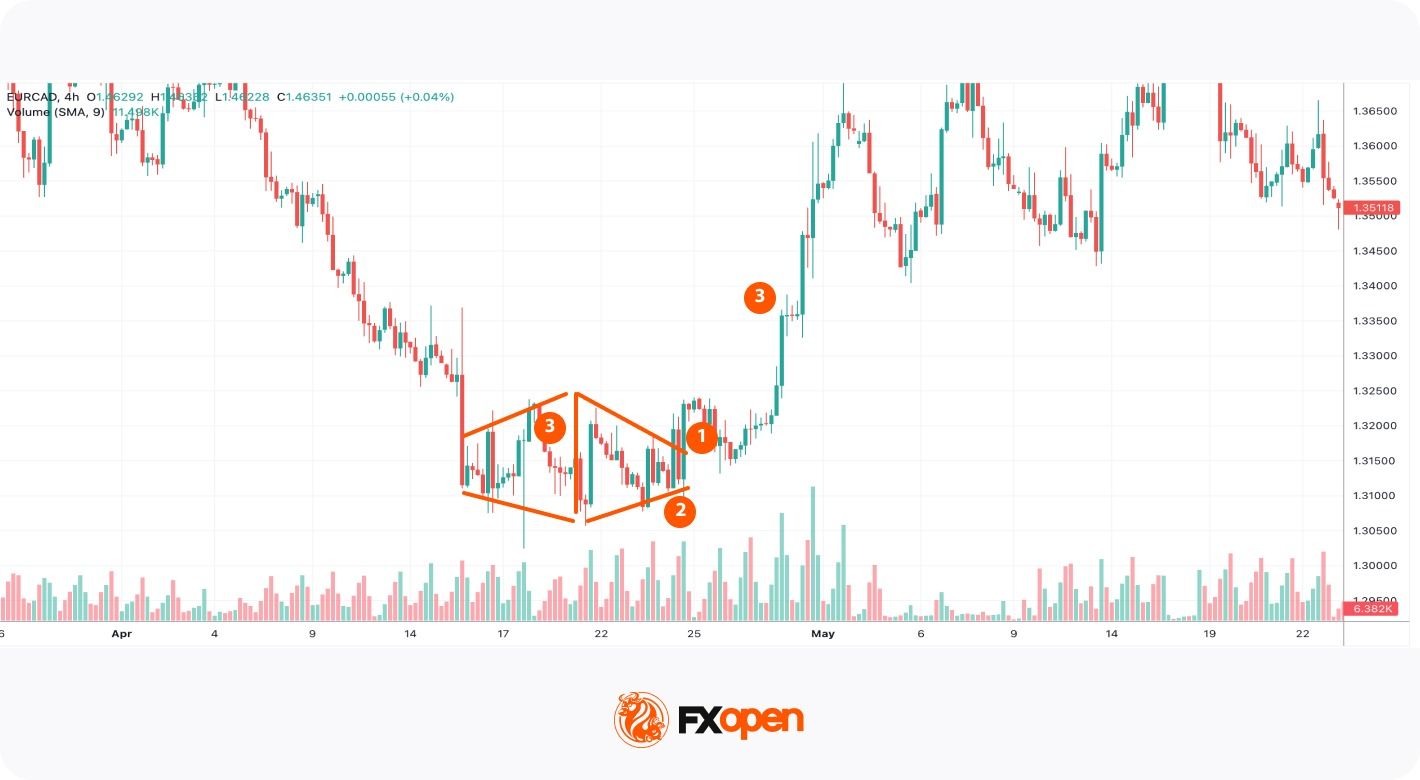
In the chart above, a diamond bottom pattern was formed. The price broke above the formation’s upper line, but it retested it later (1). A trader could have placed a buy limit order at the upper line. A stop-loss could have been placed below the lower line (2), while a take-profit target could have equalled the distance between the highest and lowest points of the formation (3).
This strategy may support traders in catching potential trend reversals. However, there is a risk of a missing trade as the price may keep moving in a breakout direction without a retracement.
If you want to practice these trading approaches, you may consider opening an account on FXOpen’s TickTrader trading platform and access numerous technical analysis tools and assets.
Diamond vs Head and Shoulders
The diamond formation is commonly compared to the head and shoulders setup. However, they have different trading rules; therefore, it’s vital to learn how to distinguish between them.
The head and shoulders formation consists of three peaks, with the middle peak (the head) being higher than the other two peaks (the shoulders) and is formed at the end of an uptrend. The inverse head and shoulders pattern consists of three troughs, with the middle one being lower (head) than the other two troughs, and it appears at the end of a downtrend.
The diamond, on the other hand, is characterised by a series of higher highs and lower lows which turn into lower highs and higher lows.
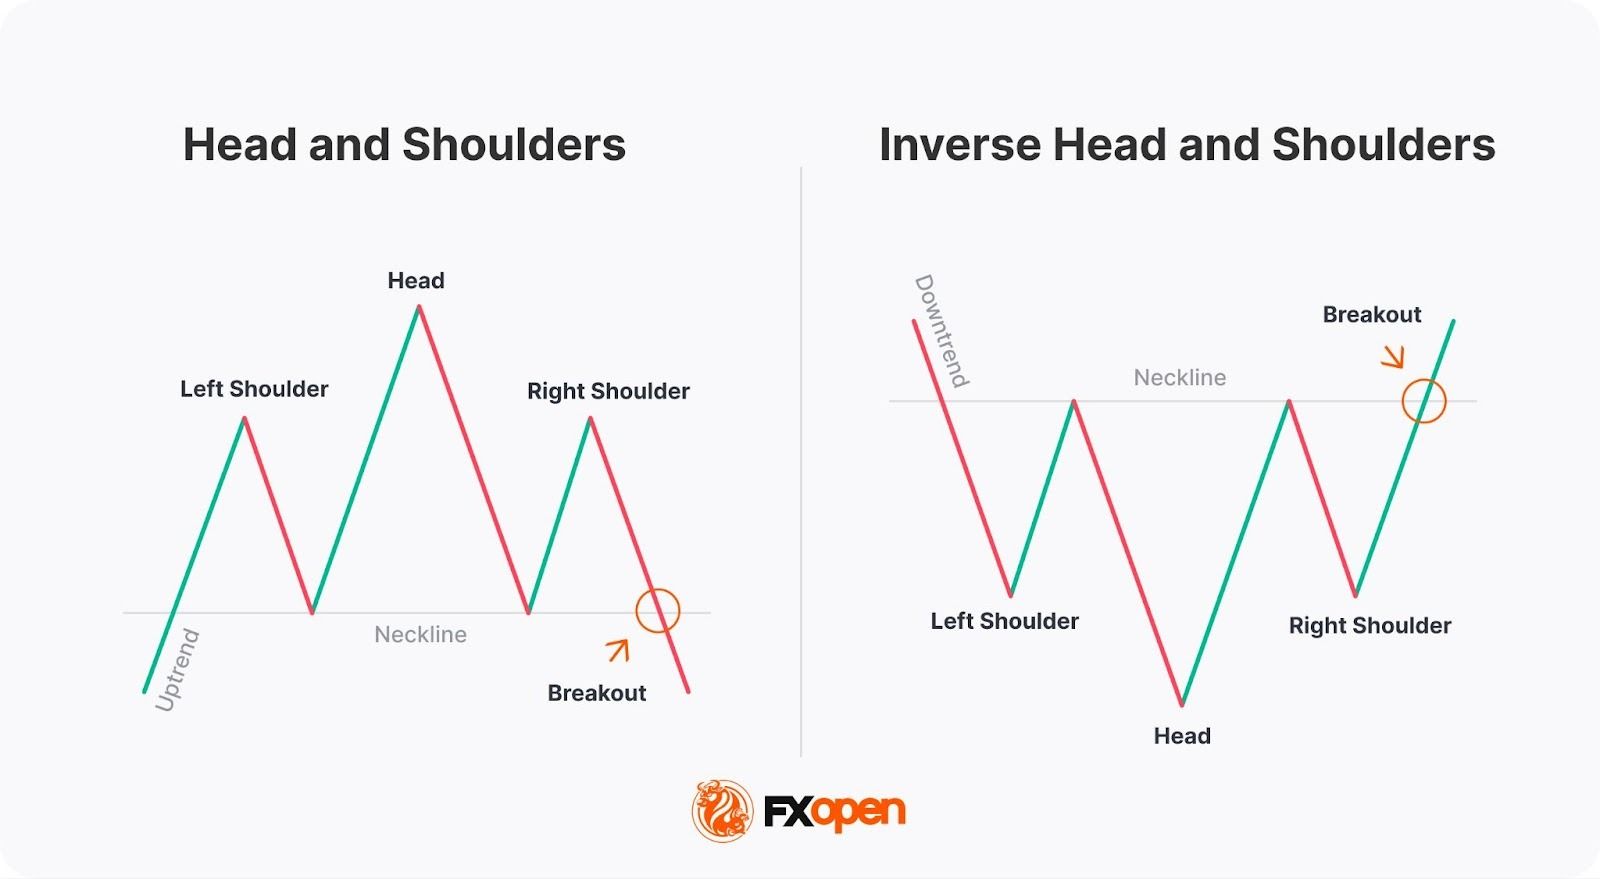
When trading the (inverse) head and shoulders setup, traders measure the distance between the head and the neckline (the line drawn through troughs in the head and shoulders and through peaks in the inverse head and shoulders) and add it to the breakout point.
Why the Diamond Pattern Matters in Technical Analysis
The diamond holds value in technical analysis due to its unique shape and ability to reflect future price reversals.
It represents a period of indecision in the market where neither buyers nor sellers dominate. This indecision is marked by a series of higher highs and lower lows that eventually narrow into a symmetrical structure resembling a diamond.
Although it is not the most common pattern, when it does appear, it often precedes significant market moves. However, traders should be aware that the reliability of its signals varies depending on many factors, including market conditions, volume, and external factors.
Advantages of the Diamond Pattern in Trading
The distinctive structure of a diamond may provide several advantages when assessing price behaviour on financial charts.
- Potential early signal of trend reversal – The pattern often forms after a strong trend, which strengthens a chance of a trend reversal.
- Clear chart structure – Expanding and contracting swings create a distinctive diamond shape.
- Defined breakout levels – The setup’s boundaries may help identify potential entry points.
- Applicable across multiple markets and timeframes – The diamond may appear across different asset classes, including forex, stocks, commodities, and cryptocurrencies*, and can be identified on both short-term and long-term charts.
- Compatible with other technical tools – Traders often combine the diamond with indicators such as RSI, MACD, moving averages, or support and resistance levels to confirm potential breakouts.
Limitations of the Diamond Pattern
While the diamond can be a valuable tool, it has limitations.
- Low frequency of occurrence – The diamond chart formation is relatively rare compared with other chart formations.
- Risk of false breakouts – Breakouts from the pattern do not always lead to sustained price movements. In some cases, the price may briefly move beyond the trendline and then reverse.
- Subjectivity in identification – The formation requires discretionary judgement when drawing trendlines and defining its boundaries. Different traders may interpret the same structure differently.
- Imprecise price targets – Price targets based on the height of the pattern provide only an approximate projection. Actual price movements may differ depending on volatility, liquidity, and market conditions.
- Dependence on market conditions – The strength of the diamond’s signals may vary depending on the broader market environment. In highly volatile or ranging markets, the probability of false signals may increase.
Important Factors When Trading the Diamond Pattern
Traders often focus on confirmation signals and overall market context rather than relying on the pattern alone. Applying a structured approach may help improve the quality of trade decisions.
- A confirmed breakout. A confirmed breakout above or below the pattern’s boundary may provide a clearer directional signal.
- The overall market trend. Diamond setups often appear after strong trends. Evaluating the broader market context may help determine whether the formation signals a reversal or continuation.
- Volume or momentum indicators. Some traders combine the pattern with indicators such as RSI, MACD, or volume analysis to assess the strength of the potential breakout.
- Risk management levels. Stop-loss levels are often placed near recent swing highs or lows within the setup.
Final Thoughts
The diamond chart pattern is a distinctive technical analysis formation that may signal trend reversals after strong price movements. Although it appears less frequently than other chart formations, its structure can provide valuable information about market indecision, volatility shifts, and potential breakout points. Traders typically combine it with volume analysis, support and resistance levels, and broader market context.
If you want to apply the diamond pattern in real trading, you may consider opening an FXOpen account to access over 700 markets and trade with low commissions from $1.50 and tight spreads from 0.0 pips.
FAQ
How Do Traders Identify a Diamond Pattern?
Traders identify a diamond chart formation by observing price movements that first expand and then contract, forming a diamond-shaped structure on the chart. The formation is typically outlined using four trendlines connecting higher highs, lower lows, lower highs, and higher lows. A confirmed breakout from the pattern often signals a potential change in trend direction.
Is a Diamond Pattern Bullish?
A diamond chart formation can be either bullish or bearish depending on where it forms in the market trend. A diamond bottom pattern develops after a downtrend and may signal a potential bullish reversal. A diamond top pattern appears after an uptrend and may indicate a possible shift to a bearish trend.
How May a Diamond Pattern Be Traded?
Trading a diamond typically involves waiting for a breakout from the formation. Traders often enter a position in the direction of the breakout and place stop-loss orders beyond the opposite side of the formation. The potential price target is often estimated using the vertical distance between the highest and lowest points of the formation.
*Important: At FXOpen UK, Cryptocurrency trading via CFDs is only available to our Professional clients. They are not available for trading by Retail clients. To find out more information about how this may affect you, please get in touch with our team.
This article represents the opinion of the Companies operating under the FXOpen brand only. It is not to be construed as an offer, solicitation, or recommendation with respect to products and services provided by the Companies operating under the FXOpen brand, nor is it to be considered financial advice.
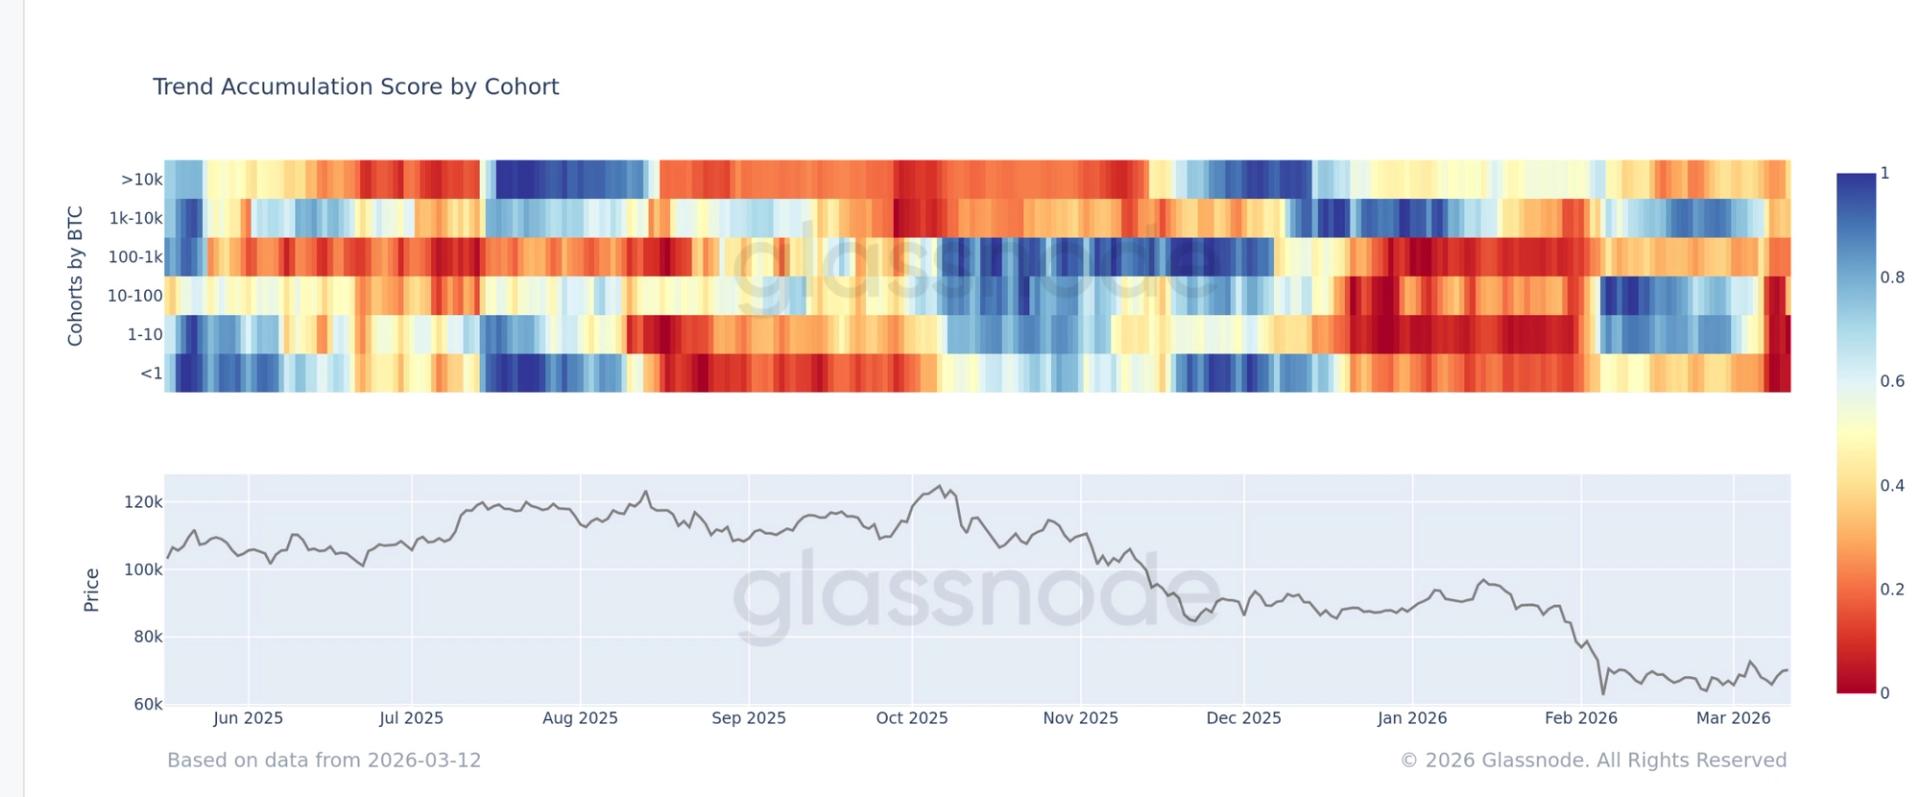

On-chain data from Glassnode shows that bitcoin holders across nearly all wallet cohorts have shifted back to aggressive selling amid persistent geopolitical tensions in the Middle East.
The distribution is being led primarily by retail investors, who appear to be the main source of selling pressure.
Glassnode’s Accumulation Trend Score, which measures whether different wallet groups are buying or selling, has dropped to around 0.04, signalling deep net distribution across the network.
The metric evaluates both the size of entities and the amount of bitcoin they have accumulated over the past 15 days.
The breakdown shows that smaller holders are leading the distribution. Wallets holding 1 to 10 BTC, typically associated with retail investors, are in heavy selling mode.
Entities holding 10 to 100 BTC are also distributing at a significant pace. Even larger participants are not immune to the trend. Wallets holding 1,000 BTC or more are also net sellers, though the intensity of their selling is less severe than that seen among smaller cohorts.
Despite the broad-based distribution, bitcoin continues to demonstrate relative resilience compared with traditional macro assets.
The U.S. dollar index has risen above 99.5, the U.S. 10-year Treasury yield has climbed to a one-month high above 4.2%, and brent crude oil is trading around $100. Typically, stronger yields, a firmer dollar and higher oil prices create significant headwinds for risk assets. Bitcoin’s ability to hold near $70,000 suggests underlying demand remains intact even as on-chain data shows investors bailing in the short term.
Bitcoin continued to trade in a small range on Wednesday as traders kept their eyes on a major resistance point near $71,400, and analysts indicate that any decisive move above the current price would mark the next significant direction for the cryptocurrency.
Bitcoin, the largest cryptocurrency, is currently trading around 70,335.18, down 2.13% over the last 24 hours, according to market data. The asset has experienced a mix of moves in recent sessions, though the trend has been short-term, reflecting a balance between buyers and sellers.
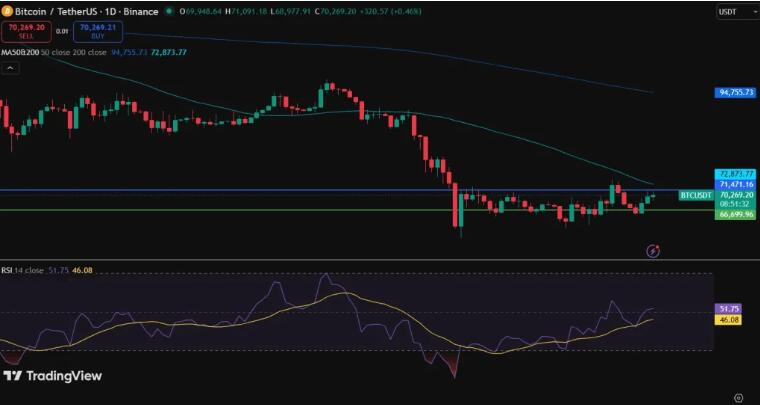
Charts Show Bitcoin Consolidating Near Key Levels
TradingView records indicate that Bitcoin is trading around $70,200 following a recovery after hitting new lows of about $66,700. The technical charts show that the cryptocurrency has been trading within a well-established channel, implying that the market has not adopted a strong direction of the bullish and bearish forces.
The indicators of momentum also indicate a neutral view. The Relative Strength Index (RSI) stands at approximately 55 which is generally referred to as a balanced market condition and not the strong upward or downward pressure.
In the meantime, the 50-day moving average of Bitcoin is located at around 71,400 and it is also an important resistance point. Analysts believe that a consistent move above the line would lead to a new wave of bullish activity, and failure to do so will most likely have the asset oscillating in its current range.
Analyst Highlights Bitcoin’s Current Consolidation Phase
Ali Martinez, a crypto market analyst, recently emphasized the Bitcoin consolidation stage in a post on the social platform X.
As of now, Bitcoin is in the range of 71,827 to 62,772. According to Martinez, it has been between this range in the past few weeks. The analyst observed that once the markets have been in a long period of consolidation, it seems to become more volatile; when price breaks above resistance or below support.
In the meantime, traders are watching resistance near $71,000–$71,400 and support around $66,000. A break above resistance could signal further gains, while a drop below support could trigger a more significant correction.
Unless these levels are decisively violated, analysts expect the market to remain range-bound as it awaits the next trigger point.

Crypto World
BTC trapped in tight range as growing open interest hints at defensive bets: Crypto Markets Today


Bitcoin traded recently around $70,100, down 0.1% since midnight UTC.
The largest cryptocurrency has been trapped in a tight trading range between $71,700 and $69,000 for the past 48 hours as volatility begins to wane despite continued conflict in the Middle East.
Oil rose back toward $100 per barrel on Thursday after a sixth ship was reportedly attacked by Iran on the Strait of Hormuz, adding to concerns about global energy supply.
The crypto market, however, remains relatively unperturbed; Hyperliquid’s HYPE token continued its ascent toward $40, adding 2.5% since midnight while MORPHO, ETHFI, and XMR all posted gains.
U.S. stock futures continued to show weakness with the Nasdaq 100 and S&P 500 index futures both losing around 0.6% overnight. The Dollar Index (DXY) moved back toward 100 after Wednesday’s CPI figures, putting a stop to any potential rate cuts.
Derivatives positioning
- Crypto futures open interest (OI) has increased by 2% to $102 billion in the past 24 hours.
- OI in bitcoin and ether rose by 2% and 4%, respectively, while annualized perpetual funding rates and cumulative volume delta (CVD) have remained flat to negative. This suggests that the recent build-up in open interest is being driven more by defensive, bearish positioning than by aggressive long-side bets.
- Decentralized exchange Hyperliquid’s HYPE token has gained 9% in 24 hours, extending the recent bull run. The rally, however, has yet to galvanize demand for leveraged bets, as evidenced by futures OI, which remains steady near multimonth lows of about 40 million HYPE.
- Activity in tether gold (XAUT) continues to cool, with futures OI slipping to 93.50 XAUT, the lowest since Feb. 28, and down notably from the March 2 high of 149.72K XAUT. This shows that gold-linked assets are slowly falling out of favor as the rally in spot gold stalls.
- Bitcoin and ether’s 30-day implied volatility indices, BVIV and EVIV, remain steady despite a renewed overnight rally in oil and a decline in U.S. stock futures.
- The steadfastness is a sign traders are not yet seeing a meaningful shift in forward-looking risk or cross‑asset contagion for major cryptocurrencies.
- On Deribit, bitcoin and ether put options, which offer protection against a market decline, continue to trade at a premium to call options. There is notable interest in the $20,000 put option, a bet that BTC’s spot price will plunge to below that level.
Token talk
- The altcoin market continues to show resilience despite a risk-off environment in global markets.
- Decentralized finance (DeFi) token SKY posted a 7.6% gain over the past 24 hours while AI-focused bittensor (TAO) is up by around 4.5%.
- One token that has failed to keep tabs with its peers has been midnight (NIGHT), the privacy token set up by Cardano founder Charles Hoskinson. NIGHT is currently trading at $0.046, having dropped 10% in the past 24 hours after Tuesday’s listing on Binance gave holders an off-ramp to sell.
- The altcoin-heavy CoinDesk 80 (CD80) Index was the best-performing benchmark over the past 24 hours, adding 2.5% while the bitcoin-heavy CoinDesk 5 (CD5) is up by only 0.9%.
- The altcoin market’s next move depends on whether bitcoin can break out of the current range with a move above $74,000, a breakout on convincing volume followed by a consolidation would lead to rotation into more speculative altcoins.
Crypto World
Eightco shares jump $125 million funding commitment from Btmine, ARK, Kraken parent Payward

Eightco Holdings’ (ORBS) shares rose as much as 25% in early trading after the firm said it secured $125 million in new institutional funding commitments and made $75 million in AI and crypto investments.
The commitments include $75 million from Bitmine Immersion Technologies (BMNR), an ether (ETH) treasury asset company that holds a near 7% stake in the firm, according to MarketScreener data. Bitmine Chairman Tom Lee will join the board.
ARK Invest, whose chief futurist, Brett Winton, becomes an adviser, and Payward, the parent company of crypto exchange Kraken, each committed to $25 million. Several other firms, including Coinfund, Pantera and FalconX, also agreed to support the company.
Alongside the funding, Eightco said it has already deployed capital into two high-profile investments. These include $50 million into OpenAI, the company behind ChatGPT, and $25 million into Beast Industries, the business arm of YouTube creator MrBeast.
The company, formerly known as Cryptyde and active in packaging and logistics, also maintains a large treasury position in , a cryptocurrency tied to the World identity network co-founded by OpenAI CEO Sam Altman.
The project uses biometric verification through specialized devices known as “Orbs” to create a digital identity that confirms a user is a real person rather than an automated bot.
That system aims to address a growing problem on the internet: distinguishing human activity from content produced by AI systems.
Eightco has accumulated roughly 277 million WLD tokens, close to 10% of the token’s circulating supply, along with 11,000 ether and $82 million in cash reserves, according to a company update.
Dan Ives, who chaired the company during its 2025 strategic shift, will step down.
Bitmine’s Lee said the strategy connects several major technology trends.
“To me, there is tremendous synergy between Proof of Human (Worldcoin), the OpenAI foundational models, and connectivity to the greatest content creator in the world, MrBeast,” he said in a statement.
Bitmine invested $200 million in Beast Industries in January.
WLD’s price rose more than 2% on the announcement to now trade at $0.362 per token. ORBS were recently trading at $1.00.

TLDR
- Nomura initiated a Buy rating on NIO with a $6.60 price objective, suggesting approximately 34% potential gains from current trading levels
- Macquarie increased its price objective to $6.50 while maintaining an Outperform stance following fourth-quarter 2025 earnings
- Fourth-quarter revenue climbed 76% annually and 59% sequentially to reach RMB34.7 billion
- Vehicle gross margin expanded to 18.1% during Q4, compared to 13.1% in the prior-year period
- NIO projected Q1 2026 vehicle deliveries between 80,000 and 83,000 units, with revenue expectations exceeding analyst estimates
The Chinese electric vehicle manufacturer Nio has experienced an eventful week. Following the release of impressive fourth-quarter 2025 financial results, the company secured multiple analyst upgrades and elevated price objectives from prominent Wall Street firms.
The standout metric proved difficult to overlook. Fourth-quarter total revenue reached RMB34.7 billion, representing a 76% increase compared to the same quarter last year and a 59% jump from the previous quarter. Such robust expansion typically captures market attention.
Nomura made the boldest move, elevating NIO from a Neutral stance to Buy. The investment bank established a $6.60 price objective, reduced from its earlier $8.40 forecast, yet still suggesting roughly 34% upside potential from the stock’s recent trading level around $4.94.
The brokerage highlighted two consecutive quarters of operational improvements, emphasizing increased vehicle deliveries and enhanced expense management as catalysts for stronger profitability. Nomura now anticipates NIO will achieve non-GAAP operating profit breakeven during 2026.
Despite reducing delivery projections for 2026 and 2027 — acknowledging intensified competition within the EV sector — Nomura still forecasts vehicle deliveries will expand at approximately 25% compounded annual growth between 2025 and 2028. Revenue expansion is anticipated at roughly 21% during the identical timeframe.
Gross margin projections for 2026 and 2027 received upward revisions, while operating margin estimates were boosted by over 3 percentage points for both fiscal years. This represents a substantial reassessment of the company’s cost efficiency.
Enhanced Profitability Fuels Positive Analyst Sentiment
Macquarie similarly elevated its price objective, advancing to $6.50 from $6.10, while preserving its Outperform recommendation. The firm identified vehicle margin expansion as the primary narrative.
Vehicle margin reached 18.1% during Q4 2025, climbing significantly from 13.1% during the comparable quarter one year prior. The recently launched ES8 model received credit for contributing substantially to that improvement. Additional sales margin widened to 11.9% from merely 1.1% in Q4 2024.
NIO also reduced R&D expenditures through workforce optimization and intends to maintain quarterly R&D costs within the RMB2.0 billion to RMB2.5 billion range. The manufacturer generated positive operating cash flow during the quarter, which Macquarie noted reduces future capital-raising requirements.
Macquarie did reduce its fiscal 2026 volume projection by 8%, acknowledging subdued near-term demand and escalating competition within the EV SUV category from rivals including Li Auto, XPeng, Xiaomi, and Seres. However, it narrowed its 2026 net loss forecast to RMB1.8 billion from RMB4.5 billion, reflecting decreased operating costs and an improved product portfolio.
Additional Financial Institutions Provide Analysis
BofA Securities increased its price objective to $6.70 while maintaining a Neutral recommendation, observing that Q4 performance largely aligned with projections. Morgan Stanley reaffirmed its Overweight rating with a $7.00 price target following optimistic delivery growth commentary from NIO’s founder.
For Q1 2026, NIO provided delivery guidance of 80,000 to 83,000 vehicles. The midpoint sits approximately 8% below Bloomberg consensus figures but 2% above Macquarie’s projection. Revenue guidance ranging from RMB24.5 billion to RMB25.2 billion exceeded both Macquarie’s estimate and broader consensus expectations.
NIO has three additional mid- to large-size SUV models under development, with two variants scheduled to debut during Q2 2026.
The stock had appreciated 17.77% during the preceding week through Wednesday’s trading session, with a market capitalization standing at $14.41 billion.

Crypto World
Marathon Petroleum (MPC) Stock Surges After Blowout Q4 Earnings and Strong Cash Returns

Key Highlights
- Marathon Petroleum reported Q4 2025 adjusted EPS of $4.07, surpassing analyst consensus of $3.01 by more than 35%
- Annual 2025 adjusted EBITDA reached approximately $12 billion
- Shareholders received $1.3 billion in Q4 distributions, contributing to $4.5 billion total for the year
- Marathon closed 2025 with $3.7 billion cash position and zero utilization of its $5 billion revolving credit line
- Wall Street analysts set price targets between $210 and $225, maintaining predominantly bullish ratings
Marathon Petroleum (MPC) delivered an exceptional fourth quarter in 2025, capturing Wall Street’s attention with results that significantly exceeded expectations. The refining giant reported adjusted earnings reaching $4.07 per diluted share, obliterating the consensus forecast of $3.01 by over 35%. Quarterly revenue totaled $33.4 billion, marginally topping analyst projections.
Marathon Petroleum Corporation, MPC
Quarterly net income reached $1.5 billion, translating to $5.12 per diluted share. This represented a dramatic improvement from the $371 million recorded in the year-ago quarter. Adjusted EBITDA for the period climbed to $3.5 billion versus $2.1 billion in Q4 2024.
The Refining & Marketing business unit emerged as the primary catalyst behind the earnings outperformance. This segment generated EBITDA of $1.997 billion while maintaining crude capacity utilization at 95%. The R&M margin expanded to $18.65 per barrel.
Operational refining costs increased to $5.70 per barrel, yet the margin growth easily absorbed this headwind. Capture rates exceeding 100% played a critical role in the quarter’s success.
The midstream operations added meaningful value, producing EBITDA of $1.7 billion. Enhanced throughput volumes and contributions from newly acquired assets drove this performance, though some asset sales provided a partial offset.
The Renewable Diesel business unit contributed $7 million in EBITDA. While not the primary growth driver, it remains a developing component of the portfolio.
Marathon concluded the year holding $3.7 billion in cash. The company maintained a pristine balance sheet with zero outstanding borrowings against its $5 billion revolving credit facility entering 2026.
Shareholder Returns Remain a Strategic Priority
The refiner distributed $1.3 billion to investors during Q4. Throughout 2025, total distributions reached $4.5 billion. Since 2017, Marathon has allocated over $45 billion toward share repurchases, meaningfully reducing outstanding shares and enhancing per-share financial metrics.
Operating cash flow for 2025 approached $8.3 billion. Management continues executing a balanced capital allocation strategy combining regular dividends with aggressive share buybacks, which forms a cornerstone of the investment thesis.
Analyst price objectives have moved upward recently. Wall Street firms have published targets of $210, $217, and $225 during February. The consensus 12-month price target across coverage sits slightly above $204, with most analysts maintaining Buy-equivalent ratings.
Shares have been changing hands near the high-$190s range, marking substantial year-to-date appreciation. The stock advanced approximately 3% on March 11 and continued extending gains throughout the week.
Favorable Market Conditions Supporting Performance
Escalating geopolitical instability across the Middle East has driven oil prices upward and improved investor sentiment toward domestic refiners. Market participants are anticipating tighter product supply-demand dynamics and more robust refining crack spreads.
Elevated crude prices present both challenges and opportunities for Marathon. While input costs increase, refining margins can expand when finished product pricing outpaces crude appreciation. Current market conditions suggest investors are betting on this favorable scenario.
Institutional ownership patterns show continued strong interest from large asset managers. Some major shareholders reduced holdings during late 2025, while others increased positions — representing normal portfolio rebalancing activity for a large-cap energy name.
For full-year 2025, Marathon recorded adjusted EBITDA approaching $12 billion, with the refining and marketing segment achieving $7.15 per barrel in Q4 compared to a $5.63 full-year average.
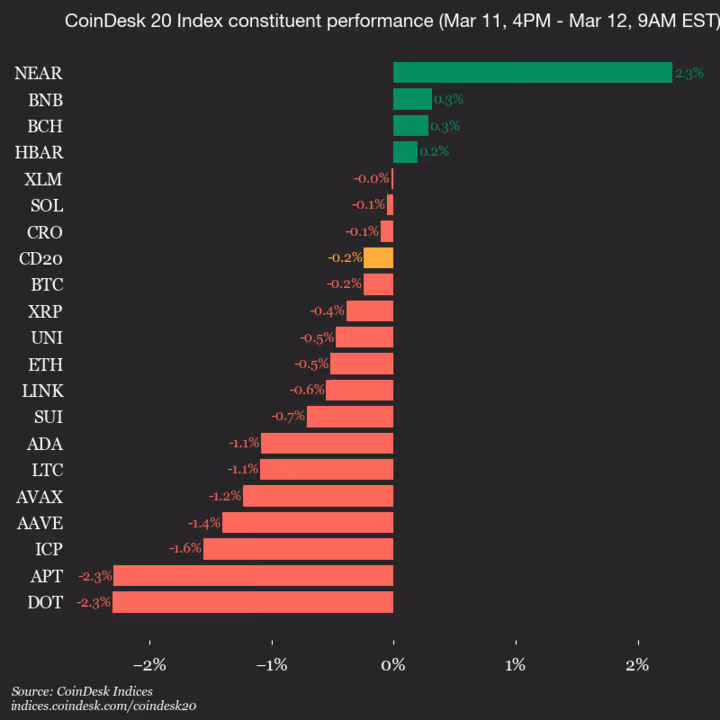
CoinDesk Indices presents its daily market update, highlighting the performance of leaders and laggards in the CoinDesk 20 Index.
The CoinDesk 20 is currently trading at 2012.94, down 0.2% (-4.89) since 4 p.m. ET on Wednesday.
Four of 20 assets are trading higher.

Leaders: NEAR (+2.3%) and BNB (+0.3%).
Laggards: DOT (-2.3%) and APT (-2.3%).
The CoinDesk 20 is a broad-based index traded on multiple platforms in several regions globally.
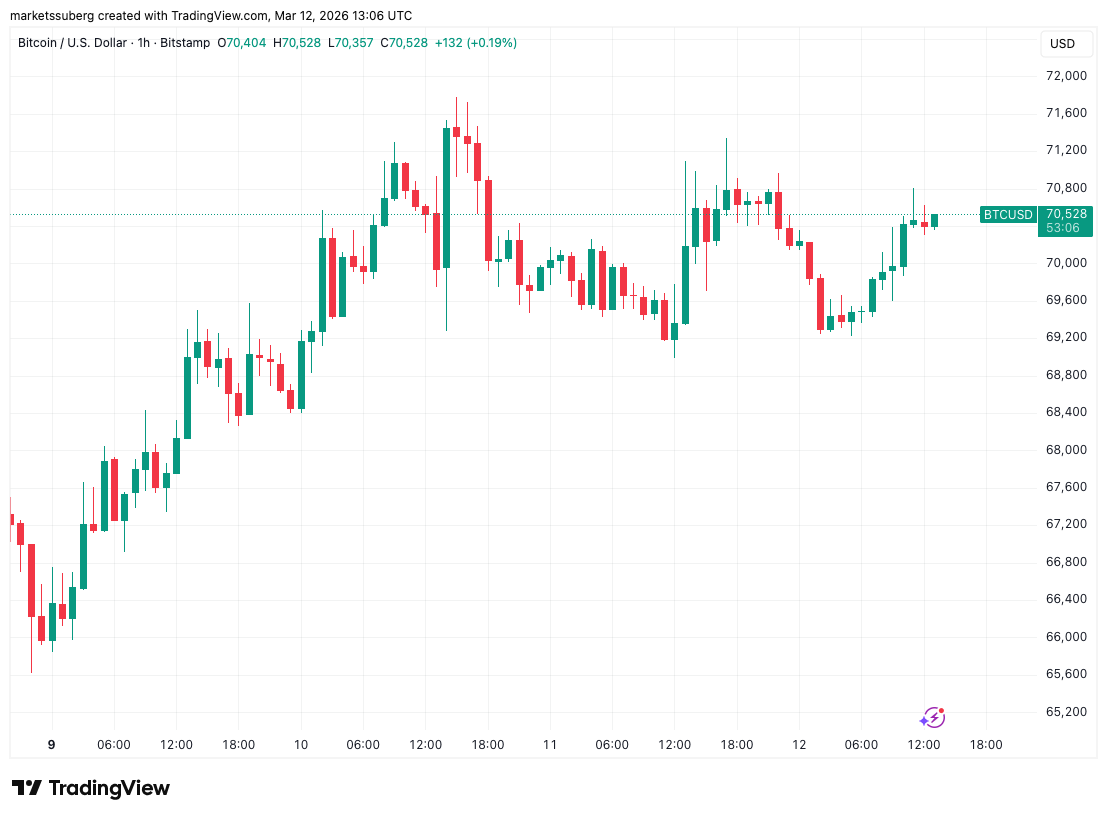
Bitcoin (BTC) circled $70,000 into Thursday’s Wall Street open after US jobs data matched expectations.
Key points:
-
Bitcoin shrugs off more US macro data as jobless claims copy flat CPI numbers.
-
Oil stays volatile, while markets ignore almost any chance of a March interest-rate cut.
-
BTC price action stays indecisive around the $70,000 mark.
Bitcoin surfs new US jobless claims release
Data from TradingView showed ongoing BTC price compression on the day, with BTC/USD acting in an increasingly narrow range.

US initial jobless claims were 213,000 for the week through March 7, just 1,000 below the previous week’s print and 2,000 below market consensus.
The numbers furthered relief over the US economy after Wednesday’s Consumer Price Index (CPI) release also avoided major deviations from its expected values.
Volatility, however, remained in oil, which was up by more than 5% on the day at the time of writing after initially rising above $95. News of a coordinated release of 400 million barrels from reserves to counteract the Strait of Hormuz impasse thus failed to alter the price trend.

Analyzing the situation, trading resource The Kobeissi Letter suggested that a lack of clarity from US President Donald Trump over how long the Middle East conflict would last was fueling oil’s ongoing surge.
“The reason behind this rally was largely that President Trump was not signaling how long the Iran war would last,” it wrote on X.
“Since then, the ONLY factor that has changed is that President Trump has said the war will be over ‘pretty quickly.’ However, this also implies that military action will likely continue until at least the end of March.”

The latest inflation prints, meanwhile, did nothing to alter the market’s views of future Federal Reserve policy.
The latest data from CME Group’s FedWatch Tool showed the odds of an interest-rate cut at the Fed’s March 18 meeting — a key potential crypto tailwind — at less than 1%.
BTC price breakout can take “several more weeks”
Key Bitcoin price levels remained in place as traders waited for directional cues.
Related: Bitcoin braces for oil shock and death crosses: 5 things to know this week
Trader Daan Crypto Trades flagged $72,000 and $62,000 as lines in the sand around spot price, with the Point of Control (PoC) at around $68,000.
“Anything in between will just chop you up as we have been seeing already. Ranges like these can easily take several more weeks before resolving,” he told X followers on Wednesday.

As Cointelegraph reported, consensus stayed bearish on the mid-term outlook, favoring a drop to new macro lows to come.
Trader and analyst Rekt Capital noted that by historical standards, Bitcoin’s bear market should continue from here.
“Time-wise, Bitcoin will soon be halfway through its Bear Market,” he summarized in one of several recent X updates.
“Retracement-wise however, Bitcoin has already performed 75% of the downside in its Bear Market correction.”

This article does not contain investment advice or recommendations. Every investment and trading move involves risk, and readers should conduct their own research when making a decision. While we strive to provide accurate and timely information, Cointelegraph does not guarantee the accuracy, completeness, or reliability of any information in this article. This article may contain forward-looking statements that are subject to risks and uncertainties. Cointelegraph will not be liable for any loss or damage arising from your reliance on this information.

MASSIVE Bitcoin Buying Opportunity RIGHT NOW! Bitcoin RALLYING As Stocks CRASH!

What went right this week: progress in tumultuous times, plus more

Bitcoin, Ethereum and utility protocols today


-
Business6 days ago
Form 8K Entergy Mississippi LLC For: 6 March
-

 News Videos3 days ago
10th Algebra | Financial Planning | Question Bank Solution | Board Exam 2026
-

 Fashion6 days ago
Weekend Open Thread: Ann Taylor
-

 Crypto World3 days ago
Paradigm, a16z, Winklevoss Capital, Balaji Srinivasan among investors in ZODL
-
 Tech1 day ago
A 1,300-Pound NASA Spacecraft To Re-Enter Earth’s Atmosphere
-
 Sports7 days ago
499 runs and 34 sixes later, India beat England to enter T20 World Cup final | Cricket News
-

 Politics6 days ago
Top Mamdani aide takes progressive project to the UK
-

 Tech2 days ago
ChatGPT will now generate interactive visuals to help you with math and science concepts
-

 Business2 days ago
ExxonMobil seeks to move corporate registration from New Jersey to Texas
-

 Sports5 days ago
Three share 2-shot lead entering final round in Hong Kong
-

 Sports4 days ago
Braveheart Lakshya downs Lai in epic battle to enter All England Open final | Other Sports News
-

 NewsBeat20 hours ago
Residents reaction as Shildon murder probe enters second day
-

 NewsBeat7 days ago
Piccadilly Circus just unveiled ‘London’s newest tourist attraction’ and it only costs 80p to enter
-

 Entertainment6 days ago
Hailey Bieber Poses For Sexy Selfies In New Luscious Lip Thirst Traps
-

 Business4 days ago
Search for Nancy Guthrie Enters 37th Day as FBI Probes Wi-Fi Jammer Theory
-

 Business1 day ago
Search Enters Sixth Week With New Leads in Tucson Abduction Case
-
 NewsBeat3 days ago
Pagazzi Lighting enters administration as 70 jobs lost and 11 stores close across Scotland
-

 Tech3 days ago
Despite challenges, Ireland sixth in EU for board gender diversity
-

 Business3 days ago
Search Enters 39th Day with FBI Tip Line Developments and No Major Breakthroughs
-

 NewsBeat1 day ago
I Entered The Manosphere. Nothing Could Prepare Me For What I Found.