

Crypto World
BlackRock debuts staked ether ETF as demand grows for yield in crypto funds


After the first wave of spot ether (ETH) exchange-traded funds launched without staking, BlackRock’s iShares Staked Ethereum Trust ETF (ETHB), one of the industry’s most anticipated versions, begins trading on Nasdaq on Thursday.
The fund marks the asset manager’s third crypto ETF and the first from BlackRock to incorporate staking. ETHB will hold spot ether and stake a portion of those holdings on the Ethereum network, allowing investors to potentially earn rewards while benefiting from price movements.
The new vehicle expands BlackRock’s existing digital asset lineup, which includes the iShares Bitcoin Trust (IBIT) and the iShares Ethereum Trust (ETHA). Those funds have grown rapidly since their launches, with IBIT today managing more than $55 billion in assets and ETHA about $6.5 billion.
“This is really about investor choice,” Jay Jacobs, BlackRock’s U.S. head of equity ETFs, told CoinDesk in an interview. “While ETHA has developed liquidity and a growing derivatives market, some investors are focused on maximizing total returns by combining ether price exposure with staking rewards, he added.”
Ethereum uses a proof-of-stake system that allows holders of its native token to lock up coins to help validate transactions and secure the network. In return, participants receive rewards, which many investors view as a yield-like feature of the asset.
Until now, most ether ETFs have offered only price exposure without staking, although some asset managers, including Grayscale, have recently launched ETFs with staking capabilities. Jacobs said that gap may have discouraged some crypto-native investors from moving assets into exchange-traded funds.
“Some investors who already hold ether directly were staking it and weren’t ready to move into an exchange-traded product because they would lose that feature,” he said. “By incorporating staking, the ETF allows investors to keep the benefits of staking while gaining the operational advantages of an ETF structure.”
Those advantages include institutional-grade custody, the ability to trade through traditional brokerage accounts and integration with standard portfolio allocations alongside stocks and bonds.
The product may also appeal to certain institutional investors who prefer assets that generate income or cash flow.
“For some institutions, when they evaluate an investment, they want to think about it from a cash flow perspective,” Jacobs said. Staking rewards may help make ether more comparable to other assets in portfolio models.
Read more: Crypto ETFs with staking can supercharge returns but they may not be for everyone
BlackRock expects interest in the product to come from a wide range of investors, including individual traders, financial advisors and institutional allocators such as hedge funds and family offices.
The fund carries a 0.25% sponsor fee, though BlackRock is waiving part of the cost for the first year, reducing it to 0.12% on the first $2.5 billion in assets. Jacobs said the temporary discount is intended to help the product gain traction in its early months.
Despite the growth of crypto investment products, allocations to digital assets remain relatively small in traditional portfolios. Institutions are typically allocating in the “low single digits,” often around 1% to 2%, according to Jacobs. At those levels, he said, the risk contribution of bitcoin or other digital assets can be comparable to the exposure investors already accept from large technology stocks within diversified portfolios.
BlackRock has rapidly become one of the largest players in crypto investment products. The firm oversees roughly $130 billion across crypto-related exchange-traded products, tokenized liquidity funds and stablecoin reserve management. According to the company, iShares captured about 95% of flows into digital asset ETPs in 2025.
For now, Jacobs said the firm remains focused on expanding adoption of its existing crypto products, particularly bitcoin and ether, as many investors are still learning about the asset class.
“We’re still in the early days of digital asset ETF adoption,” he said. “For many investors, this is the first step.”


The new product, EarnUSD, lets users earn yield on their USDC and USDT.
Lido, DeFi’s largest liquid staking protocol by total value locked, has launched EarnUSD, its first stablecoin vault, according to a press release shared with The Defiant.
The new product lets users deposit and earn yield on USDC and USDT. The vault allocates capital automatically across Ethereum-based USD-denominated strategies, including on-chain lending markets, real-world asset (RWA) integrations, and structured positions, per the release.
The move marks a broader focus for the protocol, which is known for being the largest ETH staking provider, with over 8.7 million ETH currently staked.
The launch restructures Lido Earn — which the firm says has attracted almost $250 million in deposits since launching in September 2025 — into two vaults: EarnETH and EarnUSD.
EarnETH, meanwhile, accepts ETH, WETH, and stETH, and distributes deposits across major DeFi protocols including Aave, Uniswap, and Morpho.
The launch of Lido’s stablecoin vault comes as stablecoin supply on Ethereum holds out over $160 billion, per data from DefiLlama. This represents over half over total USD stablecoin supply across all networks, currently at $314.9 billion.
Regulatory momentum — namely the GENIUS Act in the U.S.— has helped drive growth in the sector over the past year.
“Stablecoins are a fundamental part of DeFi, and until now we weren’t serving those users,” said Marin Tvrdić, Earn Partnerships at the Lido Ecosystem Foundation. “That changes today with EarnUSD.”
As part of the launch, the Lido DAO has voted to allocate $5 million from its treasury into the vaults alongside users, on the same terms. If a vault suffers losses, the DAO’s position absorbs them first, according to the release.
The move follows a DAO proposal from December that outlined a $60 million budget to expand Lido’s product offering beyond liquid staking, as reported by The Defiant.
Lido currently holds around $19 billion in TVL, according to DefiLlama, making it the largest liquid staking protocol in DeFi. The vast majority of its TVL is on Ethereum.
Lido’s TVL is down over 50% from its all-time high of over $42 billion reached last August amid ETH’s rally to a new all-time high, and increased regulatory clarity.
This article was written with the assistance of AI workflows. All our stories are curated, edited and fact-checked by a human.
Crypto World
Eightco Holdings (ORBS) Stock Rallies 22% Following $125M Investment from Major Institutions

Key Highlights
- On March 12, 2026, Eightco Holdings (ORBS) announced $125 million in fresh institutional funding commitments.
- Bitmine (BMNR) is leading the round with $75 million, while ARK Invest and Payward (Kraken’s parent company) each contributed $25 million.
- Chairman Dan Ives is departing the role; Tom Lee from Bitmine will join the company’s board of directors.
- Earlier in March, ORBS deployed $52.5 million into OpenAI equity and $25 million into MrBeast’s Beast Industries.
- Shares of ORBS climbed as high as 22% during Thursday’s trading session, reaching approximately 99 cents.
On March 12, 2026, Eightco Holdings (ORBS) revealed it had secured $125 million in new institutional capital, triggering a sharp rally in its share price during early market hours.
The funding round features a substantial $75 million investment from Bitmine (BMNR), the digital asset firm led by cryptocurrency advocate Tom Lee. Additionally, ARK Invest—managed by renowned investor Cathie Wood—and Payward, which operates the Kraken cryptocurrency exchange, each pledged $25 million to the initiative.
During Thursday’s trading, ORBS shares climbed to 99 cents, marking an approximately 22% gain for the session. This represents a significant recovery for the company, whose stock had previously declined more than 90% over recent months.
The newly raised funds are designated for ORBS’ expansion efforts in artificial intelligence, blockchain technology infrastructure, and digital consumer-facing platforms.
Alongside the funding announcement, the company revealed a leadership transition. Dan Ives, the prominent technology analyst from Wedbush Securities who assumed the chairman role just last September, is relinquishing the position. Tom Lee will now occupy a board seat at ORBS.
Brett Winton, who serves as Chief Futurist at ARK Invest, has been appointed as an advisory board member.
In a public statement, Ives described the incoming leadership configuration as “the perfect team” to advance the company’s strategic objectives.
Last January, Barron’s featured a comprehensive cover investigation into Ives’s dual responsibilities and possible conflicts arising from his simultaneous roles as company chairman and equity analyst at Wedbush. When contacted Thursday, Wedbush representatives declined to provide commentary.
Strategic Capital Deployment in OpenAI and Beast Industries
Prior to Thursday’s funding announcement, ORBS had already begun deploying significant capital into strategic opportunities. On March 6, the firm invested approximately $52.5 million to obtain economic interests in OpenAI equity.
Four days later, on March 10, ORBS committed roughly $25 million to Beast Industries—the corporate entity backing internet personality MrBeast—with $7 million of that amount scheduled for funding within the next 60 days.
The company also maintains existing positions in Worldcoin, a project co-created by OpenAI’s CEO Sam Altman, as well as holdings in Ethereum.
According to company disclosures, the OpenAI and Beast Industries transactions represent ORBS’ “initial strategic investments,” indicating additional deals may be forthcoming.
Wall Street Perspective
The latest analyst assessment for ORBS stock stands at a Hold rating, accompanied by a price objective of $1.50.
Eightco currently operates with a market capitalization hovering around $160 million, while average daily trading volume reaches approximately 4.6 million shares.
Through its recent funding activities and investment deployments, the company has established simultaneous positions across OpenAI, Beast Industries, Worldcoin, and Ethereum—positioning itself at the intersection of artificial intelligence and blockchain technology.

Ethereum is trying to build a base, but the general picture has not changed enough to call for a real trend reversal yet. The asset is holding above the February floor, and that matters, yet ETH is still trading beneath major overhead resistance, which leaves the market in a recovery attempt rather than a confirmed bullish phase.
Ethereum Price Analysis: The Daily Chart
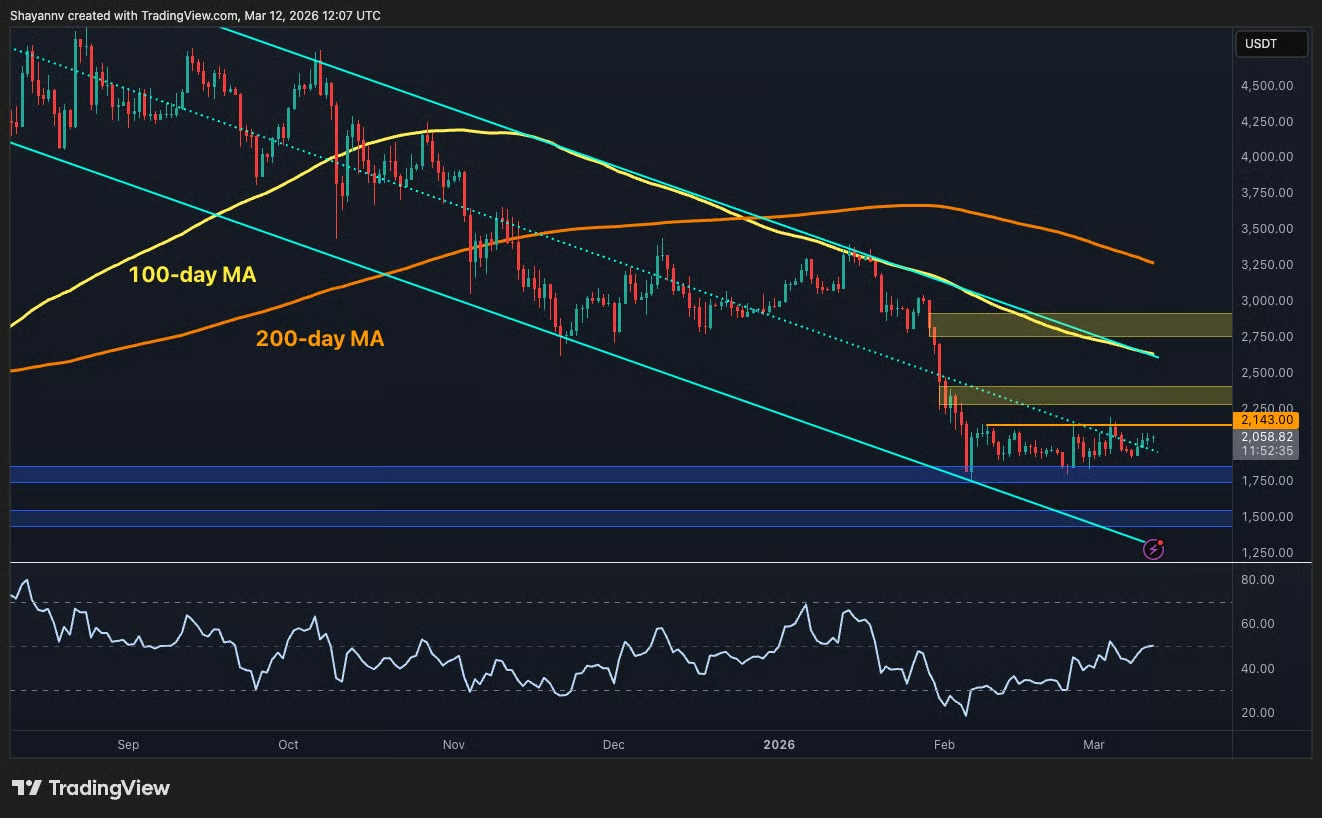
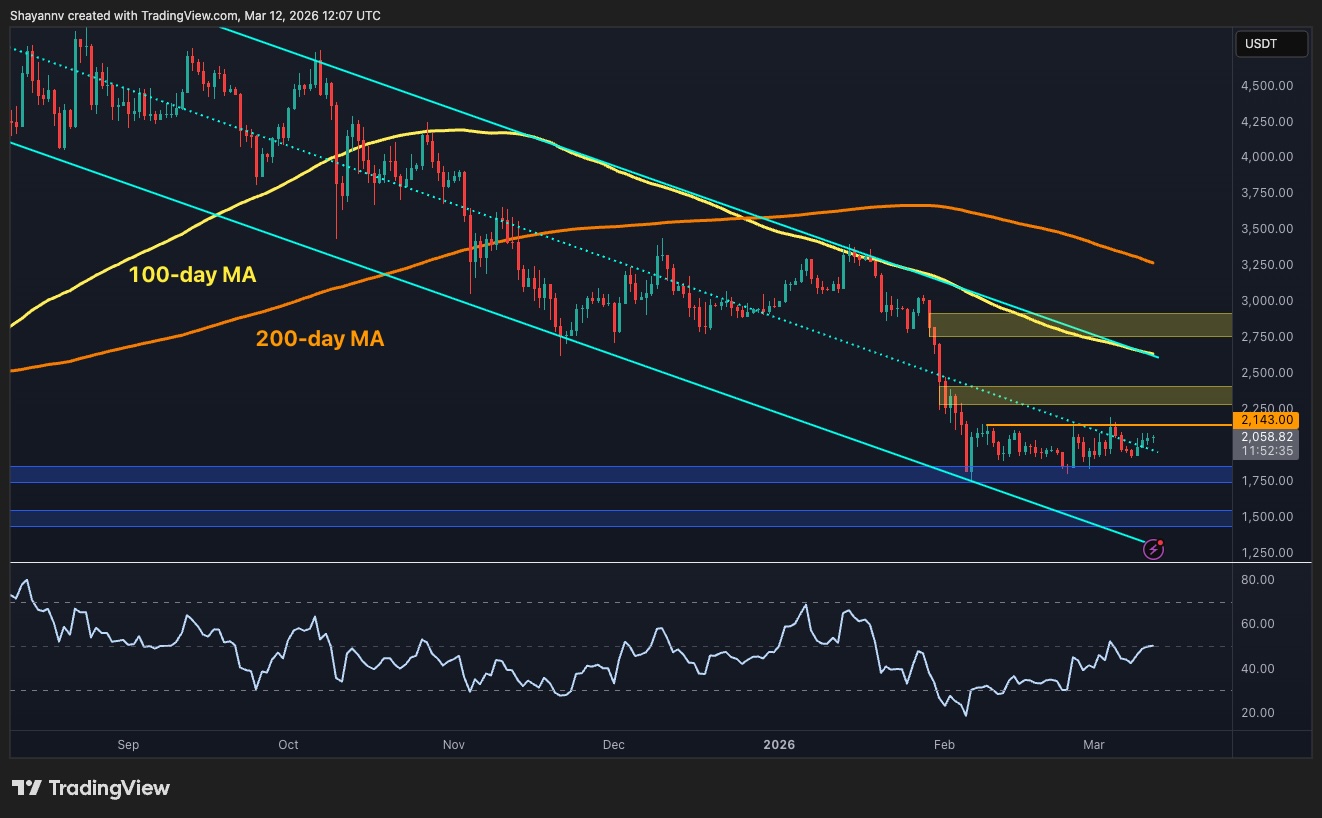
The daily chart still leans bearish. ETH remains below the 100-day and 200-day moving averages, and the broader sequence from the prior months continues to reflect a market that has been making lower highs inside a descending structure. The violent selloff in early February damaged the chart significantly, and even though the panic has cooled, buyers have not done enough to repair the higher timeframe setup.
What stands out now is the market’s ability to defend the $1,800 to $1,700 demand area. That zone has become the line separating stabilization from renewed weakness. On the upside, ETH keeps running into resistance near $2,150 first, then the $2,400 supply region, while the larger bearish pivot still sits much higher near $2,800. So for now, this remains a market trying to rebound within a bigger downtrend, not one that has escaped it.
ETH/USDT 4-Hour Chart
The 4-hour chart is more constructive. ETH has been carving out a series of firmer lows since the late February bottom, and the rising trendline underneath price shows that buyers are gradually stepping in on dips instead of allowing another immediate breakdown. Momentum has also improved, with RSI recovering and staying in a healthier range compared to the weakness seen during the last leg down.
Still, the buyers have one obvious problem: they are not breaking the ceiling. The $2,150 level has repeatedly capped the upside, and until that barrier gives way, the recent advance looks more like controlled consolidation than a fresh impulsive breakout. If that level is reclaimed, ETH could quickly rotate toward the next supply band around $2,300 to $2,400. If not, the market likely remains stuck in a sideways grind above support.

On-Chain Analysis
The active addresses chart paints a more nuanced picture than pure price action. Network activity expanded aggressively into the recent period, which suggests Ethereum was still seeing solid user engagement even as the market structure weakened. That kind of divergence can be important because it shows the chain itself did not completely lose participation during the drawdown.
However, the latest drop in active addresses also shows that participation has cooled with price stress, so the metric is not giving a clean bullish signal yet. In other words, sentiment is no longer washed out, but it is not convincingly strong either. The takeaway is that underlying activity offers some support for a medium term recovery thesis, though price still needs to validate it by pushing through resistance.

Binance Free $600 (CryptoPotato Exclusive): Use this link to register a new account and receive $600 exclusive welcome offer on Binance (full details).
LIMITED OFFER for CryptoPotato readers at Bybit: Use this link to register and open a $500 FREE position on any coin!
Disclaimer: Information found on CryptoPotato is those of writers quoted. It does not represent the opinions of CryptoPotato on whether to buy, sell, or hold any investments. You are advised to conduct your own research before making any investment decisions. Use provided information at your own risk. See Disclaimer for more information.

What he’s saying: Nahas told Sam Ewen on CoinDesk’s Gen C that Avalanche is a business tool, not a crypto product. He said companies want tailored blockchain infrastructure that fits compliance, geography and operational needs.
Nahas compared Avalanche’s model to WordPress, arguing businesses should be able to “spin up” a blockchain the way they spin up websites.
He said Avalanche’s strategy has shifted from broad crypto narratives toward “built for business” and embedded finance.
The goal, according to Nahas, is to help companies either make new revenue through digitization or cut costs through more efficient digital rails.
Why it matters: The discussion shows how one major crypto network is trying to distance itself from speculative token mania and pitch itself as enterprise infrastructure.
Nahas said much of crypto has been “technology for technology’s sake,” with too few products solving concrete customer problems.
He argued that businesses do not want to force their operations onto a shared general-purpose chain if they need privacy, specific fee structures or regulatory controls.
That stance reflects a broader industry push to hide the underlying blockchain and sell outcomes instead: faster payments, tokenized assets and new customer experiences.
Closer look: Nahas said Avalanche’s former “subnets” model, now rebranded as Avalanche L1s, is designed to let businesses run sovereign blockchains with their own validators and rules.
He said Avalanche has more than 70 live L1s and is targeting roughly 200 by the end of the year.
He pointed to use cases including tokenized equities, FIFA digital products, deed records in Bergen County, New Jersey, and tokenized asset programs in Japan.
Nahas said Avalanche’s combined L1 activity is processing about 40 million daily transactions, though those transactions are spread across many chains rather than concentrated on one flagship network.
Reading between the lines: Nahas was blunt that crypto’s critics are not entirely wrong. He said too much of the industry has relied on speculation, weak business models and short-term headlines.
He said “the token was the product” for many projects, which in his view is not a durable business model.
Nahas argued the sector still has not produced enough true “killer apps” that only blockchain can enable, though he suggested stablecoins may be emerging as one of them.
He also said enterprise partners are already in crypto, but often do not like what they see when projects focus more on announcements than execution.
What comes next: Nahas said clearer rules could unlock more institutional activity, even if crypto’s more libertarian wing resists regulation.
He said many companies want to build with blockchain now but will not move until they know where the legal line is.
On AI, he said blockchain-based payment rails could become important for agentic systems and micropayments, pointing to Avalanche partner Kite AI as an example.
His broader argument: the winning crypto platforms will be the ones that act less like ideology and more like dependable business infrastructure.
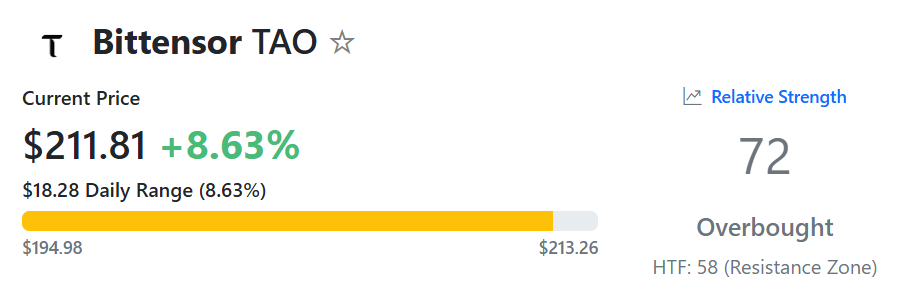
What’s next for TAO after reaching a one-month peak?
Bittensor (TAO) has pumped by double digits over the past seven days, with some analysts expecting this could be the beginning of a much more substantial surge.
At the same time, certain indicators suggest a short-term correction is also a plausible option.
Further Gains Ahead?
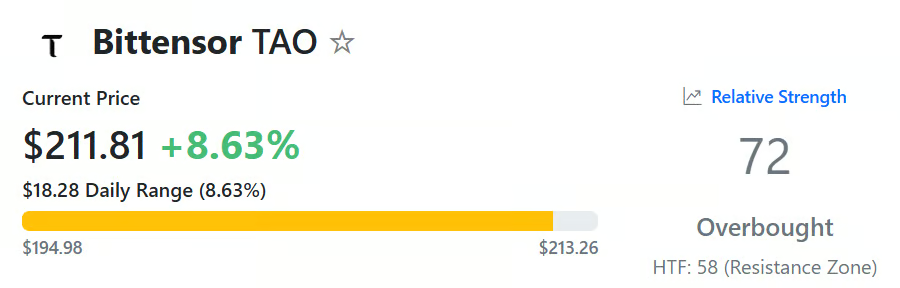
As of this writing, TAO trades at around $213 (per CoinGecko), making it the top daily performer among the biggest 100 cryptocurrencies after rising 9% over the period. Its market capitalization soared past the $2 billion psychological mark, thus flipping well-known altcoins such as OKB, ASTER, and others.
The renowned analyst Ali Martinez noted TAO’s strong performance, spotting the potential formation of an Adam & Eve pattern on its price chart. It consists of two bottoms: a sharp “Adam” dip and a rounded “Eve” plunge. The structure is generally considered bullish, as it suggests sellers have lost momentum and could be replaced by buyers. Martinez estimated that in this case, TAO’s price could soar to as high as $270.
X user GalaxyTrading is also quite optimistic. Recently, they described TAO as “the clearest 10x coin for the next altcoin run phase.” The analyst argued that the asset could emerge as a dominant figure in the crypto space thanks to the development of Artificial Intelligence.
ZAYK Charts chipped in, too. Earlier this week, they assumed that Bittensor’s native token was moving within a falling channel, predicting that a breakout above roughly $200 could open the door to a possible 100% increase to almost $400.
Moving South is Also an Option
Despite the prevailing optimism among traders and analysts, some technical indicators suggest TAO’s valuation could tumble in the near future.
You may also like:
The asset’s Relative Strength Index (RSI), which measures the speed and magnitude of recent price changes, has risen above 70. This signals that the token is overbought and could be on the verge of a short-term pullback. The index runs from 0 to 100, and conversely, ratios below 30 are typically interpreted as buying opportunities.
The next factor on the list is TAO’s exchange netflow. CoinGlass’s data show that over the past few days, inflows have exceeded outflows, indicating that investors have been shifting from self-custody to centralized platforms. This is often viewed as a pre-sale step.

Binance Free $600 (CryptoPotato Exclusive): Use this link to register a new account and receive $600 exclusive welcome offer on Binance (full details).
LIMITED OFFER for CryptoPotato readers at Bybit: Use this link to register and open a $500 FREE position on any coin!


Disclosure: This article does not represent investment advice. The content and materials featured on this page are for educational purposes only.
A $109 billion surge in the crypto market cap signals renewed momentum for Bitcoin and Ethereum while emerging DeFi protocols such as Mutuum Finance gain attention.
Summary
- The total crypto market capitalization has climbed to $2.36 trillion, with strong leadership from Bitcoin near $70,000 and Ethereum around $2,000.
- Continued accumulation by major investment firms and inflows into spot Bitcoin ETFs are reinforcing market confidence and supporting the rebound.
- DeFi platforms like Mutuum Finance are attracting users and capital through non-custodial lending models, testnet activity, and infrastructure designed for automated on-chain liquidity.
The top crypto market is currently experiencing a significant wave of recovery. Following a period of intense volatility and macroeconomic uncertainty, the total cryptocurrency market capitalization has surged by $109 billion within a single 24-hour window.
This brings the total market value to $2.36 trillion, a level that suggests a renewed appetite for risk among both retail and institutional investors. The recovery is notably broad-based, with leadership coming from the industry’s two largest assets while capital begins to rotate into specialized utility-driven projects.
Crypto market update
The recent surge to a $2.36 trillion total market cap highlights the resilience of the digital economy. While the previous weeks were defined by “panic selling” and a flight to the U.S. dollar, the current landscape shows a distinct “buy the dip” mentality.
Institutional demand remains a cornerstone of this recovery; notably, large investment firms like Strategy Inc. have continued aggressive accumulation, recently adding nearly 18,000 BTC to their balance sheets. This level of professional conviction often serves as a floor for the market, encouraging smaller participants to return to the fray.
Furthermore, the stabilization of the total market cap (TOTAL) has allowed the broader altcoin sector to catch a bid. While Bitcoin leads the way, the “Altcoin Season Index” is beginning to tick upward as investors look for higher-beta opportunities in decentralized finance (DeFi) and infrastructure protocols.
Bitcoin
Bitcoin (BTC) is currently trading near the $70,000 psychological threshold, marking a forceful recovery from its recent weekend low of $65,000. The asset has shown remarkable strength by decoupling from traditional equities during the most volatile sessions of the week. Technical analysts are now focused on a primary resistance level at $72,294. A daily close above this mark could trigger a “short squeeze,” as significant liquidation clusters are positioned just above $72,000, potentially catapulting the price toward $75,000.
On-chain data confirms this bullish shift, with cumulative net inflows into U.S. Spot Bitcoin ETFs now exceeding $55 billion. With a market cap of $1.38 trillion, Bitcoin’s dominance remains high, yet its “lower highs” on the short-term charts suggest that the $72,294 barrier remains a heavy structural ceiling. Should the price fail to break out, the $68,800 and $65,600 levels will serve as the immediate support zones to watch.
Ethereum
Ethereum (ETH) is following Bitcoin’s lead, currently trading near $2,000 after a volatile week that saw it dip below the $1,850 mark. The asset is benefiting from a combination of short-covering and renewed interest in its upcoming “Glamsterdam” upgrade. This network improvement aims to further enhance scalability and security, providing a fundamental catalyst for long-term holders.
With a market capitalization of roughly $258 billion, Ethereum continues to play a central role in the decentralized finance ecosystem, accounting for a significant share of the Total Value Locked (TVL) across blockchain networks.
Traders are watching the $2,200 resistance zone closely; flipping this level back into support would signal that the multi-week bearish trend has officially been broken. Conversely, the $2,000 psychological level remains the most critical floor, with large “whale” accumulation noted every time the price approaches this zone.
Utility protocols in Q1 2026
As the cryptocurrency market develops in 2026, increased attention has been placed on protocols designed to deliver specific financial functions within decentralized ecosystems. These platforms typically focus on services such as on-chain liquidity management, lending, and automated yield mechanisms. Within this context, projects such as Mutuum Finance (MUTM), an Ethereum-based non-custodial lending protocol, have reported raising more than $20.7 million and attracting around 19,000 participants.
The core of the Mutuum Finance ecosystem relies on two transparent digital assets that track value and obligations. When a user provides liquidity to the protocol, they receive mtTokens as a digital receipt.
For example, a lender who deposits 1,000 USDT into a pool with a 10% Annual Percentage Yield (APY) will see their mtUSDT grow in value over time. By the end of the year, those tokens would be redeemable for 1,100 USDT, with the interest accrued automatically from the fees paid by borrowers.
On the borrowing side, the system uses Debt Tokens to track the exact amount owed. To protect the protocol from market drops, a strict Loan-to-Value (LTV) ratio is enforced. For example, with a 75% LTV, a user providing $6,000 worth of WBTC as collateral can safely borrow up to $4,000 in stablecoins. This ensures the loan is always over-collateralized, protecting the protocol’s liquidity and providing the borrower with liquidity without forcing them to sell their Bitcoin.
V1 Protocol performance and the road ahead
The technical foundation for these features is the V1 Protocol, which is currently live on the Sepolia testnet. With over $200 million in simulated TVL, the V1 version allows the 19,000 investors to test features like the “one-click” Safe-Mode borrowing, which automatically selects the safest LTV based on current market volatility.
This environment provides a risk-free space where users can interact directly with mtTokens and Debt Tokens, gaining hands-on experience with how interest accrues and how debt is tracked without using real capital. The protocol currently supports liquidity pools for WBTC, LINK, USDT, and ETH, allowing testers to see how different assets behave under various conditions.
To maintain system integrity, the V1 protocol utilizes decentralized oracles to pull accurate, real-time price data, ensuring that collateral values are always precise. This data feeds into the protocol’s Stability Factors, which act as automated safeguards to monitor loan health and protect the system from sudden market shifts. This comprehensive testing phase is the final step before the protocol moves to the Ethereum mainnet.
In conclusion, the $109 billion surge in the crypto market cap signals that the Q1 2026 recovery is in full swing. While Bitcoin and Ethereum provide the necessary stability and institutional appeal, utility protocols are building the functional infrastructure that will likely define the next crypto stage.
Disclosure: This content is provided by a third party. Neither crypto.news nor the author of this article endorses any product mentioned on this page. Users should conduct their own research before taking any action related to the company.

The diamond chart pattern is a technical analysis formation that appears on price charts after a strong trend and often signals a trend reversal. The structure consists of a broadening phase (higher highs and lower lows) followed by a contracting phase (lower highs and higher lows), creating a shape that resembles a diamond. Traders analyse this pattern to identify trend exhaustion, breakout levels, and possible changes in market direction.
This article explains the structure of the diamond chart pattern, the market psychology behind it, and how to trade the diamond pattern.
What Is the Diamond Chart Pattern?
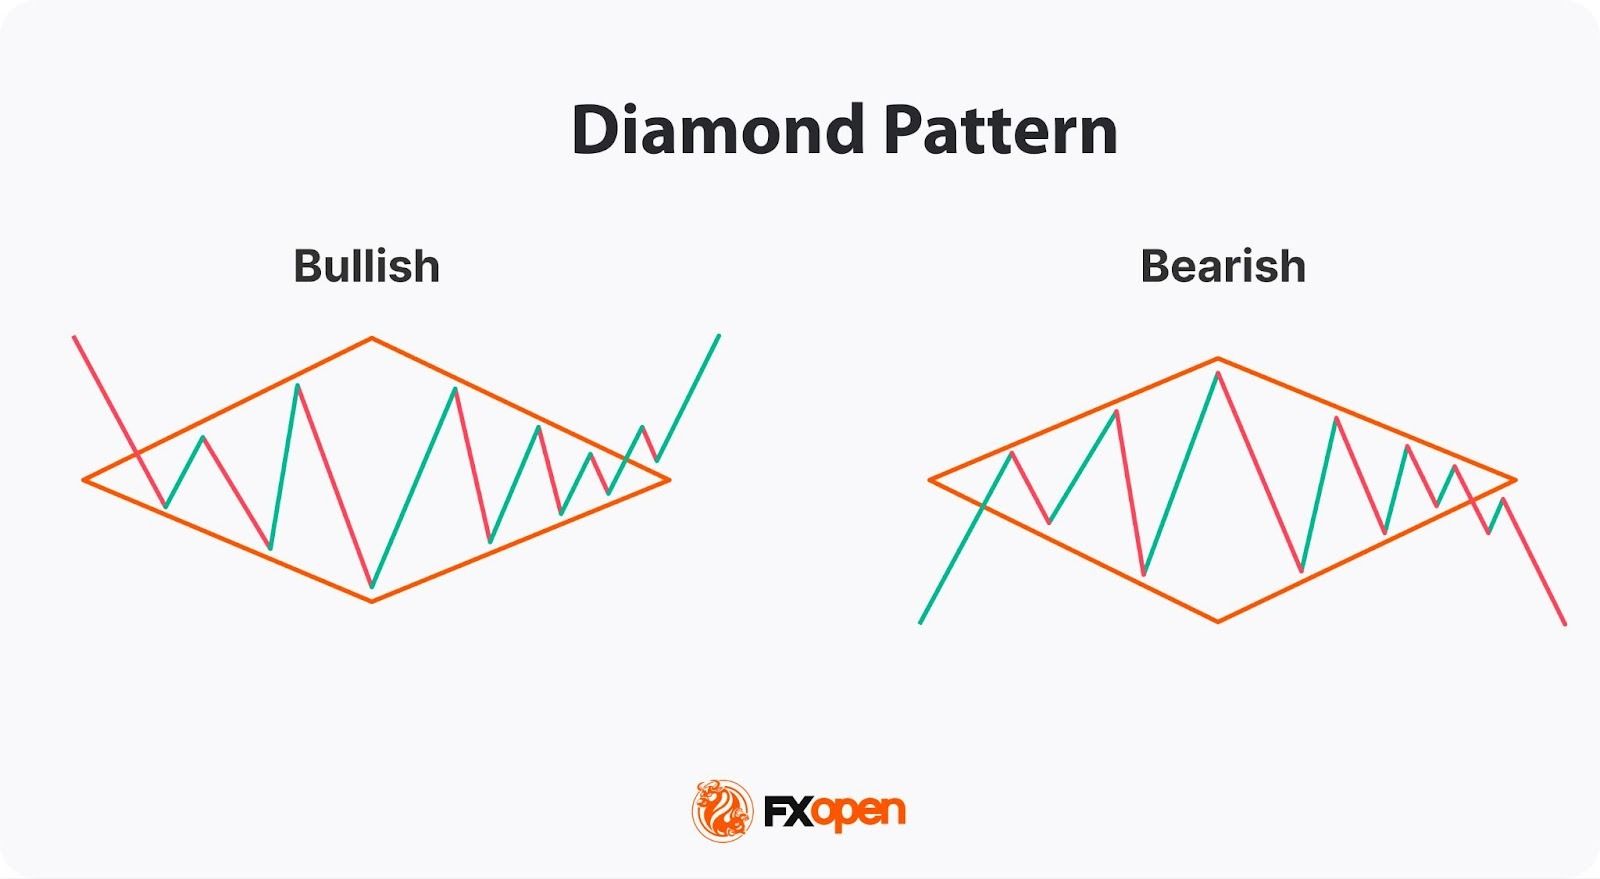
The diamond pattern is a technical analysis formation that develops after a strong trend and often signals a potential market reversal. It forms when price movements first create higher highs and lower lows, producing a broadening structure, and then shift to lower highs and higher lows, creating a contracting structure. Together these movements form a diamond-shaped pattern on the chart.
The diamond pattern can be either bearish or bullish, and it is also known as the diamond top pattern and diamond bottom pattern for trading. Both formations share the same structural characteristics but occur in different market conditions and signal different potential outcomes.
- A bearish diamond pattern occurs during an uptrend and signals a potential reversal to the downside.
- A bullish diamond pattern in trading forms during a downtrend and signals a potential reversal to the upside.
Market Psychology Behind the Diamond Pattern
The diamond pattern in trading reflects a gradual shift in market sentiment. During the expansion phase, price swings become wider as buyers and sellers compete for control of the market. This stage often reflects uncertainty and heightened volatility.
As the formation progresses, volatility begins to contract. Price movements become narrower, suggesting that the market is moving towards a new balance between supply and demand.
The eventual breakout from the pattern typically represents a decisive shift in control. If buyers dominate, the price may break upward. If sellers take control, the breakout may occur to the downside. For this reason, traders often analyse the diamond pattern as a signal of potential trend exhaustion and a possible change in market direction.
How to Identify a Diamond Pattern on a Chart
The diamond pattern has a distinctive but relatively straightforward structure. Traders follow certain steps to spot it on the chart.
- Look for a strong trend – A diamond usually forms after a strong upward or downward trend, when the market begins to lose momentum and volatility increases.
- Identify an expansion phase – Price forms a sequence of higher highs and lower lows, creating a broadening structure and reflecting increasing volatility.
- Identify a contraction phase – Price movements begin to narrow, producing lower highs and higher lows.
- Draw the trendlines – Traders outline the structure with four trendlines that form a diamond shape.
Diamond Pattern Statistics
The diamond chart pattern is less common than formations such as triangles or head and shoulders. However, it can precede significant price movements. Research by technical analyst Thomas Bulkowski shows that diamond bottom patterns break upward about 73–74% of the time, with an average rise of roughly 35–39% after the breakout. Diamond top patterns break downward about 54% of the time, with an average decline of around 17%.
How to Trade the Diamond Reversal Pattern
Like most chart patterns, this formation has particular rules traders can use to build their own trading strategies. These rules can be applied to the diamond pattern in forex, stock, commodity, and cryptocurrency* markets.
Entry
Traders typically buy after the price breaks above the upper boundary of the pattern and sell after the price falls below the lower boundary.
The breakout signals a potential trend reversal.
- If the breakout occurs above the upper trendline after a downtrend, it signals a bullish reversal.
- In the bearish diamond pattern, the breakout occurs below the lower trendline, which signals a bearish reversal.
Traders use several confirmation tools. The first one is rising trading volume. The breakout should be accompanied by an increase in trading volume. Low trading volumes usually signal a false breakout, whereby the price returns to its previous trend. Fakeouts can be caused by market volatility, news events, or other factors that disrupt its validity.
The second tool is multiple timeframe analysis. For example, if a diamond is forming on the hourly chart, traders may look at higher timeframes, such as the 4-hour or daily chart. If the breakout aligns with the trend on multiple timeframes, it may provide a stronger trading signal.
Target
The take-profit target typically equals the width of the diamond setup. Traders measure the vertical distance between the highest high and the lowest low and add that distance to the breakout point in the bullish formation or subtract this distance from the breakout point in the bearish formation.
Stop Loss
Traders typically place stop-loss orders just beyond the level opposite to the breakout. Another approach is to place stop loss beyond the apex, which is the highest point in a diamond top pattern or the lowest point in a diamond bottom pattern.
Special Consideration
Although the diamond is primarily considered a reversal formation, it can also indicate the continuation of an existing trend. Traders can see it appearing within the context of a strong trend and interpret it as a pause before it resumes.
In the case of a diamond continuation pattern, traders go short on the breakout of the lower trendline of the diamond and go long on the breakout of its upper trendline. Still, the profit target and stop-loss point will be calculated similarly to the reversal formation.
To confirm the diamond formation, traders often rely on a combination of technical indicators and fundamental analysis. These tools provide additional layers of validation and may help filter out false signals.
- Volume Analysis: An increase in volume accompanying the diamond pattern breakout suggests strong market interest. Conversely, low volume may indicate a false breakout.
- Momentum Indicators: Divergence—where the indicator moves opposite to the price—can signal a potential reversal and confirm the pattern’s signals.
- Moving Averages: When the price crosses above or below moving averages in conjunction with the diamond reversal pattern, it might offer stronger confirmation of the breakout direction.
- Fundamental News Events: Major economic announcements or geopolitical events can trigger significant price movements that align with a breakout from a diamond. Tracking these events may help us understand the broader context.
Diamond Pattern Trading Strategies
The diamond formation can be used in various trading strategies. Here are some common approaches that traders can utilise.
Diamond Pattern Breakout Trading
One of the most straightforward strategies with the diamond setup is to trade breakouts.
Entry: Traders enter the market in the breakout direction. They wait for the price to break above the upper trendline in a diamond bottom formation or below the lower trendline in a diamond top trading pattern.
Stop loss: Traders usually place a stop-loss order below the lower line in a bullish formation or above the upper line in a bearish formation. Another option is to consider the risk-reward ratio of 1:2 or 1:3.
Take profit: The most common approach is to measure the difference between the diamond’s highest high and lowest low. This distance is added to the breakout point for a bullish breakout and subtracted from the breakout point for a bearish breakout. If traders trade in a solid trend, a take-profit target can be trailed.
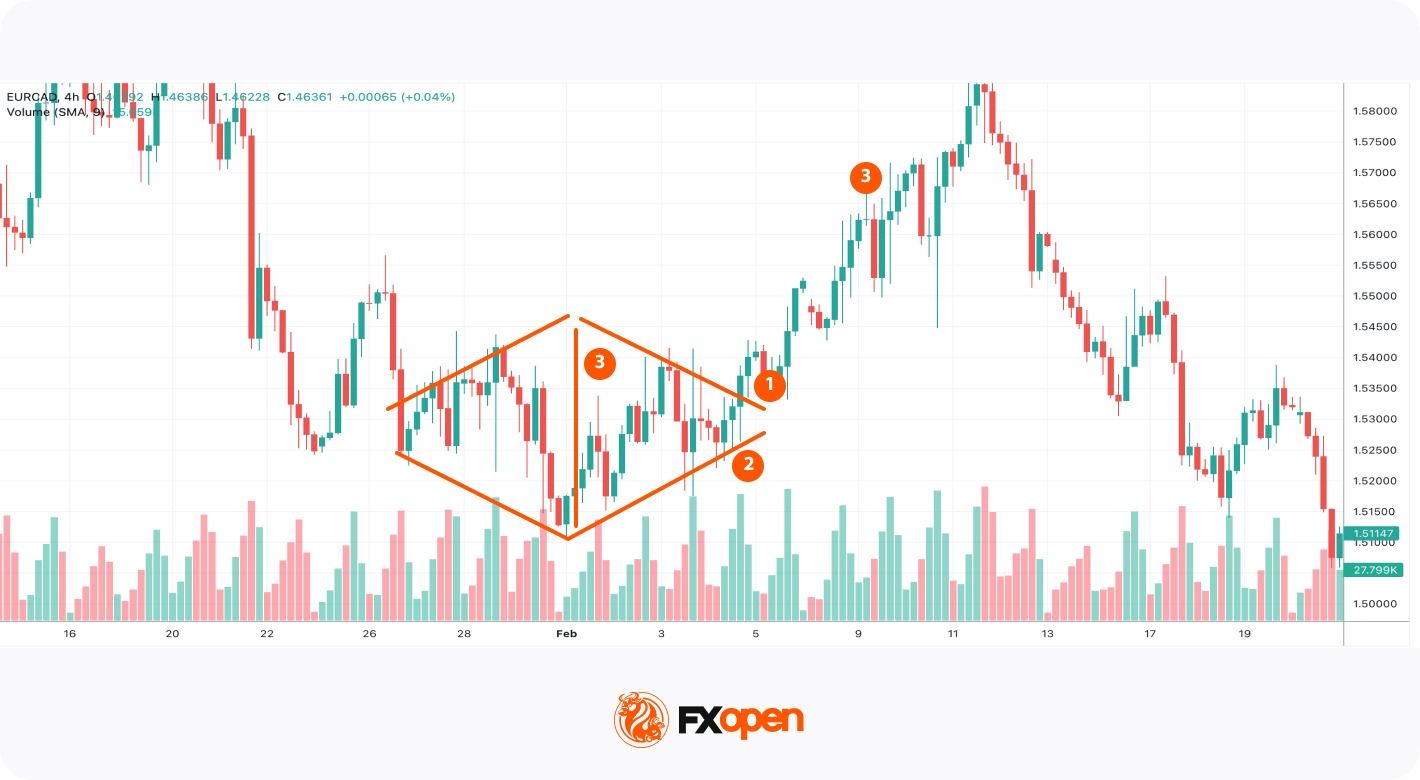
In the chart above, a bullish diamond formed after a prolonged downtrend. The price broke above the upper line (1). The volumes on the breakout increased significantly, so a trader could have expected bulls to push the price higher. A trader could have placed a stop-loss level below the lower line (2). After that, a trader could have measured the distance between the highest and the lowest points and added this to the breakout point (3). The bullish trend was strong, so a trader could have trailed that take-profit target.
Retracement and Reversal Trading
Another strategy is to look for price retracements.
Entry: Traders wait for the price to retest the broken trendline and then enter a trade in the breakout direction. In this approach, traders usually use a limit order.
Stop loss: Stop loss is placed below the retracement level in the bullish pattern and above the retracement level in case of a bearish setup.
Take profit: A profit target is calculated based on the distance between the highest and lowest points. The distance is added to the breakout point in the bullish formation or subtracted from the breakout point in a bearish formation.
Trailing stop-loss and take-profit orders can be applied to this approach.
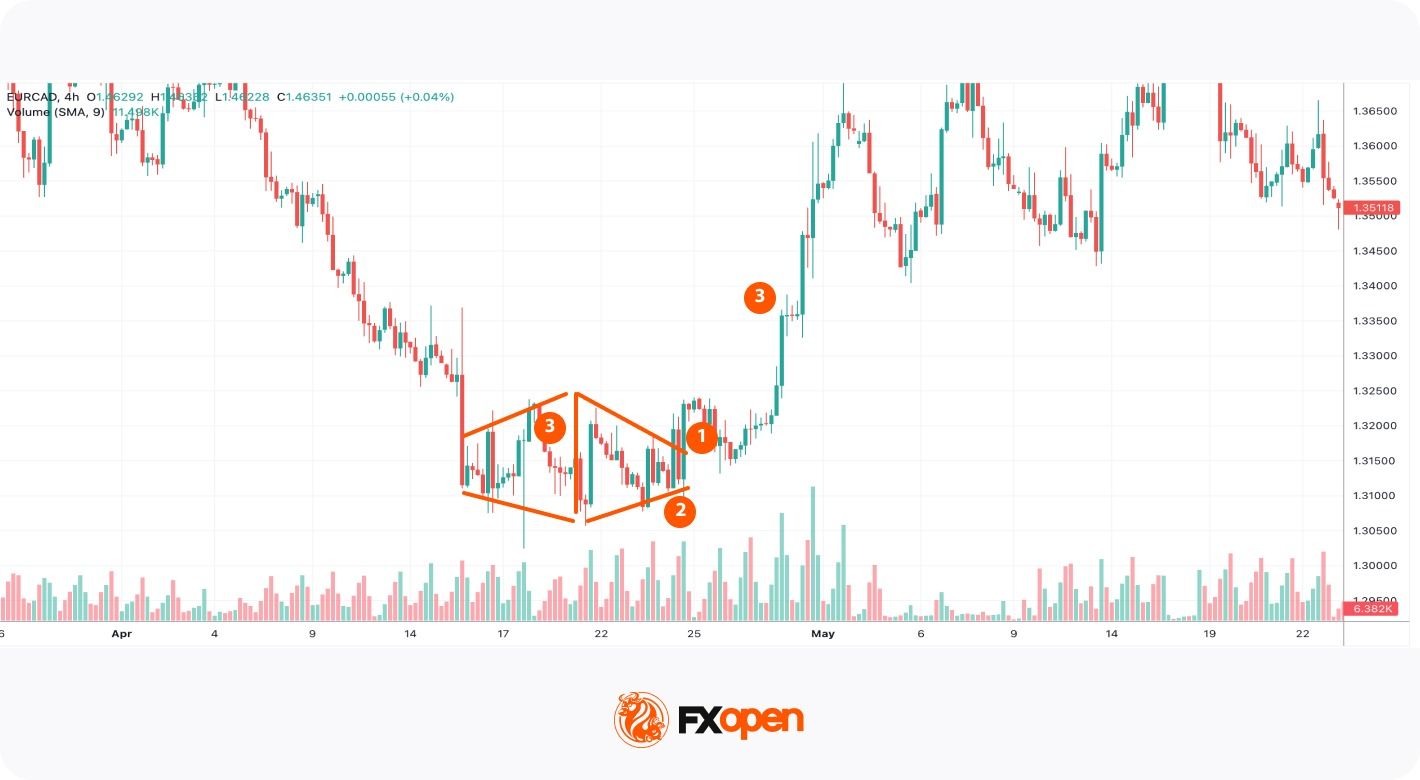
In the chart above, a diamond bottom pattern was formed. The price broke above the formation’s upper line, but it retested it later (1). A trader could have placed a buy limit order at the upper line. A stop-loss could have been placed below the lower line (2), while a take-profit target could have equalled the distance between the highest and lowest points of the formation (3).
This strategy may support traders in catching potential trend reversals. However, there is a risk of a missing trade as the price may keep moving in a breakout direction without a retracement.
If you want to practice these trading approaches, you may consider opening an account on FXOpen’s TickTrader trading platform and access numerous technical analysis tools and assets.
Diamond vs Head and Shoulders
The diamond formation is commonly compared to the head and shoulders setup. However, they have different trading rules; therefore, it’s vital to learn how to distinguish between them.
The head and shoulders formation consists of three peaks, with the middle peak (the head) being higher than the other two peaks (the shoulders) and is formed at the end of an uptrend. The inverse head and shoulders pattern consists of three troughs, with the middle one being lower (head) than the other two troughs, and it appears at the end of a downtrend.
The diamond, on the other hand, is characterised by a series of higher highs and lower lows which turn into lower highs and higher lows.
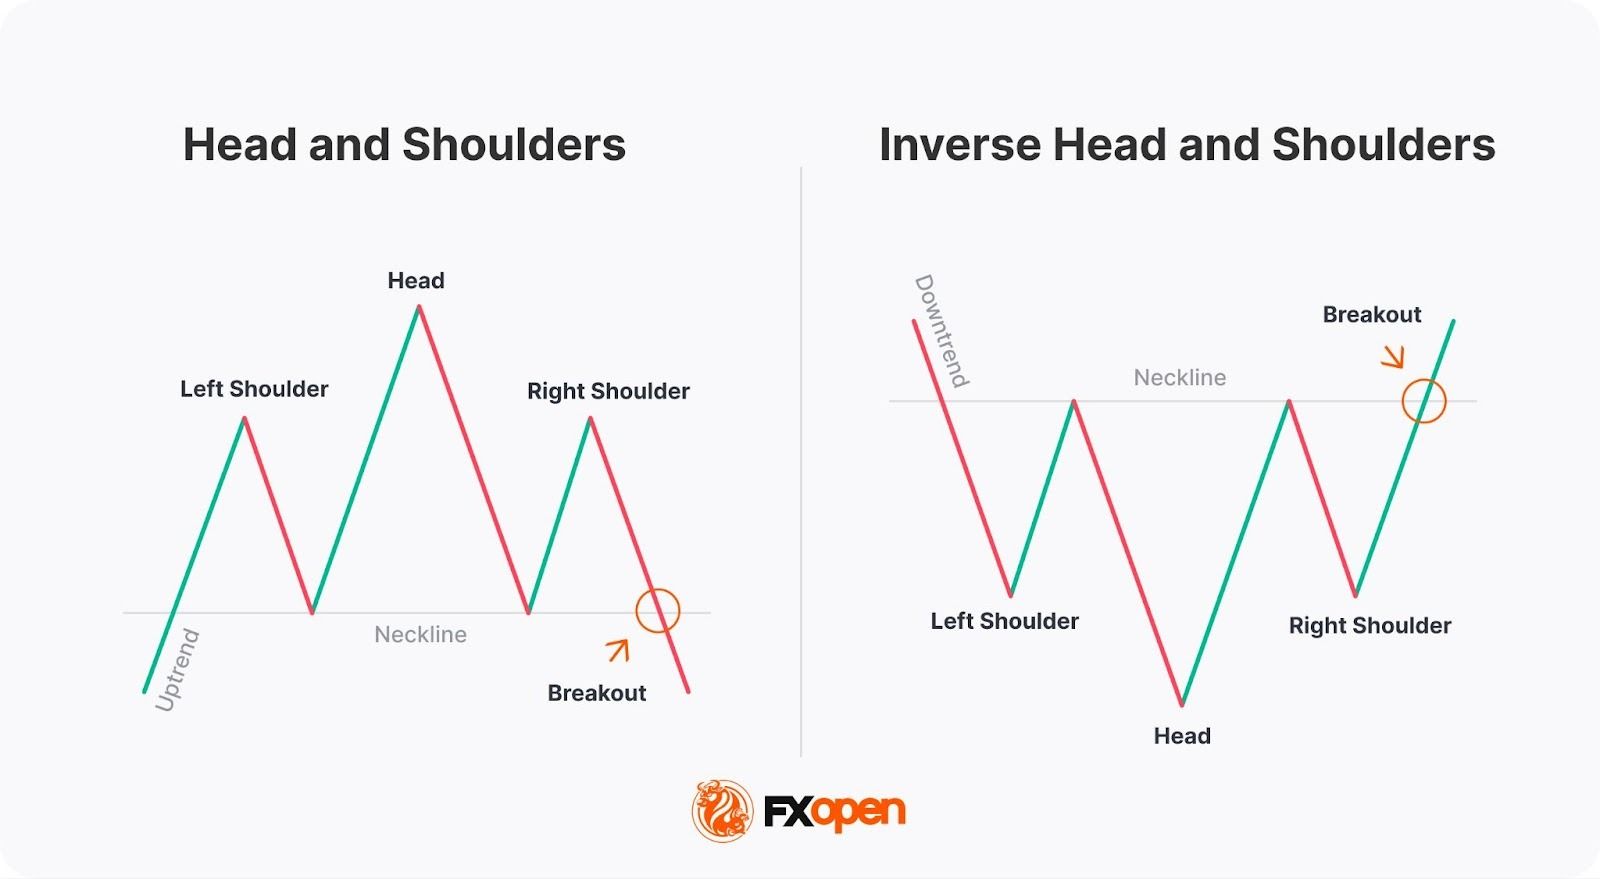
When trading the (inverse) head and shoulders setup, traders measure the distance between the head and the neckline (the line drawn through troughs in the head and shoulders and through peaks in the inverse head and shoulders) and add it to the breakout point.
Why the Diamond Pattern Matters in Technical Analysis
The diamond holds value in technical analysis due to its unique shape and ability to reflect future price reversals.
It represents a period of indecision in the market where neither buyers nor sellers dominate. This indecision is marked by a series of higher highs and lower lows that eventually narrow into a symmetrical structure resembling a diamond.
Although it is not the most common pattern, when it does appear, it often precedes significant market moves. However, traders should be aware that the reliability of its signals varies depending on many factors, including market conditions, volume, and external factors.
Advantages of the Diamond Pattern in Trading
The distinctive structure of a diamond may provide several advantages when assessing price behaviour on financial charts.
- Potential early signal of trend reversal – The pattern often forms after a strong trend, which strengthens a chance of a trend reversal.
- Clear chart structure – Expanding and contracting swings create a distinctive diamond shape.
- Defined breakout levels – The setup’s boundaries may help identify potential entry points.
- Applicable across multiple markets and timeframes – The diamond may appear across different asset classes, including forex, stocks, commodities, and cryptocurrencies*, and can be identified on both short-term and long-term charts.
- Compatible with other technical tools – Traders often combine the diamond with indicators such as RSI, MACD, moving averages, or support and resistance levels to confirm potential breakouts.
Limitations of the Diamond Pattern
While the diamond can be a valuable tool, it has limitations.
- Low frequency of occurrence – The diamond chart formation is relatively rare compared with other chart formations.
- Risk of false breakouts – Breakouts from the pattern do not always lead to sustained price movements. In some cases, the price may briefly move beyond the trendline and then reverse.
- Subjectivity in identification – The formation requires discretionary judgement when drawing trendlines and defining its boundaries. Different traders may interpret the same structure differently.
- Imprecise price targets – Price targets based on the height of the pattern provide only an approximate projection. Actual price movements may differ depending on volatility, liquidity, and market conditions.
- Dependence on market conditions – The strength of the diamond’s signals may vary depending on the broader market environment. In highly volatile or ranging markets, the probability of false signals may increase.
Important Factors When Trading the Diamond Pattern
Traders often focus on confirmation signals and overall market context rather than relying on the pattern alone. Applying a structured approach may help improve the quality of trade decisions.
- A confirmed breakout. A confirmed breakout above or below the pattern’s boundary may provide a clearer directional signal.
- The overall market trend. Diamond setups often appear after strong trends. Evaluating the broader market context may help determine whether the formation signals a reversal or continuation.
- Volume or momentum indicators. Some traders combine the pattern with indicators such as RSI, MACD, or volume analysis to assess the strength of the potential breakout.
- Risk management levels. Stop-loss levels are often placed near recent swing highs or lows within the setup.
Final Thoughts
The diamond chart pattern is a distinctive technical analysis formation that may signal trend reversals after strong price movements. Although it appears less frequently than other chart formations, its structure can provide valuable information about market indecision, volatility shifts, and potential breakout points. Traders typically combine it with volume analysis, support and resistance levels, and broader market context.
If you want to apply the diamond pattern in real trading, you may consider opening an FXOpen account to access over 700 markets and trade with low commissions from $1.50 and tight spreads from 0.0 pips.
FAQ
How Do Traders Identify a Diamond Pattern?
Traders identify a diamond chart formation by observing price movements that first expand and then contract, forming a diamond-shaped structure on the chart. The formation is typically outlined using four trendlines connecting higher highs, lower lows, lower highs, and higher lows. A confirmed breakout from the pattern often signals a potential change in trend direction.
Is a Diamond Pattern Bullish?
A diamond chart formation can be either bullish or bearish depending on where it forms in the market trend. A diamond bottom pattern develops after a downtrend and may signal a potential bullish reversal. A diamond top pattern appears after an uptrend and may indicate a possible shift to a bearish trend.
How May a Diamond Pattern Be Traded?
Trading a diamond typically involves waiting for a breakout from the formation. Traders often enter a position in the direction of the breakout and place stop-loss orders beyond the opposite side of the formation. The potential price target is often estimated using the vertical distance between the highest and lowest points of the formation.
*Important: At FXOpen UK, Cryptocurrency trading via CFDs is only available to our Professional clients. They are not available for trading by Retail clients. To find out more information about how this may affect you, please get in touch with our team.
This article represents the opinion of the Companies operating under the FXOpen brand only. It is not to be construed as an offer, solicitation, or recommendation with respect to products and services provided by the Companies operating under the FXOpen brand, nor is it to be considered financial advice.
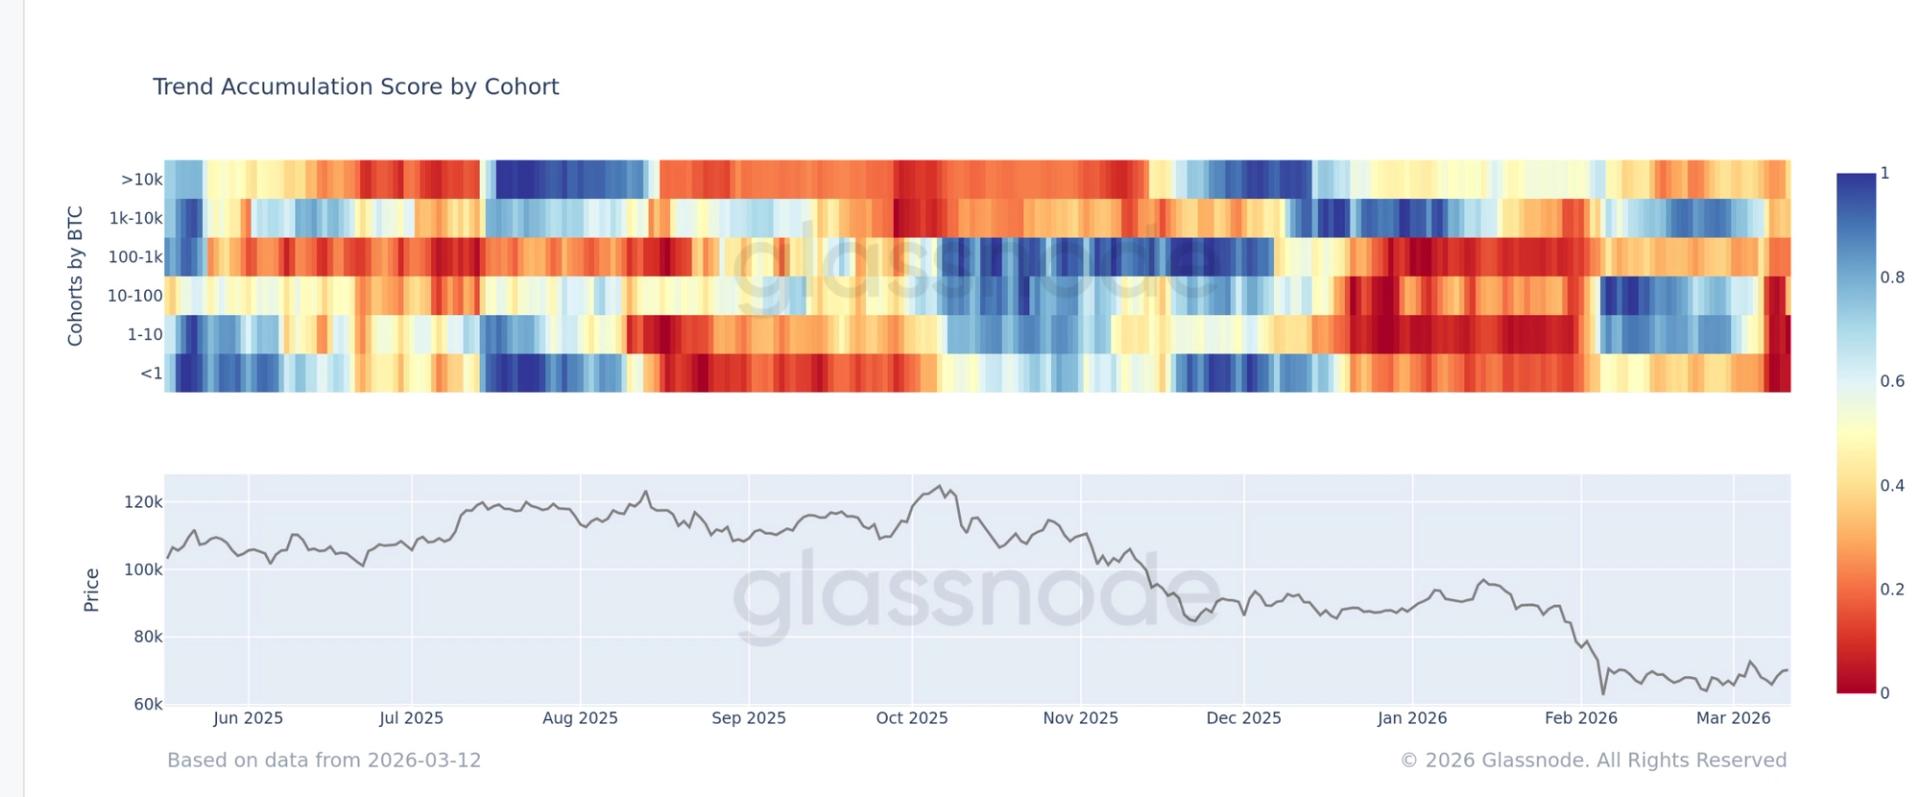

On-chain data from Glassnode shows that bitcoin holders across nearly all wallet cohorts have shifted back to aggressive selling amid persistent geopolitical tensions in the Middle East.
The distribution is being led primarily by retail investors, who appear to be the main source of selling pressure.
Glassnode’s Accumulation Trend Score, which measures whether different wallet groups are buying or selling, has dropped to around 0.04, signalling deep net distribution across the network.
The metric evaluates both the size of entities and the amount of bitcoin they have accumulated over the past 15 days.
The breakdown shows that smaller holders are leading the distribution. Wallets holding 1 to 10 BTC, typically associated with retail investors, are in heavy selling mode.
Entities holding 10 to 100 BTC are also distributing at a significant pace. Even larger participants are not immune to the trend. Wallets holding 1,000 BTC or more are also net sellers, though the intensity of their selling is less severe than that seen among smaller cohorts.
Despite the broad-based distribution, bitcoin continues to demonstrate relative resilience compared with traditional macro assets.
The U.S. dollar index has risen above 99.5, the U.S. 10-year Treasury yield has climbed to a one-month high above 4.2%, and brent crude oil is trading around $100. Typically, stronger yields, a firmer dollar and higher oil prices create significant headwinds for risk assets. Bitcoin’s ability to hold near $70,000 suggests underlying demand remains intact even as on-chain data shows investors bailing in the short term.
Bitcoin continued to trade in a small range on Wednesday as traders kept their eyes on a major resistance point near $71,400, and analysts indicate that any decisive move above the current price would mark the next significant direction for the cryptocurrency.
Bitcoin, the largest cryptocurrency, is currently trading around 70,335.18, down 2.13% over the last 24 hours, according to market data. The asset has experienced a mix of moves in recent sessions, though the trend has been short-term, reflecting a balance between buyers and sellers.
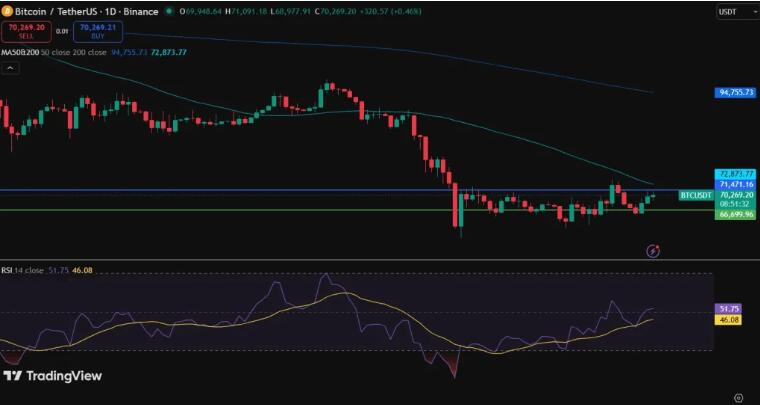
Charts Show Bitcoin Consolidating Near Key Levels
TradingView records indicate that Bitcoin is trading around $70,200 following a recovery after hitting new lows of about $66,700. The technical charts show that the cryptocurrency has been trading within a well-established channel, implying that the market has not adopted a strong direction of the bullish and bearish forces.
The indicators of momentum also indicate a neutral view. The Relative Strength Index (RSI) stands at approximately 55 which is generally referred to as a balanced market condition and not the strong upward or downward pressure.
In the meantime, the 50-day moving average of Bitcoin is located at around 71,400 and it is also an important resistance point. Analysts believe that a consistent move above the line would lead to a new wave of bullish activity, and failure to do so will most likely have the asset oscillating in its current range.
Analyst Highlights Bitcoin’s Current Consolidation Phase
Ali Martinez, a crypto market analyst, recently emphasized the Bitcoin consolidation stage in a post on the social platform X.
As of now, Bitcoin is in the range of 71,827 to 62,772. According to Martinez, it has been between this range in the past few weeks. The analyst observed that once the markets have been in a long period of consolidation, it seems to become more volatile; when price breaks above resistance or below support.
In the meantime, traders are watching resistance near $71,000–$71,400 and support around $66,000. A break above resistance could signal further gains, while a drop below support could trigger a more significant correction.
Unless these levels are decisively violated, analysts expect the market to remain range-bound as it awaits the next trigger point.

Crypto World
BTC trapped in tight range as growing open interest hints at defensive bets: Crypto Markets Today


Bitcoin traded recently around $70,100, down 0.1% since midnight UTC.
The largest cryptocurrency has been trapped in a tight trading range between $71,700 and $69,000 for the past 48 hours as volatility begins to wane despite continued conflict in the Middle East.
Oil rose back toward $100 per barrel on Thursday after a sixth ship was reportedly attacked by Iran on the Strait of Hormuz, adding to concerns about global energy supply.
The crypto market, however, remains relatively unperturbed; Hyperliquid’s HYPE token continued its ascent toward $40, adding 2.5% since midnight while MORPHO, ETHFI, and XMR all posted gains.
U.S. stock futures continued to show weakness with the Nasdaq 100 and S&P 500 index futures both losing around 0.6% overnight. The Dollar Index (DXY) moved back toward 100 after Wednesday’s CPI figures, putting a stop to any potential rate cuts.
Derivatives positioning
- Crypto futures open interest (OI) has increased by 2% to $102 billion in the past 24 hours.
- OI in bitcoin and ether rose by 2% and 4%, respectively, while annualized perpetual funding rates and cumulative volume delta (CVD) have remained flat to negative. This suggests that the recent build-up in open interest is being driven more by defensive, bearish positioning than by aggressive long-side bets.
- Decentralized exchange Hyperliquid’s HYPE token has gained 9% in 24 hours, extending the recent bull run. The rally, however, has yet to galvanize demand for leveraged bets, as evidenced by futures OI, which remains steady near multimonth lows of about 40 million HYPE.
- Activity in tether gold (XAUT) continues to cool, with futures OI slipping to 93.50 XAUT, the lowest since Feb. 28, and down notably from the March 2 high of 149.72K XAUT. This shows that gold-linked assets are slowly falling out of favor as the rally in spot gold stalls.
- Bitcoin and ether’s 30-day implied volatility indices, BVIV and EVIV, remain steady despite a renewed overnight rally in oil and a decline in U.S. stock futures.
- The steadfastness is a sign traders are not yet seeing a meaningful shift in forward-looking risk or cross‑asset contagion for major cryptocurrencies.
- On Deribit, bitcoin and ether put options, which offer protection against a market decline, continue to trade at a premium to call options. There is notable interest in the $20,000 put option, a bet that BTC’s spot price will plunge to below that level.
Token talk
- The altcoin market continues to show resilience despite a risk-off environment in global markets.
- Decentralized finance (DeFi) token SKY posted a 7.6% gain over the past 24 hours while AI-focused bittensor (TAO) is up by around 4.5%.
- One token that has failed to keep tabs with its peers has been midnight (NIGHT), the privacy token set up by Cardano founder Charles Hoskinson. NIGHT is currently trading at $0.046, having dropped 10% in the past 24 hours after Tuesday’s listing on Binance gave holders an off-ramp to sell.
- The altcoin-heavy CoinDesk 80 (CD80) Index was the best-performing benchmark over the past 24 hours, adding 2.5% while the bitcoin-heavy CoinDesk 5 (CD5) is up by only 0.9%.
- The altcoin market’s next move depends on whether bitcoin can break out of the current range with a move above $74,000, a breakout on convincing volume followed by a consolidation would lead to rotation into more speculative altcoins.

CAG Shocking report on AP Financial Situation | CM Chandrababu | RBI | YT18 News
Crowds gather as police called to ‘road rage’ incident

Lido Launches Its First Stablecoin Vault

Smart energy pays enters the US market, targeting scalable financial infrastructure

Why Israel is blocking foreign journalists from entering

Bitcoin: We’re Entering The Most Dangerous Phase
CAG Shocking report on AP Financial Situation | CM Chandrababu | RBI | YT18 News

Is She Right About What’s Happening Right Now And Crypto’s Future….. *MUST WATCH*

MASSIVE Bitcoin Buying Opportunity RIGHT NOW! Bitcoin RALLYING As Stocks CRASH!
-
Business6 days ago
Form 8K Entergy Mississippi LLC For: 6 March
-

 News Videos3 days ago
10th Algebra | Financial Planning | Question Bank Solution | Board Exam 2026
-

 Fashion6 days ago
Weekend Open Thread: Ann Taylor
-

 Crypto World3 days ago
Paradigm, a16z, Winklevoss Capital, Balaji Srinivasan among investors in ZODL
-
 Tech1 day ago
A 1,300-Pound NASA Spacecraft To Re-Enter Earth’s Atmosphere
-
 Sports7 days ago
499 runs and 34 sixes later, India beat England to enter T20 World Cup final | Cricket News
-

 Politics6 days ago
Top Mamdani aide takes progressive project to the UK
-

 Tech2 days ago
ChatGPT will now generate interactive visuals to help you with math and science concepts
-

 Business2 days ago
ExxonMobil seeks to move corporate registration from New Jersey to Texas
-

 Sports5 days ago
Three share 2-shot lead entering final round in Hong Kong
-

 Sports4 days ago
Braveheart Lakshya downs Lai in epic battle to enter All England Open final | Other Sports News
-

 NewsBeat21 hours ago
Residents reaction as Shildon murder probe enters second day
-

 NewsBeat7 days ago
Piccadilly Circus just unveiled ‘London’s newest tourist attraction’ and it only costs 80p to enter
-

 Entertainment6 days ago
Hailey Bieber Poses For Sexy Selfies In New Luscious Lip Thirst Traps
-

 Business4 days ago
Search for Nancy Guthrie Enters 37th Day as FBI Probes Wi-Fi Jammer Theory
-

 Business1 day ago
Search Enters Sixth Week With New Leads in Tucson Abduction Case
-
 NewsBeat3 days ago
Pagazzi Lighting enters administration as 70 jobs lost and 11 stores close across Scotland
-

 Tech3 days ago
Despite challenges, Ireland sixth in EU for board gender diversity
-

 Business3 days ago
Search Enters 39th Day with FBI Tip Line Developments and No Major Breakthroughs
-

 NewsBeat1 day ago
I Entered The Manosphere. Nothing Could Prepare Me For What I Found.