
Business
Sell The S&P 500 And Buy Gold Mining Stocks

style-photography/iStock via Getty Images

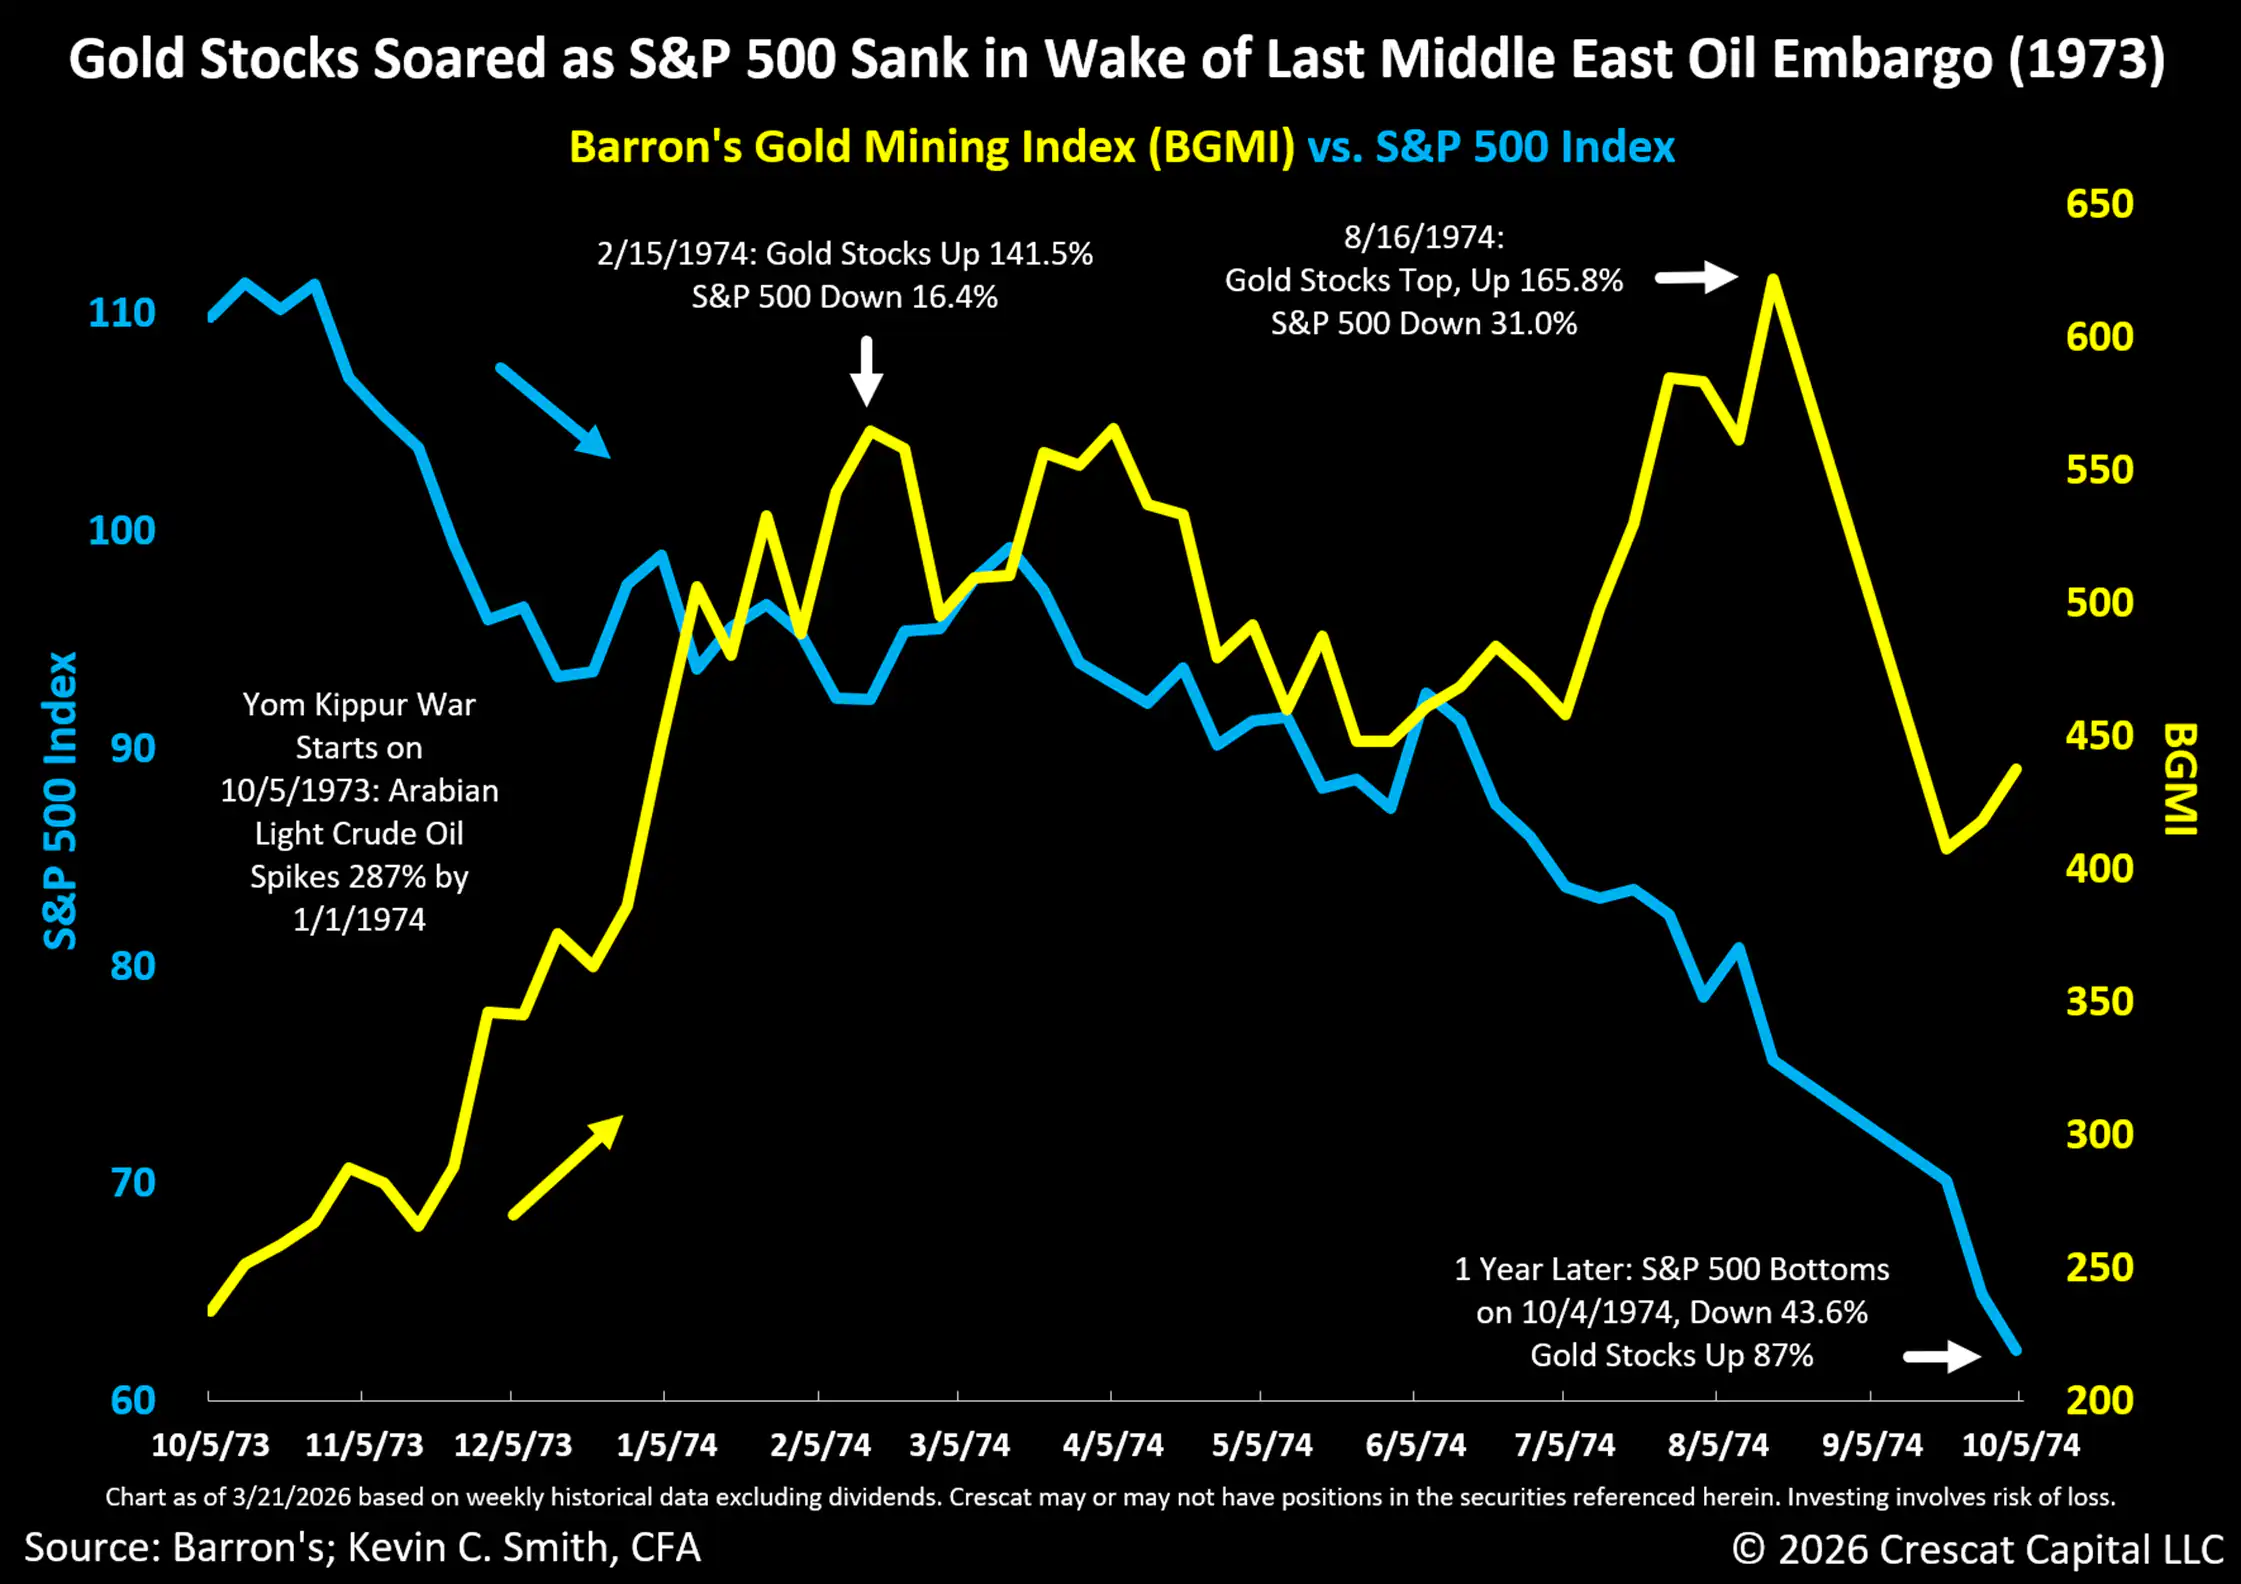
We think the recent correction in gold mining stocks presents a timely buying opportunity. For the reasons we outline in this research letter, we believe now is a great time for investors to consider selling their S&P 500 Index (SPY) funds and buying gold mining stocks. Since February 28, when Israel and the United States began a series of missile strikes against Iran, front-month West Texas Intermediate crude oil futures have risen 46.7%. On Thursday, CNBC ran the headline: “Gold and silver sell-off accelerates as inflation fears grip global markets.” It reads like an oxymoron. Normally, we would expect new inflation fears, even from an oil shock, to be a bullish catalyst for gold and mining equities. Such fears can also be a trigger for a selloff in an overvalued large cap US equity market. That was the case on both counts from the start of the 1973 Yom Kippur War and ensuing Arab Oil Embargo, as we show in the chart below.
Rising Interest Rates Send a Potentially False Signal for Gold
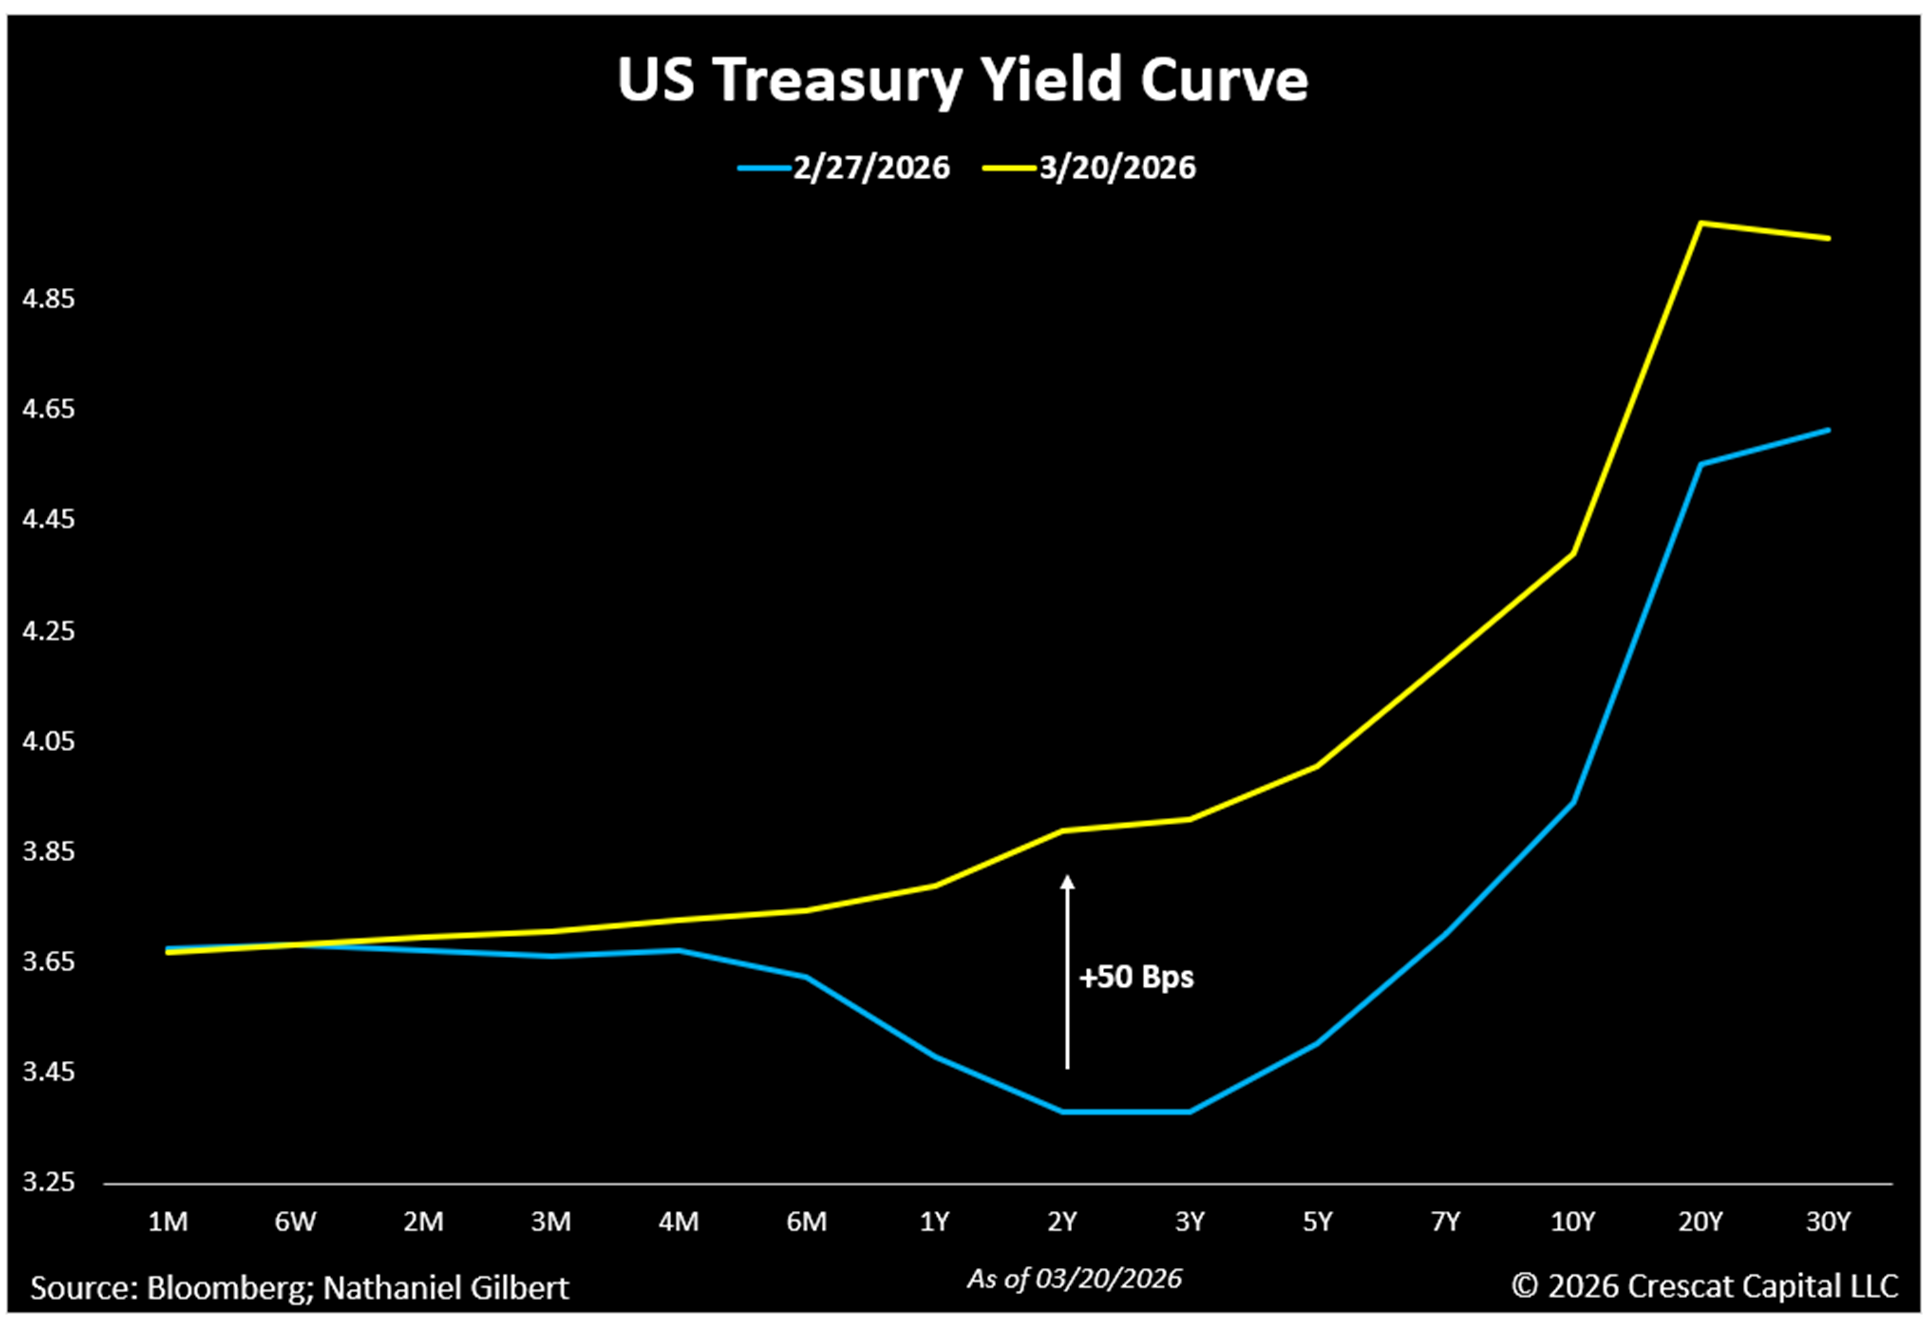
Normally, rising inflation expectations would be looked at as a glass half full for steadfast gold bulls. But it seems that gold bears and perhaps weak-handed gold investors today are seeing rising interest rate expectations as a reason to look at the gold market as a glass half empty. The overwhelming narrative today is that rising interest rates are bad for gold, but we think this is a false narrative. Indeed, with the oil spike fueling new inflationary concerns in the US, the Fed rate cuts that had been priced into the futures curve for the remainder of 2026 now appear off the table. The entire US Treasury yield curve has shifted higher over the last three weeks. The 2-year yield has risen the most, up a full 50 basis points, reversing the recent inversion at the short end of the curve.
We think today’s gold mining investors would be wise not to panic at today’s low levels of interest rates and inflation expectations, especially given the historic US debt and deficit imbalances, which in our view portend at least as high and sustained inflation rates in the decade still ahead as in the 1970s. On the fiscal deficit front, the war has already cost more than a billion dollars a day, with the first 100 hours alone costing $3.7 billion. Speaking of oxymorons, the Pentagon sent a request to the White House for more than $200 billion in supplemental war funding on March 18, and gold and silver sold off hard the next day. Earlier in the week, the US national debt quietly crossed $39 trillion, less than 5 months after hitting $38 trillion. With the current war in Iran, the thesis for precious and critical metals mining stocks has not broken; it has only gotten stronger.
Precious Metals Outpaced Rising Oil in the 1970s, Even as Interest Rates Rose
We need to look at the most comparable time in history, which in our opinion is the 1970’s decade, to see if rising interest rates are truly bad for gold or not. We think the current geopolitical climate is extremely bullish for precious metals prices, just as it was at the outset of that period. Remember, that was a stretch that included two major oil price shocks in the Middle East: the 1973 Yom Kippur War, and then later the 1979 Iranian Revolution. Inflation expectations, interest rates, and oil prices all rose substantially throughout the entire decade. Rising interest rates over this time were not a valid reason to be bearish on gold.
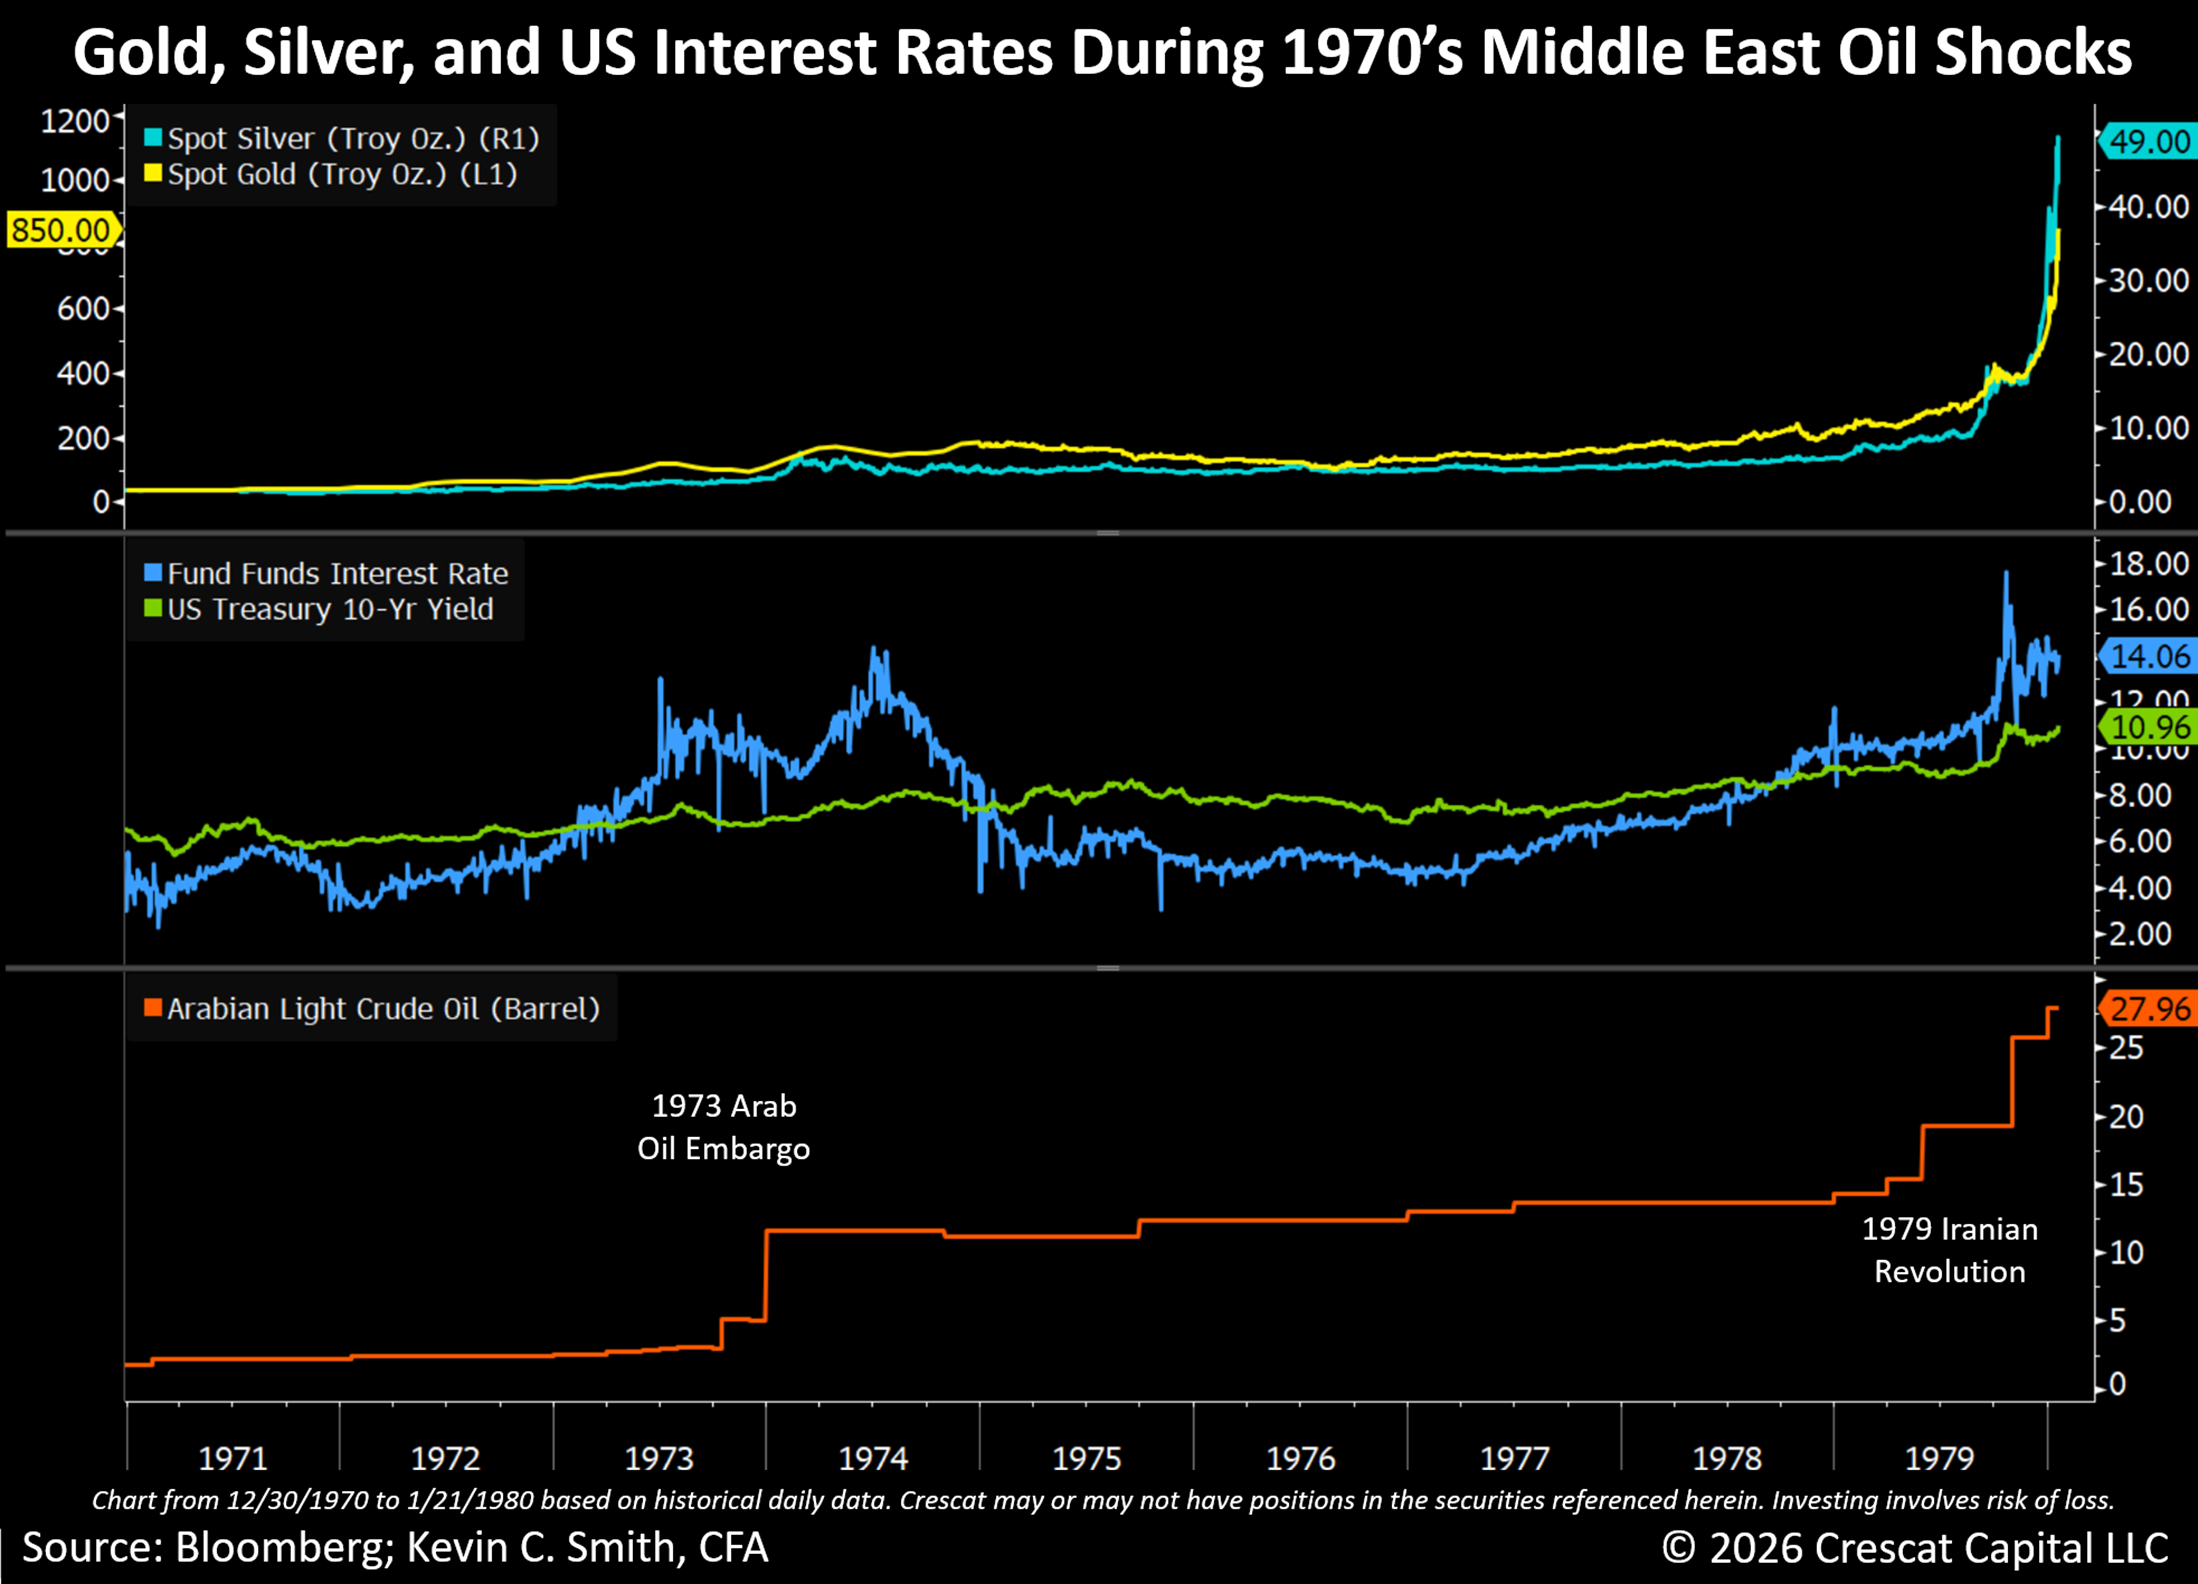
Gold rose 2,329% from US$35/oz. at the beginning of the decade to a high of US$850/oz on January 21, 1980. Silver rose even more than gold over the same time period, up 2,888% from US$1.64 to US$49.00. Oil rose substantially too, but even less than gold and silver. Arab Light Crude Oil climbed 1,553% from US$1.80/barrel to US$27.96/barrel over that time period. If gold and silver investors had feared rising interest rates from the outset, it would have caused them to miss this historic runup in the entire precious metals complex. US Fed Funds interest rate rose from 3% to over 14.1% over the entire period, reaching a high of 17.6% on 10/22/1979, three months before gold would finally top.
Rising interest rates in the 1970s did nothing to stop the trend of secular rising inflation expectations until Fed Chair Paul Volcker would later raise the Fed Funds rate all the way to 22.4% on 7/22/1981, creating a double-dip recession that finally broke both inflation and gold’s back. In our opinion, today’s meager 3.6% Fed Funds rate and 4.4% 10-year US Treasury yield are well poised to ignite a new inflationary era, not to quash one, even if the Fed were to allow rates to rise.
Gold Mining Stocks Crushed the S&P 500 Index in the 1970s
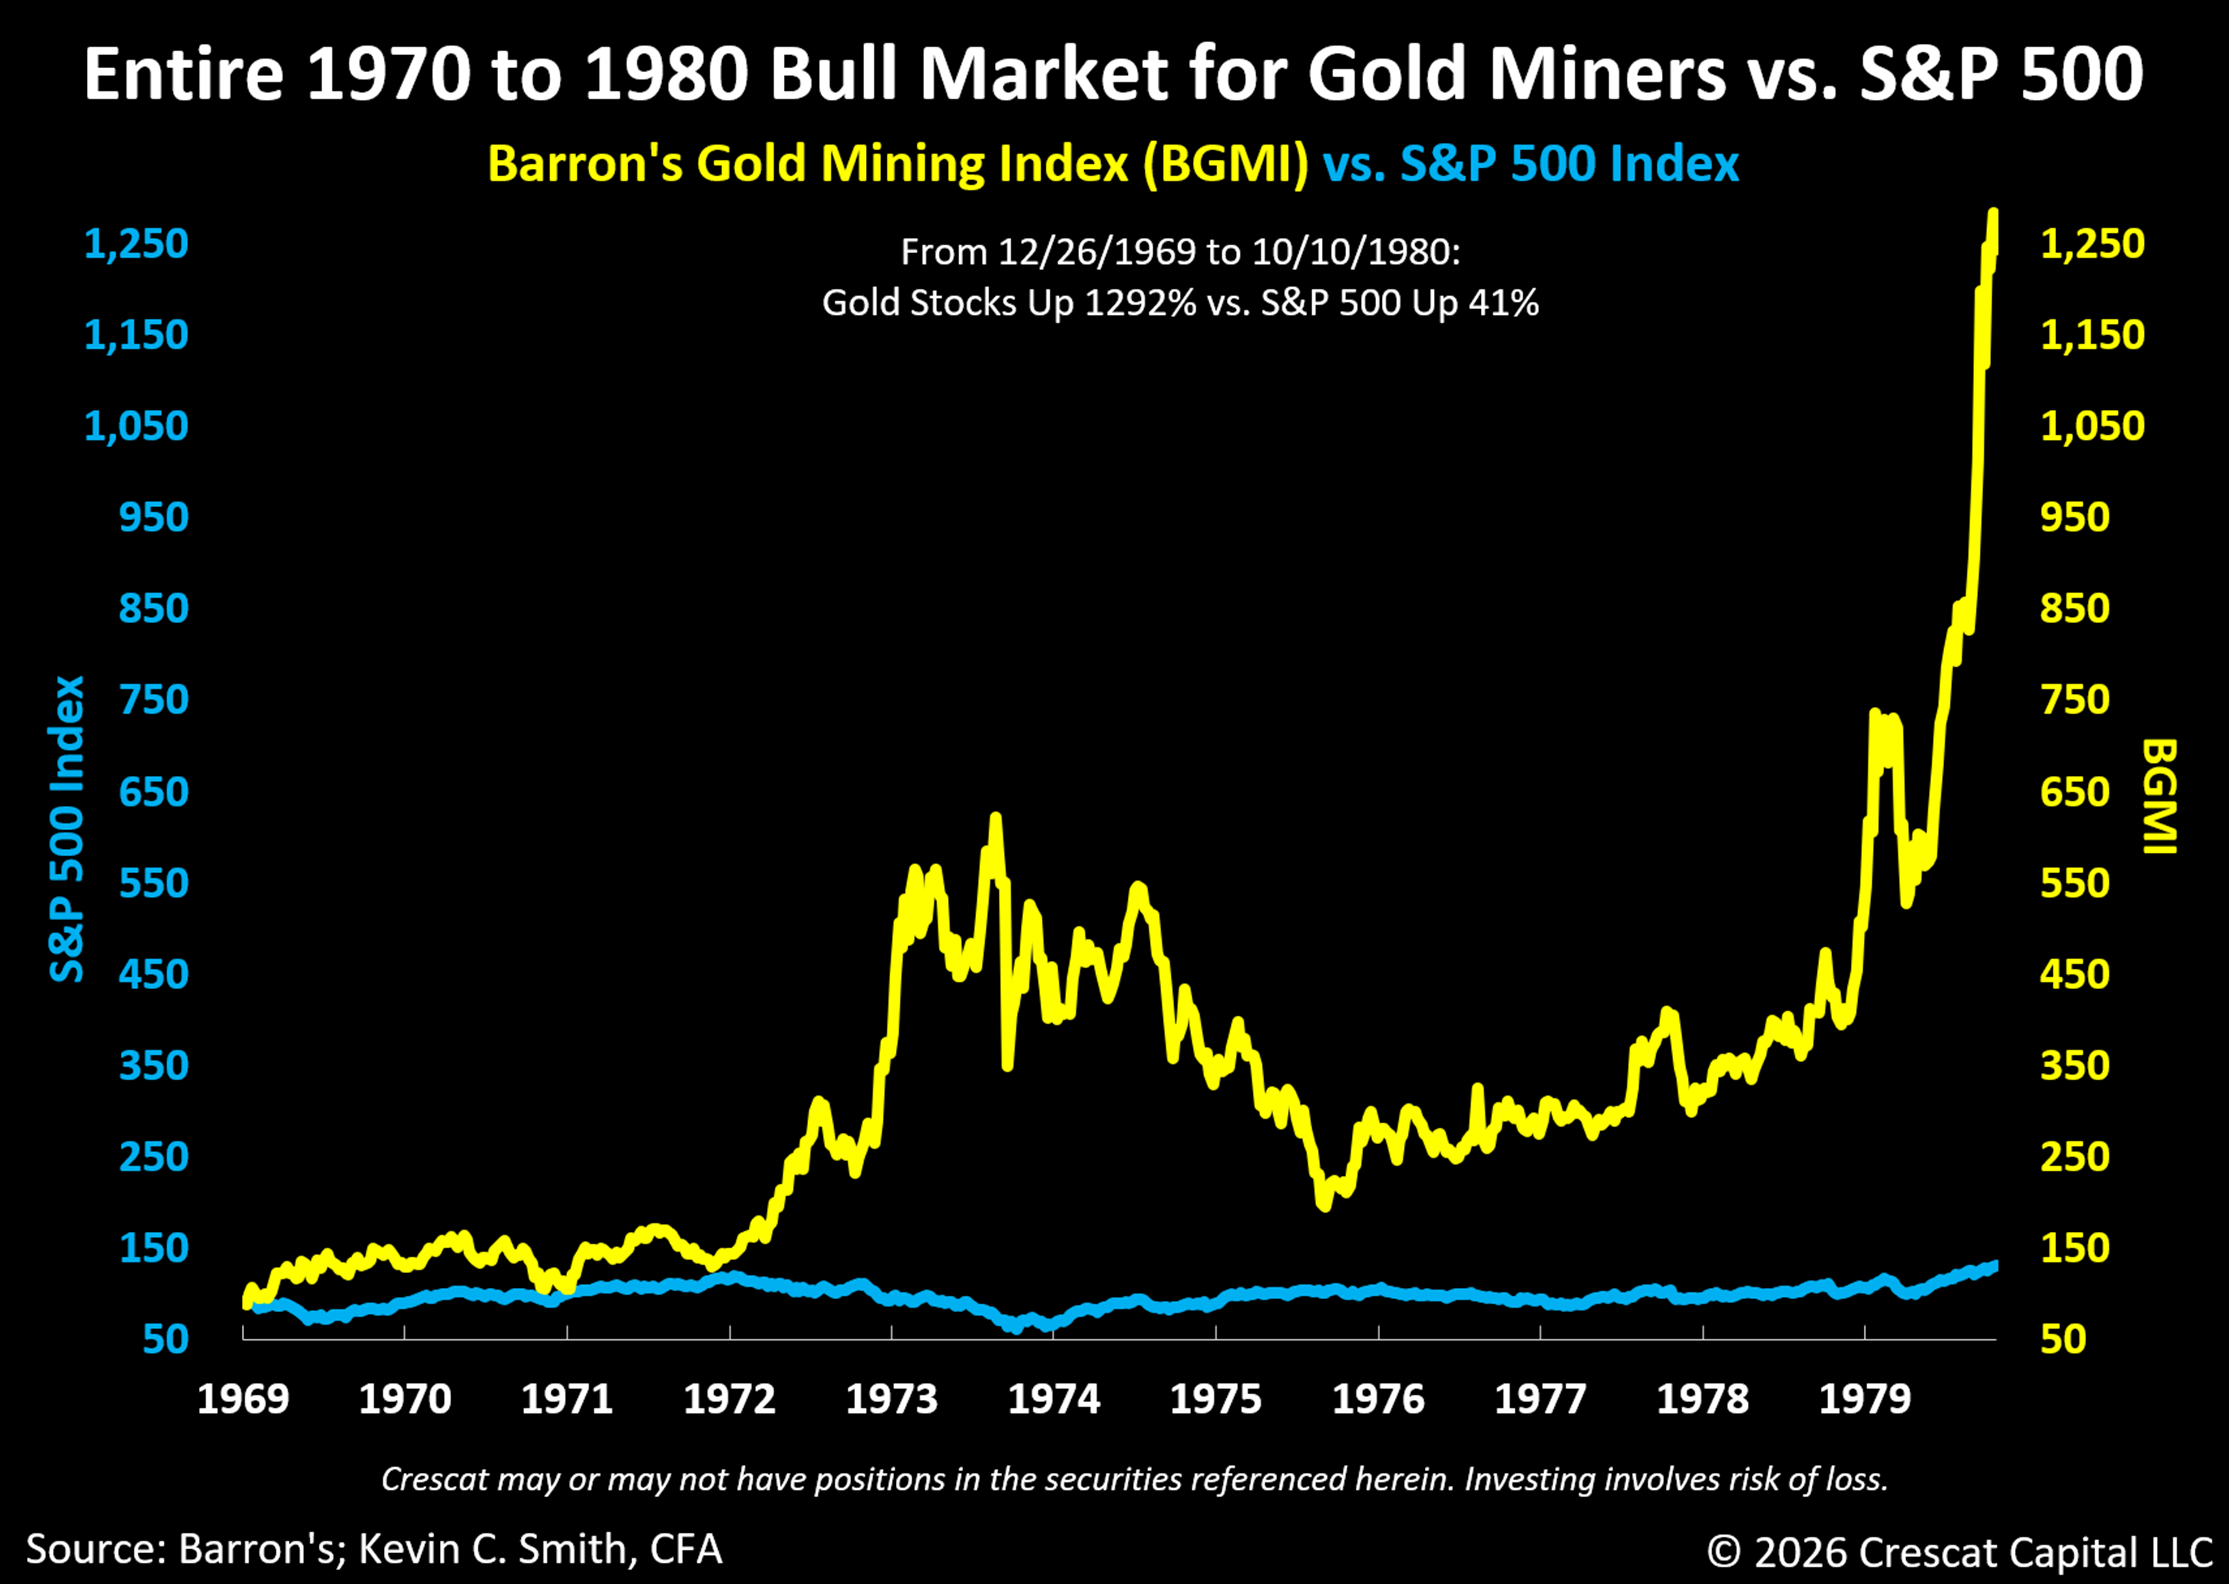
Gold mining equities did extremely well over the 1970s decade, especially compared to the S&P 500 Index. The Barron’s Gold Mining Index rose 1,292% from its low on 12/26/1969 to its high on October 17, 1980, based on weekly data from Barron’s. The S&P 500 was up a mere 41% over that long stretch. Starting from today’s high Shiller CAPE ratios for the S&P 500, forward-10-year returns for the S&P 500 should be similarly low in comparison to that decade. On the other hand, starting from today’s low valuations for countercyclical mining stocks, and given the favorable macro supply-and-demand backdrop for metals, we think the forward 10-year returns for the miners should be similarly high compared to that decade.
Yes, there is volatility in mining stocks, but the rewards in the right macro environment can be well worth it. We prefer mining stocks relative to owning outright gold and silver today because, in our valuation models, the equities are ultra-cheap relative to the metal prices, especially in our highly curated activist metals portfolio, the largest thematic exposure across all five Crescat funds. Furthermore, our portfolio is heavily tilted toward the exploration companies that control some of the world’s most attractive new gold, silver, and copper discoveries. These are the types of companies that the major miners will need to buy at a significant premium to current market prices to replace their dwindling reserves after a long trend of underinvestment in exploration spending and capital investment over the last 14 years.
At the same time, it takes about 15 years on average to advance a mining project from discovery to production. The world needs more metals now for AI datacenters, electrification, new US manufacturing onshoring, and defense, but the pipeline of new economic discoveries and viable development projects is scarce. These are the primary reasons we believe the cycle has strong legs for an entire decade ahead and this is why we favor the small cap explorers at this stage of the cycle. These companies carry risk and should be held in a professionally managed diversified portfolio, such as through our funds, but offer significantly more upside than the large-cap mining indices and ETFs in our view.
Technical Support for Gold Stocks; Resistance for the S&P 500
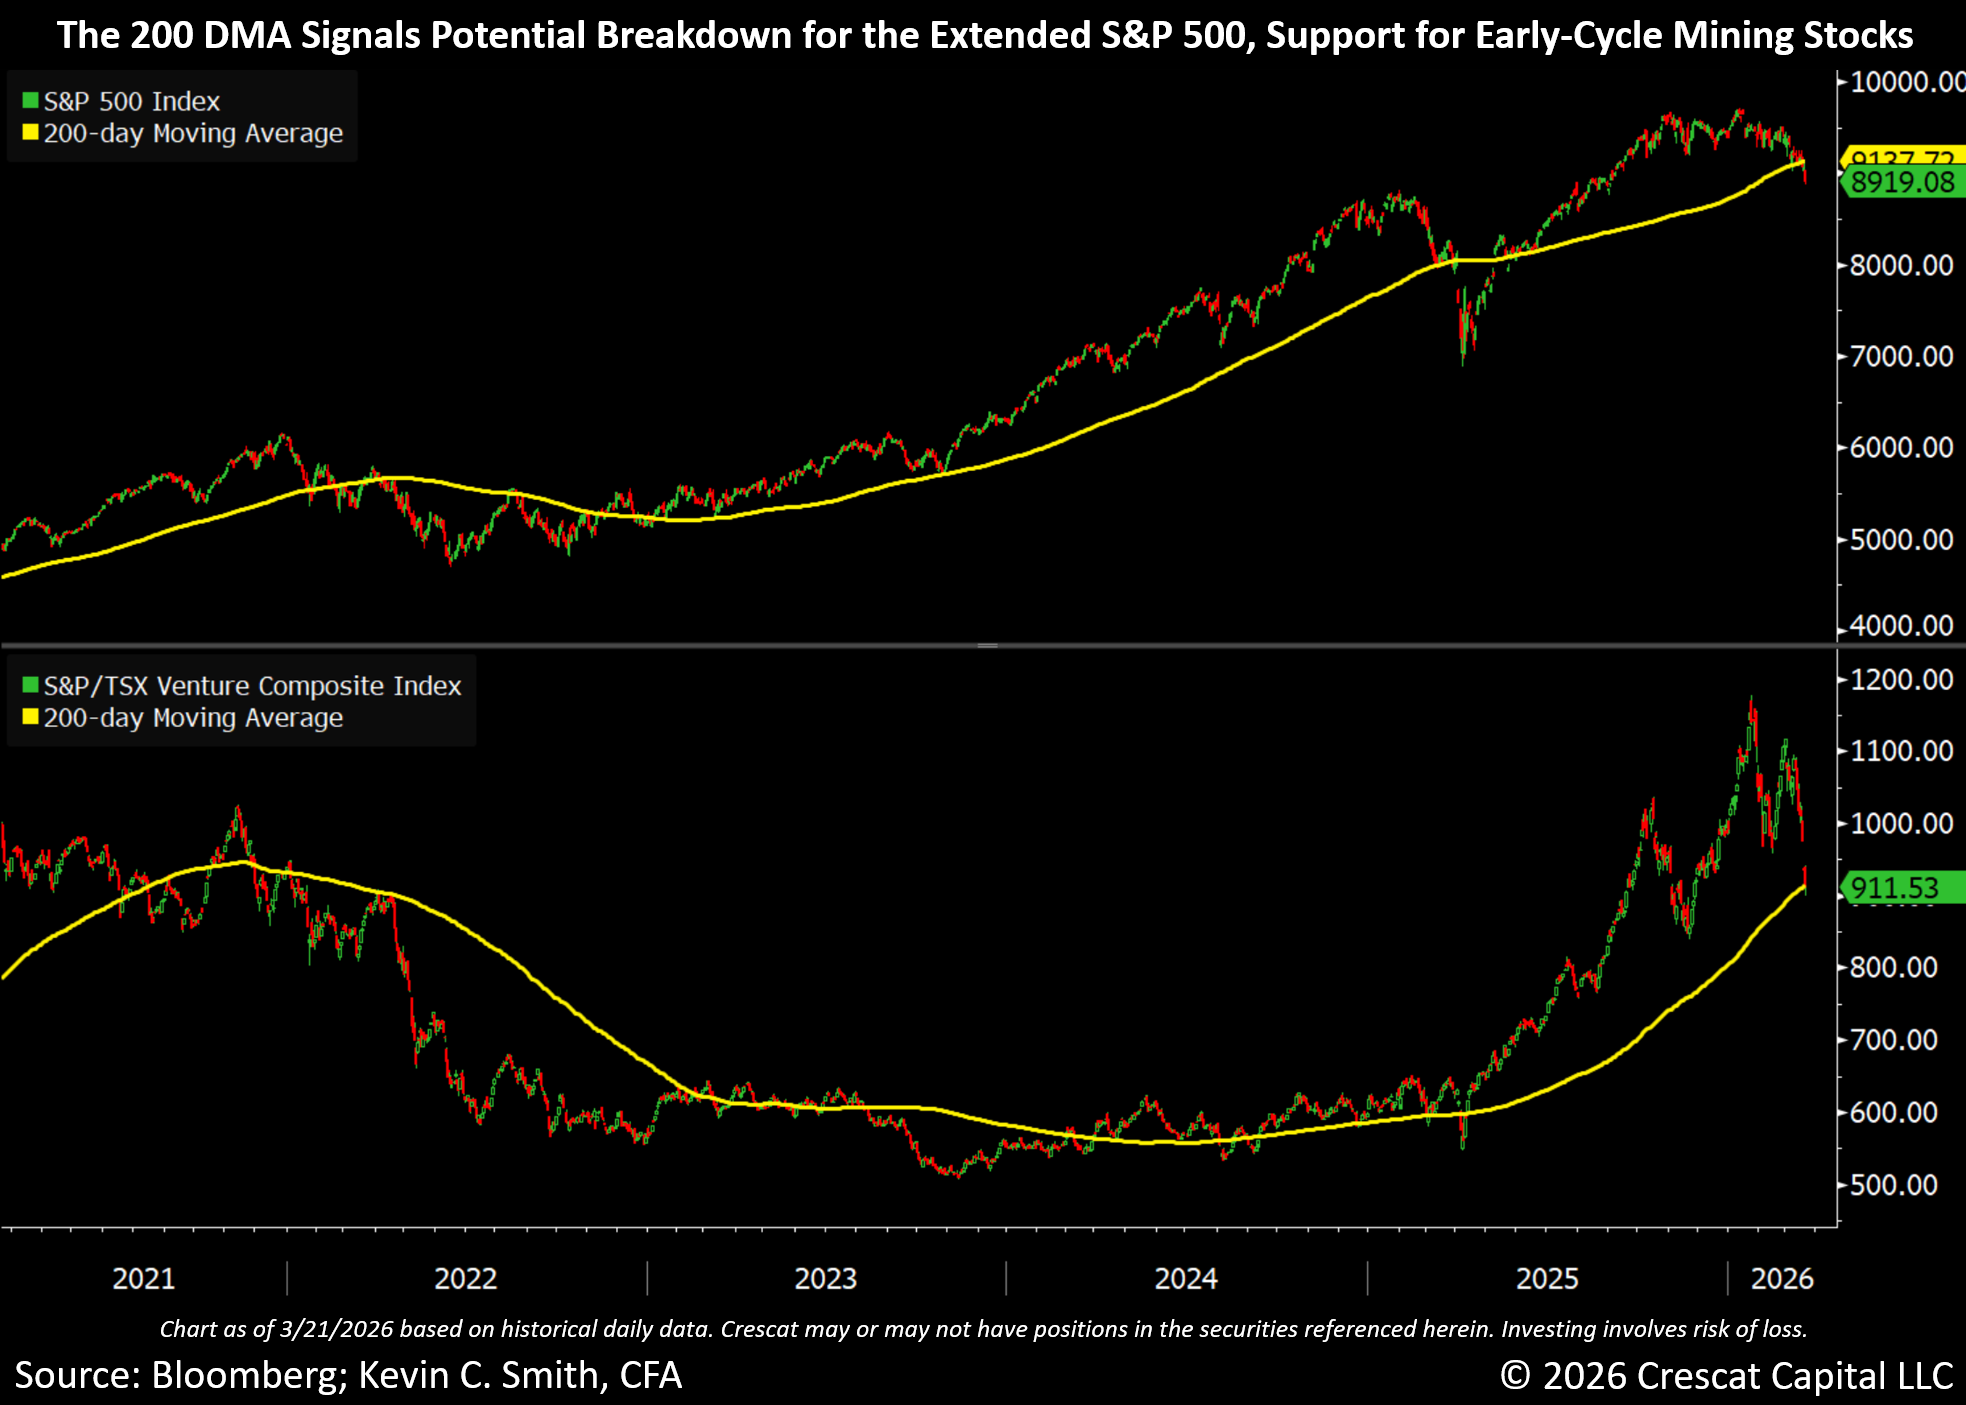
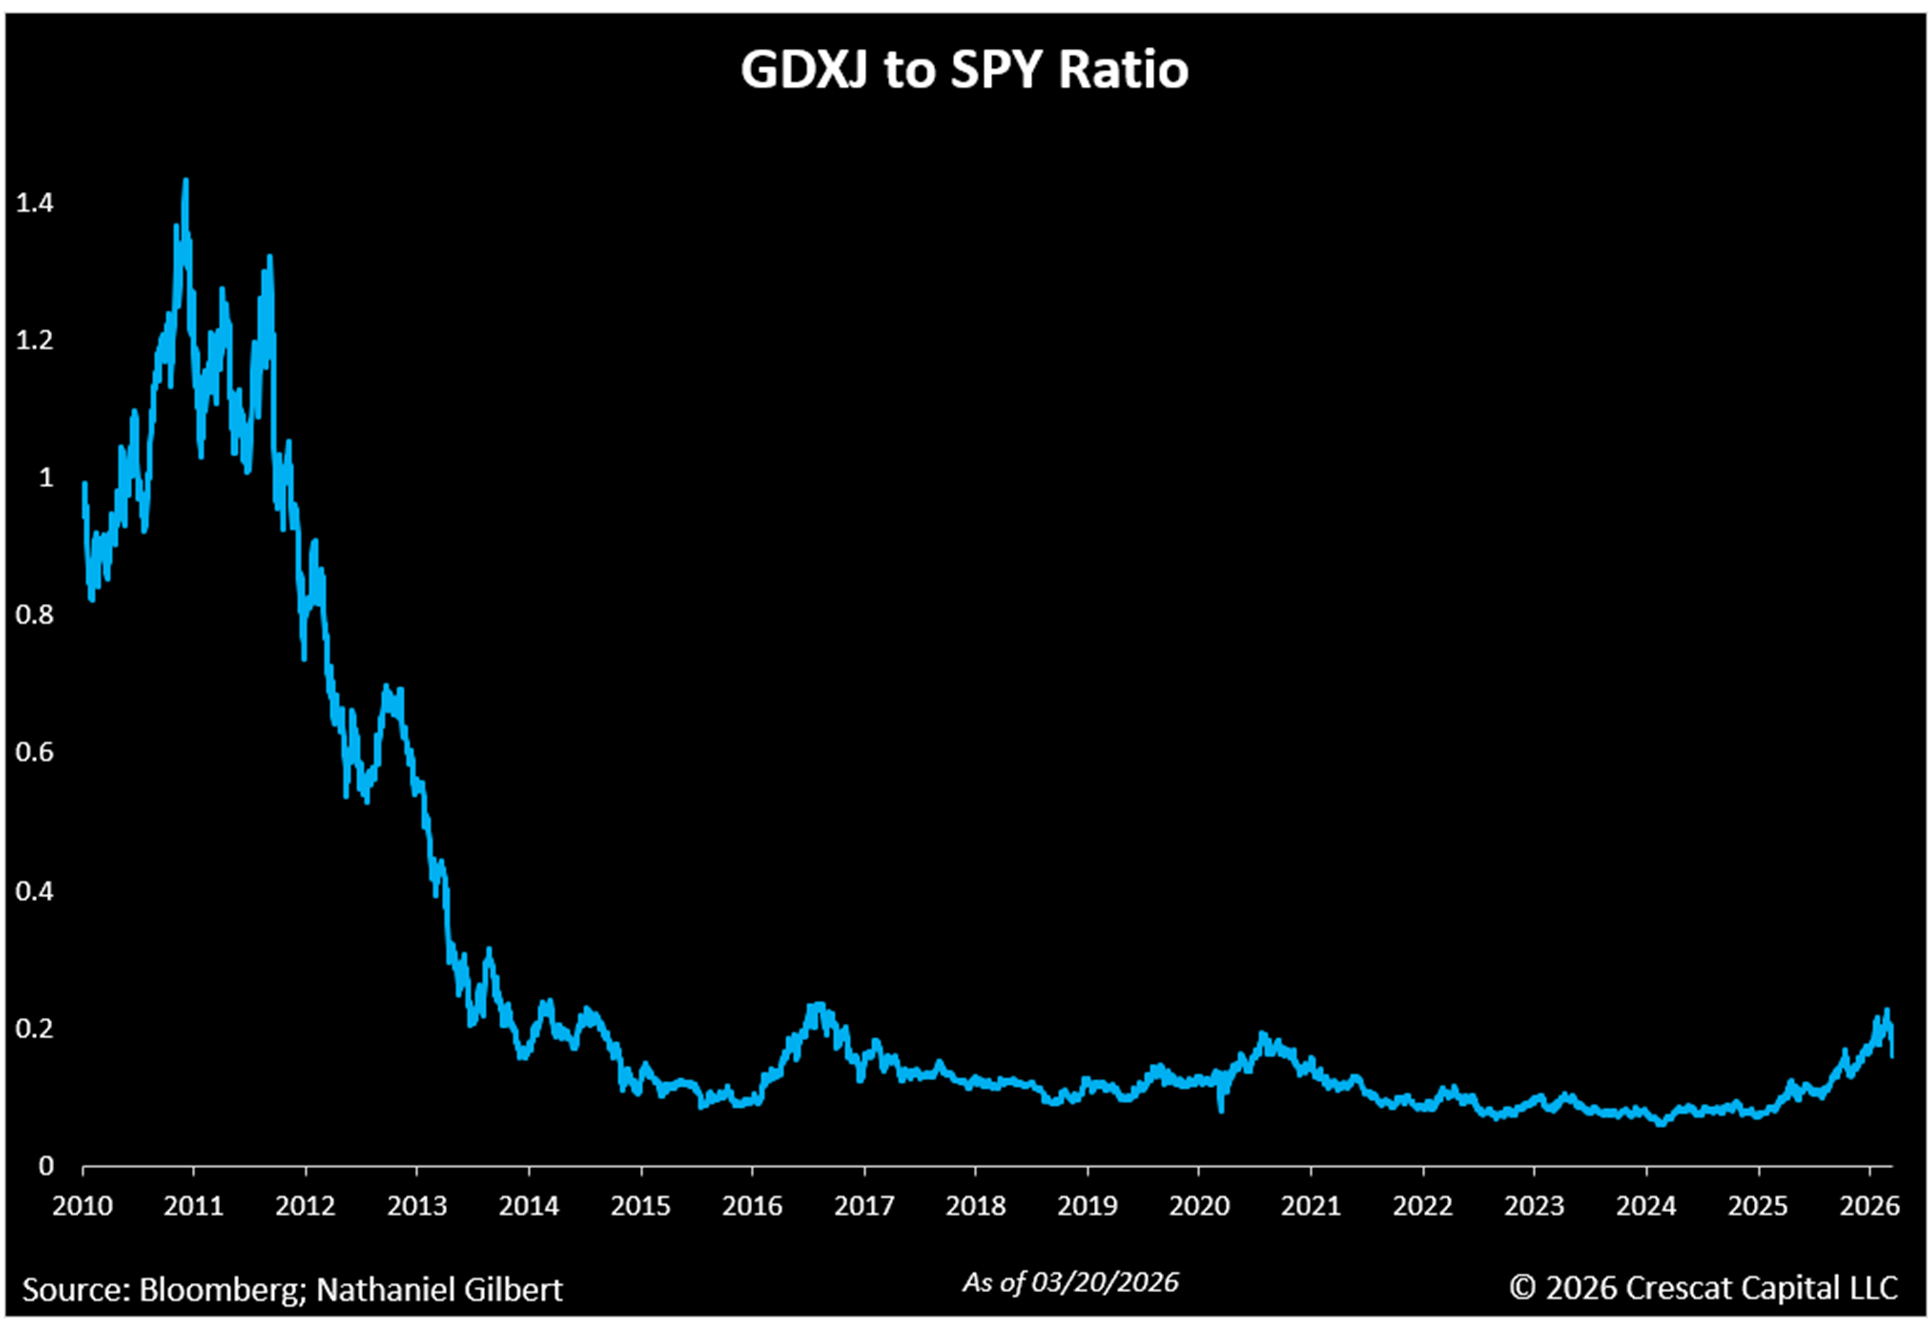
The large cap S&P 500 and Nasdaq 100 (QQQ) indices finally appear to be just starting to break down from record valuations, as we would expect with the new geopolitical conflict and resulting likely inflation and higher interest rates, but gold, silver, and mining stocks have sold off significantly more than these indices since Israel and the US first struck Iran on February 28. We think that presents an incredible short-term buying opportunity for the undervalued and still uncrowded mining stocks, especially the premier small cap explorers that we favor in our portfolios. Meanwhile, we see the long-slowing momentum, and now breakdown from the 200-day moving as a potential sell trigger for late-cycle, overcrowded, and overvalued US large cap equity indices and megacap tech stocks.
Interestingly, both mining stocks and the large cap indices are near their critical 200-day moving average support and resistance levels, but the two groups have highly divergent valuation and growth profiles. The indices of the high-growth, undervalued mining stocks are deeply oversold and hover at or above their 200-day moving average. The S&P/TSX Venture Composite Index, a proxy for small cap exploration focused miners, has already come down 23% from its January 23 recent high and could find strong support. It is now right on the 200-day moving average. The small cap exploration focused miners where Crescat is tilted have been outperforming the larger cap producing miners in the current pullback. From February 27 through March 20, the large cap VanEck Gold Miners ETF (GDX) (GDX) has declined 31%, while the VanEck Junior Gold Miners ETF (GDXJ) (GDXJ), a mid-tier producer index, is down 33%. Both of these ETFs hover just above the 200-day moving average now.
The S&P 500 and Nasdaq 100, however, look like they have just critically broken the 200-day moving averages. Yet, the S&P 500 is down only 6.8% from its recent January 28 high. In our view, it has substantially further downside ahead to get to reasonable valuations based on market history. The broad US large cap indices could finally be poised to break down hard from historically high fundamental valuations, which, in our analysis, are comparable to those at prior major market tops in 1929 and 2000.
Both the GDX and GDXJ ETFs have 14-day Relative Strength Index (“RSI”) readings below 30, a level typically associated with oversold conditions suggestive of a potential for a near-term rebound. Note, the last two times GDXJ 14-day RSI was sub 30 in March 2023 & October 23, there was a 34.6% and a 27.9% rally, respectively, within just two months. For an industry that just led the entire stock market in 2025, such a sharp rebound would not surprise us at all.

Although pullbacks can be painful and unsettling in the moment, they often create some of the most attractive opportunities for disciplined investors. When it comes to mining stocks today, these aphorisms apply:
“Buy when there’s blood in the streets, even if the blood is your own.” – Baron Rothschild
“The time of maximum pessimism is the best time to buy.” – Sir John Templeton
“Be fearful when others are greedy and greedy only when others are fearful.” – Warren Buffett
Oil Price Future Less Clear than Gold
Importantly, mining equities have come under pressure not only from the decline in underlying precious metals prices, but also from growing concerns around operating-cost inflation, particularly the risk that a sustained rise in oil prices could compress margins across the sector, especially among the producers who have been enjoying strong margins.
We have shown that higher oil prices do not mean that metal prices cannot go even higher. At this stage, however, the ultimate effect of recent geopolitical developments on the long-term path of oil prices remains unclear. The US is the largest oil-producing country in the world today and is now a net exporter, unlike in the 1970s when it was dependent on Middle East oil. Although the market has understandably responded to the risk of higher energy costs, it is too early to conclude whether the current move in crude reflects a lasting shift in fundamentals or a shorter-term geopolitical premium. To provide perspective, the table below illustrates the inflation-adjusted percentage change in crude oil prices following the onset of past major Middle East conflicts over various time horizons.
Still Early Innings in a New Secular Bull Market for Mining Stocks

We launched our precious metals fund in 2020 and began allocating heavily to exploration mining companies at that time because we believed the sector was entering the early innings of a major multi-year bull cycle. That view was, and continues to be, driven by our conviction that the industry faces deep structural supply shortages. At the same time, a macro backdrop characterized by inflationary pressures and unsustainable sovereign debt burdens has set the stage for a gold super cycle. More than a decade of underinvestment in mining has created a favorable supply and demand imbalance for metal prices at a time when the world needs more metals than ever. This argues for strong growth ahead for the mining industry revenues, earnings, and new investment dollars poised to pour into the industry for exploration and mine development. Meanwhile, investors’ love affair with big technology stocks and apprehension toward mining still leaves the crucial mining industry with valuations that are ultra depressed. Such is a formula for much higher stock prices for precious and critical metals miners in the years ahead, in our view.
Crescat Performance and Call to Action
For our existing investors, we want to first thank you for your continued trust and support. In January of this year, we heard from a number of you who wished you had added at the end of 2024. This pullback is that moment again. The same macro environment that rewarded your conviction in 2025 has not reversed, it has deepened. We believe this is the time to consider an additional allocation. And for those who are comfortable where they are, staying put with a thesis this intact is equally the right call.
For those who stayed on the sidelines feeling that 2025 was too strong a year to come in after, this is your opportunity to get positioned. The 2025 performance was significant, but the case for precious metals and mining equities was never a one-year story. The pullback has reset prices without resetting the thesis. We believe this is a cleaner setup than most investors get and an opportunity to be positioned ahead of the next leg. April 1 is the date to get positioned.
*See important disclosures below. Past performance does not guarantee future results. Investing involves risk, including risk of loss.
Sincerely,
Kevin C. Smith, CFA, Founder & CEO
Nathaniel Gilbert, Analyst
References
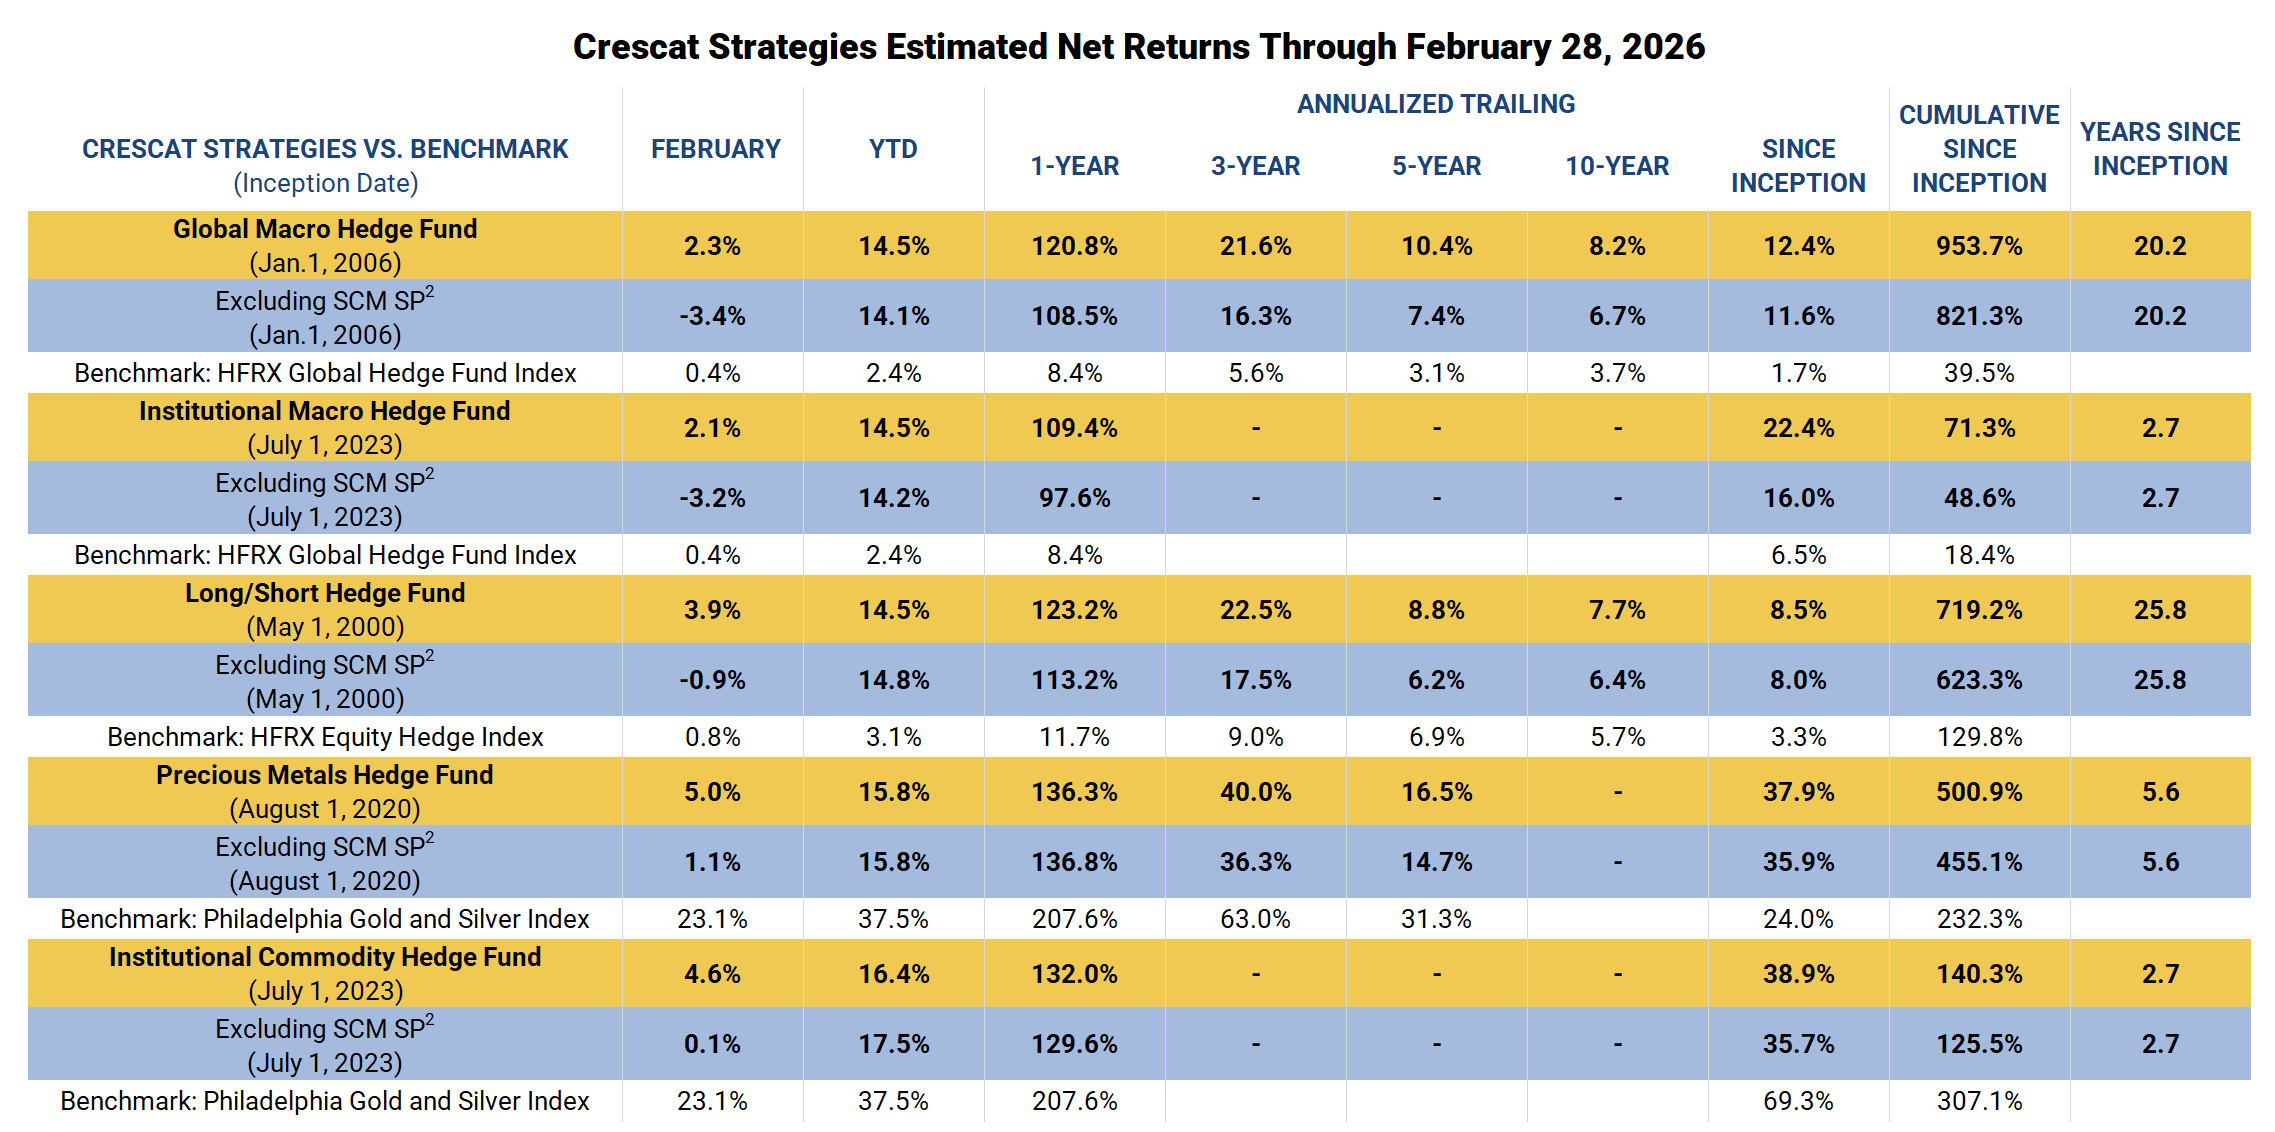
- 1 – Net returns reflect the performance of an investor who invested from inception and is eligible to participate in new issues and side pocket investments. Net returns reflect the reinvestment of dividends and earnings and the deduction of all expenses and fees (including the highest management fee and incentive allocation charged, where applicable). An actual client’s results may vary due to the timing of capital transactions, high watermarks, and performance.
- 2 – Performance figures presented Excluding SCM SP represent the fund’s net returns calculated without the impact of the San Cristobal Mining, Inc. side pocket that was designated on July 1st, 2024. The side pocket includes a private equity asset that is not available to new investors in the funds on or after July 1, 2024. Excluding these assets provides a clearer view of the performance to investors coming into the funds after that date. New investors cannot participate in the SCM Side Pocket and will not share in its potential gains or losses. Investors should consider both the overall performance and the performance excluding the side pocket when evaluating the fund’s returns.
Editor’s Note: The summary bullets for this article were chosen by Seeking Alpha editors.


The concert was attended by an estimated 104,000 fans, much lower than the expected 260,000.

ETIG has identified 10 stocks offering dividend yields of 4% or more based on FY25 payouts: Vedanta (6.3% yield), Coal India (5.7%), REC (5.4%), Hindustan Zinc (5.3%), GAIL (5.1%), ITC (4.8%), ONGC (4.6%), RITES (4.5%), NMDC (4.2%), and Oracle Financial Services Software (4.1%).
The select list of cos includes Vedanta, Coal India, Hindustan Zinc, ITC and GAIL
A caveat for investors looking at dividend yields – the current yields are based on the past year’s dividend payouts. While companies do strive to maintain a stable dividend payout relative to net profit on a longer horizon, fluctuations due to government policies, economic and geopolitical uncertainties cannot be ruled out especially when such aberrations tend to affect profitability. For instance, ITC’s stock currently trades near the 52-week low amid a sharp rise in tobacco excise duties since February 1, which has affected investor sentiment. While the company continued to declare an interim dividend of ₹6.5 on January 29, same as in the previous year, future payout will depend upon how well it can protect profitability amid a higher excise duty regime.
In addition, effective yields will vary depending on investors’ marginal tax rates, as dividends are taxed in shareholders’ hands. For instance, a taxpayer facing a marginal tax rate of 30% and 4% educational cess will receive an effective dividend yield which will be over two-third of the calculated yield. For such a taxpayer, Vedanta’s effective dividend yield will be around 4.3%.
Also, the list does not include companies such as TCS, HCL Technologies, and UTI AMC, where yields are high due to special dividends. To be sure, companies operating in the sectors with high cash generation such as the IT sector tend to distribute special dividends more often than others.


Northern Trust Asset Management is a global investment manager that helps investors navigate changing market environments in efforts to realize their long-term objectives.
Entrusted with $1.2 trillion in assets under management as of March 31, 2024, we understand that investing ultimately serves a greater purpose and believe investors should be compensated for the risks they take — in all market environments and any investment strategy. That’s why we combine robust capital markets research, expert portfolio construction and comprehensive risk management in an effort to craft innovative and efficient solutions that seek to deliver targeted investment outcomes.
As engaged contributors to our communities, we consider it a great privilege to serve our investors and our communities with integrity, respect and transparency.
Northern Trust Asset Management is composed of Northern Trust Investments, Inc., Northern Trust Global Investments Limited, Northern Trust Fund Managers (Ireland) Limited, Northern Trust Global Investments Japan, K.K., NT Global Advisors, Inc., 50 South Capital Advisors, LLC, Northern Trust Asset Management Australia Pty Ltd, and investment personnel of The Northern Trust Company of Hong Kong Limited and The Northern Trust Company. Note: This account is not managed or monitored by Northern Trust Asset Management, and any messages sent via Seeking Alpha will not receive a response. For inquiries or communication, please use Northern Trust Asset Management’s official channels.

A deal is expected to be signed and announced as early as next week, they said, requesting anonymity as the discussions are private.
The proposed acquisition comprises a retail loan and deposit book of about Rs 27,000 crore. This includes personal and home loans, MSME lending, retail deposits and wealth management assets.
The wealth management business is estimated at around Rs 7,000 crore, while the bulk of the portfolio is driven by retail and MSME loans. Emails sent to both Kotak Bank and Deutsche Bank remained unanswered until press time Sunday. The net value of assets over liabilities in the portfolio of Deutsche Bank’s India unit is around Rs 4,300 crore.
A Niche Presence
Kotak is expected to pay a slight premium to this, translating into a consideration of about Rs 4,500 crore, after outbidding Federal Bank, which had also been in contention, people cited above said. Final numbers for the deal may be subject to adjustments at closing, they added. Deutsche Bank’s India unit, with a network of about 17 branches, has built a niche presence among affluent clients.
Its retail segment generated a revenue of Rs 2,455 crore in the year ended March 2025, up 4% from Rs 2,362 crore in FY24. Its retail banking business held total assets of Rs 25,038 crore as of March 2025, according to latest disclosures.For Kotak, the acquisition would deepen its retail franchise, adding scale in loans and deposits while strengthening its presence in the MSME segment and wealth management. The deal would help Kotak accelerate growth in the high-net-worth segment while increasing its share in prime urban retail lending.
Global Overhaul
For Deutsche Bank, the divestment aligns with its strategy to wind down retail operations in India as part of a global overhaul under CEO Christian Sewing focused on boosting profitability and prioritising core businesses. Kotak recently clarified that it did not submit a financial bid for IDBI Bank, despite market speculation. The lender’s approach to acquisitions has been focused on strategic fit, valuation and integration feasibility.
“We evaluate every transaction in the market through three clear lenses,” Ashok Vaswani, managing director and CEO of Kotak Mahindra Bank, had said in an investor call in January. “First is strategic fit — does the opportunity add to our franchise? If it doesn’t, we don’t pursue it further. Second is valuation — whether the deal is value-accretive for the firm? For us, scale is about relevance, not just size. The question is whether it strengthens us strategically and financially. If it meets both criteria, we get interested.”
Integration
The third lens is integration and what it will take to successfully absorb and execute on the acquisition, he had said. India’s banking sector has witnessed a wave of strategic deals and consolidation since Axis Bank’s acquisition of Citibank’s consumer business in 2022 for around Rs 11,600 crore, which included credit cards, retail banking, wealth management and consumer loans, along with the transfer of about 3,200 employees. Kotak Mahindra had earlier acquired Rs 3,330-crore personal loan portfolio from Standard Chartered. Deutsche Bank sold its credit card book to IndusInd in 2011.
More recently, global investors have increased their exposure to India with Japan’s MUFG acquiring a 20% stake in Shriram Finance for $4.4 billion in the largest cross-border financial sector investment, while Emirates NBD agreed to buy a 60% stake in RBL Bank for $3 billion and SMBC picked up a 20% stake in Yes Bank for $1.6 billion and later increased it by another 4.99% stake.

Edited excerpts from a chat:
After 1.5 years of no returns, how attractive is the market looking now?
Over the last 18 months, the market has largely gone through a phase of consolidation rather than wealth destruction. This period has helped correct some of the excess valuations that had built up earlier, particularly in pockets of the broader market. From a long-term perspective, such phases are healthy because they allow earnings to catch up with prices. As we look ahead, corporate earnings in India remain structurally strong, supported by improving balance sheets, a revival in capex, and domestic consumption. Therefore, while near-term volatility may continue, the market today appears far more balanced than it did a year ago, which improves the risk-reward for long-term investors.As per Bloomberg data, Nifty 50 earnings over the last five quarters demonstrate significant volatility rather than a consistent trend. After steady growth through Q4 FY25 and Q1 FY26, earnings experienced sharp swings—a dramatic +27.6% surge in Q3 FY26 followed by an equally severe -24.8% decline in Q4 FY26. This volatility reflects sectoral divergence: commodity sectors (oil & gas, metals) drove growth, while financials remained weak with compressed margins. The underlying earnings quality appears fragile, with consensus expectations being downgraded amid strained topline growth and narrowing margins across India Inc.
Amid global macro uncertainty, how is The Wealth Company Mutual Fund positioning its equity portfolios to navigate this environment while maintaining long-term return potential?
At The Wealth Company Mutual Fund, our investment philosophy is anchored in a combination of top-down and bottom-up stock selection, with a strong emphasis on earnings visibility, balance sheet quality, and good governance. Given global uncertainties ranging from geopolitical developments to interest rate cycles we are focusing on businesses that demonstrate resilient cash flows, scalable growth models, and prudent capital allocation. Our portfolios maintain a diversified approach across sectors and market capitalisations that are likely to benefit from India’s structural growth story, along with some tactical investment opportunities during these volatile times. The idea is to remain invested in companies that can compound earnings over multiple years rather than attempting to time short-term macro cycles.
What is your take on small cap stocks? Are they attractive now? Is valuation still a concern?
Small caps have witnessed significant interest over the past few years, and as seen many times before, valuations in certain pockets had moved ahead of fundamentals. However, the recent correction and consolidation have helped bring valuations closer to long-term averages in several segments. It is important to remember that the small-cap universe is extremely diverse. The decline has not been uniform across stocks, as they have varied strengths and growth potential, many of which are now available at better valuations. For long-term investors, small caps continue to offer an opportunity to participate early in the growth journey of emerging companies, provided investments are made with a disciplined, research-driven approach and a sufficiently long-term horizon.Which sectors of the market do you think are in a sweet spot of reasonable valuations and high growth as we step into FY27?
As we move into FY27, we see interesting opportunities across sectors aligned with India’s structural economic drivers. Areas such as manufacturing and industrials particularly those benefiting from the capex cycle and supply chain diversification remain attractive. We also see opportunities in select financial services, capital markets, tech-enabled businesses, niche consumption themes, and export-oriented businesses gaining global market share. Within the broader market, several emerging companies in these segments fall within the small- and mid-cap space, reinforcing our belief that bottom-up stock picking can generate meaningful long-term alpha.
If you had to prepare a portfolio afresh at this stage for an investor with moderate risk appetite and risk horizon of 4–5 years, how would you split it between gold and silver, equity and debt?
For an investor with a moderate risk appetite and a 4–5-year horizon, diversification remains essential. A balanced allocation could look something like 65–70% in equities, 15–20% in debt, and 10–15% in precious metals dominated by gold as a hedge against macro uncertainty. Within the equity allocation, investors should ideally have exposure across large caps for stability and small and midcaps for growth potential. This combination helps balance volatility while still allowing participation in India’s long-term growth opportunity.
What would be your advice to investors who entered small cap funds recently but are either sitting with no returns or at a loss?
We understand the concerns investors are experiencing. Small caps are inherently more volatile in the short term but have historically been rewarding over longer horizons. Periods of muted returns or temporary drawdowns are not unusual. If the investment horizon remains long term, it is generally advisable to stay invested rather than react to short-term market movements. In fact, systematic investing during corrections often improves long-term outcomes. The key is patience and allowing underlying business earnings to play out over time.
What is your take on IT stocks? Are the valuations too attractive now or the AI doomsday scenario is for real?
The IT sector has been undergoing a period of recalibration due to global economic uncertainties and prolonged decision-making cycles for discretionary spending. As a result, valuations in several companies have corrected from earlier highs. While the near-term outlook depends on global demand conditions, the long-term structural drivers remain intact. Technologies such as AI, cloud, and digital transformation are likely to expand the opportunity set rather than diminish it. Selective opportunities exist, and many companies are adapting their business models to capture emerging trends.
Broadly, what is your outlook of the market for FY27?
India continues to stand out as one of the most compelling long-term growth stories globally, supported by favourable demographics, policy continuity, and an ongoing investment cycle. While markets may see intermittent volatility due to global developments, the underlying earnings trajectory of Indian corporates remains encouraging. From a medium- to long-term perspective, we remain constructive on equities especially within the broader market, where emerging companies are well-positioned to benefit from India’s economic expansion. For disciplined, patient investors, FY27 could present meaningful opportunities to build long-term wealth.

Micron: Buy The Latest Blowout

Calamos Investments is a diversified global investment firm offering innovative investment strategies including U.S. growth equity, global equity, convertible, multi-asset and alternatives. The firm offers strategies through separately managed portfolios, mutual funds, closed-end funds, private funds, an exchange traded fund and UCITS funds. Clients include major corporations, pension funds, endowments, foundations and individuals, as well as the financial advisors and consultants who serve them. Headquartered in the Chicago metropolitan area, the firm also has offices in London, New York and San Francisco. For more information, please visit www.calamos.com.
Microsoft released an emergency out-of-band update for Windows 11 on March 21, 2026, to resolve widespread sign-in problems affecting Microsoft accounts in apps and services following the March 10 Patch Tuesday security release.

The update, KB5085516 (OS Builds 26200.8039 for version 25H2 and 26100.8039 for version 24H2), is cumulative and includes all fixes from the original March security update along with the specific resolution for the authentication bug. It applies to all editions of Windows 11 versions 25H2 and 24H2 that receive standard Windows updates.
Microsoft announced the issue March 20 via its Windows Release Health dashboard, stating that after installing the March 2026 security update (KB5079473), some users could not sign in to Microsoft apps and services using their Microsoft accounts. Affected applications include Teams, OneDrive, Microsoft Edge, Excel, Word, Microsoft 365 Copilot and others requiring account authentication.
Impacted devices displayed error messages indicating no internet connection, even when connected, disrupting features dependent on Microsoft account sign-in. The problem stemmed from the March cumulative update, which addressed 84 vulnerabilities across Windows and related products but introduced this unintended side effect.
The out-of-band fix, released just 11 days after Patch Tuesday, ensures rapid deployment without waiting for the next monthly cycle. Microsoft emphasized that no action is required for devices not experiencing the issue or those already updated via automatic processes. The company recommends immediate installation for affected users to restore full functionality.
This marks the latest in a series of emergency patches for Windows 11 in 2026. Earlier in the year, out-of-band updates addressed shutdown failures, Remote Desktop sign-in problems and Outlook hangs triggered by prior patches. The March incident highlights ongoing challenges in balancing comprehensive security fixes with stability in cumulative updates.
The March Patch Tuesday (March 10) fixed 84 vulnerabilities, including critical flaws in Windows components, Office, SQL Server, Azure and .NET. Two were publicly disclosed zero-days, underscoring the urgency of the release. Windows 11 versions 25H2 and 24H2 received KB5079473, advancing builds to 26200.8037 and 26100.8037, while version 23H2 got KB5078883 (Build 22631.6783).
An earlier out-of-band hotpatch (KB5084597, March 13) targeted enterprise devices in the hotpatch program using Routing and Remote Access Service (RRAS). It fixed three critical remote code execution vulnerabilities (CVE-2026-25172, CVE-2026-25173, CVE-2026-26111) that could allow attackers to execute arbitrary code remotely. The hotpatch, requiring no restart, applied only to hotpatch-enabled Windows 11 24H2, 25H2 and Enterprise LTSC 2024 devices managed via Windows Autopatch.
Microsoft clarified the RRAS hotpatch addressed a scenario where standard Patch Tuesday fixes did not fully cover hotpatched enterprise environments. Standard users were protected by the March cumulative update.
The latest sign-in fix arrives amid broader Windows 11 enhancements in 2026, including new emojis, taskbar improvements, camera controls and productivity features in March updates. Version 26H1, scoped for new devices with advanced silicon, received its March security update (KB5079466, Build 28000.1719) focusing on performance and battery life.
Users can check for the emergency update via Settings > Windows Update > Check for updates. Microsoft advises restarting after installation if prompted. Enterprise admins should monitor Windows Autopatch or WSUS for rollout.
The incident drew attention on forums like Reddit’s r/sysadmin, where IT professionals discussed impacts on Microsoft 365 ecosystems. Some reported temporary workarounds like using local accounts, but Microsoft urged against them due to lost features.
As Windows 11 evolves toward version 26H1 and beyond, Microsoft continues refining update processes to minimize disruptions. The company maintains no known exploitation of the sign-in bug in the wild, but prompt patching remains critical to prevent potential chained attacks.
For the latest status, users should visit the Windows Message Center or support.microsoft.com. Microsoft has not announced further out-of-band updates as of March 23, 2026, but monitoring continues for any emerging issues.

ATCO Australia has secured naming rights of the WAFLW competition over the next three seasons, with an option to extend for an additional two seasons.

This is the forum for daily political discussion on Seeking Alpha. A new version is published every market day.
Please don’t leave political comments on other articles or posts on the site.
The comments below are not regulated with the same rigor as the rest of the site, and this is an ‘enter at your own risk’ area as discussion can get very heated. If you can’t stand the heat… you know what they say…
More on Today’s Markets:
“If Iran doesn’t FULLY OPEN, WITHOUT THREAT, the Strait of Hormuz, within 48 HOURS from this exact point in time, the United States of America will hit and obliterate their various POWER PLANTS, STARTING WITH THE BIGGEST ONE FIRST!” Trump wrote on Truth Social.
“For reasons of decency, I have chosen NOT to wipe out the Oil Infrastructure on the Island,” Trump wrote, but “should Iran, or anyone else, do anything to interfere with the Free and Safe Passage of Ships through the Strait of Hormuz, I will immediately reconsider this decision.”
Kalshi contracts point to a more gradual reopening timeline. Markets imply roughly a 39% probability that traffic normalizes by May 15, rising to about 53% by June 1 and 59% by July 1, indicating expectations that disruptions could persist into the second quarter.
“If the Radical Left Democrats don’t immediately sign an agreement to let our Country, in particular our Airports, be FREE and SAFE again, I will move our brilliant and patriotic ICE Agents to
One of the Greatest 5-Part Fantasy Shows of the 2000s Is Still Amazing 18 Years Later

XRP- Whitehouse & Senators Strike A Deal On The Clarity Act? Yes – DTCC + Ripple= Everyone

BTS agency shares drop after comeback show turnout falls short


-

 Fashion2 days ago
Weekend Open Thread: Adidas – Corporette.com
-

 Politics2 days ago
Jenni Murray, Long-Serving Woman’s Hour Presenter, Dies Aged 75
-
 Tech5 days ago
Are Split Spacebars the Next Big Gaming Keyboard Trend?
-
 Crypto World2 days ago
NIO (NIO) Stock Plunges 6.5% as Shelf Registration Sparks Dilution Worries
-

 Crypto World1 day ago
Best Crypto to Buy Now: Strategy Just Spent $1.57 Billion on Bitcoin During Fear While Early Investors Quietly Enter Pepeto for 150x Potential
-

 News Videos4 days ago
RBA board divided on rate cut, unusually buoyant share market | Finance Report | ABC NEWS
-

 Crypto World1 day ago
Bitcoin Price News: Bhutan Sells $72 Million in BTC Under Fiscal Pressure, but the Smart Money Entering Pepeto Sees What the Market Does Not
-

 Business7 days ago
Australian shares drop as Iran war enters third week
-

 Crypto World7 days ago
Crypto Lender BlockFills Enters Chapter 11 with Up to $500M in Liabilities
-

 Politics5 days ago
The House | The new register to protect children from their abusers shows Parliament at its best
-

 Fashion7 days ago
25 Celebrities with Curly Hair That Are Naturally Beautiful
-

 Tech3 days ago
inKONBINI Lets You Spend Summer Days Behind the Register
-
 Politics6 days ago
Real-time pollution monitoring calls after boy nearly dies
-

 Crypto World4 days ago
Canada’s FINTRAC revokes registrations of 23 crypto MSBs in AML crackdown
-
 NewsBeat4 days ago
Residents in North Lanarkshire reminded to register to vote in Scottish Parliament Election
-

 Business7 days ago
Meta planning major layoffs as AI spending and automation reshape workforce
-

 News Videos5 days ago
PARLIAMENT OF MALAWI – PAC MEETING WITH REGISTRAR OF FINANCIAL ON AMARYLLIS HOTEL – INQUIRY LIVE
-

 Business13 hours ago
No Winner in March 21 Drawing as Prize Rolls to $133 Million for Next
-
Entertainment7 days ago
Oscars reunite Rob Reiner supergroup of 17 stars for emotional tribute: Here's who appeared on stage
-

 Business4 days ago
Who Was Alex Pretti? 5 Key Facts About the ICU Nurse Killed by Federal Agents in Minneapolis
You must be logged in to post a comment Login