

Crypto World
But the $3 Billion Liquidation Risk Hasn’t Gone Away

Key Takeaways
- Bitcoin briefly surged to $71,200 after President Trump announced a five-day pause on strikes against Iran, pulling it further from the critical $65,000 liquidation zone.
- Over $400 million in crypto positions were liquidated within hours as markets swung sharply on conflicting headlines between Washington and Tehran.
- With BTC now hovering around $70,000, the $3 billion in long positions clustered below $65,000 remains a live threat as geopolitical uncertainty persists.
Bitcoin caught a brief but significant boost on Monday after U.S. President Donald Trump announced a five-day pause on military strikes targeting Iran’s energy infrastructure, describing the move as the result of “very good and productive” talks aimed at a complete resolution of hostilities. The announcement sent Bitcoin surging from $67,500 to above $71,200 within hours, temporarily widening the distance between BTC’s price and a critical $65,000 liquidation zone.
The move followed a weekend of geopolitical threats and a subsequent de-escalation, with broader asset classes and benchmark indices reacting together. For Bitcoin bulls sitting on leveraged positions, the rally offered a moment of relief.
Relief, Then Reversal
The rally did not hold. Iran’s Foreign Ministry denied any communication had taken place with the United States, framing the five-day suspension as a retreat rather than diplomacy. Bitcoin, shown at $70,464 in one snapshot, retreated to levels seen in early February after multiple failed attempts to convincingly surpass $75,000. The $400 million in liquidations indicates positions were both sizable and tightly clustered around optimistic breakouts toward $75,000. Bitcoin settled back around $70,000, although still above $65,000, but not a comfortable price level. Investors also weighed the potential impact on other risk assets.
The $3 Billion Risk Remains
Before Monday’s geopolitical headlines, Coinglass data had already flagged a dangerous build-up of over $3 billion in long positions concentrated below the $65,000 level across Binance, OKX, and Bybit. That exposure has not disappeared. Bitcoin has traded between $70,533 and $64,700 since early February, forming a tight range. Heavy liquidation clusters remain around $70,500 on the upside and $65,000 on the downside.
Analysts describe such concentrations as “liquidation magnets,” that is, price levels where a large volume of forced closures can compound selling pressure once breached. The October 10 event, which saw $19 billion wiped from the crypto market in a single day, followed a near-identical pattern of heavy leveraged build-up before a key level broke.
What Comes Next
As traders watch whether Bitcoin can reclaim $70,000 and fill the CME gap, one open question persists: will current liquidity and geopolitical developments allow BTC to return to breakout attempts near $75,000, or has this episode reset expectations for a lower, more volatile trading band?
For now, the Trump ceasefire announcement has bought the market some breathing room. But with Iran denying any talks and a break above $70,000 still needed to signal renewed bullish momentum toward $75,000.
🚨 ALERT: Over $3 billion in long positions risk liquidation if $BTC drops below $65,000. pic.twitter.com/EaiPNwDt1E


Crypto analyst Michaël van de Poppe posted on X on May 11 that altcoins are beginning to break out to the upside, running one to three weeks behind Bitcoin’s move.
If that lag holds, Van de Poppe says altcoins could deliver gains of 100-300%, depending on momentum and available liquidity.
Altcoins Are Starting to Move
Van de Poppe has been one of the more closely followed voices in crypto through this cycle, and his reasoning is fairly straightforward: Bitcoin moves first, altcoins tend to follow with a delay, and when they do move, the percentage gains are usually far larger.
“If Bitcoin went up 40% from the lows, altcoins can do 100-300% depending on the momentum and the amount of liquidity in the books. We’re in that stage,” he wrote.
That framing got some support from trader Mark Chadwick, who posted that altcoins are “flashing the strongest signals we’ve seen in years.” He pointed to a breakout of a major falling wedge pattern and described last week’s candles as the biggest breakout moves in a long time.
“This is exactly how major alt runs begin,” he wrote, adding that the setup looks even stronger when you factor in the broader backdrop: expanding liquidity, the Russell 2000 hitting all-time highs, and the Digital Asset Market Clarity Act of 2025 edging closer to passage.
That last point matters because the Senate Banking Committee is scheduled to meet on May 14 to consider the crypto market structure bill, putting it back on the calendar after previous postponements.
The White House is also pushing Congress for faster action, and if institutional money starts flowing into crypto under a clearer regulatory framework, Chadwick argued, “this market could move on an entirely different scale.”
Van de Poppe also updated everyone about his own altcoin portfolio. He has put in a total of $160,000 in the portfolio, which is currently worth about $78,000, down by about 50% from the time he bought in but still up from an earlier drop of 75%.
He plans to add another $40,000 in four monthly tranches through September 1, then stop. The reason for that is that he believes the market has likely bottomed and wants to focus on compounding returns rather than putting in more fresh capital.
The Broader Market Is Starting to Cooperate
Van de Poppe’s comments have coincided with a broader improvement in crypto markets.
While Bitcoin was trading at around $81,000 at the time of writing, having been relatively quiet in the last 24 hours and gaining just 0.1%, per CoinGecko, the altcoin picture was more interesting, with several mid-cap tokens posting large gains during the weekend.
As CryptoPotato reported, ONDO and JUP rose more than 20% in a single day, with NEAR, ARB, and ICP also moving higher.
On the other hand, Ethereum is holding near $2,300, even though it dropped about 2.4% in the last 24 hours, while XRP was trading at around $1.45 after earlier rising to a three-week high of $1.50. Meanwhile, their top 10 counterpart, Solana, climbed 11% on the week to around $95.
The post Analyst Predicts Massive Altcoin Rally After Bitcoin Run appeared first on CryptoPotato.

Privacy proponents have criticized Google’s latest updates to its reCAPTCHA system, arguing it has effectively “locked out” millions of websites from Android users running privacy–focused operating systems.
Google-owned reCAPTCHA is used to verify whether a user is a person, usually by asking them to click on images of a bus or a fire hydrant.
Google announced “Cloud Fraud Defense” in late April, branding it “the next evolution of reCAPTCHA.”The latest update now presents users with a QR code to verify their humanity, but requires Google Play Services or the Apple equivalent to be running on the device, which isn’t present on “de-Googled” Android phones, such as those running GrapheneOS or CalyxOS.
“They’re directly participating in locking out competition via their own services,” said the GrapheneOS team on Sunday, referring to the increasing use of Apple’s App Attest and Google’s Play Integrity.
“Requiring people to have an Apple device or Google-certified Android device is anti-competition, not security.”
Privacy advocates often use de-Googled mobile operating systems to prevent data harvesting by Google software and have more freedom over what can be installed on their devices.
Backlash as changes impact privacy-focused users
“Privacy-conscious internet users are being demoted from 2nd to 3rd class netizens,” said Bitcoin security researcher and cypherpunk Jameson Lopp on Sunday.
“Google now treats privacy as suspicious behavior by default,” cybersecurity outlet International Cyber Digest said.
The CEO and co-founder of the privacy-focused Brave browser, Brendan Eich, said services shouldn’t ban people from using arbitrary hardware and operating systems in the first place.
“Google’s security excuse is clearly bogus when they permit devices with no patches for ten years… It’s for enforcing their monopolies via GMS licensing, that’s all.”

Source: Jameson Lopp
Desktop browsers initially targeted
To complete mobile verification, one must use a compatible mobile device that includes Google Play Services version 25.41.30 or greater or iOS version 15.0 or greater, states Google on its website.
The team at GrapheneOS explained that the move would impact Microsoft Windows or other operating systems not certified by Google or Apple. The prompt is primarily going to be shown on desktop platforms, but could be expanded, it said.
“Their plan requires having a certified Android device or iOS device to pass this on a desktop,” they added.
Related: Google Chrome’s 4GB AI model shows why browser trust matters for crypto security
“Control over reCAPTCHA puts Google in a position where they can require having either iOS or a certified Android device to use an enormous amount of the web.”
Google engineers spearheaded a controversial proposal in 2023
Google attempted something similar in 2023 with a system called “Web Environment Integrity (WEI),” which would have let the company decide which devices were “real enough” to access the web, wrote International Cyber Digest.
“Standards bodies and the public pushed back hard, and Google killed it. Three years later, the same idea is back, just hidden behind a QR code instead of a browser feature,” they added.
Magazine: Strategy reveals why they would sell BTC, Trump Media posts loss: Hodler’s Digest
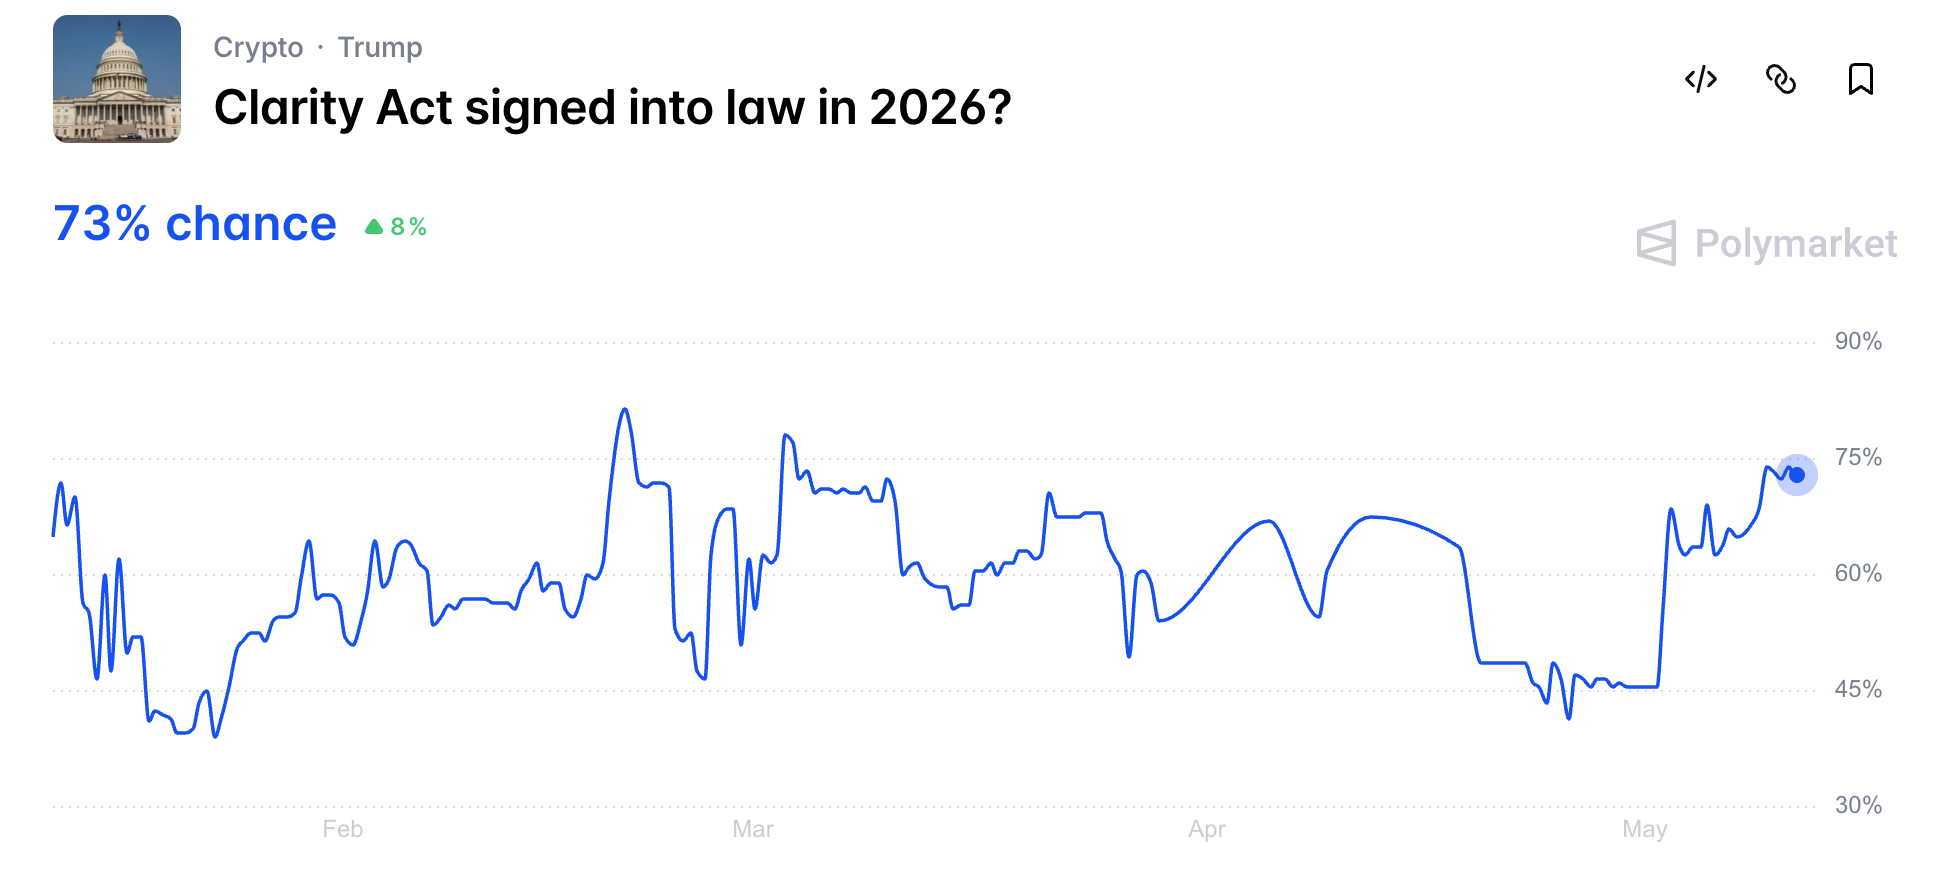
Polymarket traders now assign a 73% probability to the Digital Asset Market Clarity Act being signed into law in 2026.
This marks a sharp rise from 46% at the start of May. The increase comes days before a pivotal Senate Banking Committee markup.
Follow us on X to get the latest news as it happens

Why the May 14 Clarity Act Markup Matters
The Senate Banking Committee will meet on Thursday, May 14, in the Dirksen Senate Office Building in Washington, D.C., to consider the bill. This marks progress on the crypto market structure legislation, which stalled in the Senate after clearing the House in July.
Reporter Eleanor Terrett confirmed that draft text had been circulated to select industry members ahead of the vote. The markup gives the panel a fresh shot before the White House’s July 4 signing target.
Meanwhile, banking trade groups are pressing for last-minute revisions to a yield compromise brokered by Senators Thom Tillis and Angela Alsobrooks. The proposed tweaks would further restrict stablecoin issuers from offering rewards to holders.
The bill is widely viewed as a major development for the crypto market, with industry experts suggesting it could provide a strong tailwind for the sector. According to Grayscale, the CLARITY Act would affect nearly every segment of the digital asset industry by establishing clearer regulatory standards.
“The CLARITY Act can catalyze the next phase of innovation and capital formation in digital assets by replacing uncertainty with structure, providing developers, businesses, and investors with a long-awaited asset and regulatory legal framework,” Zach Pandl, Grayscale Head of Research, wrote.
Now, Thursday’s vote will signal whether the Senate can hit the July target.
Subscribe to our YouTube channel to watch leaders and journalists provide expert insights
The post Polymarket Odds Flash 73% on Clarity Act Becoming Law in 2026 appeared first on BeInCrypto.
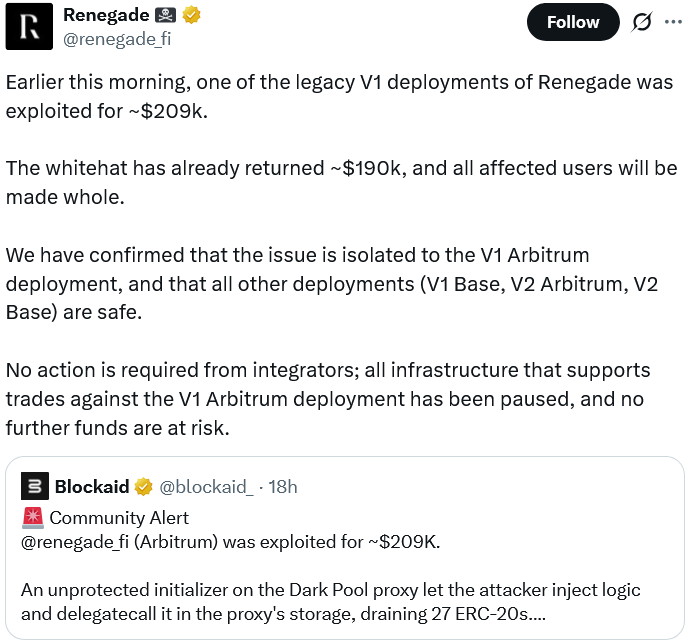
The team behind the Renegade.fi protocol said a whitehat hacker returned about $190,000 after exploiting one of its Arbitrum-based decentralized dark pools and later complying with instructions in an onchain message to return 90% of the funds.
Renegade confirmed the return of funds on Sunday after blockchain analytics platform Blockaid flagged the $209,000 exploit at 8:27 am UTC. The hacker injected malicious logic into a faulty function tied to its V1 Arbitrum dark pool to steal 27 ERC-20 tokens.
Data from Arbitrum block explorer Arbiscan shows that the whitehat returned about $190,000 to the Arbitrum wallet address “0xE4A…5CFBE,” which includes $84,370 worth of USDC (USDC), $27,885 in wrapped Bitcoin and $23,950 in wrapped Ether.

Source: Renegade
Whitehat hackers have come to play a crucial role in the fight against bad actors who continue to exploit crypto protocols despite strengthened security measures in recent years.
Industry initiatives like the crypto security nonprofit Security Alliance’s Safe Harbor framework have been set up to enable white hats to steal funds for temporary safekeeping while being legally protected.
In an onchain message, Renegade asked the hacker to return 90% of the funds and keep the remaining 10% as a “whitehat bounty” to avoid facing potential “civil or criminal action.”

The onchain message that Renegade sent to the hacker. Source: Arbiscan
The whitehat hacker sent more than 90% of the stolen funds back within 45 minutes and said in response to the onchain message that the action was taken to protect DeFi users:
“I’ve seen a lot of contempt toward my actions. Although I understand that what I did was not ethical, in the current DeFi cybersecurity, I believe this was the best solution to protect users’ funds and ensure their safety.”
The whitehat hacker also hinted that Renegade should tighten up its security measures, stating that the vulnerability exploited was “tooooo simple and bad.”
Related: Crypto hackers stole $17B over past 10 years: DefiLlama
North Korean state-backed hackers “would never come to negotiate,” they added.
Renegade said the exploit appeared to have resulted from the deployment code failing to assign an explicit owner and from a faulty migration in an April 2025 software update, enabling anyone to rewrite the smart contract tied to its V1 Arbitrum dark pool.
Dark pools are private trading platforms that allow large trades to occur without exposing their intentions to, or impacting, the broader market.
Renegade added that it would publish a post-mortem with a “full root-cause analysis” explaining the security incident.
Renegade said it would fully compensate affected users, and that only 7% of its trading volume was channeled through the V1 Arbitrum dark pool and that it would contact the “small number of affected users directly.”
Magazine: AI-driven hacks could kill DeFi — unless projects act now
Crypto World
Toobit Achieves AAA Security Rating from CER.live, Ranking Among Top 10 Global Exchanges
Well-known and award-winning international centralized crypto exchange Toobit has announced that it managed to achieve an AAA security rating from CER.live
This is the industry’s premier cybersecurity ranking and certification platform. The milestone makes Toobit one of the top 10 most secure crypto exchanges globally (according to the certifiers). The move follows rigorous audits of its infrastructure and protocols installed to enhance user protection.
What the Data Shows
CER.live data shows that Toobit was able to score a perfect 100/1000 in Server Security, User Security, Penetration Testing, and Bug Bounty management.
Combined with ISO 27001 certification and funds insurance, these metrics confirm a resilient, robust security environment for international traders.

It’s important to understand that the CER.live methodology is globally recognized as one of the most comprehensive in the entire digital asset industry.
The Evaluation Process
The ranking process tends to evaluate more than 18 indicators across server security, user security, penetration testing, as well as bug bounty programs. In order to receive an AAA rating, which is the highest possible tier, the exchange has to pass rigorous technical scans. It also has to demonstrate operational transparency through recurring external audits as well as bug bounty programs.
This security milestone follows Toobit’s recent Proof of Reserves (PoR) report, independently verified by Hacken. The Hacken audit confirmed that Toobit maintains a collateral ratio of over 100% across all in-scope digital assets, including BTC, ETH, USDT, and USDC.
The need for such standards is further underscored by the current landscape of the crypto industry. The value of hacked or stolen money in the ecosystem increased by 31% year-over-year in early 2026. Moreover, threats driven by the advance of AI such as automated smart contract probing, as well as deepfake phishing, have become some of the fastest-growing cyber risks for trading platforms.
In a world where illicit actors are becoming more targeted, third-party verification from reputable auditors is absolutely essential for establishing platform integrity.
The post Toobit Achieves AAA Security Rating from CER.live, Ranking Among Top 10 Global Exchanges appeared first on CryptoPotato.

Crypto markets have gained marginally over the weekend, hitting a weekly high on Monday morning trading in Asia. But this week’s inflation reports could put a dampener on things.
Meanwhile, US stock market futures fell on Monday as Iran War peace talks stalled and President Trump said he does not like Iran’s response to the peace proposal. At the same time, oil prices spiked by around 4% back to $100 a barrel.
Iran has also rejected dismantling its nuclear facilities in its response to the US peace proposal, as the stalemate continues. This week’s focus will also center on Trump’s visit to China and his expected summit with Chinese leader Xi Jinping.
Economic Events May 11 to 15
April’s consumer price CPI inflation data will be released on Tuesday. The report will assess the impact of higher energy costs and the chances of the Federal Reserve cutting interest rates in the coming months.
The PPI inflation report follows on Wednesday, offering more insight into inflationary pressures, which are expected to have increased due to the war in the Middle East.
Other data this week includes April’s existing home sales figures and retail sales data for April on Thursday, which will give signs of whether consumers are confident enough to spend despite higher energy prices. Weekly jobless claims are also due Thursday, and industrial production data on Friday.
Key Events This Week:
1. April Existing Home Sales data – Monday
2. April CPI Inflation data – Tuesday
3. April PPI Inflation data – Wednesday
4. OPEC Monthly Report – Wednesday
5. April Retail Sales data – Thursday
6. April Industrial Production data – Friday
More crucial…
— The Kobeissi Letter (@KobeissiLetter) May 10, 2026
“For incoming Fed Chair Kevin Warsh, these [jobs] numbers are likely to kill off any prospect of a near-term rate cut,” said Nick Rees, head of macro research at Monex, according to the WSJ.
“A resilient labor market raises the risk that rising energy costs will translate into a broader-based increase in price growth,” he added.
Crypto Market Outlook
Crypto markets gained almost 1% over the past 24 hours to reach $2.8 trillion on Monday, their highest level since late January.
Bitcoin was leading the charge, topping $82,300 in late Sunday trading before falling back to the $81,000 level on Monday morning. The asset has gained steadily, adding 11% over the past month.
Ether prices reached $2,380 but found resistance there, falling back slightly during Asian trading. The altcoins were largely mixed with slightly better gains from XRP, Solana, Cardano, and Sui, which surged almost 20% following a prediction market push.
The post 4 Things That Could Move Crypto Markets This Week appeared first on CryptoPotato.

Key Takeaways
- Michael Saylor shared “Back to work, BTC” on X on May 10, indicating an upcoming Bitcoin acquisition
- The company suspended its Bitcoin purchases for one week surrounding its May 5 Q1 2026 earnings report
- During Q1 earnings, Saylor revealed Strategy might occasionally liquidate minor BTC amounts for dividend funding — marking a departure from its historical hold-forever policy
- The firm’s Bitcoin treasury contains 818,334 BTC purchased at an average price of $75,537, valued at roughly $66.15 billion today
- CEO Phong Le emphasized any BTC sales would be minimal and inconsequential to market dynamics, noting Bitcoin’s daily trading volume exceeds $60B
Michael Saylor of Strategy seems poised to resume Bitcoin acquisitions. On May 10, he shared “Back to work, BTC” on X, accompanied by the company’s recognizable “Orange Dots” visualization — a post style that has consistently foreshadowed purchase announcements.
Historical patterns suggest an official acquisition announcement could arrive as soon as May 11.
The company’s buying hiatus spanned one week, strategically positioned around Strategy’s May 5 Q1 2026 earnings announcement. That particular earnings call generated considerable discussion.
Saylor stated during the presentation that Strategy would “probably sell some Bitcoin to fund a dividend, just to inoculate the market.” This marked a significant shift from the firm’s established never-sell Bitcoin philosophy.
Before this pause, Strategy’s latest acquisition occurred on April 27, purchasing 3,273 BTC for approximately $255 million at $77,906 per coin. This transaction elevated total holdings to 818,334 BTC.
Currently, Strategy’s Bitcoin holdings are valued at around $66.15 billion, with an average acquisition cost of $75,537 per BTC — representing approximately a 7.6% gain on the position.
Divided Opinions Within the Bitcoin Community
The dividend-funding sale strategy generated varied responses across the Bitcoin community. Strategy shareholder Adam Livingston contended that strategic periodic sales would benefit the treasury over time, providing capital for additional BTC acquisitions.
Bitcoin proponent Samson Mow noted that maintaining the option to sell provides Strategy with enhanced flexibility in capital markets.
However, critics voiced stronger concerns. Some community members warned the approach could trigger a “doom loop,” where selling BTC to fund credit instrument dividends creates downward pressure on Bitcoin’s spot price.
CEO Phong Le rejected this characterization. He informed CNBC that Strategy’s trading activity doesn’t significantly influence Bitcoin’s market price.
Leadership Dismisses Market Impact Concerns
Le highlighted that Bitcoin experiences over $60 billion in daily trading activity. Strategy’s annual dividend commitments related to credit products amount to approximately $1.5 billion — representing just a small fraction of daily volume.
“I don’t think we’re driving the price up or down,” Le stated.
He further specified that Bitcoin sales would only occur under particular circumstances: satisfying dividend obligations and managing tax deferrals.
Strategy generated approximately $82 million through an MSTR at-the-market equity offering prior to the earnings-related pause. While that amount could have funded roughly 1,000 BTC at prevailing prices, the company refrained from making any purchase.
The April 27 acquisition — involving 3,273 BTC — represented a considerable deceleration from the $2.54 billion purchase executed on April 20. Strategy had been aggressively accumulating Bitcoin throughout April, and market observers had already detected the slowdown before the formal pause.
Strategy currently controls approximately 4% of Bitcoin’s circulating supply.

Crypto World
Bank of England’s Andrew Bailey warns stablecoin oversight may become flashpoint with U.S.


Bank of England Governor Andrew Bailey has warned that international regulators could face a difficult confrontation with the United States over how stablecoins should be governed across global payment systems.
Summary
- Andrew Bailey said global regulators may clash with the U.S. over stablecoin rules and international payment standards.
- The Bank of England governor warned that some dollar stablecoins may not remain easily redeemable during market stress.
According to Reuters, Bailey said at a conference on Friday that stablecoins would only function properly in international payments if regulators agreed on common standards, adding that discussions with the U.S. administration were likely to become a “coming wrestle.”
Bailey’s comments came as the Trump administration continued backing stablecoin adoption through the GENIUS Act, which established a regulatory framework for issuers in the U.S. Dollar-backed stablecoins currently dominate the sector, with CoinGecko data valuing the market at more than $317 billion.
Most of the largest stablecoins are tied to the U.S. dollar and rely on reserves such as Treasury bills and cash held in dollars. Regulators outside the U.S., including officials in the UK, have repeatedly argued that stablecoins could create risks for the banking system if oversight remains too light.
Serving as chair of the Financial Stability Board, Bailey said he still viewed stablecoins as a potential financial stability risk. He told the conference that some stablecoins may not be easily redeemable for cash without going through crypto exchanges, which could create problems during periods of market stress.
Concerns over convertibility have shaped the Bank of England’s own regulatory proposals. In consultation papers released in November 2025, the central bank proposed temporary limits of £20,000 for individual stablecoin holdings and £10 million for corporate balances as part of its planned framework for pound-backed stablecoins.
Bank of England keeps stricter line on stablecoins
Under the Bank of England proposal, issuers would also be required to hold 40% of their reserves as non-interest-bearing deposits at the central bank, while the remaining 60% could be invested in short-term UK government debt.
At the time, the Bank of England said the structure was designed to support redemptions during periods of stress and maintain confidence in stablecoin reserves. Exemptions were included for firms such as supermarkets and crypto trading platforms that may need larger balances for operational reasons.
Bailey has repeatedly questioned whether stablecoins could weaken state control over money if they grow without strong safeguards. Last year, he said stablecoins “have to maintain their nominal value” because they are being designed to function as money and payment instruments.
Friday’s remarks also touched on cross-border flows. Bailey warned that if hard-to-redeem dollar stablecoins spread internationally, countries such as the UK could end up absorbing redemption pressure during a market panic.
“We know what would happen if there was a run on a stablecoin; they’d all turn up here,” Bailey said, according to Reuters.
Similar concerns have surfaced in Washington during negotiations over crypto legislation. U.S. banking groups have urged lawmakers to prohibit crypto platforms from offering yield on stablecoins, arguing that such products could compete with bank deposits while operating outside traditional banking rules.
Negotiators failed to reach a full agreement after months of talks. The latest draft of the Senate market structure bill bans rewards on idle stablecoin balances while still allowing platforms to provide other customer incentive programs.
The Senate Banking Committee, which delayed a vote on the legislation earlier this year, is scheduled to hold a markup session on Thursday.


OpenAI employees became some early financial winners of the AI boom after more than 600 current and former workers sold shares in October 2025.
Summary
- More than 600 OpenAI workers sold shares, turning private AI equity into a large payday.
- About 75 employees reportedly reached the $30 million sale cap during the October 2025 deal.
- OpenAI-linked exposure is entering tokenized markets and retail investment products in 2026.
The sale totaled $6.6 billion, according to The Wall Street Journal. About 75 people reportedly sold the maximum $30 million each, while the wider group averaged about $11 million per seller.
The deal came after employees waited about two years to sell equity tied to the fast-growing artificial intelligence company. OpenAI had previously limited employee share sales to $10 million, but raised the cap to $30 million due to investor demand.
The report said the sale allowed many workers who joined after ChatGPT launched to turn private shares into cash before any public listing. The figures were based on people familiar with the matter, so the exact split among workers has not been publicly confirmed by OpenAI. For employees, the sale offered liquidity while investors sought more exposure to OpenAI.
Valuation keeps moving higher
The transaction valued OpenAI at an estimated $400 billion. In October 2025, a secondary sale involving current and former employees valued OpenAI at $500 billion, showing how private-market valuations have moved fast.
The company has also been preparing for a possible public listing. Crypto.news recently reported that OpenAI crossed $25 billion in annualized revenue and was preparing an IPO process that could include a filing in the second half of 2026. The same report said the company is still not profitable and faces heavy cash needs.
Moreover, OpenAI’s private equity story is also reaching crypto-linked products. As crypto.news reported in April, Robinhood Ventures Fund I bought about $75 million of OpenAI common stock to support venture tokens that give users price exposure through a fund, not direct ownership of OpenAI shares.
That structure has already drawn caution. OpenAI previously said: “These ‘OpenAI tokens’ are not OpenAI equity.” The line matters because token buyers may track price exposure without owning real company shares. It also shows that late-stage AI equity is becoming part of crypto-native product design.
AI race widens beyond OpenAI
The employee sale also comes as the private AI market becomes more competitive. Tokenized pre-IPO markets recently priced Anthropic at about $1.2 trillion, above OpenAI’s private-market pricing on some platforms.
OpenAI is still expanding beyond consumer chat tools. crypto.news has also reported that the company is building financial-services tools for ChatGPT through links with FactSet, Third Bridge, Excel, and Google Sheets. That push could make AI a larger part of finance workflows, including digital asset research and market reporting.


Morgan Stanley’s spot bitcoin ETF has completed its first month without a single day of net outflows, even as larger rival funds posted repeated redemption sessions during the same period.
Summary
- Morgan Stanley’s MSBT recorded no daily net outflows during its first month of trading.
- The bitcoin ETF crossed $103 million in inflows within six trading sessions after launching on April 8.
- SoSoValue data showed MSBT continued attracting inflows while BlackRock and Fidelity funds posted outflow days.
SoSoValue data reviewed by crypto.news showed Morgan Stanley’s MSBT continued attracting fresh capital every trading day since its April 8 launch, while the broader U.S. spot bitcoin ETF market alternated between large inflow and outflow sessions. On May 7 alone, MSBT added $5.7 million as BlackRock’s IBIT lost $27.2 million, Fidelity’s FBTC shed $97.6 million, and ARKB recorded $26.6 million in outflows.
Launching into a weak session for the ETF sector, MSBT drew $30.6 million in first-day inflows and roughly $34 million in trading volume while the broader category saw $94 million leave spot bitcoin funds.
Bloomberg Senior ETF Analyst Eric Balchunas later said the debut ranked among the top 1% of ETF launches.
Within six trading sessions, the fund had crossed $103 million in cumulative inflows, overtaking WisdomTree’s BTCW, which has operated since January 2024 and has gathered roughly $86 million in total net inflows over its lifetime.
Low fee strategy gains traction
MSBT entered the market with a 0.14% sponsor fee, the lowest among all U.S. spot bitcoin ETFs. Grayscale’s Bitcoin Mini Trust charges 0.15%, Bitwise’s BITB charges 0.20%, ARKB charges 0.21%, while both IBIT and FBTC sit at 0.25%. Grayscale’s legacy GBTC fund still carries a 1.50% fee.
The pricing difference appears marginal for smaller investors but scales quickly for institutions, with an 11 basis point gap between MSBT and IBIT translating to roughly $1.1 million annually on a $1 billion allocation.
Trading activity also pointed to sustained demand pressure. SoSoValue data showed MSBT traded at a 0.24% premium to net asset value on May 7, above IBIT’s 0.18% and FBTC’s 0.13%.
Morgan Stanley’s crypto expansion has extended beyond ETFs. As crypto.news previously reported, the bank launched a pilot crypto trading service on ETrade on May 6 with a flat 0.5% transaction fee for bitcoin, ether, and solana trades executed through Zerohash infrastructure.
Bloomberg reported that Morgan Stanley is below Coinbase, Fidelity, and Charles Schwab on retail crypto trading costs.
Eric Balchunas said competitors were unlikely to leave the pricing unchanged and compared the situation to the fee compression battle that followed the launch of spot bitcoin ETFs.
Advisors yet to fully enter
Almost all early inflows into MSBT came from self-directed investors rather than Morgan Stanley’s advisory network.
“Almost all of that first week or two of activity was self-directed, meaning it was not our advisors that were selling this,” Amy Oldenburg, Morgan Stanley’s head of digital assets, said at the Consensus conference in Miami.
Morgan Stanley oversees roughly $9.3 trillion in client assets through roughly 16,000 financial advisors, although the bank had not yet opened MSBT access across its wealth management platform during the fund’s first weeks.
Once integrated into that channel, the ETF would gain access to one of the largest distribution systems tied to a U.S. financial institution. Morgan Stanley is also developing a proprietary digital wallet expected later in 2026 that would hold cryptocurrencies alongside tokenized stocks, bonds, and real estate assets.
MSBT’s first month coincided with renewed demand across the U.S. spot bitcoin ETF sector. SoSoValue data showed the 13-spot bitcoin funds attracted more than $3 billion across six straight weeks through May 8, the longest positive streak since mid-2025. Total assets across the category reached $106.6 billion, equal to 6.67% of bitcoin’s market capitalization, while cumulative inflows since launch climbed to $59.3 billion.
Balchunas projected MSBT could eventually reach $5 billion in assets under management during its first year, though he indicated advisor-driven flows would likely need to accelerate for the fund to maintain its current pace.
5 Handy Quinn Tools You Can Get At Harbor Freight For Under $25

Horoscope today: Your daily guide for Monday, May 11, 2026

Vauxhall to Use Chinese Parts in New C-SUV as Stellantis Doubles Down on Leapmotor Deal
Manchester United reach agreement with Casemiro over contract clause amid transfer speculation

US brings back mandatory military draft registration

Steven Gerrard disagrees with Gary Neville over ‘shock’ Chelsea and Arsenal claim | Football


![BITCOIN IS BREAKING CRITICAL RESISTANCE! [TRAP TRAP TRAP]](https://wordupnews.com/wp-content/uploads/2026/05/1778482707_maxresdefault-80x80.jpg)
-
 Crypto World3 days ago
HarrisX Poll Found 52% of Registered Voters Support the CLARITY Act
-

 Crypto World4 days ago
Upbit adds B3 Korean won pair as Base token gains Korea access
-

 Fashion3 days ago
Weekend Open Thread: Marianne Dress
-

 Tech6 days ago
Image AI models now drive app growth, beating chatbot upgrades
-
 NewsBeat4 days ago
NCP car park operator enters administration putting 340 UK sites at risk of closure
-
 Business2 days ago
Ignore market noise, India’s long-term story intact, say D-Street bulls Ramesh Damani and Sunil Singhania
-

 Politics2 days ago
Politics Home Article | Starmer Enters The Danger Zone
-
 Sports7 days ago
2026 NHL playoff picks: Second-round predictions, series odds, Stanley Cup bracket
-

 Crypto World6 days ago
UAE Free Zone Deploys Blockchain IDs to Verify Registered Firms
-

 Crypto World5 days ago
BlackRock CEO Larry Fink Discusses a New Asset Class
-

 Crypto World4 days ago
Robinhood says Wall Street is building onchain
-

 Tech1 day ago
Auto Enthusiast Carves Functional Two-Stroke Engine from Solid Metal
-

 Tech5 days ago
Apple and Samsung are dominating smartphone sales so thoroughly that only one other company makes the top 10
-
Entertainment6 days ago
Serena Williams hits Met Gala in metallic dress after GLP-1 reveal
-

 Entertainment7 days ago
Skai Jackson Responds To AI Baklash After Viral Snapchat Photos
-

 Politics6 days ago
Met Gala 2026: Madonna’s Dramatic Red Carpet Look Steals The Show
-

 Fashion4 days ago
The Best Work Pants for Women in 2026
-
 Sports7 days ago
Hearts v Rangers LIVE: Prediction, team news and line-ups as Scottish Premiership title rivals meet at Tynecastle
-

 Tech5 days ago
I tested the Xiaomi 17 Ultra’s camera and I don’t think I’ll ever go back to an iPhone
-
Crypto World4 days ago
The FOMO Is Back: Why Bitcoin’s Latest Rally Has Analysts Flashing Warning Signs
You must be logged in to post a comment Login