


Glas, a new Mediterranean restaurant and bar in Falmouth, is set to transform an area its owner says has been blighted by homelessness and drug use

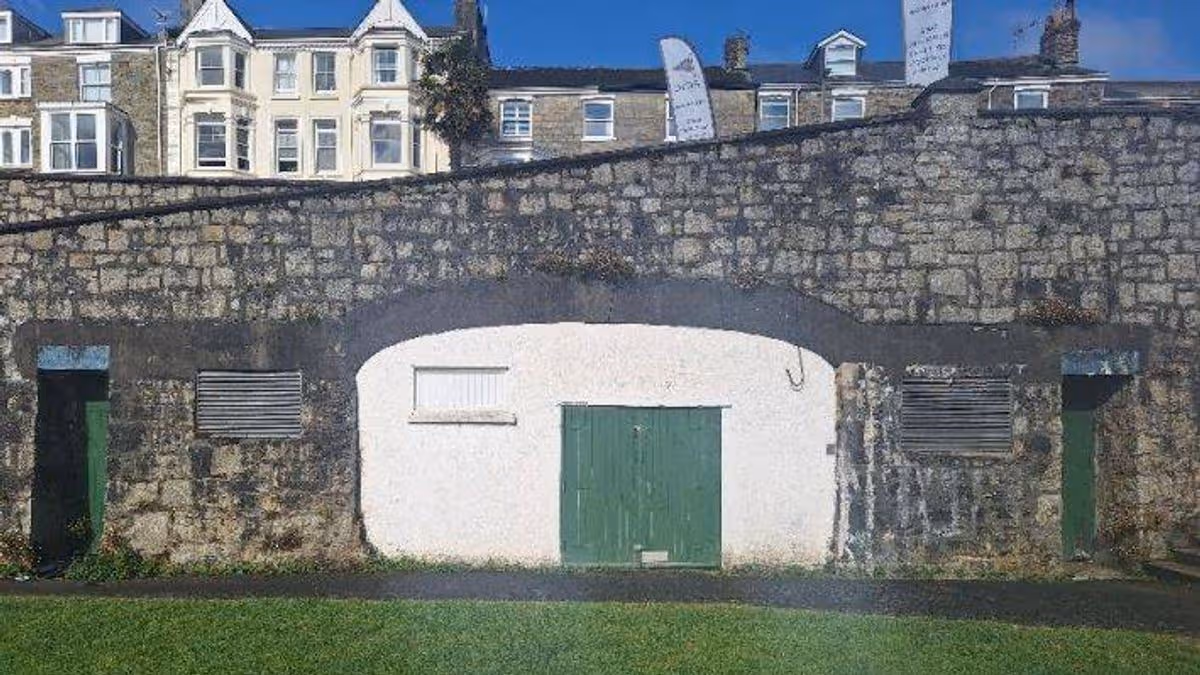
Glas will be based at a former Victorian public toilet overlooking the water in Falmouth(Image: Local Democracy Reporting Service / Cornwall Council licensing application)
The ownerof a new restaurant in Cornwall claims it will revitalise a “forgotten corner” of a town in the Duchy that has been plagued by homelessness and drug misuse. He said he had discovered used needles, smashed glass pipes, empty drugs bags and has even been pricked by a discarded needle himself.
Despite his pledges to transform the area, several neighbours have objected to a premises licence application for Glas, a new Mediterranean restaurant and bar in Falmouth, citing concerns about noise in a residential neighbourhood.
Due to the objections, the application by Glas Falmouth Ltd will be considered by a Licensing Act sub-committee at Cornwall Council next week.
Work is currently under way to transform a former Victorian public toilet built into the wall at Dunstanville Terrace into the new establishment. It sits close to the Royal Cornwall Yacht Club and Greenbank Hotel, with views across the Carrick Roads waterway towards Flushing.
The premises, which will offer Mediterranean and Levantine influenced dishes, will accommodate 24 diners inside and an outdoor seating area with roughly 16 covers.
The licensing application states: “Glas is intended to operate as a well-managed, food-and-drink-led venue, serving local residents and visitors in a relaxed and welcoming environment. While food will be available throughout trading hours, the premises will also offer bar service and a social space for customers to enjoy drinks responsibly.
“The proposed hours for alcohol sales and the use of the external area have been deliberately set at sensible levels, with early cut-offs outdoors, to ensure the prevention of public nuisance.
“The application also seeks permission for occasional live music, such as acoustic performances and community-focused events. Any such activities will be low-key, managed responsibly and will finish at reasonable hours. Noise levels will be actively monitored and appropriate control measures are detailed within the operating schedule.”
Neither Devon and Cornwall Police, Cornwall Fire and Rescue nor Falmouth Town Council have raised any objections to the application. However, a handful of local residents remain opposed.
Their comments include: “I do hope this application will be rejected and we can look forward to families, young couples, children and dog walkers continuing to enjoy the area without disturbance. There are very few such areas left in Falmouth, especially that front the water, please leave our public spaces public.
“We already hear music from the Greenbank Hotel, both from inside the hotel lounge when they host occasional parties, but especially from the tent that they erect on Greenbank Quay in the summer which has no sound proofing. Live music or recorded music at this new café will create additional noise in a largely residential area.
“Many people supported the idea of the old public toilets being put to good use as a café during the day, but more live music late into the evening in a largely residential area where residents are getting up to go to work is not appropriate.
“There’s already the yacht club (which causes no noise issues) and the Greenbank Hotel, this causes problems with noise currently with music on occasions. Patrons currently can cause a noise nuisance when leaving so any further additions will just add to the current problems.”
‘We’re here to bring back to life a forgotten corner of our town’
Joe Pizey, one of the Glas team, has responded to each of the four objectors and offered to meet with them in person.
He said: “We know full well that this particular corner of Falmouth town has not been used by local people for the last three years, in fact in the warmer months it’s been solely home to a small gang of homeless people living in tents.
“I myself have spent hours scanning the area and removing used needles, broken glass pipes and empty (what I assume are) drug bags. I even leant up against an interior window ledge and was met with a prick to the back of my arm from a broken needle that had been posted through the galvanised window grates.
“I want to stress that it’s in our interest as local residents to maintain the beauty of this area beyond our boundaries. We’ve been overwhelmed by comments from local residents regarding the improvements we’ve already achieved. The palm trees are as much of a ‘tent deterrent’ as they are a welcome addition to the gardens in the eyes of the authorities and local people alike.
“We’re here to bring back to life a forgotten corner of our town and actively tackle antisocial behaviour as I hope you agree we’re achieving already.”
Mr Pizey added: “We’ve been overwhelmed by local support from residents, residents that have seen first hand the improvements we’ve already made to the public space. Every day we are stopped by locals that share their excitement and gratitude.
“We’ve reached nearly 90,000 viewers on our Instagram and we’ve got over 1,200 Falmouth/Cornwall-based followers online that are all as supportive as the public we meet in person.”
The premises licence application is set to be determined at the council meeting on Wednesday, May 13.


You must be logged in to post a comment Login