
Crypto World
MicroStrategy Stock Hinges on Bitcoin Correlation For a 20% Move
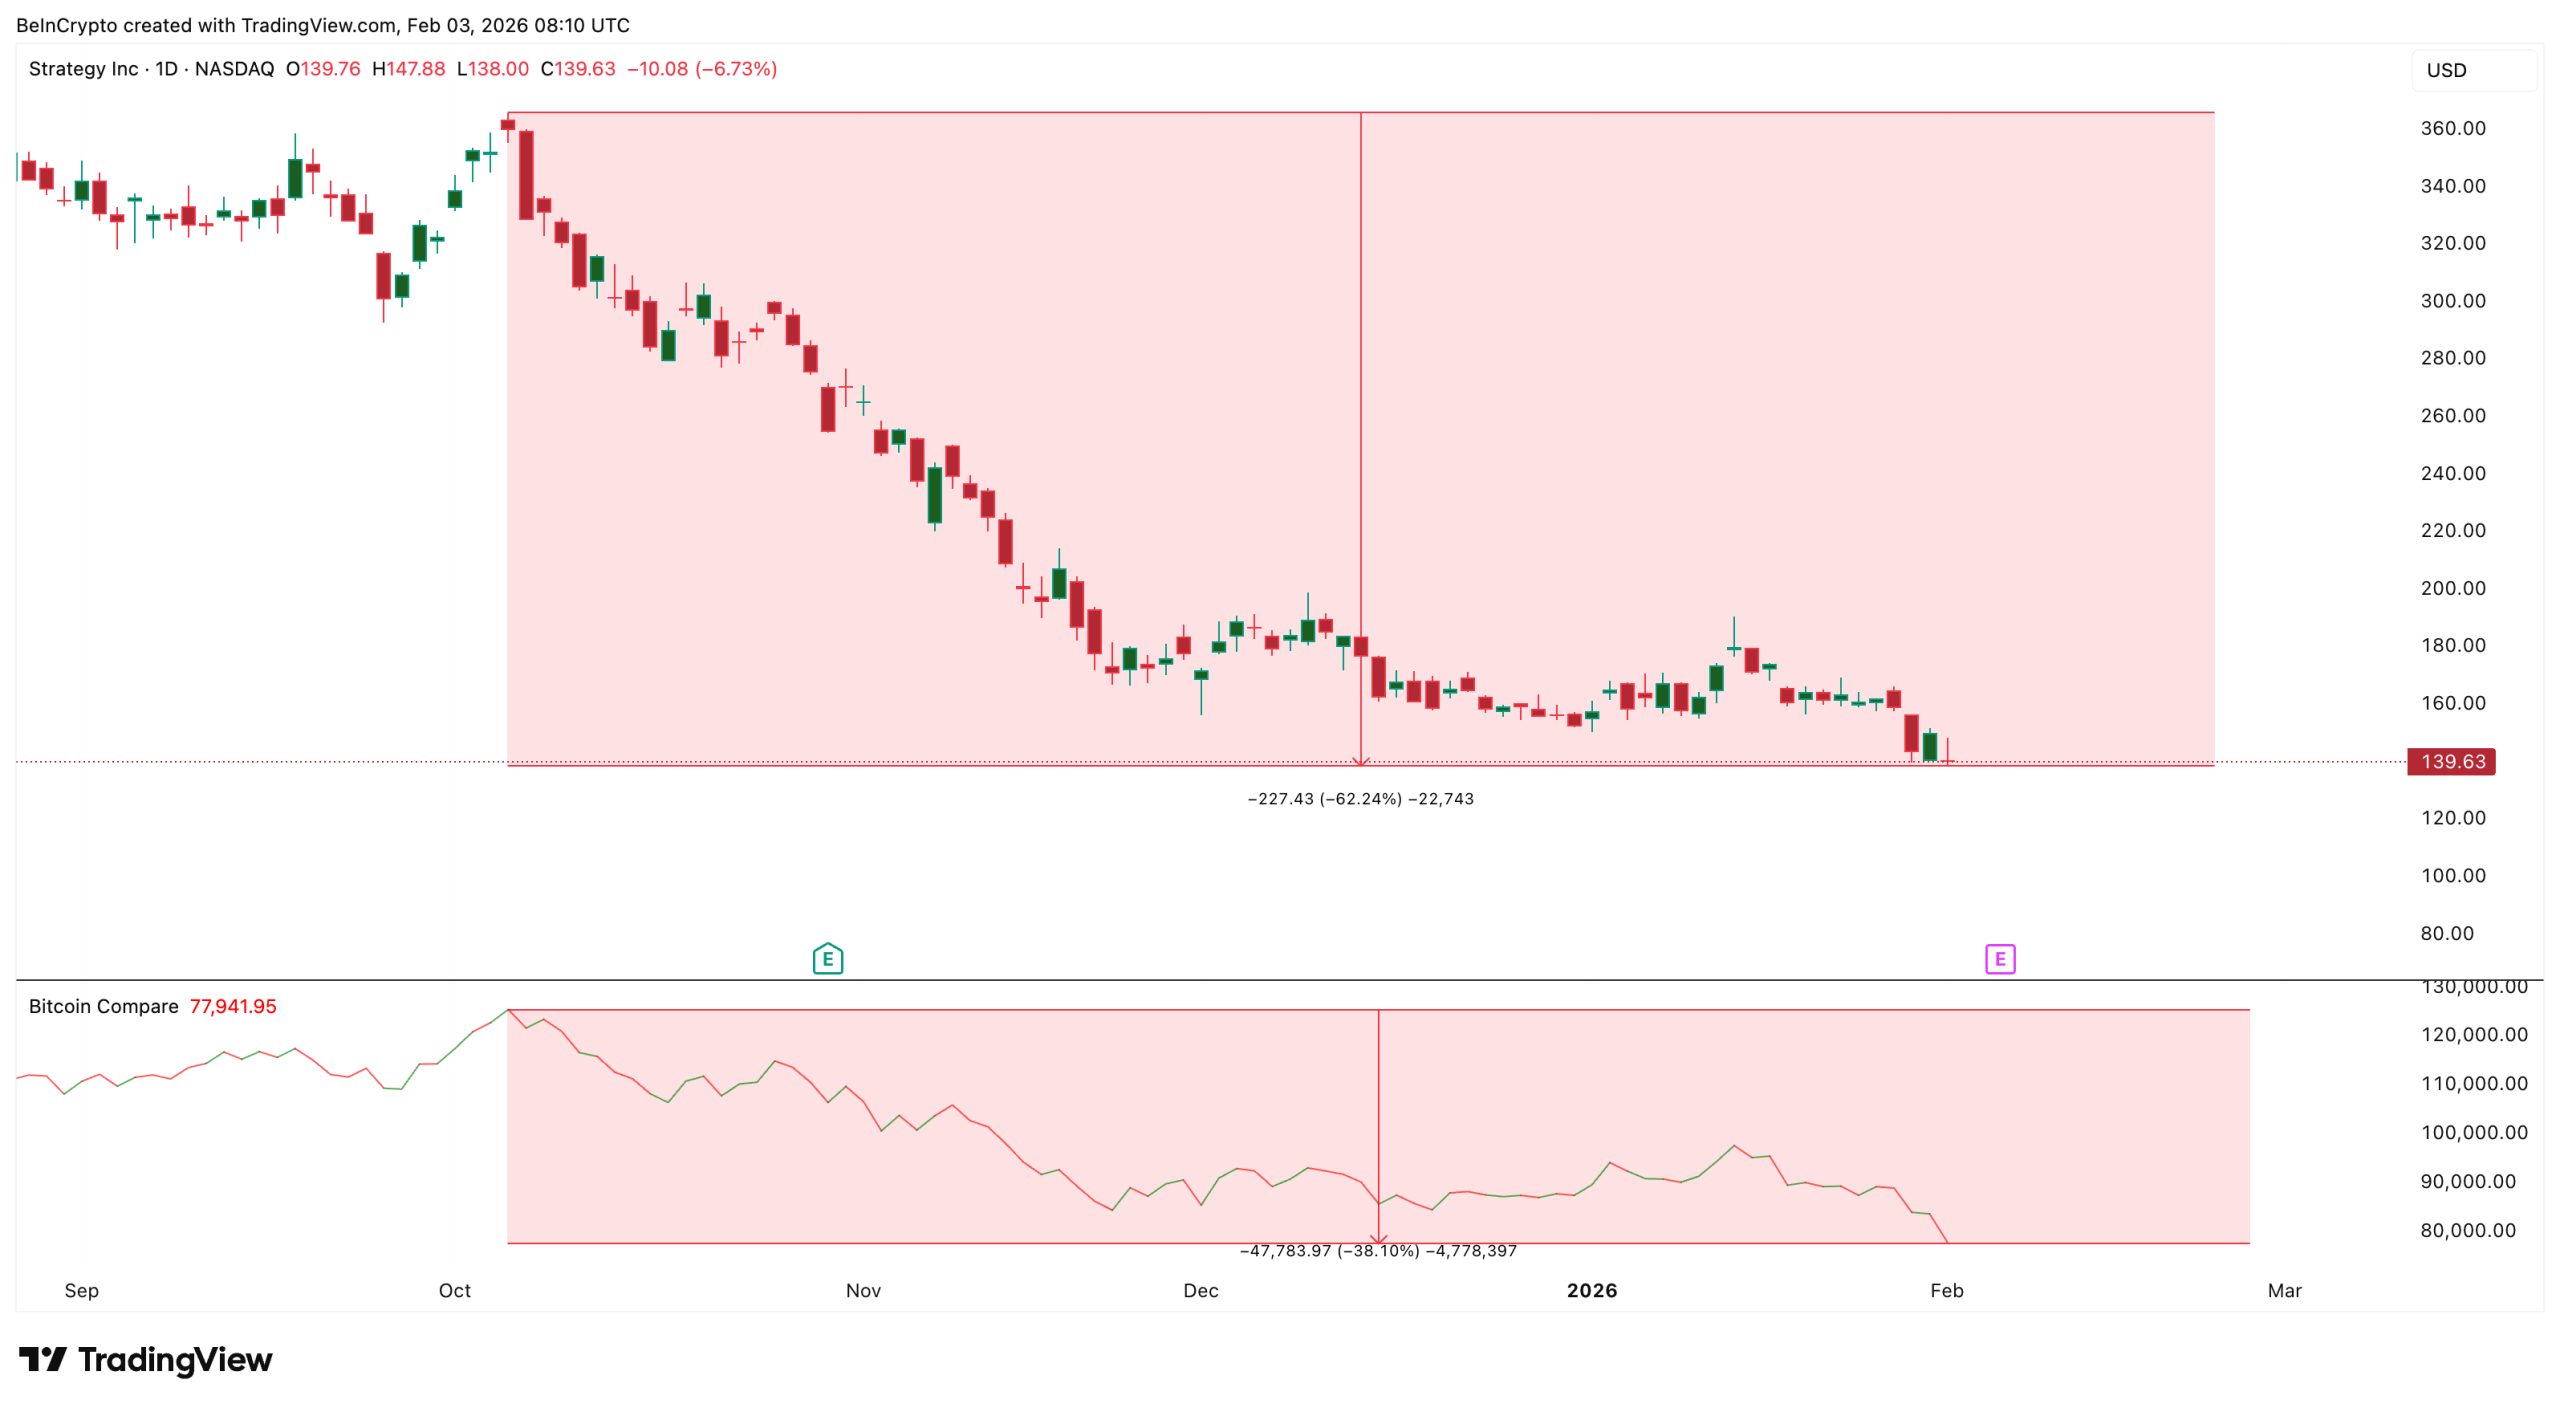
After weeks of heavy pressure, down over 12%, MicroStrategy stock is trying to stabilize. Bitcoin’s rebound near $79,000 at press time helped ease fears around the company’s average cost basis, which briefly dominated market sentiment in late January.
For a while, investors worried that a deeper Bitcoin price drop could push MSTR into unrealized losses. Now that the immediate risk has faded, attention is shifting to whether a price recovery can surface. Correlation data, capital flows, and price structure suggest the stock has entered a high-risk zone, where the next major BTC move could shape its direction for weeks.
Sponsored
Sponsored
Bitcoin Correlation Explains Why MicroStrategy Fell Faster
Since early October, MicroStrategy has fallen by roughly 62%, while Bitcoin has declined about 38% over the same period. This gap highlights how MSTR behaves like a leveraged version of Bitcoin. When Bitcoin weakens, MicroStrategy usually falls harder because investors also factor in balance-sheet exposure, debt, and sentiment risk.

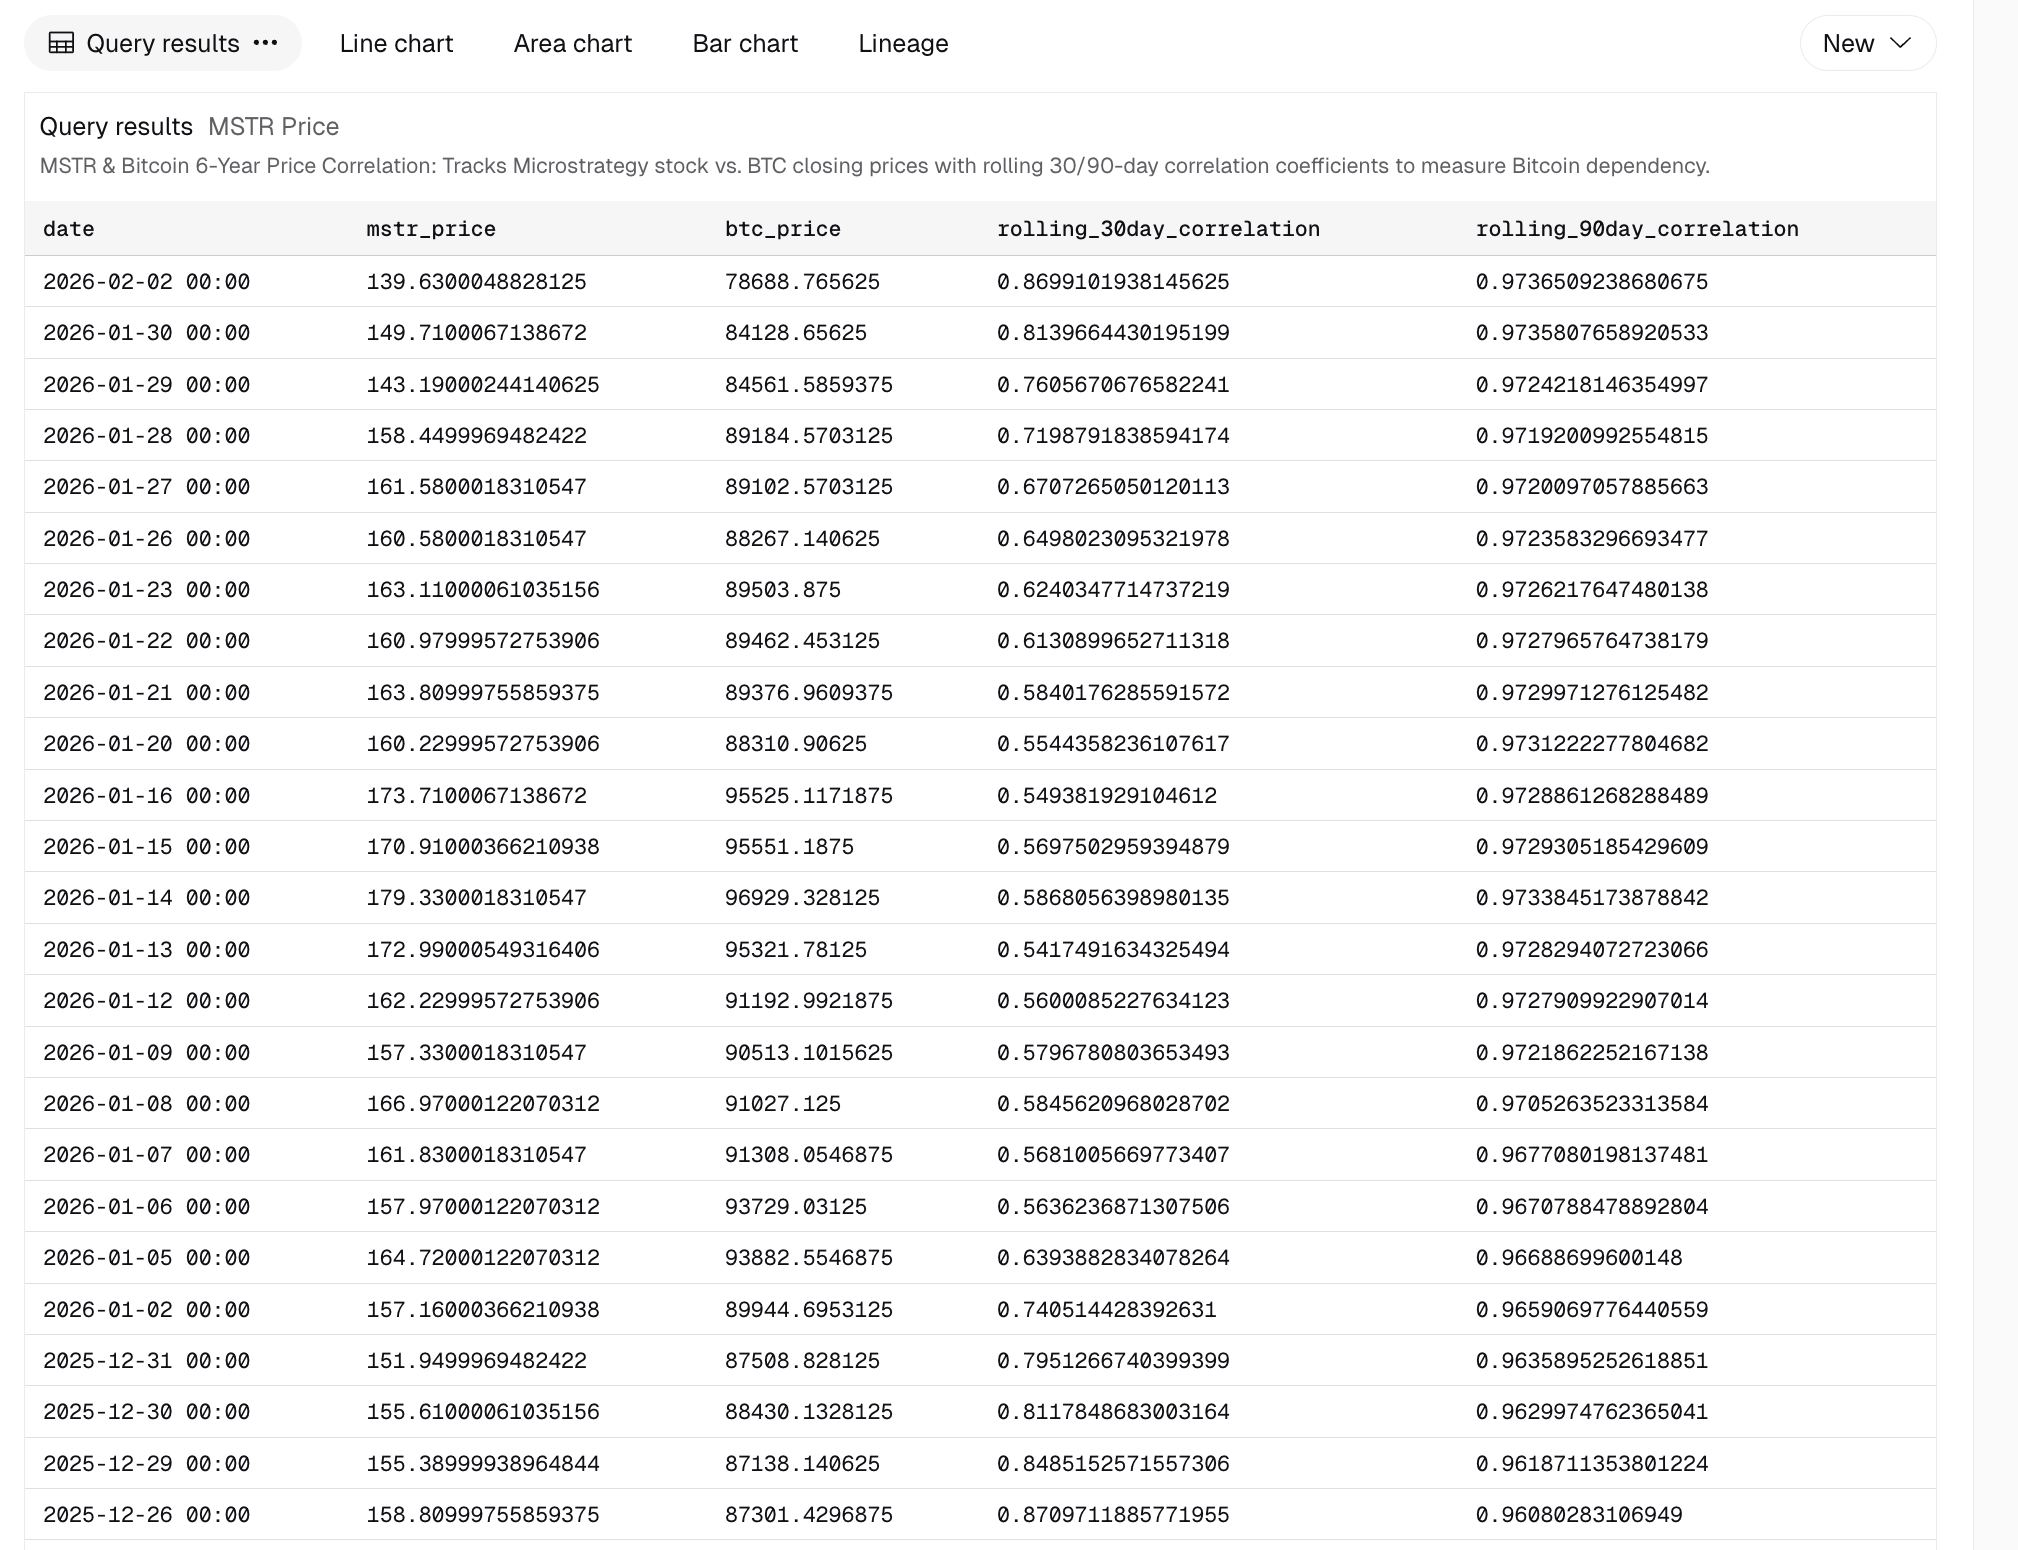
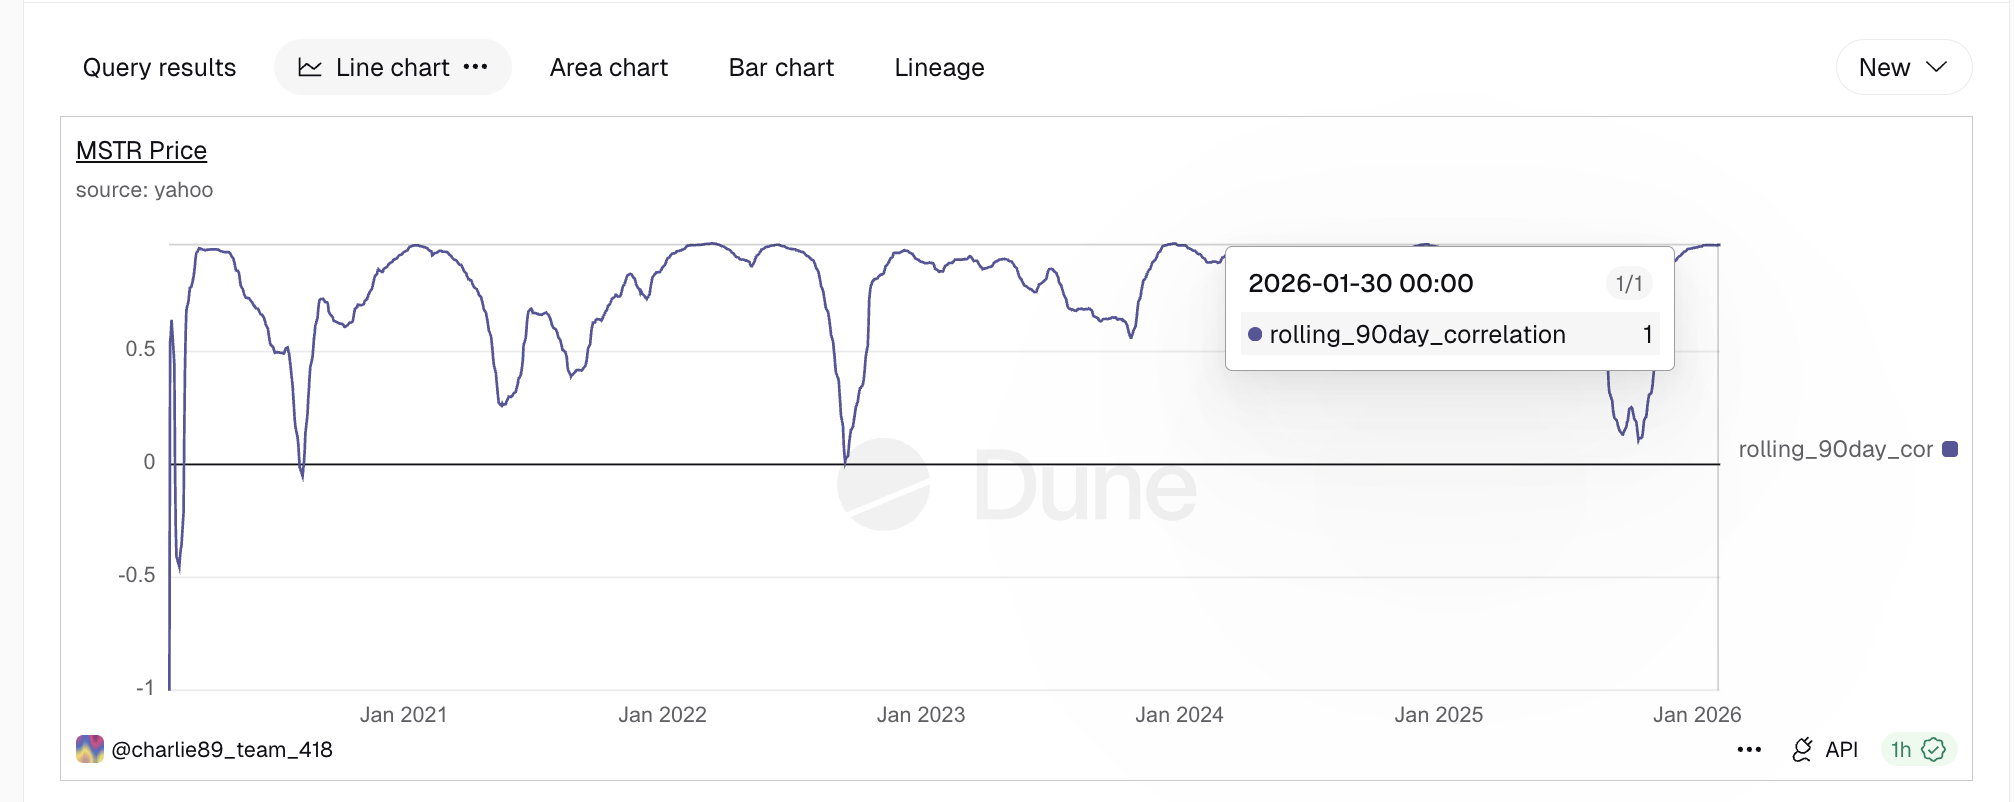
Dune data support this relationship. The 90-day rolling correlation between MSTR and Bitcoin is close to 0.97 (close to 1), which means the two assets have been moving in the same direction almost every day.
However, this does not contradict the larger drawdown. Correlation measures direction, not size. It shows that MSTR follows Bitcoin’s trend, but leverage and structural risks amplify the moves.
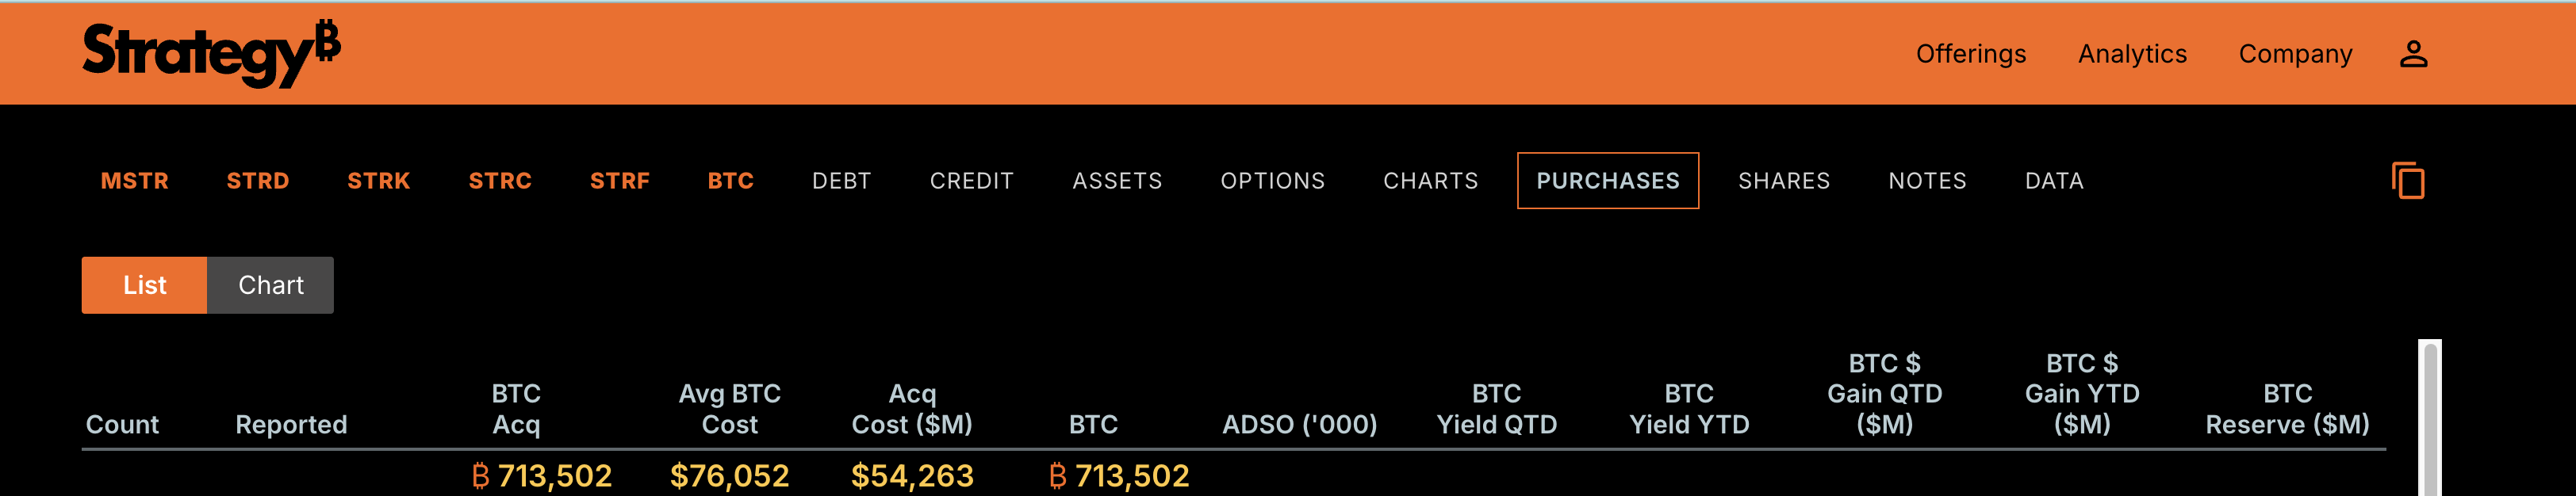
This dynamic became clear in late January, when Bitcoin briefly dipped under MicroStrategy’s average purchase price of around $76,000. That moment triggered fears of unrealized losses and added pressure on the stock. Bitcoin’s rebound above $78,000 reduced that threat and helped calm sentiment.
Sponsored
Sponsored
Still, the correlation remains extremely high. If Bitcoin weakens again, the MSTR stock price is likely to follow, which keeps downside risk elevated.
Money Flow And Volume Send Mixed Signals
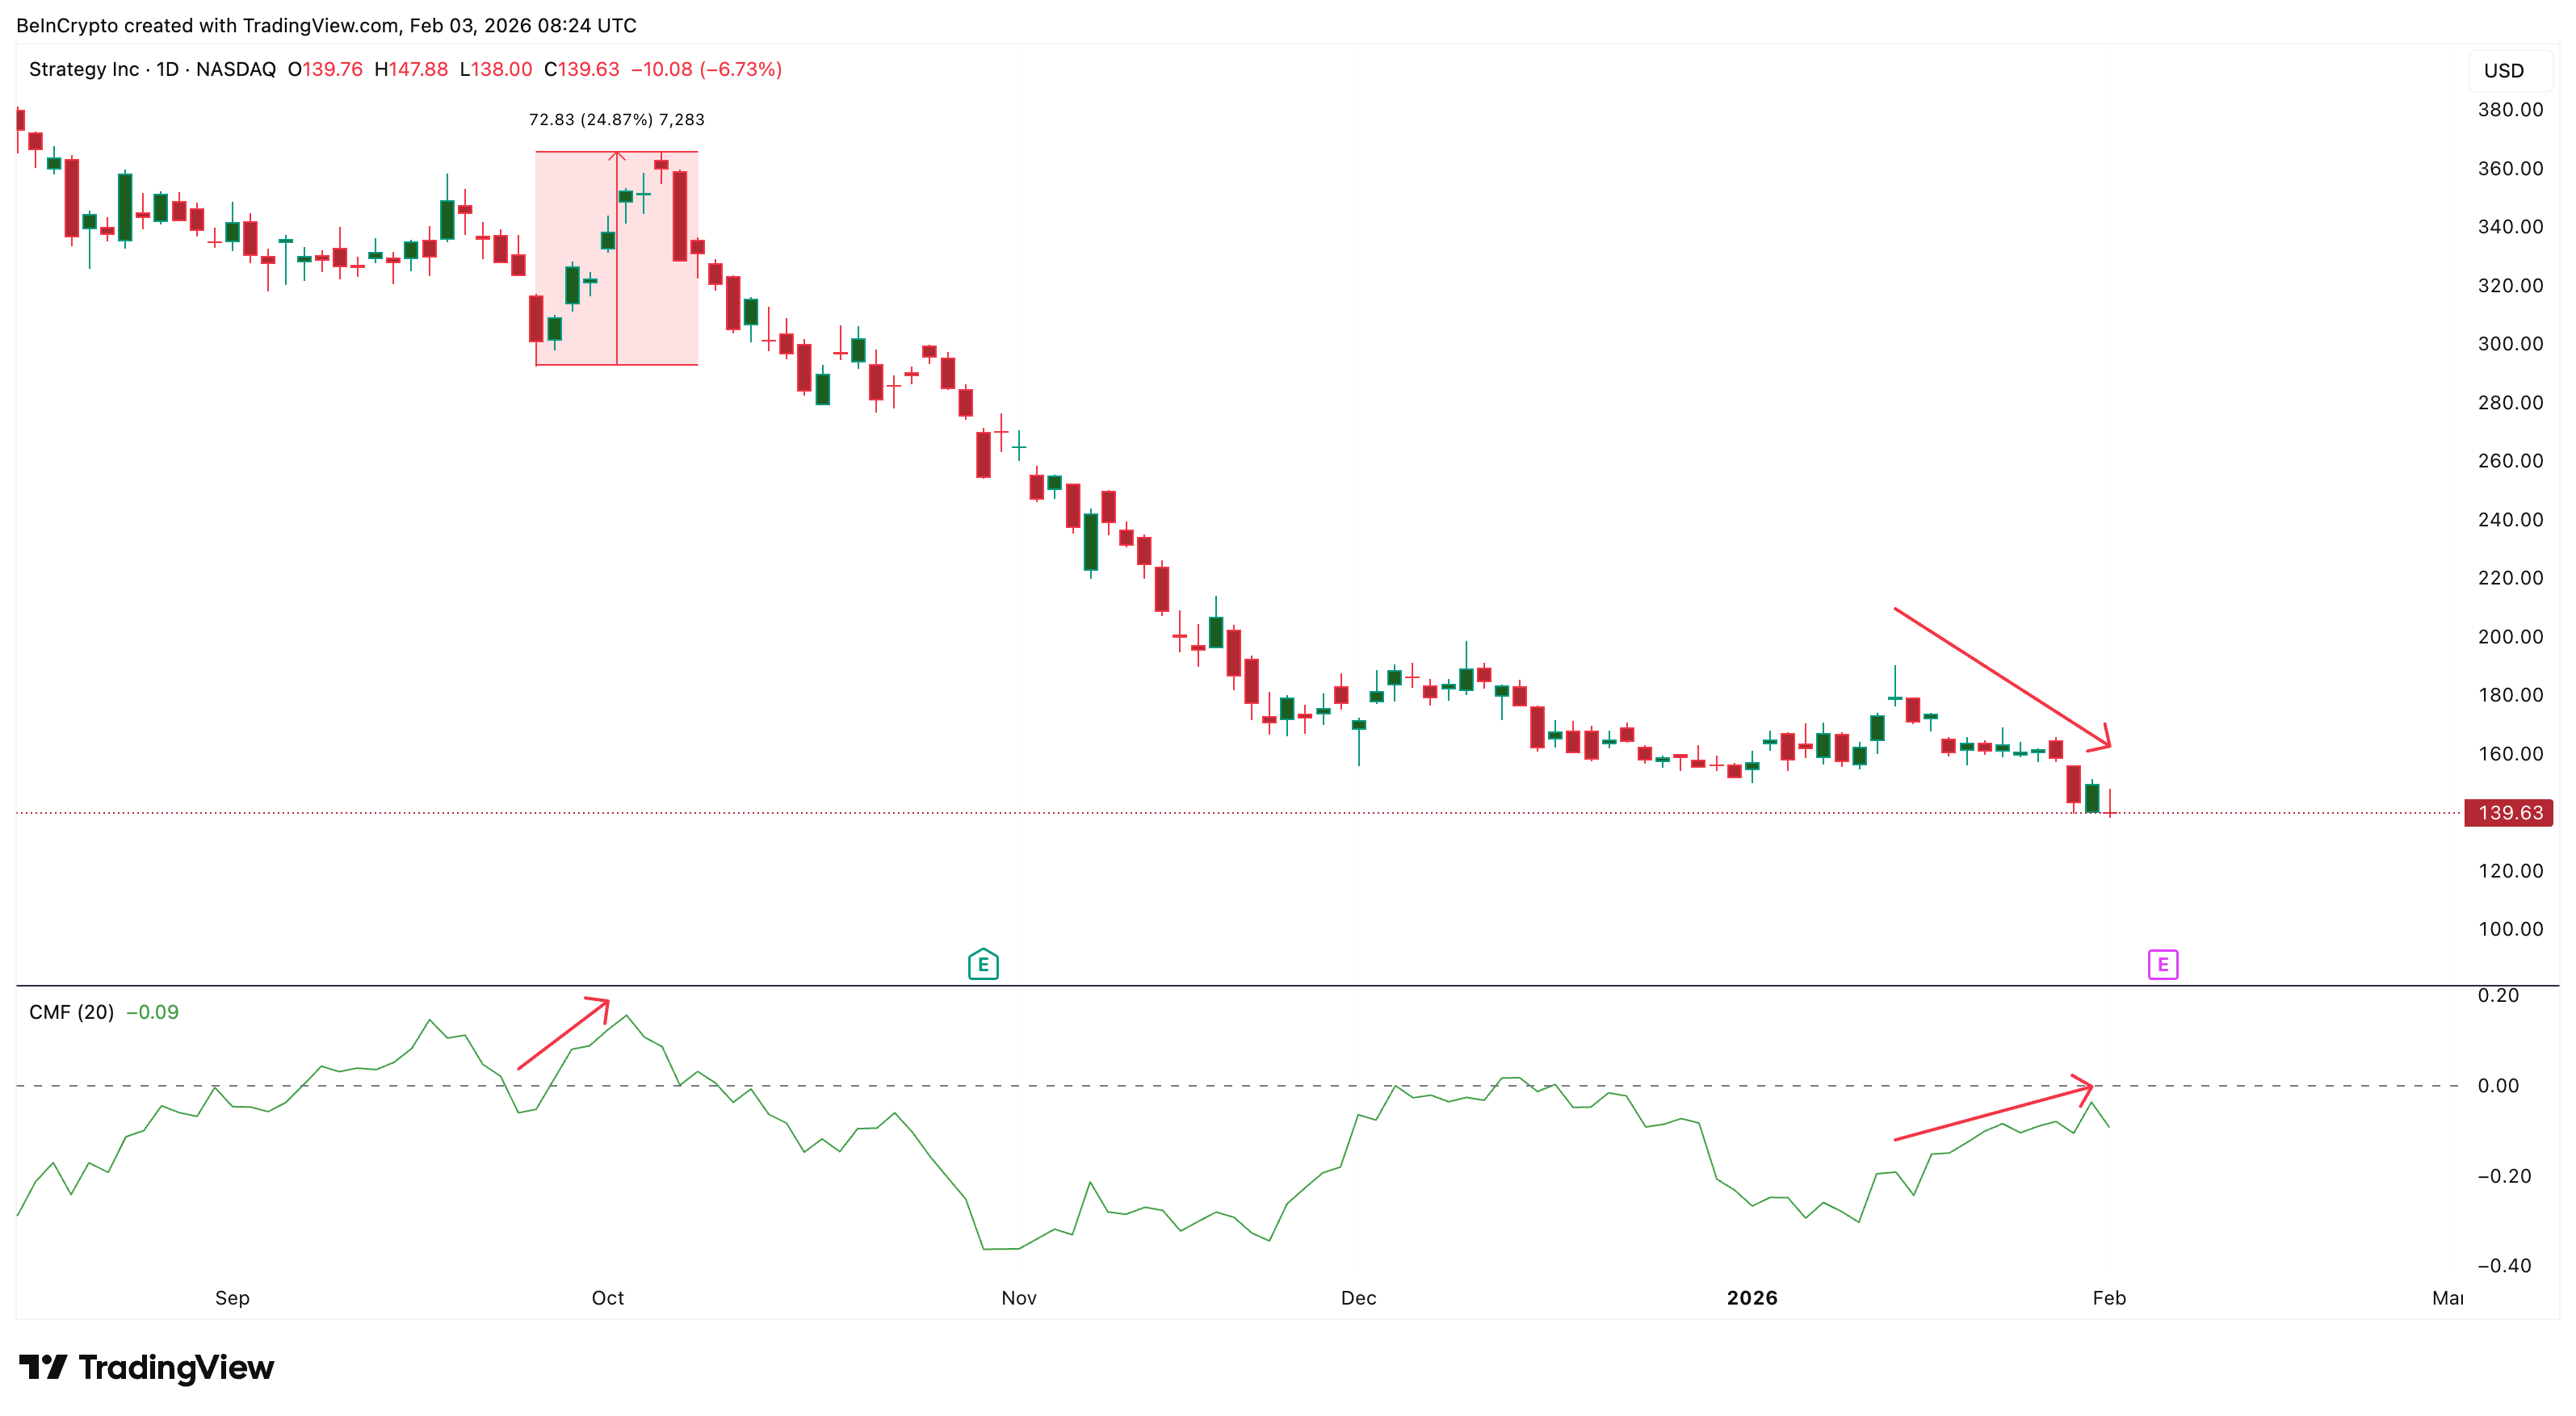
Capital flow data presents a more complex picture. The Chaikin Money Flow (CMF), which measures whether money is entering or leaving an asset using price and volume, has been trending higher since mid-January. Between January 14 and February 2, MSTR stock prices moved lower, yet CMF continued rising. This bullish divergence suggests that large investors were quietly accumulating during weakness.
Want more token insights like this? Sign up for Editor Harsh Notariya’s Daily Crypto Newsletter here.
Sponsored
Sponsored
CMF is now approaching the zero line, which separates net inflows from net outflows. A sustained move above zero would confirm that buying pressure is outweighing selling. The last clean break above this level came in early September, after which the stock rallied nearly 25%. This makes CMF a key trigger for any recovery attempt.
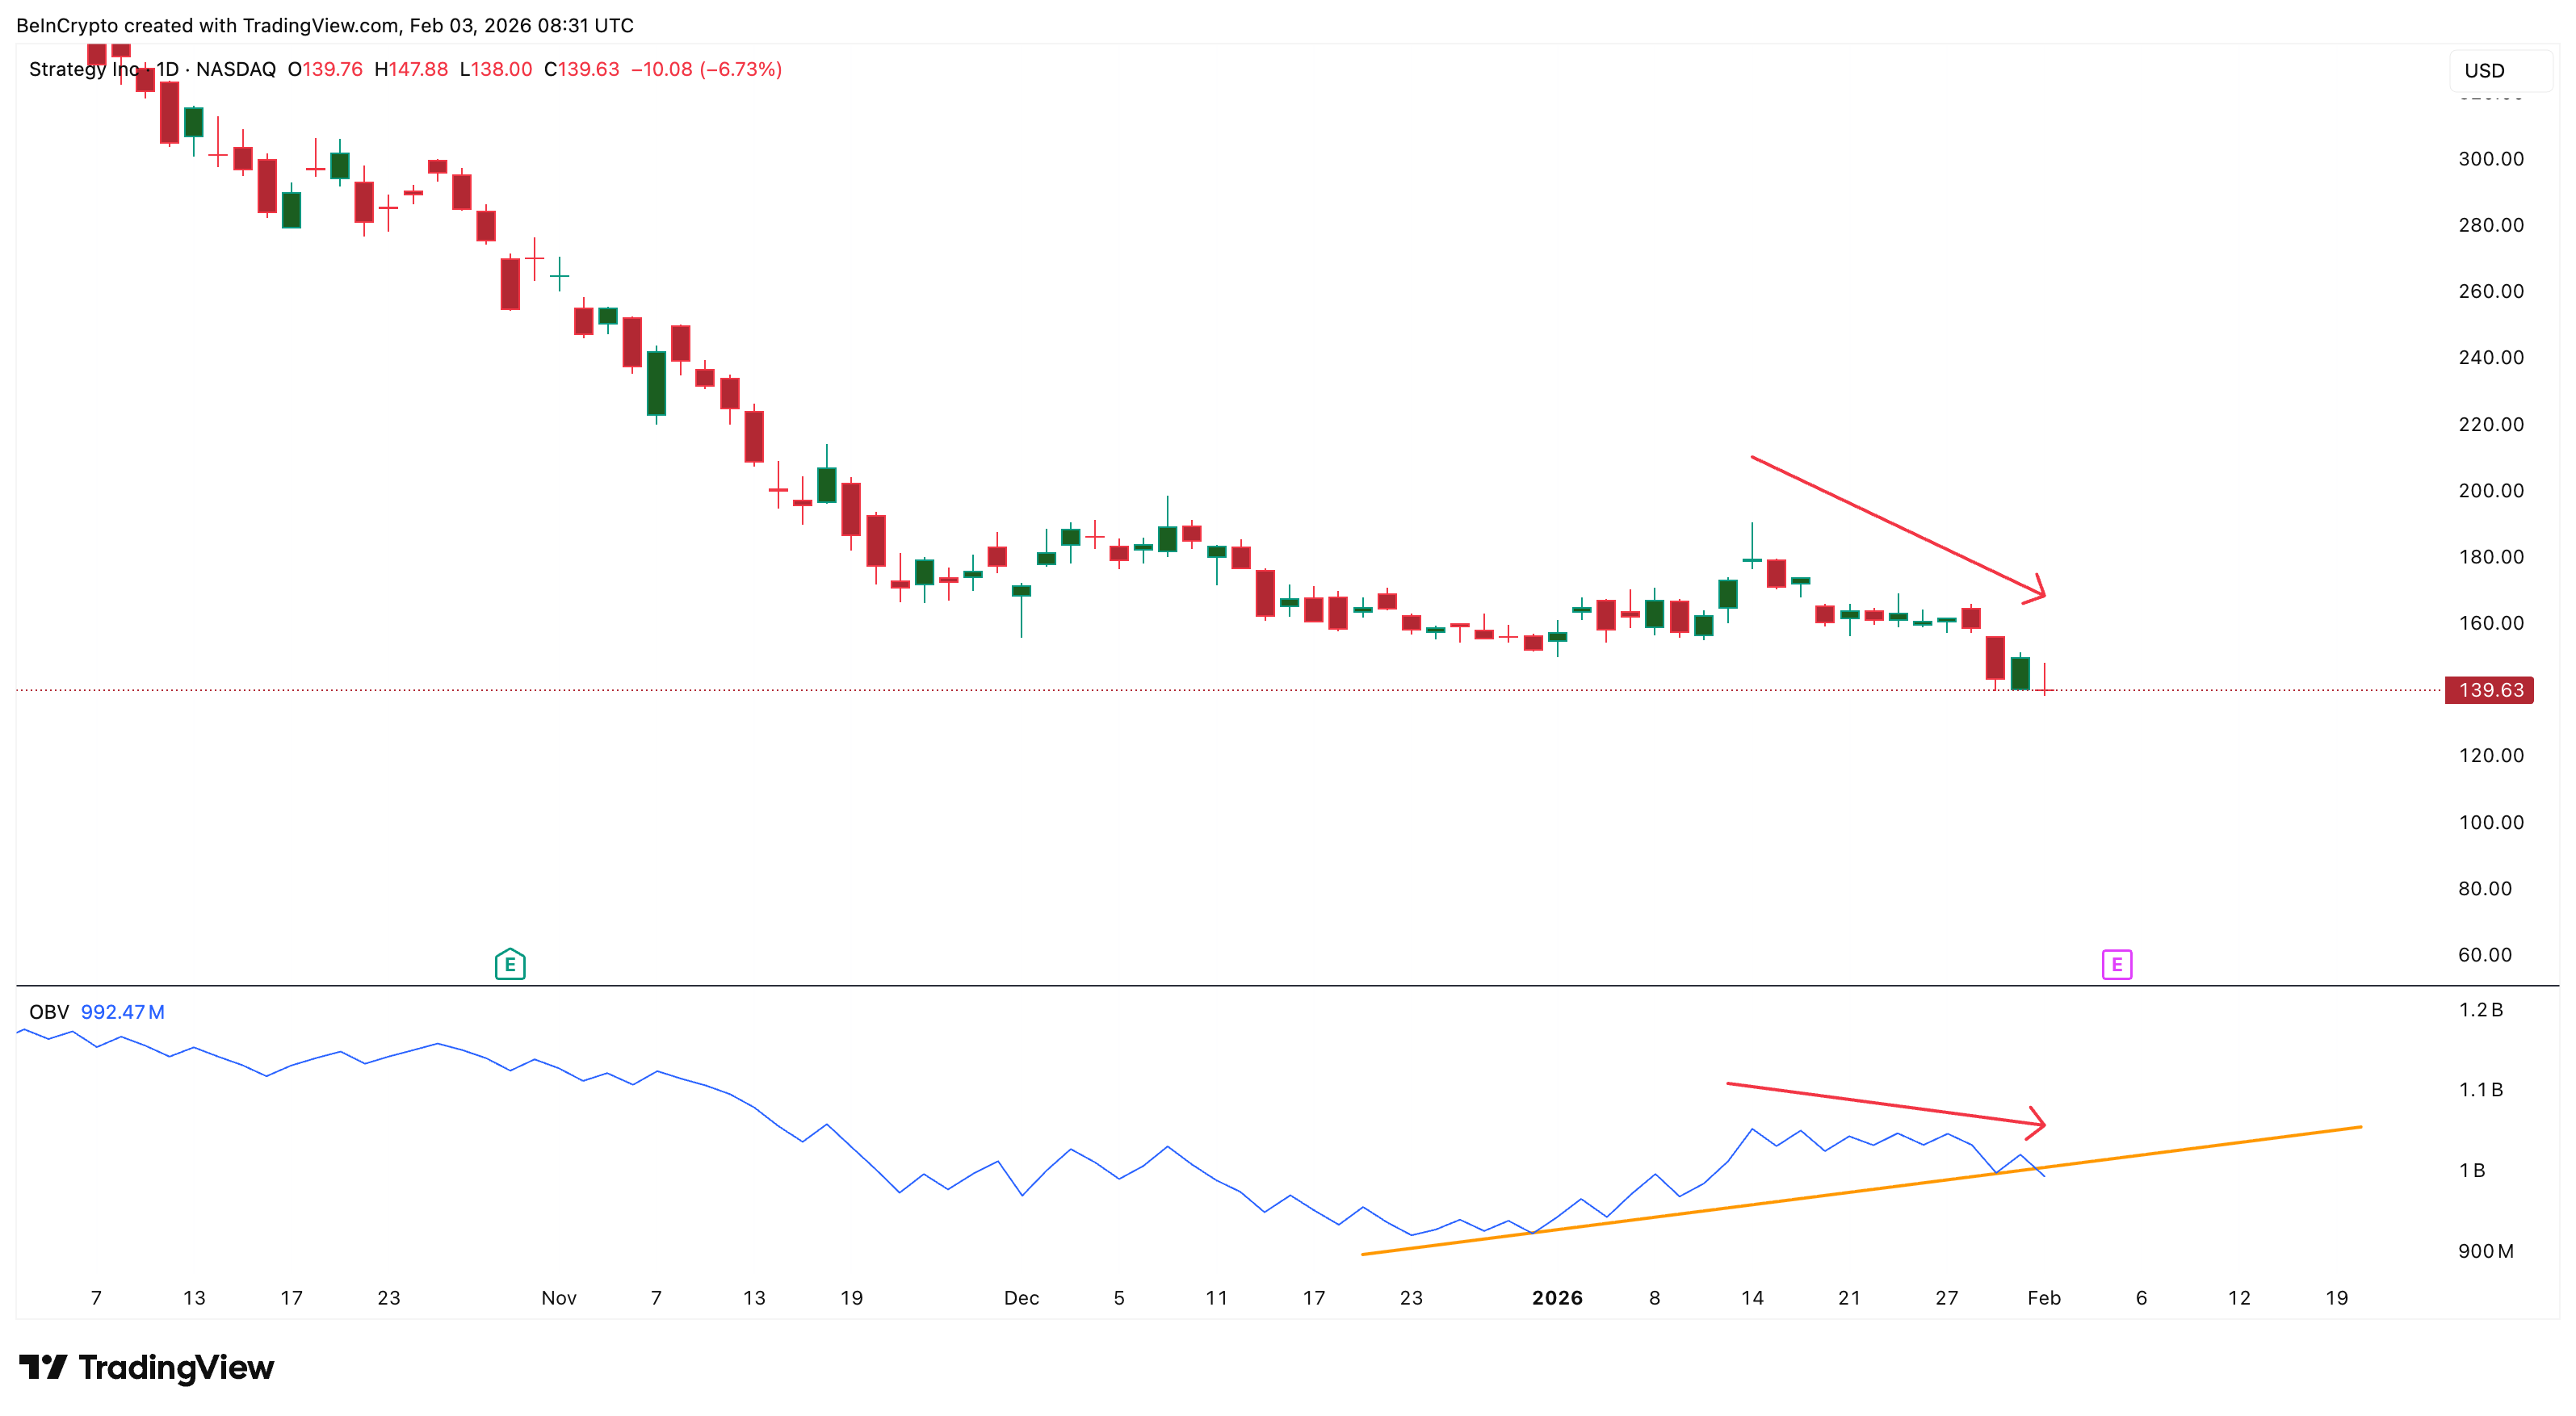
However, the MicroStrategy stock volume tells a different story. On-Balance Volume (OBV), which tracks whether trading volume supports price trends, has been trending lower. During the recent decline, OBV fell alongside price and broke below its rising trendline. This signals weakening participation and fading retail interest.
Together, these indicators send mixed signals. CMF points to selective accumulation by larger players, while OBV shows that broader market engagement remains weak, probably due to the recent cost-basis hit.
When these metrics diverge, rallies often struggle to gain momentum. Without strong participation, upside moves tend to fade quickly. As a result, even if institutions are positioning early, sustained gains will likely require stronger Bitcoin performance.
Sponsored
Sponsored
Key MicroStrategy Stock Price Levels Show a 20% Decision Zone Ahead
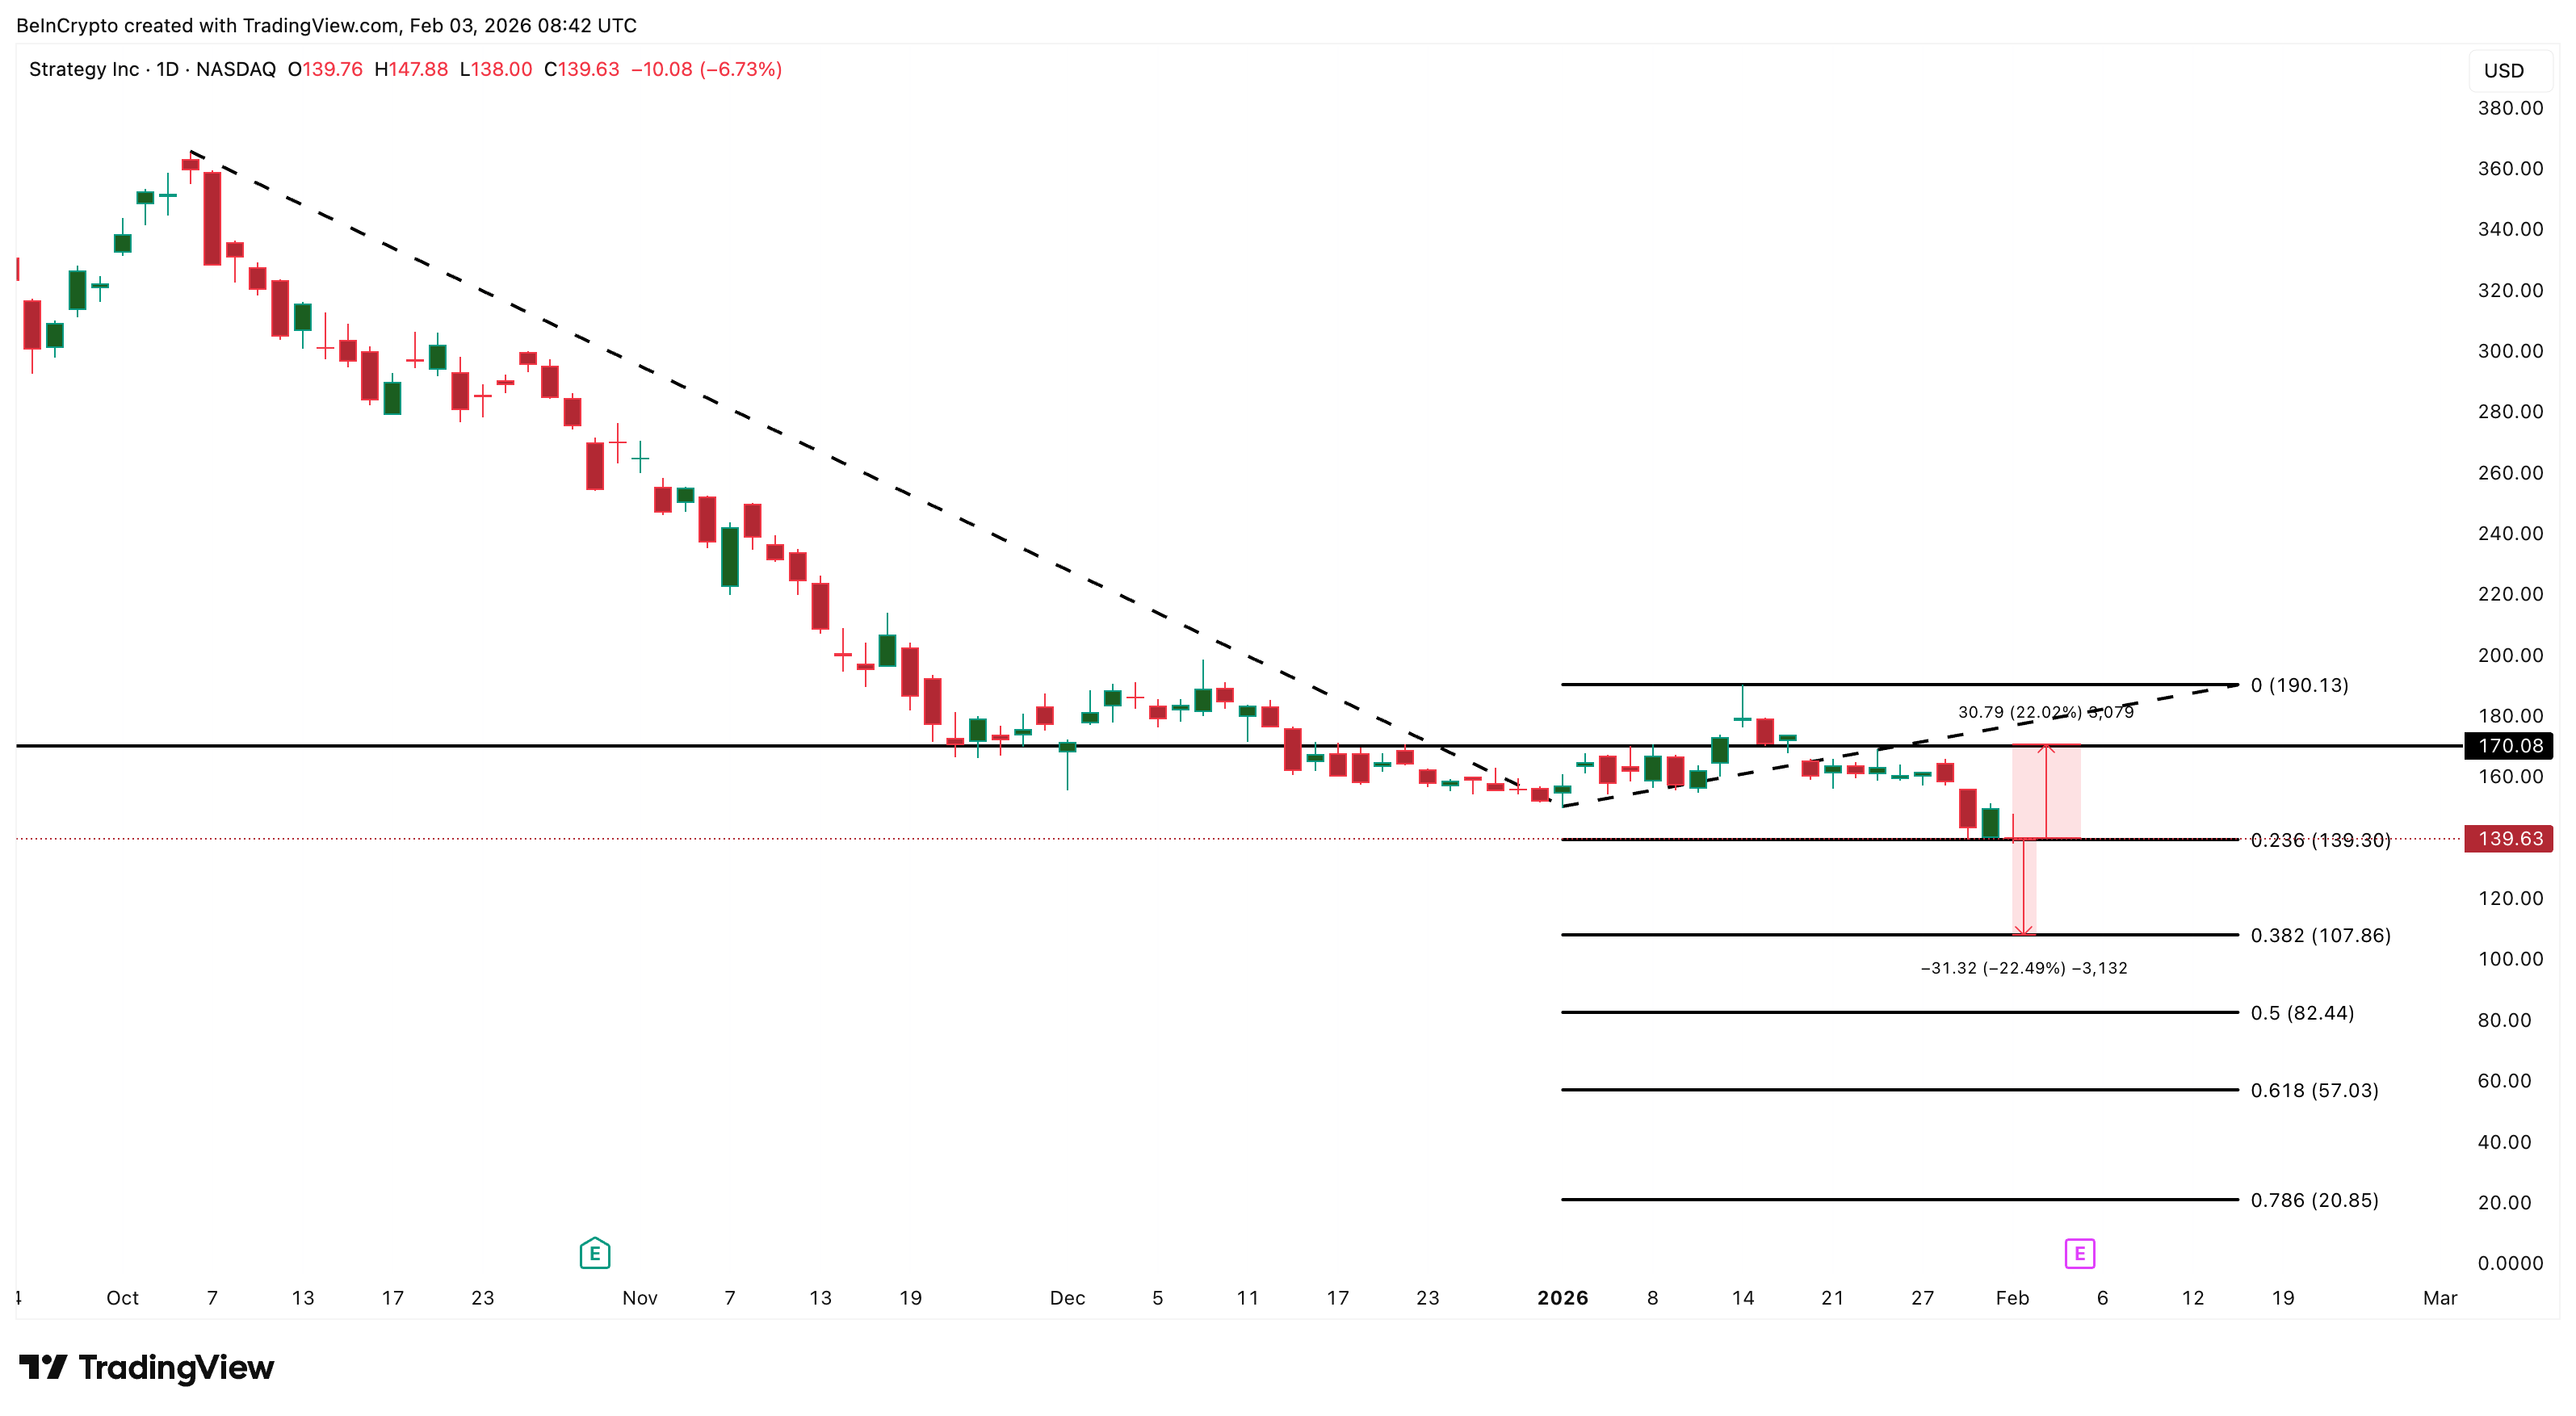
With indicators sending conflicting messages, the MSTR price levels now matter more than ever. The most important support sits near $139. This level has held multiple tests and aligns with Fibonacci support from the October decline, making it the market’s main decision point.
If $139 fails on a daily close, downside risk would increase sharply. In that scenario, prices could slide toward $107, implying roughly 20% further downside. Such a move would likely coincide with renewed weakness in Bitcoin. A deeper breakdown would likely coincide with renewed Bitcoin weakness.
On the upside, the first major resistance is near $170, also at around 20% from current levels. This level has capped several rebound attempts and remains a key barrier. A sustained break above $170 would improve the technical structure and signal returning confidence. Above that, the next hurdle sits near $190.
Clearing this zone would shift the trend decisively bullish and confirm that capital inflows are translating into price strength.
At present, MicroStrategy is centered near $139, with risk toward $107 and resistance near $170. This wide range represents nearly 20% in either direction, forming a two-sided decision zone. Bitcoin’s behavior will likely determine which side breaks first. A move above $80,000 could help MSTR challenge $170, while continued choppiness may prolong consolidation. If Bitcoin turns lower, support near $139 becomes vulnerable.
Until a clear breakout occurs, volatility is likely to remain high, and every rally risks reversal.

Crypto World
Pepe Coin Price Prediction 2026: PEPE Rips 10% on ETF News, DOGE Whales Pile In, but Is Pepeto the Next 100x Meme Before the Binance Listing?
The Pepe Coin price prediction fires back to life after PEPE rallied 10% on April 17 as $39.78M in fresh derivatives capital and ETF speculation pulled the token off the lows, per CoinMarketCap.
The move tracked Canary Capital’s S-1 filing for the first U.S. listed spot PEPE ETF earlier this month. Dogecoin (DOGE) rode the same tape higher as large holders bought 330 million DOGE and pushed price toward $0.10.
Every Pepe Coin price prediction is now getting repriced around the ETF news, and projects with real tools and confirmed listings are the ones big money keeps chasing. Pepeto crossed $9.16M because the wallets inside know $1,000 at this price becomes $100,000 after the Binance listing.
Santiment data shows $39.78M in fresh capital entered PEPE derivatives on April 17, pushing the token up 10% with a positive funding rate of 0.0043% and controlled bullish leverage, per CoinMarketCap. Canary Capital filed an S-1 for the first spot PEPE ETF on April 8. Dogecoin whales bought 330 million DOGE the same week, driving DOGE back above $0.10 with $3.99M in short liquidations.
The daily chart now flashes a confirmed breakout within a rising channel, targeting $0.0000055 on a clean close. The ETF news favors projects with real demand over tokens running on sentiment alone.
Pepe Coin Price Prediction Compared: PEPE, Dogecoin, and the Presale Opportunity Pepeto
Pepeto Builds the Tools Pepe Never Did So the ETF Rotation Flows Here
Pepe proved meme energy alone can mint $11 billion in value and turn $500 entries into millions. It also proved that without tools, every dollar eventually comes back down. Pepeto is building what Pepe never had, which is why $9.16M is already in and the Binance listing moves closer every day.
The contract scanner scores every position for risk before capital moves, catching traps and abnormal large holder activity so traders sidestep the damage that hits everyone else. The zero fee swap engine lets holders move tokens across networks at no cost, breaking the wall that shuts smaller traders out. Both tools carry a completed SolidProof audit and run live today.
The same creator who proved one token and one community can produce $11 billion cofounded Pepeto, with a Binance exchange veteran leading development. The last stage closed early, this stage fills while the market watches, the same pattern that preceded every presale to listing move that made early buyers rich.
Pepe (PEPE) Price at $0.0000039 After 10% Rally on ETF Speculation
Pepe (PEPE) trades at $0.0000039 on April 17 per CoinMarketCap, sitting 87% below the $0.000028 all time high with a $1.5 billion cap.
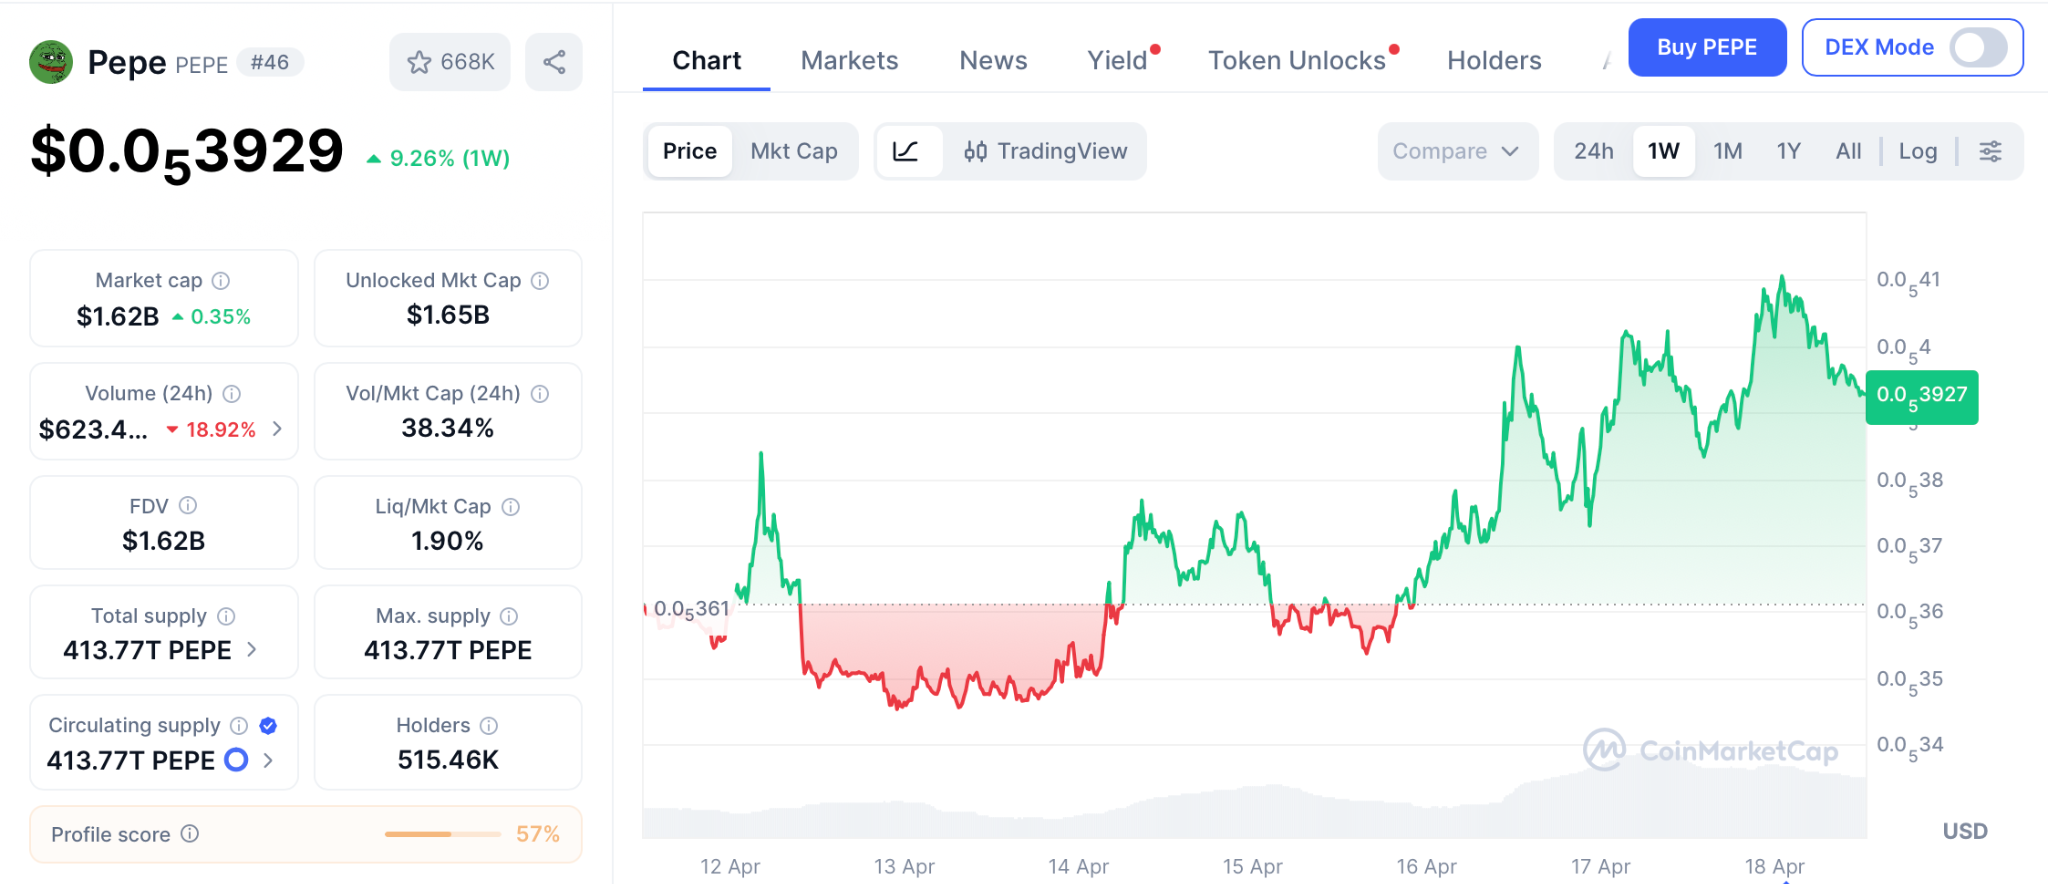
The 10% rally arrived on $39.78M in derivatives inflows and Canary Capital’s S-1 for the first spot PEPE ETF. Support holds at $0.0000036 with resistance at $0.00000408 and $0.0000055 above.
DigitalCoinPrice projects PEPE between $0.0000057 and $0.0000072 for 2026, roughly 55% to 95% from here. That math still takes months, while presale to listing entries need one event to deliver multiples no meme coin recovery can match.
Dogecoin (DOGE) Price at $0.98 as Large Holders Buy 330M DOGE in a Week
Dogecoin (DOGE) trades at $0.98 on April 17 per CoinMarketCap, sitting 86% below its $0.7376 record. Large holders bought 330 million DOGE this week, pushing price above the key $0.10 resistance. Spot and derivatives volumes surged 62% and 56%.
Without a supply cap, every rally faces inflation pressure, and DOGE needs a supercycle to deliver the multiples presale entries with confirmed listings ahead produce from a single event.
Conclusion
Pepe already proved meme coins mint millionaires, and the ETF rally ripping 10% out of the chart today just confirmed smart money still bets on this lane, but the biggest returns in crypto history never came from chasing a recovery already in motion. They came from catching presale pricing the candle before a confirmed listing printed, every single time.
PEPE has the ETF news and DOGE has the brand, but neither holds what Pepeto holds right now, and fresh capital keeps landing on the Pepeto site every hour as this round fills toward the listing window.
Buying Pepeto now at $0.0000001865 is how the wallets reading this setup correctly step into the 100x position every trader who waits one more day ends up paying listing price for.
Click To Visit Pepeto Website To Enter The Presale

FAQs
What is the Pepe Coin price prediction for 2026 after the ETF speculation rally?
Pepe (PEPE) trades at $0.0000039 with analysts projecting $0.0000057 to $0.0000072 for 2026, roughly 55% to 95% upside. PEPE rallied 10% on April 17 as $39.78M in derivatives inflows and Canary Capital’s spot PEPE ETF S-1 filing fueled the move.
How does Pepeto compare to holding Dogecoin (DOGE) for a recovery?
Pepeto at $0.0000001865 targets 100x from a confirmed Binance listing, SolidProof audit, and live exchange. The presale raised $9.16M with 182% APY, while DOGE at $0.98 needs a full supercycle to retake its $0.7376 record.
Disclaimer: This is a Press Release provided by a third party who is responsible for the content. Please conduct your own research before taking any action based on the content.

Crypto World
Analysts Forecast $10 XRP Price Prediction Amid Trump-Iran Geopolitical Breakthrough as AlphaPepe AlphaSwap Tech Outpaces Legacy Asset Returns

Trump confirmed the US is “very close” to a nuclear deal with Iran on April 16 as a 10-day ceasefire between Israel and Lebanon took effect and Pakistan mediated direct talks in Islamabad. Oil prices dropped on the de-escalation and risk assets surged across equities and crypto simultaneously. The XRP price prediction expanded immediately as analysts recalculated what a resolved Middle East conflict means for institutional flows. European Business Magazine projects $5 to $10 for XRP if the CLARITY Act passes into law, while 24/7 Wall Street notes $10 would place XRP’s market cap at $610 billion, roughly where Ethereum peaked in 2025. The geopolitical breakthrough reshapes the macro backdrop for every digital asset. But AlphaPepe does not need a peace deal to deliver. AlphaSwap is already live and outpacing legacy return profiles from Stage 13 at $0.01494 with over $890,000 raised across 7,700 wallets.
The $10 XRP Price Prediction and What the Iran Breakthrough Unlocks
The conflict has been the single largest macro headwind suppressing crypto since February 2026. Oil above $100 kept the Fed locked at 3.5%. XRP fell from $2.40 to $1.35 during the war months. A resolution changes the calculus at every level. Lower oil frees the Fed to signal cuts. Rate signals drive institutional capital back into risk assets. ETF inflows resume at scale.
Standard Chartered’s Kendrick projects $8 if the CLARITY Act passes and ETF inflows reach $10 billion. Zipmex places the 2030 range at $5 to $15 with $10 achievable if Ripple captures meaningful SWIFT settlement volume. A Coinbase and EY-Parthenon survey found 18% of institutional investors already hold XRP and 25% plan to add exposure in 2026. From $1.35 to $10 is a 640% return that requires peace, legislation, and institutional adoption scaling over 12 to 18 months. Legacy asset returns across BTC, ETH, and XRP all measure in single-digit multiples from current prices. That is meaningful wealth preservation. It is not the compressed asymmetry presale positioning offers.
AlphaSwap Tech Outpaces Legacy Returns Before Any of Those Catalysts Arrive
AlphaSwap does not need an Iran deal, a CLARITY Act vote, or ETF inflows to function. It is already live. A cross-chain AI DEX screening every contract for exploit patterns before execution, tracking whale flows across chains in real time, and generating trading fee revenue today. The technology operates in a category where AI now catches 92% of exploited vulnerabilities before human auditors flag them. AlphaPepe puts that capability directly at the retail level through an interface that works now, not after a diplomatic milestone.
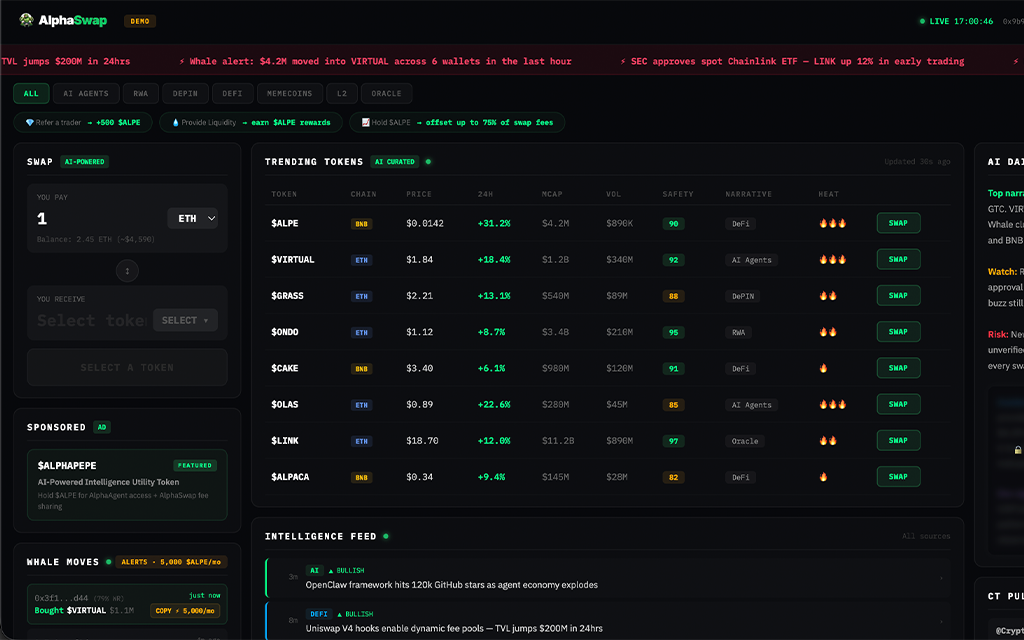
The developer behind AlphaSwap delivered 500 million transactions across Shibarium mainnet. A 10/10 BlockSAFU audit verified the contract with zero flags. Supply capped at 1 billion tokens. Instant delivery. Zero vesting. Stakers earning 85% APR while Q2 approaches. Tier 1 CEX debut follows.
Over $890,000 raised from 7,700 wallets. Stage 13 at $0.01494 with 100 new addresses arriving daily. A $2,500 entry secures 167,336 tokens. Analysts targeting $1.50 value that at $250,904. At $3.50 it crosses $585,676. Buyers at $2,000 or above can apply code ALPHA50 for a 50% bonus. XRP needs peace, legislation, and institutional scaling for 640%. AlphaPepe needs Q2 for a return that outpaces every legacy asset on the board.
Geopolitics Reshape Timelines. AlphaSwap Already Shipped.
The Trump-Iran breakthrough may accelerate the $10 XRP thesis or it may stall at the negotiation table. The presale at $0.01494 with $890,000 raised and a live AI DEX does not fluctuate with diplomatic headlines. Stage 13 is filling and the $1 million milestone approaches.
Click To Visit AlphaPepe Official Website To Enter The Presale
FAQs
Can XRP reach $10 after a Trump-Iran deal?
Analysts project $5 to $10 if CLARITY passes and macro conditions improve. A peace deal would lower oil, free the Fed, and accelerate institutional ETF inflows toward the $10 billion threshold XRP needs.
How does AlphaSwap outpace legacy asset returns?
A live AI DEX at Stage 13 pricing of $0.01494 with analyst targets of $1.50 to $3.50 offers 100x to 234x versus single-digit multiples from BTC, ETH, and XRP at current levels.
How close is AlphaPepe to raising $1M?
Over $890,000 across 7,700 wallets at $0.01494. The $1 million mark is approaching with 100 new addresses entering daily.
Disclaimer: This is a Press Release provided by a third party who is responsible for the content. Please conduct your own research before taking any action based on the content.
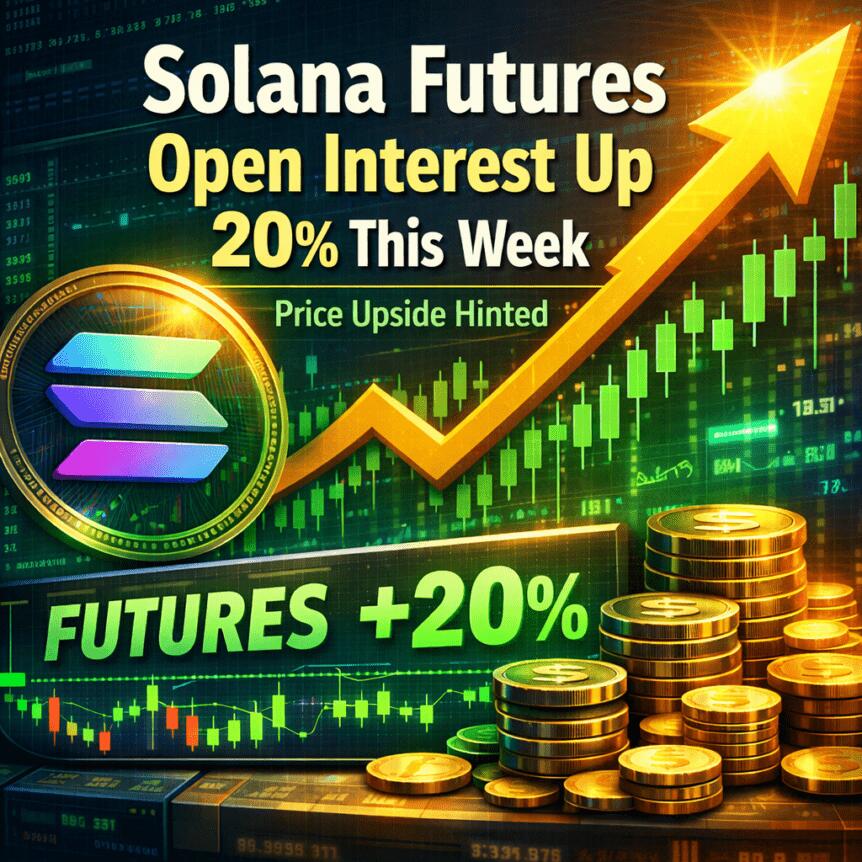
Solana’s SOL token has rallied about 10% over the past five days, trading at a three‑week high as broader risk appetite improves following news of a ceasefire extension between the United States and Iran. Despite the price strength, SOL remains a relative laggard in 2026, with the token underperforming the wider crypto market year-to-date.
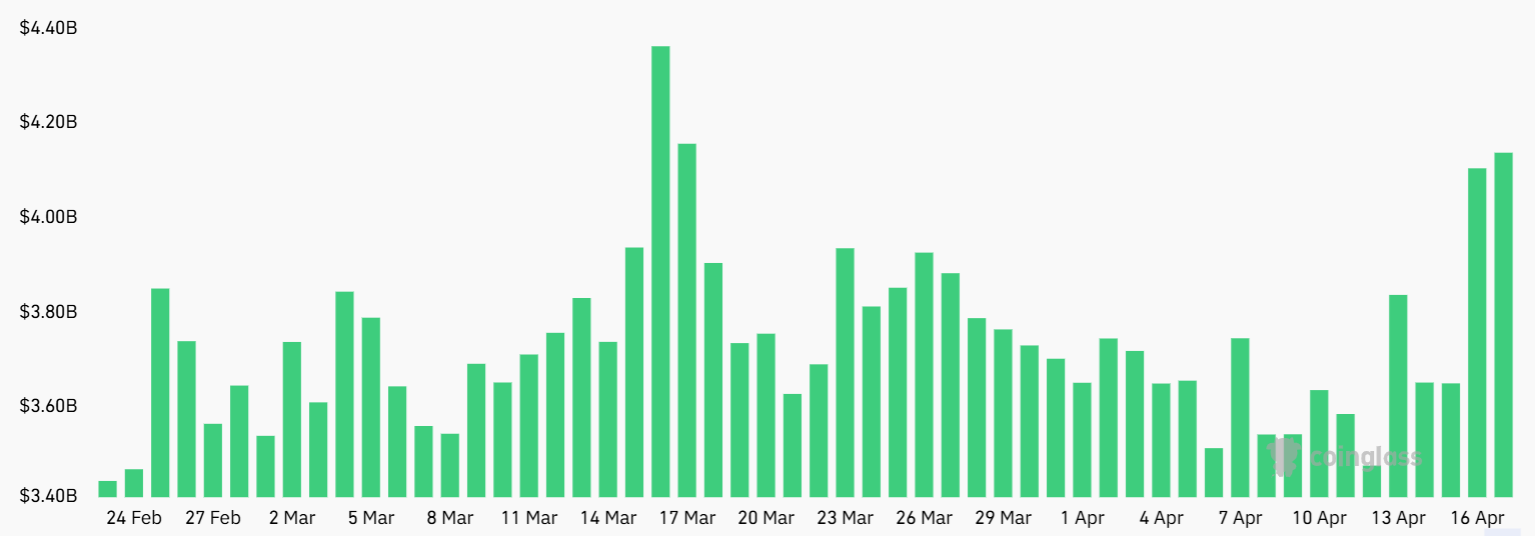
Derivative markets point to renewed interest in SOL. Aggregate SOL futures open interest rose to about $4.2 billion on Friday, up from roughly $3.5 billion at the start of the week. While higher open interest signals growing participation, the perpetual funding rate has hovered around 3% annually, suggesting that buyers are not yet fully convinced and that leverage demand remains moderate. In a neutral setting, funding rates typically sit higher—roughly 5% to 10% annually—so the current reading implies cautious optimism rather than robust bullish conviction.
As Solana’s price action unfolds, on-chain activity presents a mixed picture. Solana continues to lead in decentralized exchange (DEX) volume and total value locked (TVL), underscoring its ongoing utility and network robustness. Yet Solana’s DApp revenue has softened in recent months, currently averaging around $16 million per week. By comparison, Ethereum’s DApp revenue has hovered around $10 million weekly, with BNB Chain at roughly $4 million, suggesting broader cooling in on-chain monetization across major ecosystems even as the Solana ecosystem remains an outsize DEX and TVL actor.
Key takeaways
-
Solana remains dominant in DEX volume and TVL, even as SOL underperforms the broader crypto market in 2026.
-
SOL futures open interest rose to about $4.2 billion, indicating expanding participation, while the 3% annualized funding rate signals cautious conviction from bulls.
-
On-chain revenue trends show Solana’s DApp ecosystem still active but trending lower, with weekly DApp revenue near $16 million, versus higher activity on other chains.
-
A wave of memecoin activity contributed to demand for SOL futures, echoing a pattern seen in prior bullish cycles and potentially foreshadowing a renewed price push.
-
Analysts note that if memecoin enthusiasm persists and hedging pressure eases, SOL could revisit upside targets toward the $100 level, though macro catalysts and funding dynamics will shape the path there.
Solana’s market position amid price discord
Despite SOL’s 2026 price gap relative to some peers, Solana’s core strengths remain intact. The network continues to attract substantial DEX activity and holds a commanding share of TVL, reinforcing its role as a leading layer-1 for on-chain trading and liquidity provisioning. This structural advantage matters for traders and builders who rely on Solana’s low-latency design and ambitious wallet integration to power a broad spectrum of DeFi and Web3 apps.
Nevertheless, the broader price action tells a different story. SOL has lagged the wider market this year, suggesting that speculative drivers have cooled and that upside risk hinges on fresh catalysts beyond the continuation of positive on-chain fundamentals. For investors, the divergence between network dominance and price performance underscores a nuanced risk-reward dynamic: the chain’s intrinsic activity remains robust, but market enthusiasm requires new leverage‑driving momentum.
Derivatives backdrop: liquidity, leverage, and what to watch
The jump in open interest to $4.2 billion indicates growing participation from both institutional and retail traders interested in SOL’s volatility and spread efficiency. However, the persistent 3% annualized funding rate points to a market that is not fully pricing in a strong directional move. In calmer funding environments, sustained positive funding rates reflect ongoing demand for long positions; a reversion toward higher rates could accompany a renewed push higher in SOL, while a drop or negative rate would signal mounting short interest and potential downside pressure.
Traders will want to monitor whether the funding dynamic shifts as macro headlines evolve. A shift toward higher funding rates could accompany a more confident bull case, whereas persistent lower rates might imply a tighter range or consolidation phase. In this sense, perpetual futures markets offer a live read on market sentiment, even as they do not guarantee a specific price path.
Memecoin momentum and the DApp revenue narrative
Beyond the technical and macro layers, meme-driven demand has a notable footprint on SOL sentiment. A cluster of memecoins surged 40% or more over a short window, contributing to higher futures activity and capturing speculative interest around Solana. This pattern echoes earlier cycles where Solana benefited from surging user activity and social hype linked to memecoins, including iterations tied to high-profile tokens. While memecoins can catalyze short-term gains, they also introduce volatility that traders must manage carefully.
At the same time, Solana’s ongoing commitments—robust validator security, a smooth user experience through Web3 wallets, and continued DEX leadership—provide a foundational tailwind for sustained activity. The ecosystem’s ability to translate on-chain traffic into real-use cases will be critical if momentum from memecoins wanes and investors seek more durable value drivers.
Where next for SOL? Risks, rewards, and the watchpoints
The potential for a renewed move toward the $100 level exists in a confluence of favorable conditions: easing geopolitical risk reducing macro risk aversion, a continued uptick in memecoin-driven demand, and a pickup in leveraged exposure if funding signals shift higher. Yet several caveats remain. The broader crypto market’s appetite for DApps and on-chain revenue remains a key variable; if user activity cools further or if competing ecosystems regain traction, SOL’s upside could be constrained despite favorable derivatives signals.
What to watch next includes the trajectory of SOL’s funding rate and open interest, any shifts in DApp monetization trends, and how memecoin liquidity evolves in the near term. Macro headlines—ranging from commodity price shifts to regulatory developments—could also tilt momentum in surprising ways, given Solana’s sensitivity to risk sentiment and liquidity conditions.
As investors weigh the signals, the path to a meaningful upside will likely hinge on a combination of renewed DEX and TVL strength, a sustained pickup in on-chain activity, and a favorable macro backdrop that encourages broader leverage in SOL futures. Until then, volatility remains a defining feature of SOL’s trading narrative.
Readers should monitor how open interest evolves and whether the funding rate firms up or ebbs with changing sentiment, as these reads often precede more tangible price moves. The next few weeks will be telling for whether Solana can reconcile its network momentum with a fresh cycle of price appreciation.


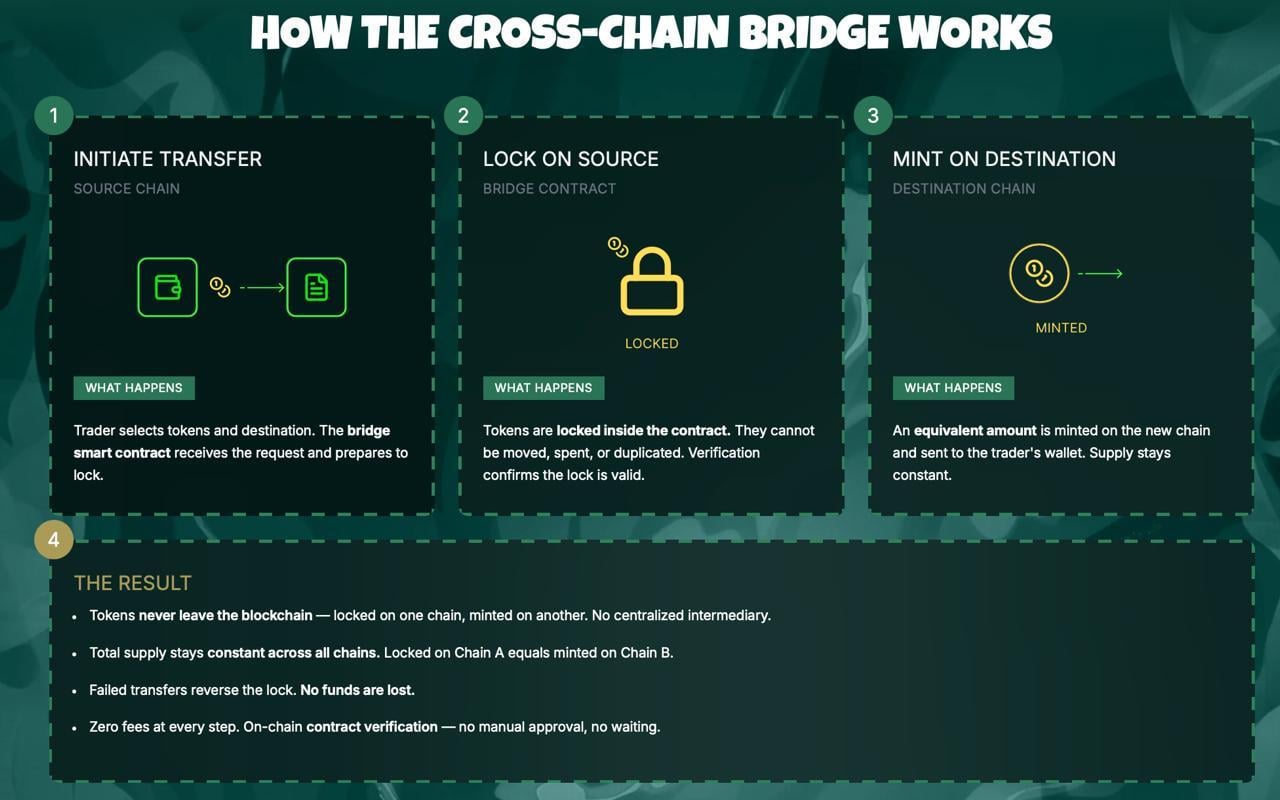
A cross-chain bridge holding nearly a fifth of a restaked ether token’s circulating supply just got drained, and the fallout is moving through DeFi faster than Kelp DAO can pause contracts.
An attacker drained 116,500 rsETH (restaked ether) from Kelp DAO’s LayerZero-powered bridge at 17:35 UTC on Saturday, worth roughly $292 million at current prices and representing about 18% of rsETH’s 630,000 token circulating supply tracked by CoinGecko.
LayerZero is a cross-chain messaging layer, or the infrastructure that lets different blockchains send verified instructions to each other. Kelp DAO is a liquid restaking protocol, which takes user-deposited ETH, routes it through EigenLayer to earn additional yield on top of standard Ethereum staking rewards, and issues rsETH as a tradeable receipt.
The bridge that was drained held the rsETH reserve backing wrapped versions of the token deployed on more than 20 other blockchains.
The attacker tricked LayerZero’s cross-chain messaging layer into believing a valid instruction had arrived from another network, which triggered Kelp’s bridge to release 116,500 rsETH to an attacker-controlled address.
Kelp’s emergency pauser multisig froze the protocol’s core contracts 46 minutes after the successful drain, at 18:21 UTC. Two follow-up attempts at 18:26 UTC and 18:28 UTC both reverted, each carrying the same LayerZero packet attempting another 40,000 rsETH drain worth roughly $100 million.
rsETH is deployed across more than 20 networks including Base, Arbitrum, Linea, Blast, Mantle and Scroll, with LayerZero’s OFT standard handling the cross-chain movement.
The rsETH held in the bridge was the reserve backing wrapped versions on every layer 2 blockchain, or networks that run atop Ethereum.
With that reserve drained, holders on non-Ethereum deployments now face the question of whether their tokens have anything underneath them, which creates a feedback loop where panic redemptions on L2s pressure the unaffected Ethereum supply, potentially forcing Kelp to unwind restaking positions to honor withdrawals.
The contagion list is long and still growing.
Aave froze rsETH markets on V3 and V4 within hours, with founder Stani Kulechov affirming the exploit was external and Aave’s contracts were not compromised. SparkLend and Fluid froze their rsETH markets.
AAVE fell about 10% as the market priced potential bad debt.
Kelp, a product under the KernelDAO umbrella, acknowledged the incident in its first public X post at 20:10 UTC, nearly three hours after the drain. The protocol said it was investigating with LayerZero, Unichain, its auditors and outside security specialists. It has not disclosed how the exploit bypassed the bridge’s validation logic.
Whether rsETH holds peg through the weekend depends on how much of the cross-chain float tries to redeem into ETH on Ethereum and whether Kelp can recover any portion of the stolen funds before the Tornado Cash trail goes cold.
The hack lands in an unusually hostile stretch for DeFi. Solana-based perpetuals protocol Drift was drained of about $285 million on April 1 in an attack later linked to North Korea-affiliated actors, and at least a dozen smaller protocols have been exploited in the weeks since, including CoW Swap, Zerion, Rhea Finance and Silo Finance.
Kelp’s $292 million loss is now the largest DeFi exploit of 2026, overtaking Drift by a few million dollars.
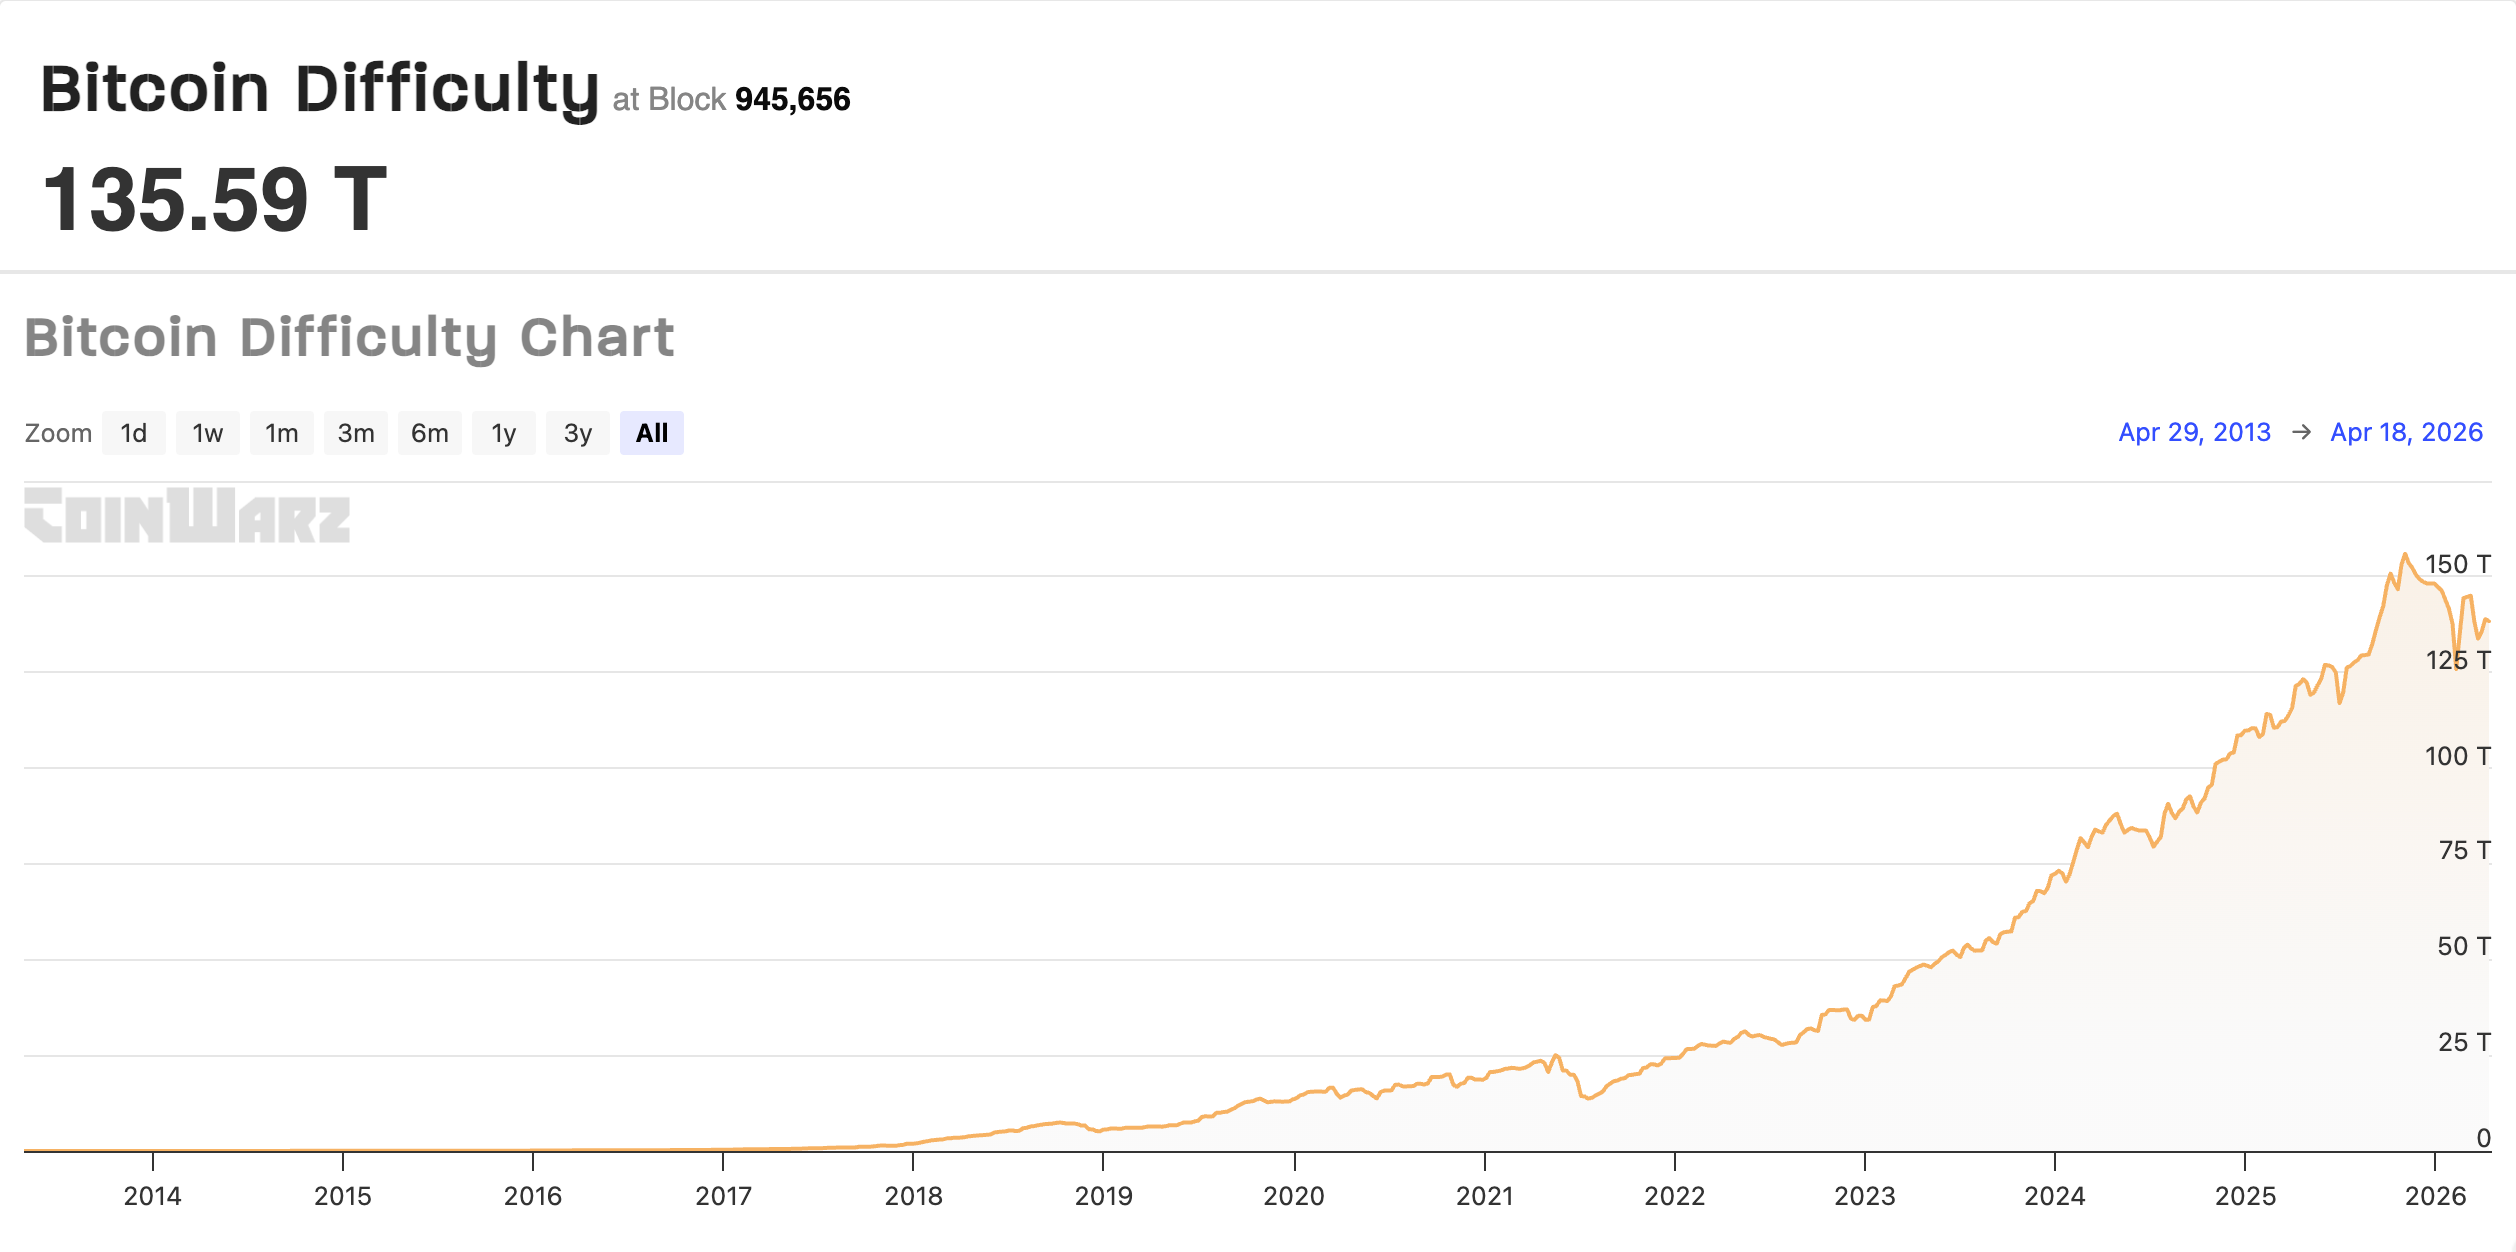
The Bitcoin (BTC) mining difficulty, the relative challenge of adding new blocks to the BTC blockchain, fell on Saturday, amid public mining companies selling record amounts of BTC to cover operating expenses.
The Bitcoin mining difficulty fell to about 135.5 T, a modest decrease of about 1.1% over the last 24 hours, according to data from CoinWarz. Mining difficulty is also projected to increase in the next adjustment period. CoinWarz said:
“The next Bitcoin difficulty adjustment is estimated to take place on May 01, 2026, 01:24:54 PM UTC, increasing the Bitcoin mining difficulty from 135.59 T to 137.43 T, which will take place in 1,865 blocks, about 12 days, 18 hours, and 41 minutes from now.”

Bitcoin miners have faced mounting challenges over the past year, as reduced block rewards, rising energy prices, a crypto bear market and geopolitical shocks create economic headwinds for miners.
Related: Solo Bitcoin miner bags $210K Bitcoin block reward
Public mining companies sell record amounts of BTC
Publicly traded Bitcoin mining companies sold more BTC in Q1 2026 than all four quarters of 2025 combined, according to TheEnergyMag.
Mining companies MARA, CleanSpark, Riot, Cango, Core Scientific and Bitdeer, sold more than 32,000 BTC in total during Q1 2026, TheEnergyMag said.
The combined sales surpassed the 20,000 BTC sold in Q2 2022, the same quarter as the collapse of the Terra-Luna ecosystem, which plunged crypto into an extended bear market.
Miners periodically sell their BTC to cover operating expenses, which are denominated in fiat currency.
However, as the cost of mining a single BTC increases past spot market prices, many BTC mining companies are now treading water.

Up to 20% of Bitcoin miners are unprofitable under current economic conditions, according to asset manager CoinShares’ Q1 2026 mining report.
“Q4 2025 marked the most challenging quarter for Bitcoin miners since the April 2024 halving,” the CoinShares report said.
The authors cited the “sharp” BTC correction in October 2025, which slashed BTC’s price from a high of about $125,000 to about $86,000 by December 2025, and the rising computational difficulty of adding blocks as headwinds for the mining industry.
Magazine: 7 reasons why Bitcoin mining is a terrible business idea
Key takeaways:
-
Solana maintains its market dominance in DEX volume and TVL despite SOL’s underperformance versus its peers.
-
Easing sell pressure from volatile geopolitics and a resurgence in memecoin activity could catalyze a SOL price rally to $100.
Solana’s native token SOL (SOL) gained 10% within five days, reaching a three-week high on Friday. This price movement followed a generalized excitement after the US and Iran announced a ceasefire extension, which led to an 8% decline in crude Brent oil prices. Demand for SOL futures surged as open interest jumped by 20% since Sunday, causing traders to question if the SOL price is bound for $100.

SOL futures aggregate open interest rose to $4.2 billion on Friday, up from $3.5 billion on Sunday. While an increased appetite for leveraged positions indicates institutional investor participation, longs (buyers) and shorts (sellers) remain matched at all times. However, any eventual imbalance in the demand for leveraged positions should be visible within the perpetual futures markets.
Under neutral conditions, the annualized funding rate should range between 5% and 10% to compensate for the cost of capital.

Data showing a 3% rate signals low confidence from bulls, although this remains distant from the extreme fear levels seen on April 7 when SOL prices plunged below $80. A negative funding rate indicates that shorts are paying to keep positions open, which is fairly unusual in cryptocurrency markets.

Despite the recent gains, SOL has underperformed the broader cryptocurrency market by 13% in 2026. A reduced appetite for decentralized applications (DApps) likely played a part, but the Solana network remains a strong contender due to its vice-leadership position in Total Value Locked and dominance in decentralized exchange (DEX) volumes.

Solana network DApp revenues have trended down over the past few months, currently totaling nearly $16 million per week. However, this trajectory is not exclusive to Solana; DApps on the Ethereum network accrued $10 million in revenue over the past week, while BNB Chain stood at $4 million. Fading interest in DEX activity remains the primary driver behind this declining revenue across the industry.
Memecoin rally, shorts covering could send SOL to $100
Multiple memecoins jumped 40% or higher between Wednesday and Friday, which likely contributed to the heightened demand for SOL futures.

During the previous memecoin rally in early 2025, Solana emerged as a leader in terms of users and activity, especially following the launch of the Official Trump (TRUMP) memecoin. Consequently, any sign of increased demand for memecoins is typically viewed as a positive indicator for SOL price.
Related: Bitcoin rises, oil falls after Iran says Strait of Hormuz is open
Solana has proved itself a serious contender for the next wave of DApp users, whether centered on AI agents or speculative trading. The robustness of its validators and the integrated user experience provided by Web3 wallets make a compelling case for a sustained SOL price rally.
Ultimately, weak demand for bullish leverage on futures places little constraint on SOL regaining momentum. Reduced pressure from the war in Iran may serve as the catalyst for SOL shorts to cover their positions, providing the necessary spark for a potential upside toward $100.
This article is produced in accordance with Cointelegraph’s Editorial Policy and is intended for informational purposes only. It does not constitute investment advice or recommendations. All investments and trades carry risk; readers are encouraged to conduct independent research before making any decisions. Cointelegraph makes no guarantees regarding the accuracy or completeness of the information presented, including forward-looking statements, and will not be liable for any loss or damage arising from reliance on this content.


The largest aluminum producer in the U.S., Alcoa, is close to selling its idle Massena East smelter in upstate New York to bitcoin firm New York Digital Investment Group (NYDIG), as it offloads dormant assets and taps demand for energy-ready industrial sites.
The company’s chief executive officer, Bill Oplinger, said the company is in advanced talks and expects the deal to close “in the middle part of this year,” Bloomberg reports.
The site, located along the St. Lawrence River, has sat idle since 2014 when Alcoa shut it down due to high operating costs and global competition.
The appeal lies in the site’s power, not the metal itself. Aluminum smelters are built to run around the clock, drawing large amounts of electricity through dedicated substations and transmission lines. When they close, that infrastructure remains.
For bitcoin miners and data center developers, this can cut years off the time required to secure grid access.
Massena East also has access to hydropower from the New York Power Authority, a draw for firms seeking low-cost and carbon-free energy.
The deal reflects a broader shift. Earlier this year, Century Aluminum sold a Kentucky smelter to TeraWulf (WULF), which plans to build a digital infrastructure campus supporting high-performance computing and AI.
Leading bitcoin treasury company Strategy (MSTR) has proposed shifting the dividend payment schedule on its perpetual preferred equity, Stretch (STRC), from monthly to semi-monthly.
The amendment, outlined in Strategy’s investor presentation, would keep the 11.5% annualized dividend rate and total annual obligations unchanged (currently $1.2 billion). Holders would receive payouts roughly every two weeks instead of once a month, with the first semi-monthly payment expected on July 15, following the June 8 shareholder vote.
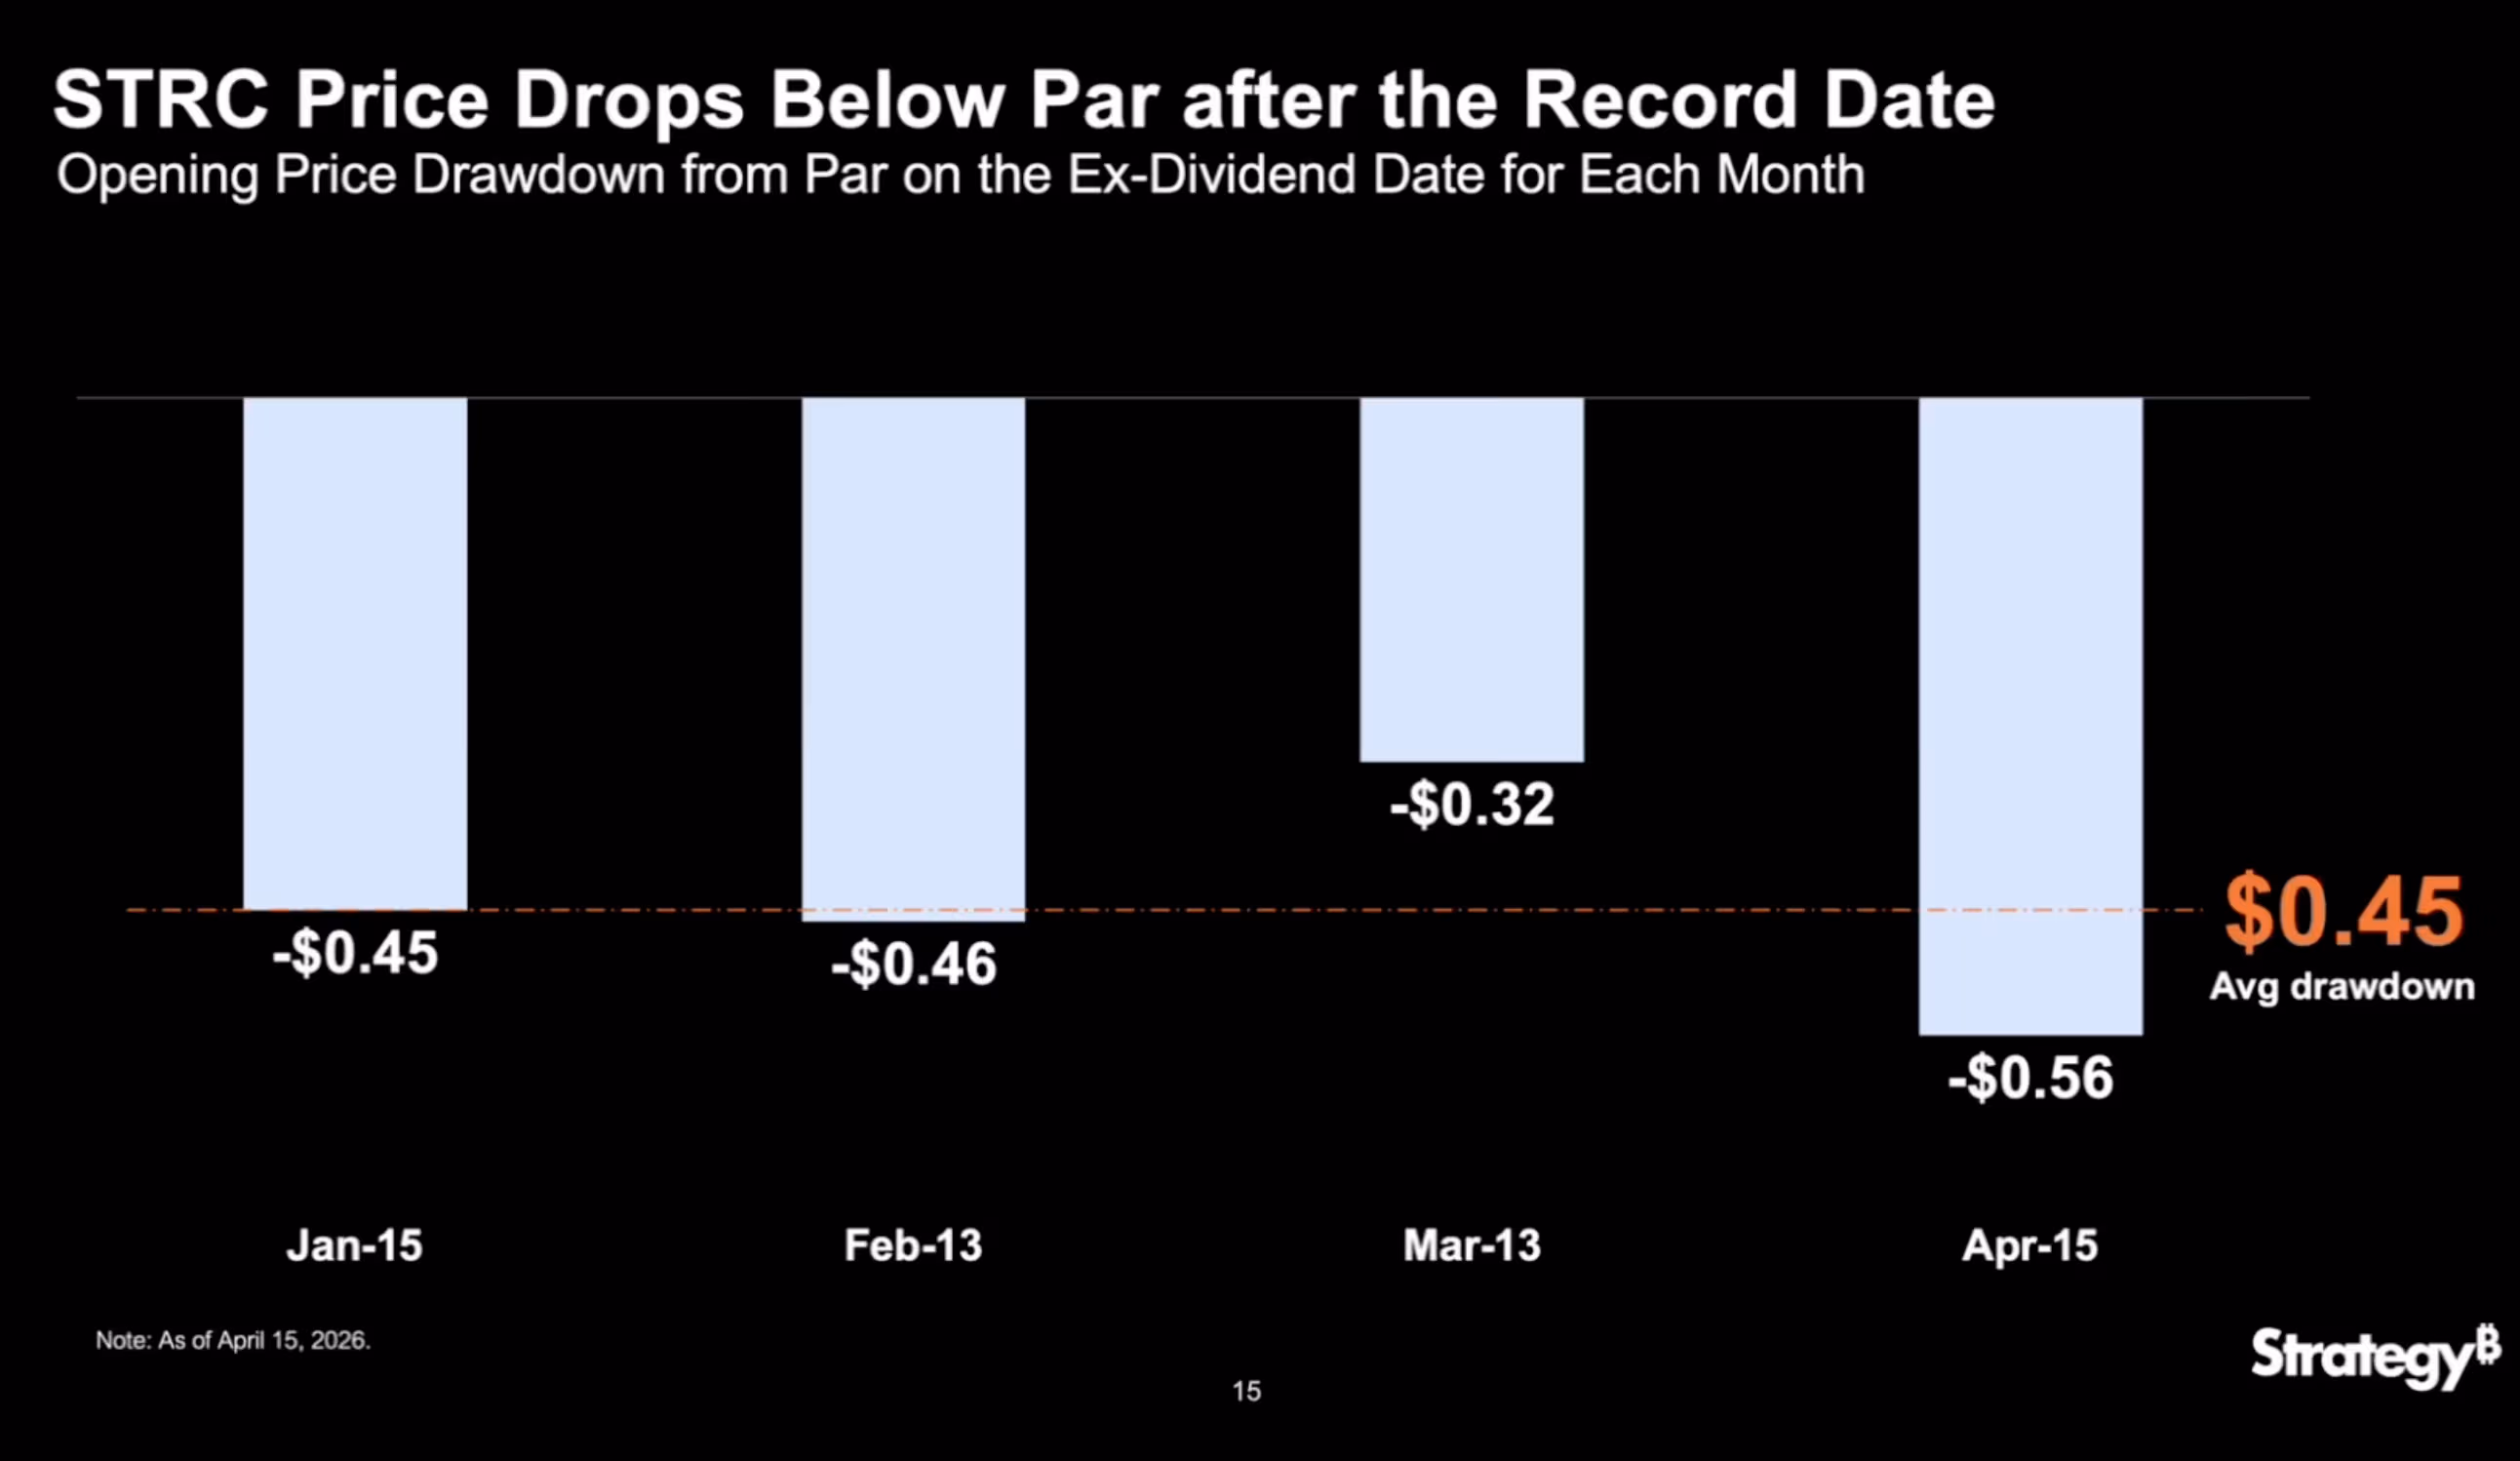
According to Strategy’s presentation, STRC currently sees an average $0.45 price drawdown after the ex-dividend date (the deadline to own a stock to receive a dividend), with recovery to its $100 par value taking around two weeks. Typically, on the ex-dividend date, the stock price drops by approximately the amount of the dividend payment.
When STRC trades below its $100 par value, Strategy cannot issue shares through its at-the-market (ATM) program to raise funds for bitcoin purchases. By smoothing the price action, the company aims to keep STRC closer to par, enabling more consistent capital raising.

Semi-monthly payments are expected to reduce this volatility and time lag.
Steadier bitcoin buying
More frequent payouts would also reduce reinvestment lag and spread out the buying pressure more evenly across the month, allowing Strategy to purchase bitcoin at a steadier pace and keep purchases consistent.
According to the presentation, the shift aligns with the typical twice-monthly U.S. payroll cycle and creates more entry and exit opportunities for shareholders, all aimed at lowering volatility.
STRC’s historical volatility averaged 13% from August 2025 to March 2026, but dropped to just 2% between March and April 2026, according to Strategy’s data.

If approved, STRC would become the only semi-monthly dividend-paying preferred in the market, compared with 921 that pay quarterly and 32 that pay monthly, the company said. Nasdaq rules require at least 10 calendar days between dividend declaration and the record date.
STRC recently fell below $99 following the April 15 ex-dividend date, a drop of more than $1, which is the volatility the company is aiming to reduce.

Disclosure: The author of this story owns shares in Strategy (MSTR).
Read more: The one metric investors are overlooking in Michael Saylor’s Strategy

Coinbase Institutional published an analysis on April 17, arguing that MicroStrategy’s persistent Bitcoin (BTC) buying reduces liquid float far more than the market appreciates.
Michael Saylor amplified the sentiment the following day, posting “Impossible to blockade Bitcoin” on X (Twitter).
Digital Asset Treasuries Squeeze BTC Float
The Coinbase analysis highlights that digital asset treasuries’ share of the BTC supply has quadrupled to above 4% over the past two years.
MicroStrategy alone now holds 780,897 BTC, making it the largest corporate Bitcoin holder globally.
That supply-tightening effect grows stronger as long-term holder accumulation rises and coins continue leaving exchanges. Strategy’s buying likely matters most when it facilitates a breakout at a key technical level.
Breakout traders, systematic funds, and momentum-driven bots can then reinforce the move.
However, Coinbase noted the price impact may be limited. Anticipated buying, ETF flows, miner supply, and derivatives hedging can all dilute MicroStrategy’s influence on any given trading session.
Saylor Reinforces Bitcoin’s Uncensorable Design
Saylor’s post aligns with his long-standing argument that Bitcoin’s decentralized architecture makes suppression futile.
The timing reinforced the narrative that corporate treasuries are accelerating Bitcoin’s entrenchment beyond the reach of any single government.
Strategy has signaled it will continue buying BTC every quarter indefinitely. The company reported a 5.6% BTC yield year-to-date for 2026.
Whether corporate treasury buying matters more through supply constriction or breakout facilitation may depend on where Bitcoin sits in its current market cycle.
The post Coinbase Says MicroStrategy’s Bitcoin Buying Tightens Supply More Than Market Expects appeared first on BeInCrypto.


Aave V3’s Wrapped Ether (WETH) reserve is carrying bad debt after attackers exploited KelpDAO’s rsETH liquid restaking token and used it as collateral to borrow against the lending protocol.
Solidity developer and auditor 0xQuit flagged the situation on X, warning depositors that the WETH pool is effectively impaired and that partial withdrawals may only become possible after Aave’s Umbrella backstop settles the deficit.
How Drained rsETH Created Bad Debt on Aave
The exploit started with an attacker funding wallets through Tornado Cash. Approximately 116,500 rsETH was drained from KelpDAO, totaling over $290 million.
The attacker then supplied the stolen rsETH as collateral on Aave V3 and borrowed a large volume of WETH against it.
Because the rsETH became unbacked after the drain, the resulting positions are effectively unliquidatable. This left Aave holding WETH obligations it cannot recover through normal liquidation.
“Wish I had better news but looks like WETH on aave is fucked. Withdraw if you can but likely too late,” warned 0xQuit, Solidity developer and auditor.
What Umbrella Means for WETH Depositors
Aave’s Umbrella system, which replaced the legacy Safety Module in late 2025, is designed for exactly this scenario.
Users who staked aWETH in the Umbrella vault face automatic slashing to cover the deficit.
Once the slashing cycle completes, remaining WETH suppliers should regain partial withdrawal access.
However, a full recovery is not guaranteed, and depositors may face a haircut on their positions.
The incident marks the first major real-world test of Umbrella’s automated bad debt coverage. It also raises fresh questions about the risks of whitelisting liquid restaking tokens as collateral on lending protocols.
Meanwhile, the Upshift team, offering non-custodial vaults for managing tokenized assets, have assured users that they do not have any exposure to rsETH.
“We are in touch with KelpDAO about a potential exploit of rsETH. As a precaution, the Kelp team have decided to temporarily pause deposits and withdrawals to the High Growth ETH and Kelp Gain vaults while their investigations take place. Upshift USDC, Core USDC and EarnAUSD vaults have zero exposure to rsETH. We will provide updates as we receive them from the Kelp team,” wrote Upshift.
The post Aave WETH Suppliers Urged to Withdraw After KelpDAO rsETH Exploit appeared first on BeInCrypto.

How many points Man United still need to guarantee Champions League qualification

Latest north-west London arson attack probed as antisemitic hate crime

Apple avoids a second import ban for its redesigned smartwatches in latest court ruling


-
 NewsBeat6 days ago
Pep Guardiola and Gary Neville agree over Arsenal title problem that benefits Man City
-

 Crypto World5 days ago
The SEC Conditionalises DeFi Platforms to Be Avoided for Broker Registration
-

 Politics6 days ago
World Cup exit makes Italy enter crisis mode
-

 Fashion1 day ago
Weekend Open Thread: Theodora Dress
-

 Crypto World5 days ago
SEC Signals Exemption for Crypto Interfaces From Broker Registration
-

 News Videos4 days ago
Secure crypto trading starts with an FIU-registered
-

 Sports2 days ago
NWFL Suspends Two Players Over Post-Match Clash in Ado-Ekiti
-

 Crypto World5 days ago
SEC Proposes Certain Crypto Interfaces Don’t Need to Register as Brokers
-

 NewsBeat5 days ago
Trump and Pope Leo: Behind their disagreement over Iran war
-

 Politics1 day ago
Palestine barred from entering Canada for FIFA Congress
-
 NewsBeat7 days ago
JD Vance announces ‘no agreement’ with Iran over nuclear weapons fear
-

 Crypto World24 hours ago
Russia Pushes Bill to Criminalize Unregistered Crypto Services
-

 Sports6 days ago
NWFL opens Pathway for new Clubs ahead of 2026 Season
-
 Business2 days ago
Creo Medical agree sale of its manufacturing operation
-
Sports7 days ago
Dexter Lawrence, Stefon Diggs, Trading for De’Von Achane
-
Business6 days ago
Kering slides after Morgan Stanley downgrade, Gucci woes loom
-

 Crypto World6 days ago
Trump whales load up ahead of Mar-a-Lago luncheon.
-
 Crypto World6 days ago
Sei Network Enters Quiet Reset Phase as On-Chain Metrics Signal a Slowdown in 2026
-

 Tech6 days ago
Google adds E2E encryption to Gmail for iOS and Android enterprise users
-
 Entertainment5 days ago
Karol G’s ‘Ultra Raunchy’ Coachella Set Gave ‘Satanic Vibes’
You must be logged in to post a comment Login