
Crypto World
Microsoft (MSFT) Stock Dips 1.69% Following Texas AI Campus Expansion Announcement

Crusoe Unveils Massive AI Campus Partnership with Microsoft in Abilene
Microsoft is significantly expanding its artificial intelligence computing capabilities through a strategic collaboration with Crusoe in Abilene, Texas. The ambitious development features a 900 megawatt AI factory campus engineered to handle cutting-edge computational workloads. This facility represents one of the most substantial AI infrastructure projects currently emerging across the nation.
The planned campus will be positioned next to Crusoe’s current Abilene operations and will comprise two state-of-the-art data center structures. A dedicated onsite power generation facility will be integrated to enhance energy dependability and strengthen grid stability. When fully operational, the entire complex is projected to deliver 2.1 gigawatts of total capacity.
Development activities have commenced with initial land preparation and clearing operations now in progress. The inaugural building is scheduled to begin operations by the middle of 2027. Consequently, this rollout maintains Crusoe’s aggressive deployment schedule for enterprise-scale AI infrastructure projects.
Power Requirements Drive Design of Advanced AI Computing Facilities
The new campus architecture prioritizes energy infrastructure to accommodate escalating artificial intelligence computational needs. The facility will incorporate 900 megawatts of onsite power generation alongside battery storage capabilities. These systems will enable ultra-dense computing environments optimized for demanding GPU-based processing tasks.
Both structures will provide substantial computational capacity while employing closed-loop liquid cooling technology. This engineering approach minimizes water consumption and optimizes thermal control. Accordingly, the infrastructure design addresses the specific demands of high-performance artificial intelligence platforms.
This development represents the latest phase of the Abilene project, which has experienced rapid growth in recent periods. The original deployment began with 200 megawatts and subsequently expanded to 1.2 gigawatts spanning several buildings. Thus, this new campus consolidates the area’s position as a critical hub for large-scale AI implementation.
Geographic Advantages Position Abilene as AI Infrastructure Hub
Abilene has become an increasingly strategic location for AI infrastructure deployment, primarily due to reliable power supply and available land resources. Microsoft has secured approximately 700 megawatts of data center capacity from Crusoe in the surrounding area. This arrangement demonstrates the dynamic evolution of client requirements and infrastructure strategy.
The region has garnered significant industry interest due to multiple large-scale AI projects currently under development. Technology companies are actively realigning their asset portfolios to guarantee long-term access to computing resources. This pattern underscores the escalating competition within the AI infrastructure sector.
Crusoe is simultaneously establishing a production facility for modular AI infrastructure components designed to accelerate deployment schedules. The organization seeks to create standardized infrastructure solutions while navigating energy limitations affecting the broader industry. As such, the Abilene expansion exemplifies a significant industry transition toward scalable, energy-optimized AI development frameworks.

President Donald Trump just dropped a wild merchandising bombshell on his official website for his meme coin and digital trading cards. Exactly 2,024 physical collectible cards embedded with real fabric swatches from his iconic debate suit.
Worn on June 27, 2024, during the first presidential debate and celebrated as his total “knockout” performance, these ultra-limited editions fuse memorabilia, NFTs, and full-on meme coin frenzy in classic Trump style.
This might very well be the first time an actual sitting president of the United States is selling his wardrobe as collectibles. Who profits from it? Most likely, Trump Family-affiliated ventures.
Although the company says it has no affiliation with Donald Trump, it does promote the product with a direct quote from the President.

From a crypto perspective, the mechanics are deliberate. Buyers can pay via credit card or WETH on Polygon, aligning tightly with Trump’s broader meme coin ecosystem. Some variants reference his July 13 mugshot following the assassination attempt, amplifying scarcity and narrative-driven demand.
It’s peak post-reelection mogul mode. Critics call it “tacky,” while supporters frame it as “genius” — iconic political moments repackaged into ownable assets.
The strategy builds on more than $10 million in past NFT sales and the momentum from his 2025 inauguration, reinforcing a brand that continues to convert attention into revenue.
Sold out already? Previous drops disappeared within minutes. Expect the same pattern here, with MAGA loyalists and crypto-native traders moving quickly to secure supply.
As neobanks tokenize RWAs, Trump’s suit scraps blaze the trail for personal asset tokenization. Physical rarity crashes into digital speculation. The ultimate dealmaker strikes gold again.
The post Trump Auctions 2024 Suit Pieces on Official Meme Coin Site appeared first on BeInCrypto.
The Wyckoff method is a technical analysis framework developed by Richard D. Wyckoff in the early 20th century. It focuses on analysing price and volume to identify institutional activity and market cycles.
The method is based on the idea that large market participants drive trends through accumulation and distribution phases. Traders use this approach to anticipate price movements and identify potential entry and exit points.
This article explains the core principles of the Wyckoff trading method, including its laws, market cycle, and application in modern Wyckoff trading strategies.
Wyckoff Method Explained (Quick Summary)
- The Wyckoff method is a price and volume-based trading framework
- It was developed by Richard D. Wyckoff in the early 1900s
- It focuses on institutional behaviour, often referred to as “smart money”
- The model includes four phases: accumulation, markup, distribution, and markdown
- Traders use Wyckoff schematics to identify potential reversals and trend continuation
- The method is applied across forex, stocks, commodities, and crypto* markets
What Is the Wyckoff Method in Technical Analysis?
The Wyckoff method is a type of technical analysis developed in the early 20th century by Richard D. Wyckoff, a renowned stock market trader and analyst. The method assumes markets are driven by supply and demand, which form repeatable and tradable price patterns.
The Wyckoff methodology provides a structured framework for building trading strategies based on price and volume behaviour. This system includes the relationship between price and volume, the identification of Wyckoff market structure, and the role liquidity plays in financial markets.
The Wyckoff method remains widely referenced in modern technical analysis and institutional trading frameworks. Its principles are closely aligned with price–volume analysis and market structure concepts used across global financial markets.
Why the Wyckoff Model Works
Large financial institutions need liquidity to execute sizeable orders without excessive slippage. To fill these orders, they require counterparties on the other side of the trade.
Liquidity clusters around predictable levels: above equal highs, below equal lows, beyond trendlines, and at support and resistance zones. Stop-loss orders and breakout entries sit at these levels in high concentration. Institutions target these pools because they provide the volume needed to absorb large positions at favourable prices.
By driving prices through these key levels, institutional participants trigger stops and breakout orders, generating the liquidity they need to build or offload positions. This mechanism of liquidity engineering, driven by institutional trading activity, is the fundamental idea behind the Wyckoff theory in forex, commodities, crypto*, stocks, and more.
Key Principles of Richard D. Wyckoff Method
There are a few fundamental principles of the Wyckoff methodology that are critical to your understanding: the Composite Man and the three laws.
Composite Man
The Composite Man represents a single dominant market operator whose actions traders analyse to interpret price movements. He is, in essence, the representation of smart money trading activity. Wyckoff believed that the Composite Man carefully plans and executes his trades, encouraging buyers (or sellers) only after he has accumulated a sizable position.
The Law of Supply and Demand
Simply put, if the demand for an asset is larger than its supply, prices will rise. On the other hand, if the supply of an asset is larger than its demand, prices will decrease.
The Law of Cause and Effect
This law states that Wyckoff events, such as accumulation and distribution, act as causes that drive future price movements. It also says that the effect, or the price movements, are proportional to the cause. An accumulation that occurs on the daily timeframe will produce a much more significant effect than one on the 1 minute, for instance.
The Law of Effort vs Results
This law says that price movements are a result of effort, characterised by volume. If a bullish trend is supported by strong volume, it will likely continue. High volume within a range, without price progress, may indicate weakening momentum and a potential trend reversal.
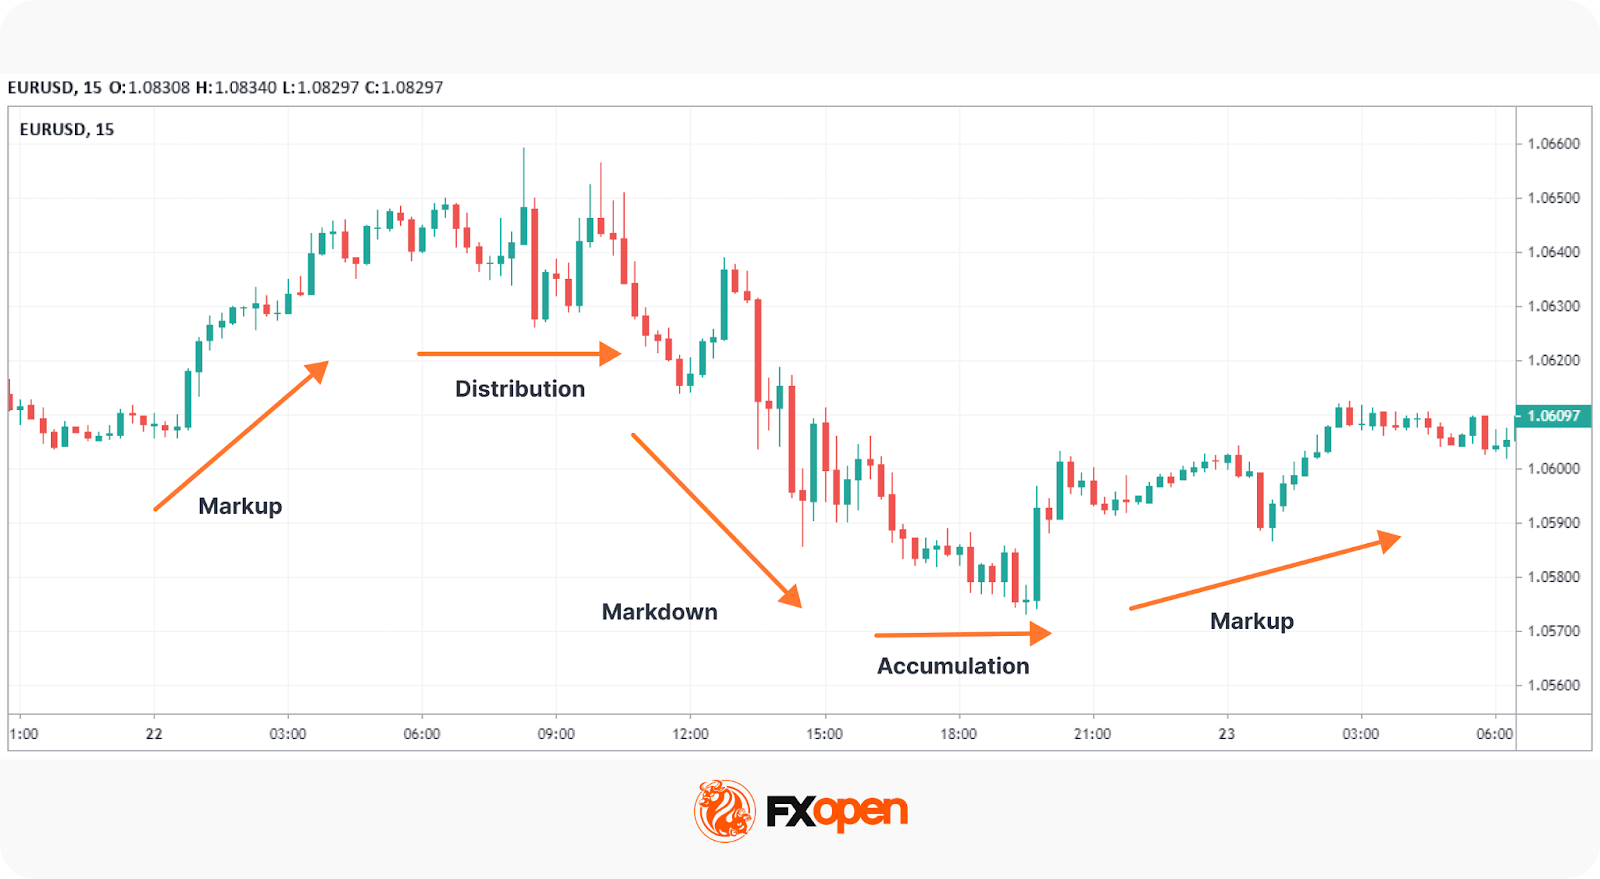
Wyckoff Market Cycle: Accumulation, Markup, Distribution, Markdown

The Wyckoff methodology frames the markets in four repeated phases. These are accumulations, markups, distributions, and markdowns.
Accumulations
Most often seen in ranges, the Wyckoff accumulation pattern represents areas where large players are building up a position to go long before the market reveals its true direction to other traders.
Markups
Once they hold a large enough position, these players start to bid the price up, encouraging other traders to jump in and push the price up further. Increasing participation reinforces upward momentum, pushing price out of the range and initiating a sustained uptrend. Note that a markup may have multiple re-accumulations where it pauses and consolidates before breaking higher.
Distributions
Once the price reaches its target and the buying pressure from other traders subsides, the big players will begin to distribute (sell) their positions while building up shorts. This Wyckoff distribution will, again, look like a range before a sharp move down.
Markdowns
This sharp move down is known as the markdown. It’s essentially the opposite of a markup: financial institutions push the price down and encourage traders to enter short positions to begin a downtrend. Like markups, there are also phases of redistribution that consolidate before moving lower.
How Traders Apply the Wyckoff Method Today
While the core principles remain unchanged, traders have adapted the Wyckoff methodology to suit modern markets and tools. Here are the most common applications:
- Market structure identification: Traders use Wyckoff schematics to label live price action, mapping accumulation and distribution phases across forex, equities, and commodities.
- Wyckoff volume profile integration: Modern charting platforms allow traders to overlay volume profiles onto Wyckoff ranges, pinpointing where the heaviest activity occurred.
- Multi-timeframe confirmation: Many traders identify a Wyckoff phase on higher timeframes (e.g., daily), then drop to lower timeframes (e.g., 1-hour). This may help to refine entries around Springs, Tests, or LPS zones.
- Confluence with other tools: The Wyckoff method is frequently combined with order flow data, support/resistance levels, and indicators like the RSI to add confirmation layers.
- Algorithmic detection: Some institutional and retail traders use algorithms to scan for Wyckoff-like structures across multiple instruments simultaneously.
Wyckoff Schematics Explained: Accumulation and Distribution Patterns
These cycles can be identified using standard Wyckoff chart patterns based on price and volume behaviour. If you want to test your own understanding, you may use the TickTrader platform with us at FXOpen.
Note that Wyckoff accumulations and distributions are practically identical, just flipped upside down. The key concepts, points, and phases across Wyckoff schematics are all the same.
Type 1 Schematics
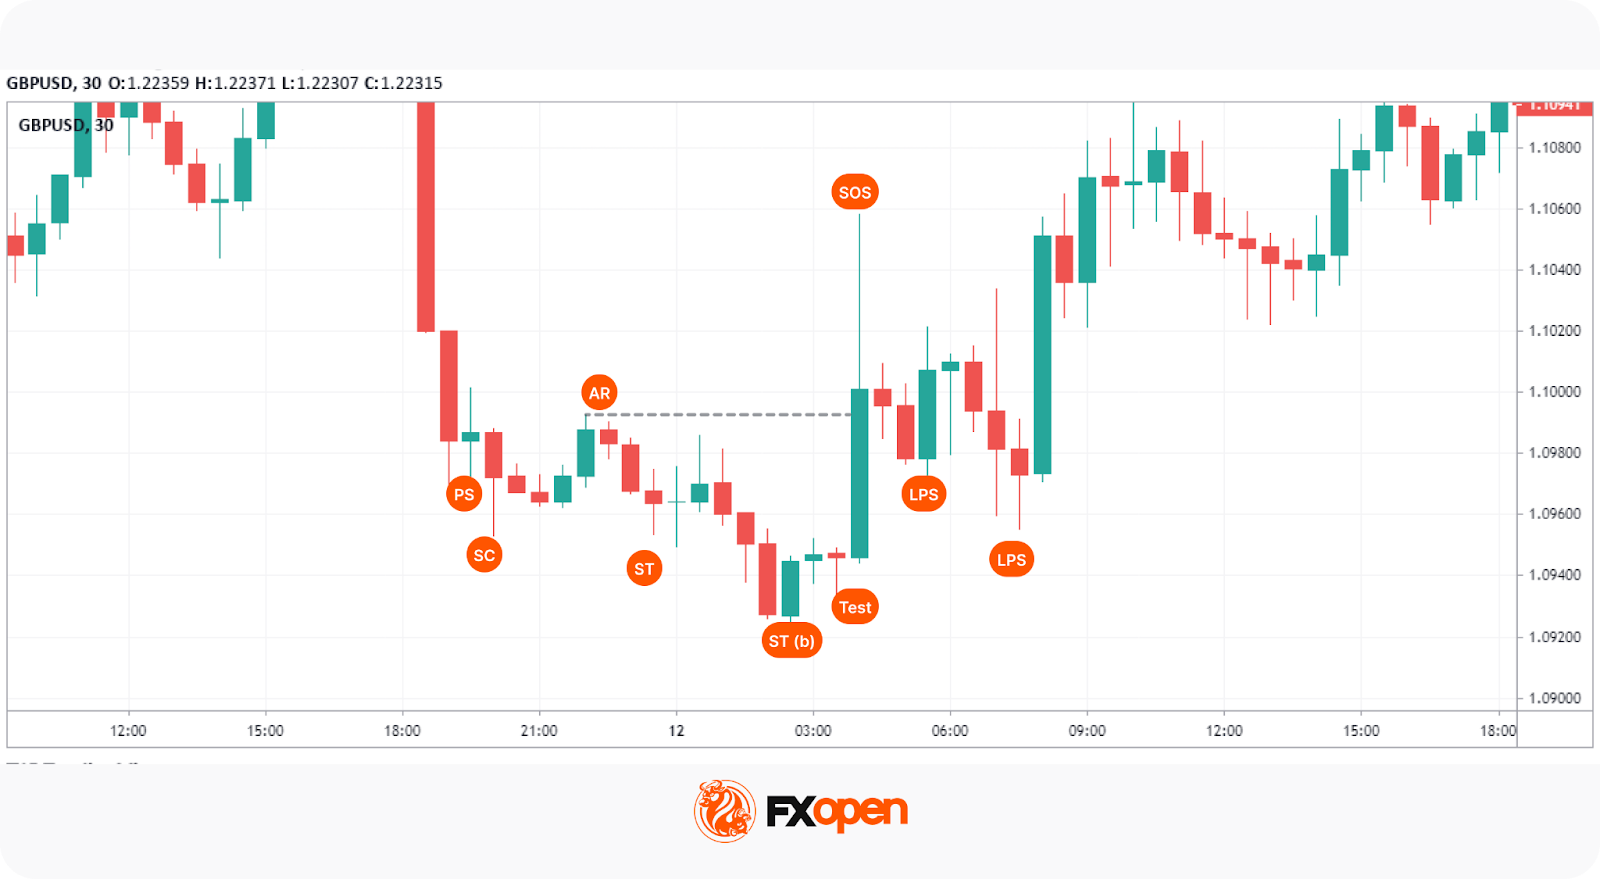
Wyckoff Accumulation Schematic
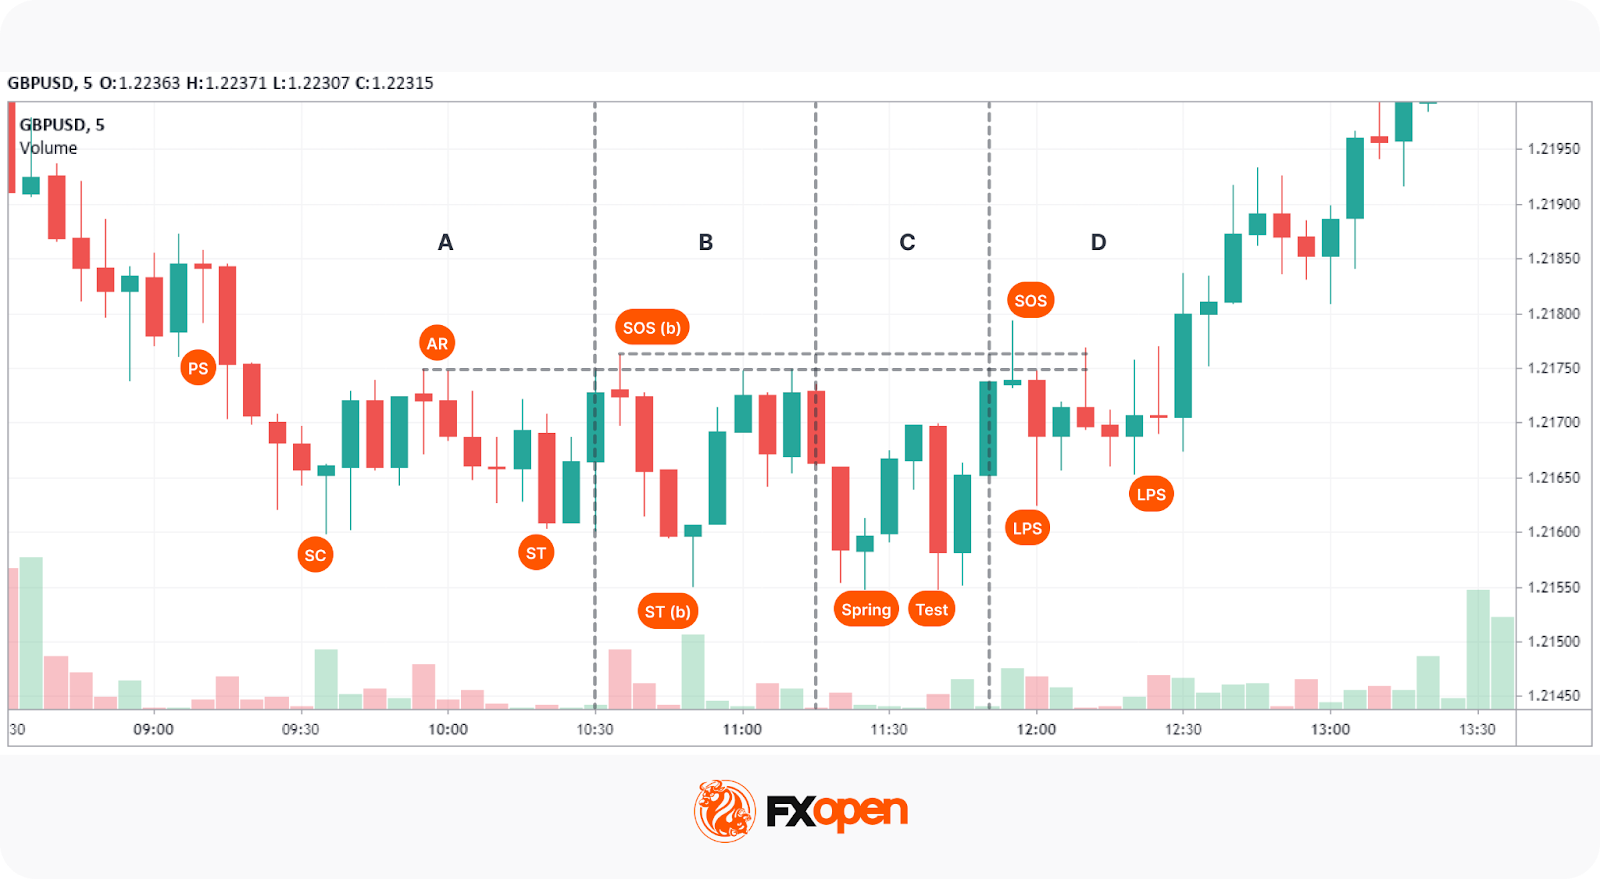
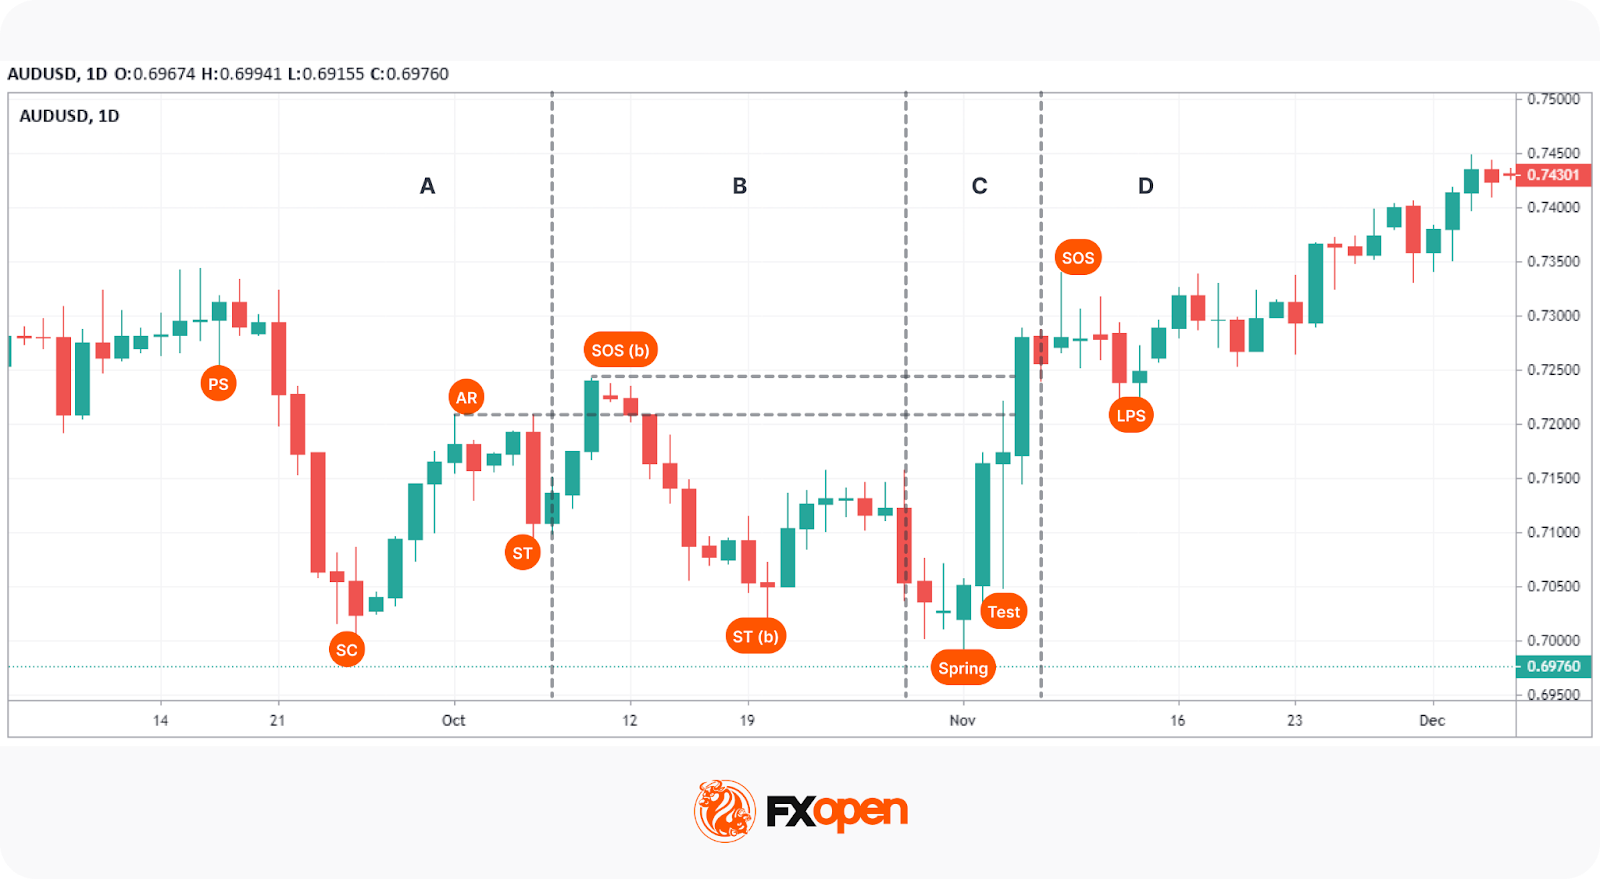
Phase A
- Preliminary Support (PS): After a markdown, buying action interrupts the downtrend and causes a slight uptick in price. Volume increases.
- Selling Climax (SC): Long traders have their stop losses triggered, while breakout traders jump in short, believing the downtrend will continue. Here, the Composite Man absorbs the selling pressure. The SC may sometimes leave a long wick that shows the buying pressure.
- Automatic Rally (AR): Given that selling pressure is exhausted, buy orders push prices up easily, and shorts exit their trades, typically below PS. Note that the high of the AR sets the first upper bound for the accumulation, as seen in the Wyckoff accumulation examples above.
- Secondary Test (ST): The price falls from the AR to form a low near the SC, creating the ST. It can create equal lows or end up slightly higher or lower than the SC. This may also occur multiple times, creating a visual area of support. Volume is likely to be low.
Phase B
- Sign of Strength in Phase B (SOS(b)): After the ST, the price can rebound higher than the AR, forming the SOS(b). This won’t always occur, but if it does, it creates our second upper bound. Again, it is supposed to fall below the PS.
- Secondary Test in Phase B (ST(b)): This is the first “liquidation” event of the accumulation. A sharp move downward takes out the ST and, ideally, the SC. Here, the Composite Man taps into the stop losses below the ST and breakout sell orders to fill his buy orders, creating the Cause.
Phase C
- Spring: Following the ST(b), the price will likely test the first and second upper bounds, but it is supposed to always stay within them. After doing so, the Composite Man will push the price down for the last time below the ST(b), liquidating any orders resting below here to form the Spring.
- Test: After creating the Spring, the Composite Man will often test the area to see if there’s any supply left. The price will make a higher low near the Spring, often with a lower volume. Note that there can be multiple tests.
Phase D
- Last Point of Support (LPS): Following the test and another leg higher, the price will pull back to test supply once again. LPSs are usually much higher than the initial Tests and are often the last move before the markup begins. LPSs can form both before and after the SOS, depending on how the price action plays out.
- Sign of Strength (SOS): Here, the price breaks above the highest upper bound and confirms the schematic, often with higher volume. As mentioned, the LPS can form after the breakout and fall back in the range or test the upper resistance line. After the SOS forms, the markup begins and produces the Effect as seen in the Wyckoff accumulation chart above.
Wyckoff Distribution Schematics
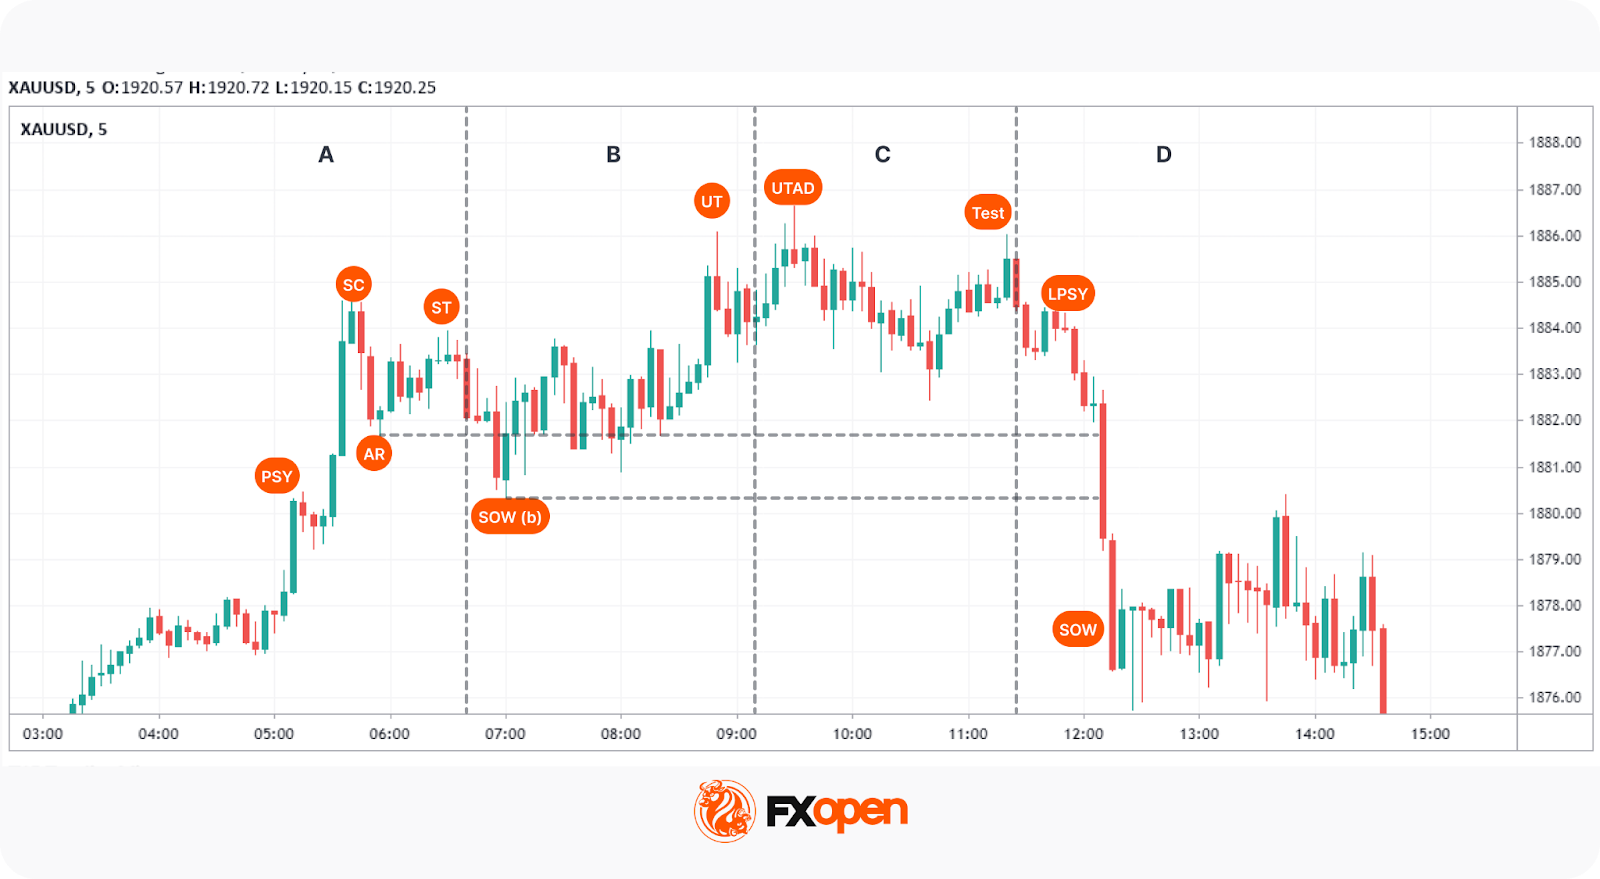
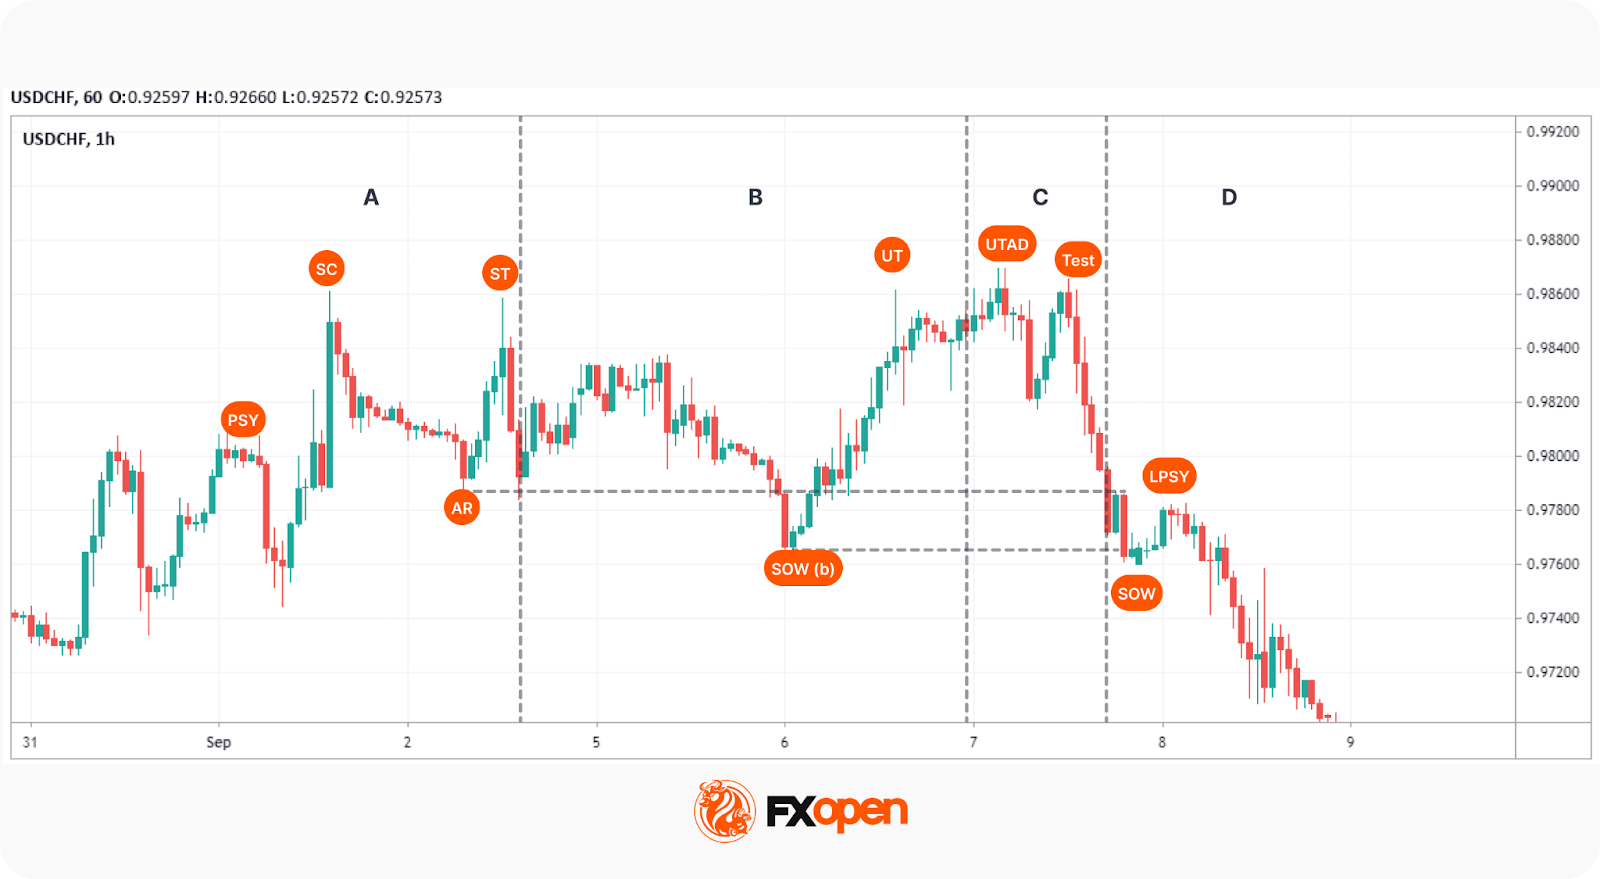
Phase A
- Preliminary Supply (PSY): After an uptrend, the Composite Man begins to unload his position, causing the price to fall slightly.
- Buying Climax (BC): Like the SC, the BC is where buying pressure is at its most extreme, coinciding with high volume.
- Automatic Rally (AR): After buying subsidies, prices fall to form the AR, usually above the PSY. This is our first lower bound, shown in the Wyckoff distribution examples.
- Secondary Test (ST): The price revisits the BC area to create another high usually below the BC, building up liquidity for future phases. The volume should be low.
Phase B
- Sign of Weakness in Phase B (SOW(b)): A move down past the AR that indicates supply is entering the market. Like the SOS(b), the SOW(b) doesn’t always occur, but if it does, it forms our second lower bound.
- Upthrust (UT): This is the distribution equivalent of an ST(b). It must reach higher than the ST and may take out the BC. Here, the Composite Man uses short stop losses and breakout trades to fill his sell orders.
Phase C
- Upthrust After Distribution (UTAD): The UTAD is analogous to an accumulation’s Spring. Following the UT, one last tap into areas of liquidity is made before the markdown.
- Test: Similar to accumulation, there are usually one or more tests made near the UTAD attempting to see if any demand remains.
Phase D
- Last Point of Supply (LPSY): After the price declines, the final demand tests are made. Like accumulations, these points can occur before or after the Sign of Weakness. They’re typically the last bullish moves made before the markdown begins.
- Sign of Weakness (SOW): The lowest bound is broken as the price begins to confirm its bearish structure. Another LPSY can be made, but this is the final step before the markdown.
Type 2 Schematics
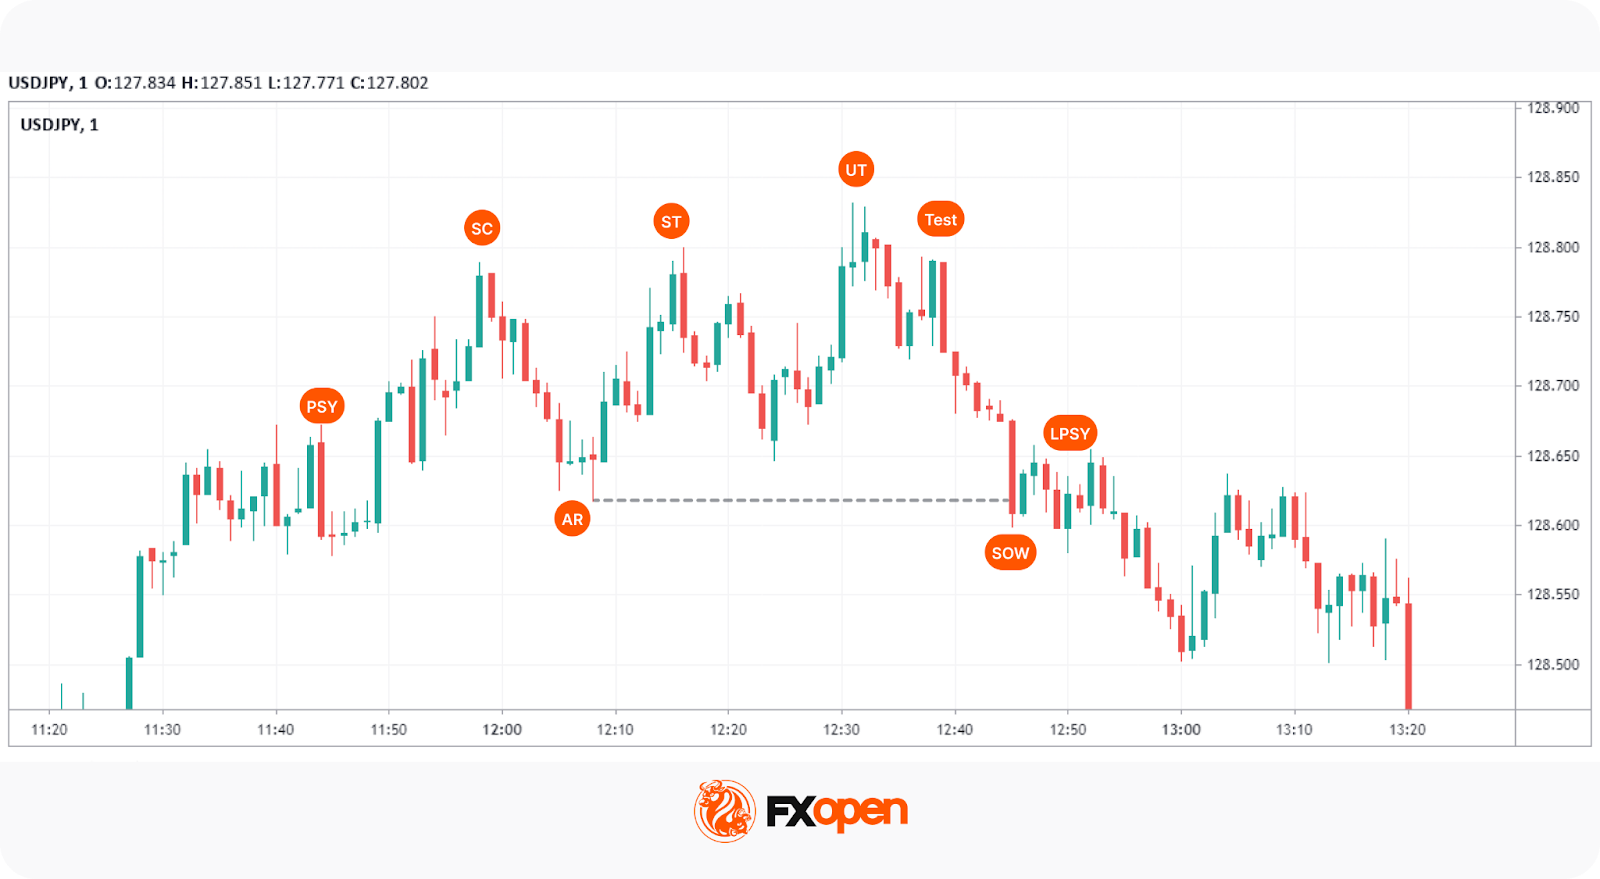
Type 2 Wyckoff schematics have all of the same ingredients, just without a Spring or UTAD. Wait for the SOS or SOW to occur. If you have just a single ST and an ST(b), or an ST and UT, and the markup or markdown begins, you know it’s a Type 2. This is seen in the Wyckoff graph above. Both can be traded in the same ways as a Type 1.
Wyckoff Trading: Pros and Cons
The Wyckoff trading method offers a systematic approach to analysing market trends and making trading decisions. Like any trading strategy, it comes with its advantages and disadvantages that traders often consider.
Pros
- Structured Framework: The Wyckoff method provides a clear framework for identifying market phases, supporting traders when building entry or exit strategies.
- Focus on Market Psychology: It emphasises understanding the behaviour of the “Composite Man,” which can offer insights into market sentiment and potential moves.
- Versatility: The Wyckoff strategy can be applied across various markets, including forex, stocks, commodities, and cryptocurrencies*.
- Incorporates Volume Analysis: Analysing volume in relation to price action may help traders to gauge the strength of trends and potential reversals.
Cons
- Complexity: The Wyckoff trading method requires a deep understanding of market mechanics and chart patterns, which may be challenging for beginners.
- Requires Patience: Identifying the correct phase of a Wyckoff accumulation or distribution can take time, and trades may require waiting for confirmation signals.
- Subjective Interpretation: Like many technical analysis tools, the Wyckoff method depends on the trader’s interpretation, leading to varying results.
- Not Foolproof: While the Wyckoff market cycle method is powerful, it is not infallible and is typically used in conjunction with other analysis tools.
The Five-Step Wyckoff Trading Strategy
Luckily, Wyckoff developed a five-step framework for applying his methodology. The following structure outlines how traders build Wyckoff trading strategies using price and volume analysis. It can be adapted to develop a Wyckoff forex trading strategy.
1. Determine the current market trend. Assess whether the overall market is bullish or bearish.
2. Choose your market. Find a pair that strongly correlates to this overall trend.
3. Find a pair currently undergoing accumulation or distribution.
4. Determine the pair’s readiness to move. This involves examining the Wyckoff phase of the asset and volume. If a Spring or UTAD has just occurred, you could consider it viable.
5. Find your entry. Traders often enter on Tests or LPS/LPSYs.
Final Thoughts
Despite its age, Wyckoff’s logic in forex trading remains relevant. It reflects important price–volume relationships and market structure, which support traders when determining key turning points. It may form the basis of a trading approach when combined with other types of technical analysis, such as harmonic patterns, indicators, and support/resistance levels.
If you want to apply the Wyckoff method or test other trading approaches, you can consider opening an FXOpen account to trade over 700 markets with tight spreads and low commissions.
FAQ
What Are the 4 Stages of the Wyckoff Cycle?
The Wyckoff cycle is a four-phase model that describes how markets move from consolidation to trend and back again. The four stages are accumulation (where institutional players build positions), markup (the resulting uptrend), distribution (where those positions are sold), and markdown (the subsequent downtrend).
What Are the Three Laws of Wyckoff?
The three laws of Wyckoff are foundational principles that govern price behaviour within the methodology. The Law of Supply and Demand determines the direction of price. The Law of Cause and Effect links the size of an accumulation or distribution phase to the magnitude of the resulting move. The Law of Effort vs Results compares volume (effort) to price movement (result) to assess whether a trend is likely to continue or reverse.
What Is the Wyckoff Trading Range?
The Wyckoff trading range is a consolidation phase where accumulation or distribution occurs before a trend develops. It reflects a balance between supply and demand, often preceding a breakout or reversal.
What Timeframe Is Popular for the Wyckoff Method?
The Wyckoff method is a multi-timeframe approach, though daily and weekly charts are the most commonly referenced. Patterns on higher timeframes tend to produce more defined schematics and more significant price moves.
Can You Use Wyckoff for Day Trading?
Day trading with the Wyckoff method is possible, though it demands a strong grasp of short-term market structure and fast interpretation of price and volume shifts. Traders typically apply Wyckoff schematics on intraday charts (e.g., 5-minute or 15-minute) while referencing higher timeframes for context.
What Are Wyckoff Trading Strategies?
Wyckoff trading strategies are systematic approaches built around identifying accumulation and distribution phases using price and volume analysis. They typically involve recognising a Wyckoff schematic, confirming its phase, and acting on key events like Springs, Tests, or Signs of Strength.
*Important: At FXOpen UK, Cryptocurrency trading via CFDs is only available to our Professional clients. They are not available for trading by Retail clients. To find out more information about how this may affect you, please get in touch with our team.
This article represents the opinion of the Companies operating under the FXOpen brand only. It is not to be construed as an offer, solicitation, or recommendation with respect to products and services provided by the Companies operating under the FXOpen brand, nor is it to be considered financial advice.
Update (March 27, 2026, 10:52 am UTC: This article has been updated to include comments from Shawn Young, chief analyst at MEXC Research.
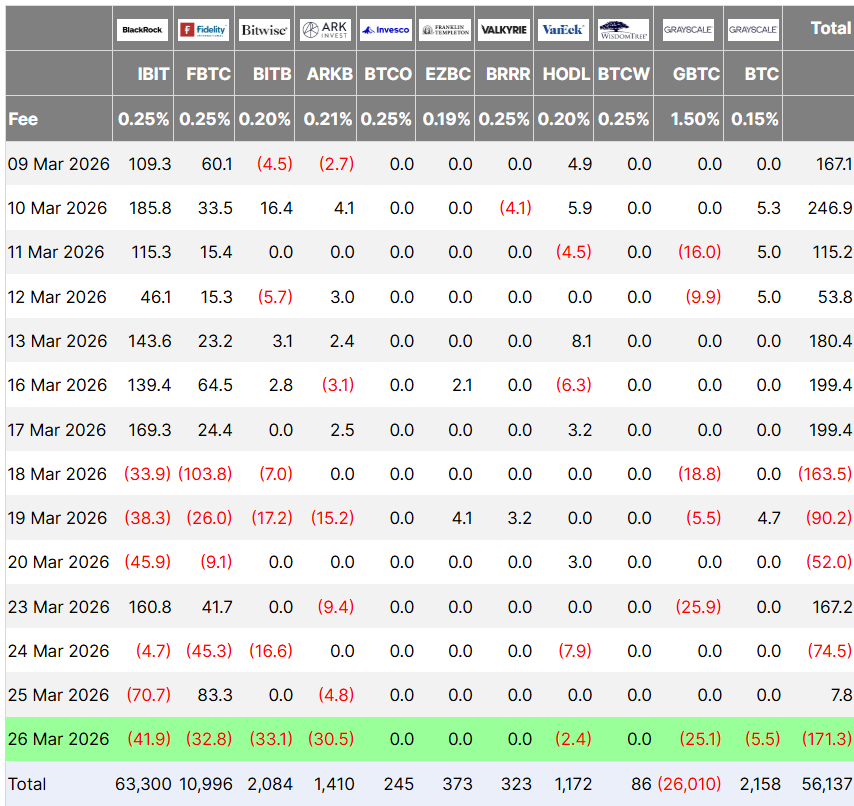
US spot Bitcoin exchange-traded funds (ETFs) logged $171 million in outflows on Thursday, their biggest day of redemptions since March 3, when they posted $348 million in outflows.
BlackRock’s iShares Bitcoin Trust ETF (IBIT) led the outflows with $41 million, Fidelity’s Wise Origin Bitcoin Fund (FBTC) followed with $32 million, the ARK 21Shares Bitcoin ETF (ARKB) sold $30.5 million, and Grayscale’s Bitcoin Trust ETF (GBTC) sold $24 million, according to data from Farside Investors.
The outflows follow a period of demand for Bitcoin ETFs, which attracted $1.36 billion in monthly inflows so far in March and are on track for their first month of net accumulation since October 2025, when ETFs clocked $3.42 billion in net inflows, according to Sosovalue data.
US-listed spot Bitcoin ETFs are a signal of institutional demand for Bitcoin (BTC), which fell below the $70,000 mark on Thursday. BTC fell 4.7% over the past week and traded at $67,780 at the time of writing, according to CoinMarketCap.

The $171 million in outflows signals that Bitcoin ETF investors are “beginning to pull back” and hedge against geopolitical escalations in the US-Israeli conflict with Iran, Shawn Young, chief analyst at MEXC Research, told Cointelegraph, but added that net ETF flows remained positive since the beginning of the conflict.
Still, Bitcoin ETFs are just “one good day away” from reversing their year-to-date outflows, said senior Bloomberg ETF analyst Eric Balchunas, who praised the ETFs for their “incredible fortitude” amid Bitcoin’s 46% correction from the $126,198 all-time high in October 2025.
“For context, when gold fell 40% in a short time frame about 10 years ago, it saw 1/3 of its investors bail,” said Balchunas in a Tuesday X post.
Related: Morgan Stanley files amended S-1 for MSBT Bitcoin ETF
Investors fear weekend war escalation
The Bitcoin ETF sell-off follows reports that the US Department of Defense is sending thousands of soldiers to the Middle East, sources familiar with the matter told Reuters on Tuesday.
On Thursday, US President Donald Trump announced an extension to the ceasefire on Iranian energy infrastructure by 10 days to April 6, citing constructive ongoing negotiations.

Despite the announcement by Trump, market participants remain worried about another unexpected weekend escalation, Kyle Rodda, senior financial analyst at Capital.com, told Cointelegraph. He said:
“Amidst the headline risk and he-said, she-said games about whether negotiations between the US and Iran are taking place, the US is moving assets and personnel towards the Middle East to prepare for what looks like a limited ground invasion.”
Investors are jittery about any potential escalation after being caught off guard by the initial US and Israeli strikes on Iran on Feb. 28, which occurred in the middle of constructive negotiations, Rodda added.
Magazine: Bitcoin’s ‘biggest bull catalyst’ would be Saylor’s liquidation — Santiment founder


Michael Saylor quoted a CNBC TV anchor who repeated his marketing spiel about STRC on live television.
On Thursday’s edition of CNBC’s Power Lunch, Saylor was asked by host Brian Sullivan, “Am I offending you if I call it a money market fund?”
Sullivan was referencing Strategy’s publicly-traded STRC, a 11.5% dividend-paying preferred share that is definitely not a money market fund.
Saylor, who’s spent months likening his uninsured STRC to insured savings products like FDIC-insured bank accounts and SIPC-insured money markets happily agreed.
“It’s meant to be like a money market,” Saylor replied, continuing months of misleading statements about the shares that are supposed to trade near $100 yet have traded beneath $93.50 on 10 separate days.
He later tweeted the clip, declaring that his company’s digital credit products are somehow “redefining” yield.
Unfortunately, STRC is paying 11.5% for a reason, mostly because Strategy hasn’t been able to lower that rate and sustain demand for STRC’s share price near its intended $100 stated amount.
STRC is also nothing like a money market fund, and according to Bloomberg, 80% of STRC buyers have been retail investors, rather than sophisticated institutions.
Read more: Strategy is paying credit card rates to keep STRC at $100
STRC versus an actual money market fund
Unlike a money market fund, Strategy isn’t required to hold full assets to back STRC’s par value, has no bid in the Nasdaq market to support its share price, isn’t required to maintain any particular pricing value of investors’ principal, and has no liquidity requirement to support redemptions.
SEC-registered money market funds must comply with Rule 2a-7 and its liquidity minimums and asset diversification rules.
Money markets maintain stable net asset values by investing in short-term, high-quality debt.
STRC, in contrast, doesn’t comply with money market regulations and invests in one of the most volatile assets in history, bitcoin (BTC).
Unlike a money market fund, STRC pays a dividend from a company with a junk “B-” credit rating from S&P analysts. That same company reported a $12.4 billion net loss in a single quarter.
US money market funds carry SIPC protections when purchased through a registered US brokerage. Bank money market accounts carry FDIC insurance. STRC carries no insurance.
Strategy itself admitted on page 90 of its earnings presentation that STRC isn’t a money market fund.
The company conceded that it’s “not required to hold any assets to back the STRC Stock.” That disclosure didn’t stop Saylor and Sullivan from floating the comparison on national television.
Nor did it stop Saylor from enthusiastically agreeing.
$100 or $90.52 per share, depending on the day
Money market funds shouldn’t lose more than 7% of their value in a few hours. STRC has, repeatedly.
The stock fell to $90.52 in November 2025 and to $93.10 in February 2026. Strategy hiked its dividend rate seven times since launch to encourage secondary trading closer to $100.
Its dividend rate, which started at 9% in July 2025, now sits at 11.5%, a 250 basis point increase.
Meanwhile, BTC trades near $66,000, well below Strategy’s average purchase cost of $75,694 per coin. The company’s entire BTC operation has lost money since inception, while MSTR common stock has declined 74% from its November 2024 high.
Saylor told Sullivan that BTC needs to appreciate just 2% a year to cover STRC’s dividends forever.
However, he conveniently omitted that his model only works for MSTR shareholders if BTC rallies 30% annually, a forecast he has repeated for years but that BTC’s five-year annualized return hasn’t delivered.
Indeed, Saylor has compared STRC to insured products for months.
He described it on CNBC as “a bank that pays you 20% interest.” On an earnings call, he recommended STRC “for your family treasury.”
Incredibly, STRC raised over $1.18 billion in a single week this month, suggesting that comparisons like Sullivan’s are working exactly as intended.
Sullivan’s framing of STRC as a money market fund may have been casual. For the retail investors buying STRC on the basis of these comparisons, the difference between a money market fund and a junk-rated perpetual preferred stock is anything but.
Got a tip? Send us an email securely via Protos Leaks. For more informed news and investigations, follow us on X, Bluesky, and Google News, or subscribe to our YouTube channel.

In this video, we’ll explore the key economic events and market trends, shaping the financial landscape. Get ready for insights into financial markets to help you navigate the week ahead. Let’s dive in!
In this episode of Market Insights, Gary Thomson breaks down what moved the markets over the past few days and unpacks the strategic implications of the most critical events driving global markets.
👉 Key topics covered in this episode:
✔️ What Happened in the Markets Over the Past Few Days
US-Iran tensions are fueling market uncertainty, with shifting headlines, mixed negotiation signals, and no clear resolution. Oil remains volatile, and equities reflect fragile sentiment rather than a trend. Will markets find direction, or will uncertainty keep prices unstable?
✔️ US Retail Sales
US Retail Sales data on 1 April could signal shifts in consumer demand, following weak growth in recent months and a decline in January. The US dollar may react sharply if the new figures diverge from expectations. Will retail sales show a rebound, or continue the trend of weakening consumer demand?
✔️ US Nonfarm Payrolls and Unemployment Rate
US Nonfarm Payrolls and the Unemployment Rate on 3 April could reveal whether the labour market is weakening or stabilising, after February’s 92,000-job loss and a rise in unemployment to 4.4%. Will the data show further deterioration, or a surprising rebound in US employment?
In summary, next week markets face a balance between elevated volatility from geopolitical risks and potential direction from upcoming macroeconomic data.
Gain insights to strengthen your trading knowledge.
💬 Don’t forget to like, comment, and subscribe for more market insights every week.
Watch it now and stay updated with FXOpen.
This article represents the opinion of the Companies operating under the FXOpen brand only. It is not to be construed as an offer, solicitation, or recommendation with respect to products and services provided by the Companies operating under the FXOpen brand, nor is it to be considered financial advice.
Crypto World
Swiss DeFi Infrastructure Provider THORWallet Expands into Asia, Targeting South Korea’s Crypto Market
Swiss-based DeFi infrastructure provider THORWallet is expanding into Asia, with South Korea emerging as a key focus market for its mobile-first crypto platform.
The company, known for its non-custodial wallet that integrates decentralized finance services with traditional banking features, says the move reflects growing demand in Asia for tools that connect centralized crypto markets with global DeFi liquidity.
South Korea is widely considered one of the most active retail crypto markets globally, with millions of traders and some of the highest digital asset participation rates in the world.
Swiss Banking Meets Decentralized Finance
One of THORWallet’s distinguishing features is the integration of Swiss banking functionality directly within a non-custodial crypto wallet.
Eligible users can access a Swiss IBAN, a multi-currency account, and a global payment card, allowing them to move between crypto assets, decentralized finance, and traditional financial infrastructure within a single interface.
The company believes this hybrid approach may appeal to users in Asia seeking more seamless ways to connect digital assets with everyday financial services.
“Many crypto users want access to both DeFi and traditional financial rails without giving up custody of their assets,” said Marcel Harmann, founder of THORWallet. “Combining a non-custodial wallet with banking functionality helps close that gap.”
Positioning as DeFi Infrastructure
THORWallet positions its platform as DeFi infrastructure rather than a traditional crypto wallet, aiming to serve as a gateway through which users and applications can access decentralized liquidity networks.
The mobile wallet has processed more than $1.5 billion in cross-chain swap volume, highlighting its role as an active interface connecting users to decentralized liquidity protocols.
THORWallet integrates cross-chain liquidity networks such as THORChain, Maya Protocol, and NEAR Intents, enabling users to swap native assets across different blockchains without relying on wrapped tokens or centralized bridges.
As liquidity continues to fragment across multiple chains, cross-chain swaps—such as exchanging Bitcoin for Ether across networks—are becoming an increasingly important component of the broader DeFi ecosystem.
By connecting directly to decentralized liquidity networks, THORWallet allows users to access cross-chain trading functionality via a mobile interface while retaining full custody of their assets.
Mobile Access to Global Liquidity
The company has focused heavily on mobile design, reflecting the view that the next wave of DeFi adoption will depend on simplifying complex blockchain interactions for everyday users.
This approach aligns with usage patterns in South Korea, where a significant share of cryptocurrency trading already takes place via mobile applications.
“Our goal is to provide a simple gateway that allows users to move from centralized exchanges into global DeFi liquidity,” Harmann added.
South Korea as a Strategic Entry Point
South Korea has long been one of the most influential cryptocurrency markets globally. Local exchanges such as Upbit and Bithumb consistently rank among the largest platforms by trading volume, and the country is home to millions of active retail traders.
Despite high participation, much of the activity remains concentrated on centralized exchanges, while access to decentralized finance tools is still relatively limited for many users.
THORWallet sees an opportunity to position its platform as a mobile gateway between centralized exchange liquidity and global DeFi infrastructure.
The company identifies South Korea as a strategic entry point for its broader expansion across Asia, where crypto adoption continues to grow and retail participation remains strong.
Asia is widely viewed as one of the most dynamic regions for cryptocurrency innovation, with major user bases across markets such as South Korea, Japan, Singapore, and Taiwan.
“We see Korea as an important starting point,” Harmann said. “From there, we plan to expand further across Asia as demand grows for mobile access to decentralized financial infrastructure.”
Growing Demand for Cross-Chain Infrastructure
As the digital asset ecosystem expands across multiple blockchains, demand for solutions enabling native cross-chain liquidity and interoperability continues to increase.
THORWallet positions itself as a mobile interface connecting users to decentralized cross-chain liquidity networks, with a long-term strategy focused on building infrastructure that allows interaction with multiple blockchains, financial services, and liquidity sources through a single platform.
The post Swiss DeFi Infrastructure Provider THORWallet Expands into Asia, Targeting South Korea’s Crypto Market appeared first on BeInCrypto.
Crypto World
Major volatility in Pi Network price as bulls eye $0.28 with technicals turning cautious into key March upgrades
Pi Network price is stalling near $0.18 as bearish models flag a possible drop toward $0.14, even as mainnet upgrades, a DEX launch and a Consensus 2026 push aim to anchor real‑world Web3 use.
Summary
- Pi Network’s PI token is trading around $0.18 today, down roughly 4.68% over the last 24 hours and underperforming a broader crypto market drop of about 3.56%.
- With PI changing hands near $0.1795 and facing a projected 23.23% downside toward $0.1384 in the next five days, technical models classify the current setup as bearish despite neutral RSI readings.
- The move comes as Pi Network rolls out major node and mainnet upgrades, prepares a DEX launch and secures a Consensus 2026 sponsorship, shifting the project narrative toward real‑world utility and Web3 integration.
Pi Network’s PI (PI) token, the native asset of the mobile‑first smart contract and payments ecosystem, is trading at about $0.1795 today after losing 4.68% in the last 24 hours, extending a pullback from this month’s high near $0.2850.
CoinCodex data shows PI underperformed the broader crypto market, which declined 3.56% over the same period, while PI also dropped 2.65% against BTC and 2.01% versus ETH, reflecting relative weakness across pairs. According to CoinLore, the first recorded exchange rate for PI on its platform was $0.7821, with a cycle low at $0.1317 in February 2026 and a historic high above $3.00, placing the current price roughly 77% below that initial print but still 36% above the February low. Functionally, PI is positioned as a layer‑1 smart contract and payments token aimed at bringing everyday users into Web3 via mobile mining, app‑layer utility and, increasingly, real‑world financial integration.
Pi Network price tests $0.18 support as March upgrades meet bearish models
From a technical perspective, short‑term signals are leaning defensive. CoinCodex’s March 26 update expects PI to fall to $0.138387 by April 1, 2026, implying a 23.23% decline from today’s levels and summarizing the current outlook as bearish. The same dashboard shows PI trading at $0.179471 with a 14‑day RSI of 51.09, a neutral reading that suggests neither deep oversold conditions nor overbought exhaustion, while most short‑term moving averages—from the 3‑day MA at $0.1973 to the 50‑day MA at $0.1826—are flashing sell signals. Structurally, PI remains above the 200‑day simple moving average at $0.269050, which CoinCodex interprets as a longer‑term bullish trendline despite the near‑term bearish bias in the next‑five‑days forecast.
The project’s fundamentals are evolving in parallel with the price chop. AInvest’s March 1 analysis notes that Pi Network is entering a critical phase in 2026, moving from experimental development to real‑world utility with infrastructure upgrades and ecosystem expansion explicitly designed to support financial integration and practical applications. CoinMarketCap’s latest Pi update details several key milestones: completion of the mainnet Protocol 20.2 upgrade on March 18, 2026, which lays the foundation for smart contract functionality; a major node upgrade roadmap targeting version 23.0 by May; and a sponsorship at Consensus 2026 in Miami, including a 20‑minute main‑stage session that will spotlight Pi and artificial intelligence alongside sponsors such as Grayscale and Google Cloud. Separately, MEXC’s February 17 report frames March 12, 2026—the activation date for Pi DEX and related liquidity infrastructure—as a “decisive” turning point for the ecosystem, emphasizing that successful execution will be treated as a confidence event by users and developers monitoring throughput, stability and engagement.
These network‑level developments highlight a familiar tension between narrative and tape. On one hand, Pi Network is signaling a shift toward concrete utility—through protocol upgrades, DEX activation and high‑profile conference exposure—just as the broader market increasingly rewards projects with real‑world use cases over pure speculative hype. On the other hand, CoinCodex’s bearish near‑term projection and the dense cluster of “sell” signals across key moving averages underline the risk that, absent clear evidence of adoption and on‑chain liquidity growth, PI’s price could retest lower support closer to the $0.14 area before any durable repricing can take hold.

Quick Overview
- Umbra introduces encrypted wallet for confidential Solana transactions
- Platform supports private swaps and shielded blockchain operations
- Privacy solution targets mainstream users seeking encrypted onchain finance
- Wallet incorporates compliance features alongside privacy protections
- Solution powered by Arcium’s secure execution infrastructure
Umbra has introduced a privacy-oriented wallet for Solana, broadening availability of encrypted blockchain transactions. The launch brings confidential transfers, private swaps, and built-in compliance mechanisms to users. In doing so, Umbra establishes itself as a functional privacy solution for regular blockchain operations.
Umbra Delivers Confidential Transaction Features on Solana Network
Umbra allows users to transfer digital assets while concealing sender identity, recipient information, and transaction amounts. Additionally, the platform facilitates encrypted token swaps that mask trade volume and execution strategy. Thus, Umbra eliminates public exposure from standard onchain financial operations.
The solution is built upon Arcium’s infrastructure, which enables encrypted execution across blockchain transactions. This architecture permits computation on encrypted information without revealing sensitive transaction details. Consequently, Umbra preserves confidentiality across the complete transaction process.
Previous access was restricted during Arcium’s mainnet alpha phase launched in February. Now, Umbra extends its privacy capabilities to traders, institutional participants, and commercial entities worldwide. This expanded availability addresses rising interest in confidential blockchain technologies.
Secure Execution Technology Sets New Privacy Benchmarks
Umbra utilizes encrypted execution rather than conventional obfuscation techniques or intermediary-dependent privacy approaches. Transaction data remains inaccessible to all participants throughout processing. This framework enhances privacy while preserving trustless onchain verification.
The wallet incorporates compliance mechanisms including viewing keys, risk assessment tools, and geographic restrictions. These capabilities enable controlled transparency while meeting regulatory obligations. Umbra achieves equilibrium between privacy protection and compliance adherence.
Umbra emphasizes accessibility through an intuitive interface designed for everyday transactions. The system prioritizes straightforward usability without sacrificing encryption strength. Umbra accommodates both sophisticated users and mainstream ecosystem adoption.
Development Tools and Growing Market Traction
Umbra has additionally unveiled a software development kit to facilitate encrypted application development on Solana. This resource empowers developers to create privacy-centric services utilizing zero-knowledge technologies. Consequently, Umbra reinforces its standing within the expanding privacy infrastructure sector.
Multiple integrations are anticipated in upcoming weeks as developers implement the framework. These implementations may broaden encrypted finance applications across decentralized platforms. Umbra advances overall ecosystem maturation on Solana.
The initiative previously raised over $150 million via MetaDAO, drawing participation from more than 10,000 contributors. This capital injection demonstrates substantial early enthusiasm for privacy-enabled financial instruments. Umbra therefore enters the marketplace with significant financial support and increasing appetite for encrypted blockchain capabilities.

Bitcoin (BTC) dropped toward $67,000 during the European trading session on Friday despite an increase in long-term buying. Exchange withdrawals also increased to 16-month highs, suggesting reduced “immediate selling pressure,” a new analysis said.
Key takeaways:
-
Bitcoin withdrawals from exchanges increases, reducing BTC available for sale.
-
Long-term holders accelerate accumulation, adding 155,450 BTC over the past 30 days.
-
Bitcoin analysts view $65,000–$66,000 as a potential support zone for a bounce.
Bitcoin supply tightens as long-term buying accelerates
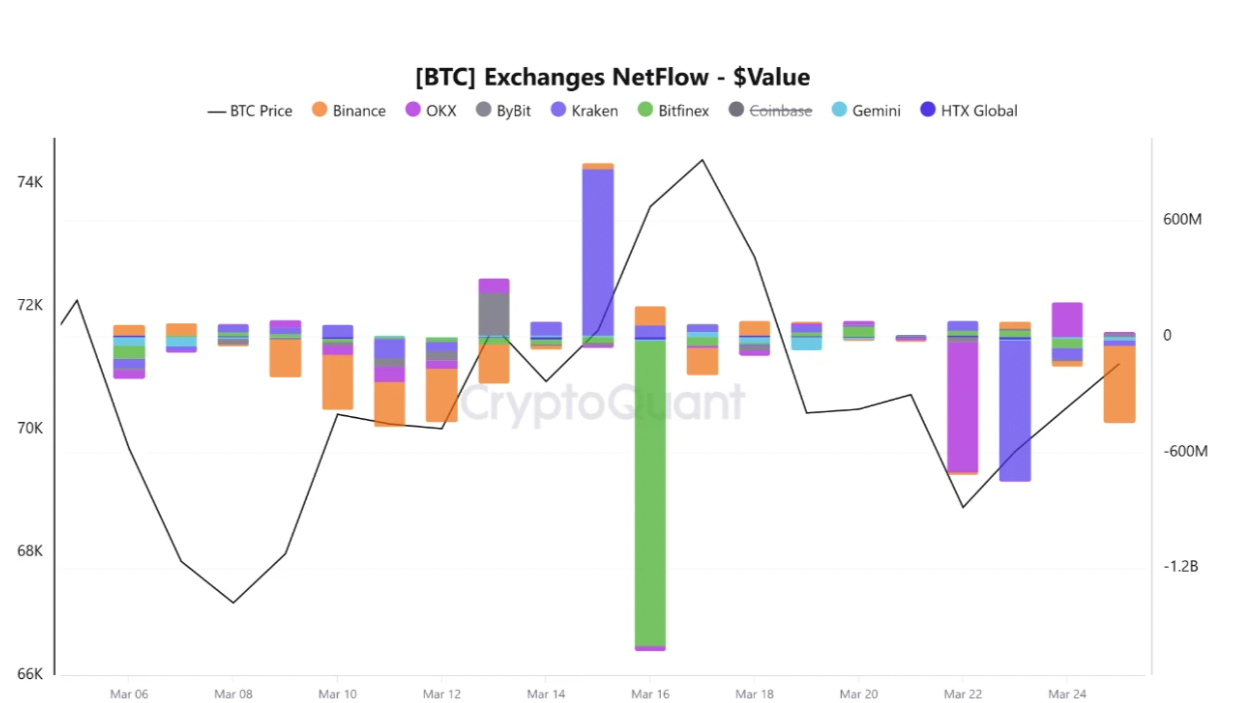
CryptoQuant’s exchange flow data highlighted “renewed signs of supply tightening,” as large Bitcoin withdrawals continue across major exchanges.
The chart below shows that investors withdrew nearly $1.6 billion of BTC from Bitfinex on March 16, as shown by the orange bar in the chart below.
Related: Bitcoin floor ‘near $70K’ as TradFi returns: Will war, inflation break their belief?
Since then, the trend has expanded across other major exchanges, with a $678 million withdrawal from OKX on Sunday, a $728 million withdrawal from Kraken on Monday, and another $400 million in BTC leaving Binance on Wednesday.
“This pattern suggests that the latest wave of withdrawals is no longer isolated to one platform,” CryptoQuant analyst Amr Taha said in his latest QuickTake analysis.

The figures support the latest data showing Bitcoin whales and sharks have been accumulating over the last two months, a pattern that could trigger an eventual breakout from the range.
Other data also reflects an accumulation phase, as long-term holders (LTHs), investors who have held Bitcoin for more than 155 days, ramped up buying.
The LTH net position change has been positive since March 5, as about 155,450 BTC has been bought over the past 30 days.
In other words, holders are buying more on the dips, including the latest one below $68,000.

When Bitcoin leaves exchanges while LTHs expand their positions, it “usually signals lower immediate sell pressure and stronger conviction from investors with a longer time horizon,” Amr Taha said.
If this trend continues, the market could be entering another phase where tightening sell-side liquidity and stronger LTH demand “create a more supportive backdrop for price,” the analyst added.
Bitcoin price to revisit $65,000 before bounce
As Cointelegraph reported, $70,000 remains the key for the Bitcoin bulls and that losing it could trigger the next leg down.
The BTC/USD pair was trading below $67,000 at the time of writing, below the 50-day simple moving average (SMA) and the 200-week exponential moving average (EMA).
Bears will attempt to push the price toward the $65,000-$63,300 demand zone, with a deeper focus on the range low below $60,000, reached on Feb. 6.

“It’s quite clear that there’s not enough strength for the markets to move higher after that rejection at $75K,” MN Capital founder Michael van de Poppe said in a recent X post.
An accompanying chart suggested that the price was seeking to print a higher low within the $65,000 to $66,000 range, failing which “we’ll start to see an acceleration downwards,” van de Poppe said, adding:
“I would be looking at longs in the lower-$60K range.”

The Glassnode liquidity heatmap highlighted “stronger” whale bid orders near $65,000, suggesting that the BTC price could retest this area before a bounce.

As Cointelegraph reported, a break and close below the ascending trend line at $68,000 could result in Bitcoin price dropping toward $60,000, where it could consolidate next.
This article does not contain investment advice or recommendations. Every investment and trading move involves risk, and readers should conduct their own research when making a decision. While we strive to provide accurate and timely information, Cointelegraph does not guarantee the accuracy, completeness, or reliability of any information in this article. This article may contain forward-looking statements that are subject to risks and uncertainties. Cointelegraph will not be liable for any loss or damage arising from your reliance on this information.

Key Takeaways
- On Friday, Hedgeye initiated a short position on AppLovin (APP), projecting a 30% downward move.
- Andrew Freedman from Hedgeye contends that MAX, the mediation platform, represents APP’s true advantage—not its AXON AI technology.
- MAX dominates more than 60% of worldwide mobile gaming ad impressions, providing critical data that powers AXON’s capabilities.
- In markets beyond gaming where MAX lacks mediation control, AXON’s performance shows significant variability.
- The firm characterizes APP as an “infrastructure monopoly” that faces mounting competitive threats while generating unsustainable margins.
AppLovin (APP) shares declined 1% Friday following Hedgeye’s announcement of a new short position on the stock, with the research firm projecting as much as 30% downside from present price levels.
Andrew Freedman, an analyst at Hedgeye, released the bearish thesis, challenging the prevailing market narrative surrounding the company’s valuation.
Freedman’s central contention is that market participants have fundamentally misunderstood AppLovin’s business model. Rather than being an artificial intelligence powerhouse as many believe, Hedgeye argues the company’s real strength originates from a different source.
“The primary competitive advantage for AppLovin isn’t AXON, its machine learning technology,” Freedman stated. “Rather, it’s MAX, the mediation infrastructure commanding more than 60% of global mobile gaming ad impressions.”
MAX functions as AppLovin’s advertising mediation infrastructure. Positioned between game developers and advertising buyers, it orchestrates the bidding mechanism for ad inventory within mobile gaming applications.
Given MAX’s commanding position in mobile gaming ad auctions, it accumulates an extensive repository of exclusive bidding intelligence. This proprietary data stream, according to Freedman, is the critical ingredient enabling AXON’s predictive accuracy.
“AXON’s effectiveness diminishes substantially without access to MAX’s data,” the analyst noted.
Performance Challenges Beyond Gaming Territory
The analysis spotlights a significant vulnerability in AppLovin’s diversification strategy. Beyond mobile gaming boundaries, MAX doesn’t maintain mediation dominance—creating a substantially different competitive landscape.
In these alternative sectors, AXON must function without the comprehensive data infrastructure it leverages within gaming environments. Freedman’s research indicates performance outcomes vary considerably under these conditions.
This observation carries weight because AppLovin has aggressively pursued expansion into e-commerce and additional non-gaming categories. Should AXON prove unable to duplicate its gaming success in other verticals, the company’s expansion narrative faces serious challenges.
Current short interest in AppLovin stands at merely 4.5%, indicating the broader market maintains a predominantly optimistic outlook.
Valuation Concerns From Hedgeye
Freedman characterized AppLovin as representing “an infrastructure monopoly narrative”—though his tone was decidedly cautionary.
According to Hedgeye’s assessment, this monopolistic position faces increasing competitive pressure, while the company currently benefits from profit margins that exceed sustainable levels. This suggests the differential between AppLovin’s present earnings and long-term capability may be larger than market participants recognize.
While Hedgeye hasn’t published a precise price objective corresponding to its 30% downside forecast, the analysis implies substantial repricing risk should investors reconsider the AI-related valuation premium.
APP shares have surged 48% during the trailing twelve months, adding substantial market capitalization throughout this period.
Friday’s modest 1% pullback appears relatively insignificant against the backdrop of that extended rally, though Hedgeye’s detailed critique introduces a noteworthy contrarian perspective to what has predominantly been an analyst community expressing bullish sentiment.
With short interest remaining at 4.5%, there isn’t yet substantial positioning against AppLovin—however, Hedgeye has now established one of the most thoroughly articulated bearish arguments on the stock to emerge publicly.
Tesco F&F launches ‘effortlessly chic’ trousers in time for spring
Iran Has Distracted From the Mag 7 Woes. Why the Slump Is a Good Thing for Stock Markets.
Trump Auctions 2024 Suit Pieces on Official Meme Coin Site


-
 Crypto World7 days ago
NIO (NIO) Stock Plunges 6.5% as Shelf Registration Sparks Dilution Worries
-
 NewsBeat2 days ago
Manchester United reach agreement with Casemiro over contract clause amid transfer speculation
-

 Crypto World6 days ago
Best Crypto to Buy Now: Strategy Just Spent $1.57 Billion on Bitcoin During Fear While Early Investors Quietly Enter Pepeto for 150x Potential
-

 Crypto World6 days ago
Bitcoin Price News: Bhutan Sells $72 Million in BTC Under Fiscal Pressure, but the Smart Money Entering Pepeto Sees What the Market Does Not
-

 News Videos2 days ago
Parliament publishes latest register of MPs’ financial interests
-

 Sports4 days ago
Remo Stars and Kano Pillars Strengthen Survival Hopes in NPFL
-

 Sports4 days ago
Gary Kirsten Accuses Pakistan Cricket Board Of ‘Interference’, Mohsin Naqvi Responds
-

 Business5 days ago
No Winner in March 21 Drawing as Prize Rolls to $133 Million for Next
-

 Tech5 days ago
Give Your Phone a Huge (and Free) Upgrade by Switching to Another Keyboard
-

 Tech5 days ago
AI enters the chat: New Seattle dating app relies on tech to facilitate meaningful human connections
-

 News Videos4 days ago
Ch 9 Financial Management Part 1 | Detailed One Shot | Class 12 Business Studies Boards 2026
-
Business7 days ago
Columbia Sportswear enters $500 million credit agreement with JPMorgan Chase
-

 Tech6 days ago
Today’s NYT Connections Hints, Answers for March 22 #1015
-

 Business24 hours ago
Instagram, YouTube Found Responsible for Teen’s Mental Health Struggle in Historic Ruling
-

 Business5 days ago
Will Duke Basketball Win It All? Duke Basketball Enters Second Round as Third Favorite to Claim NCAA Title
-

 Sports5 days ago
2026 Kentucky Derby horses, odds, futures, preview, date: Expert who hit 12 Derby-Oaks Doubles enters picks
-
 NewsBeat5 days ago
Update on Wisbech river crash as search for teenage boy enters fifth day
-
 Entertainment4 days ago
Cynthia Bailey Dishes on ‘RHOA’ Season 17, Discusses Kandi
-
 NewsBeat2 days ago
Tesco is selling new Cadbury Dairy Milk bar and people can’t wait to try it
-

 Tech4 days ago
Samsung will soon let you control smart home devices from your car’s dashboard
You must be logged in to post a comment Login