

Crypto World
What Is the Wyckoff Trading Method?
The Wyckoff method is a technical analysis framework developed by Richard D. Wyckoff in the early 20th century. It focuses on analysing price and volume to identify institutional activity and market cycles.
The method is based on the idea that large market participants drive trends through accumulation and distribution phases. Traders use this approach to anticipate price movements and identify potential entry and exit points.
This article explains the core principles of the Wyckoff trading method, including its laws, market cycle, and application in modern Wyckoff trading strategies.
Wyckoff Method Explained (Quick Summary)
- The Wyckoff method is a price and volume-based trading framework
- It was developed by Richard D. Wyckoff in the early 1900s
- It focuses on institutional behaviour, often referred to as “smart money”
- The model includes four phases: accumulation, markup, distribution, and markdown
- Traders use Wyckoff schematics to identify potential reversals and trend continuation
- The method is applied across forex, stocks, commodities, and crypto* markets
What Is the Wyckoff Method in Technical Analysis?
The Wyckoff method is a type of technical analysis developed in the early 20th century by Richard D. Wyckoff, a renowned stock market trader and analyst. The method assumes markets are driven by supply and demand, which form repeatable and tradable price patterns.
The Wyckoff methodology provides a structured framework for building trading strategies based on price and volume behaviour. This system includes the relationship between price and volume, the identification of Wyckoff market structure, and the role liquidity plays in financial markets.
The Wyckoff method remains widely referenced in modern technical analysis and institutional trading frameworks. Its principles are closely aligned with price–volume analysis and market structure concepts used across global financial markets.
Why the Wyckoff Model Works
Large financial institutions need liquidity to execute sizeable orders without excessive slippage. To fill these orders, they require counterparties on the other side of the trade.
Liquidity clusters around predictable levels: above equal highs, below equal lows, beyond trendlines, and at support and resistance zones. Stop-loss orders and breakout entries sit at these levels in high concentration. Institutions target these pools because they provide the volume needed to absorb large positions at favourable prices.
By driving prices through these key levels, institutional participants trigger stops and breakout orders, generating the liquidity they need to build or offload positions. This mechanism of liquidity engineering, driven by institutional trading activity, is the fundamental idea behind the Wyckoff theory in forex, commodities, crypto*, stocks, and more.
Key Principles of Richard D. Wyckoff Method
There are a few fundamental principles of the Wyckoff methodology that are critical to your understanding: the Composite Man and the three laws.
Composite Man
The Composite Man represents a single dominant market operator whose actions traders analyse to interpret price movements. He is, in essence, the representation of smart money trading activity. Wyckoff believed that the Composite Man carefully plans and executes his trades, encouraging buyers (or sellers) only after he has accumulated a sizable position.
The Law of Supply and Demand
Simply put, if the demand for an asset is larger than its supply, prices will rise. On the other hand, if the supply of an asset is larger than its demand, prices will decrease.
The Law of Cause and Effect
This law states that Wyckoff events, such as accumulation and distribution, act as causes that drive future price movements. It also says that the effect, or the price movements, are proportional to the cause. An accumulation that occurs on the daily timeframe will produce a much more significant effect than one on the 1 minute, for instance.
The Law of Effort vs Results
This law says that price movements are a result of effort, characterised by volume. If a bullish trend is supported by strong volume, it will likely continue. High volume within a range, without price progress, may indicate weakening momentum and a potential trend reversal.
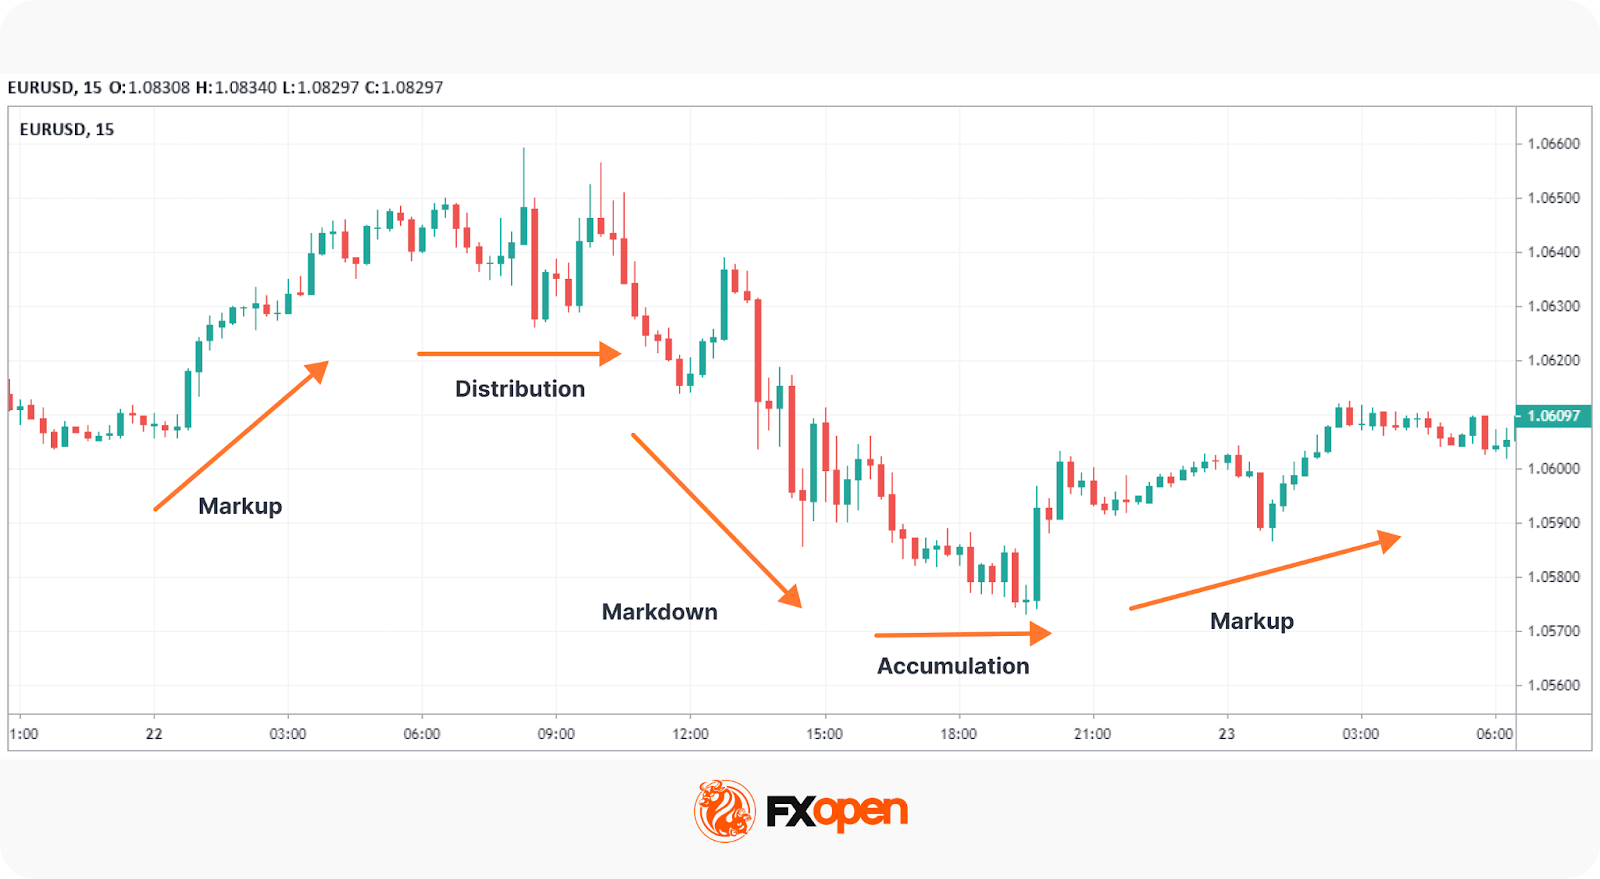
Wyckoff Market Cycle: Accumulation, Markup, Distribution, Markdown

The Wyckoff methodology frames the markets in four repeated phases. These are accumulations, markups, distributions, and markdowns.
Accumulations
Most often seen in ranges, the Wyckoff accumulation pattern represents areas where large players are building up a position to go long before the market reveals its true direction to other traders.
Markups
Once they hold a large enough position, these players start to bid the price up, encouraging other traders to jump in and push the price up further. Increasing participation reinforces upward momentum, pushing price out of the range and initiating a sustained uptrend. Note that a markup may have multiple re-accumulations where it pauses and consolidates before breaking higher.
Distributions
Once the price reaches its target and the buying pressure from other traders subsides, the big players will begin to distribute (sell) their positions while building up shorts. This Wyckoff distribution will, again, look like a range before a sharp move down.
Markdowns
This sharp move down is known as the markdown. It’s essentially the opposite of a markup: financial institutions push the price down and encourage traders to enter short positions to begin a downtrend. Like markups, there are also phases of redistribution that consolidate before moving lower.
How Traders Apply the Wyckoff Method Today
While the core principles remain unchanged, traders have adapted the Wyckoff methodology to suit modern markets and tools. Here are the most common applications:
- Market structure identification: Traders use Wyckoff schematics to label live price action, mapping accumulation and distribution phases across forex, equities, and commodities.
- Wyckoff volume profile integration: Modern charting platforms allow traders to overlay volume profiles onto Wyckoff ranges, pinpointing where the heaviest activity occurred.
- Multi-timeframe confirmation: Many traders identify a Wyckoff phase on higher timeframes (e.g., daily), then drop to lower timeframes (e.g., 1-hour). This may help to refine entries around Springs, Tests, or LPS zones.
- Confluence with other tools: The Wyckoff method is frequently combined with order flow data, support/resistance levels, and indicators like the RSI to add confirmation layers.
- Algorithmic detection: Some institutional and retail traders use algorithms to scan for Wyckoff-like structures across multiple instruments simultaneously.
Wyckoff Schematics Explained: Accumulation and Distribution Patterns
These cycles can be identified using standard Wyckoff chart patterns based on price and volume behaviour. If you want to test your own understanding, you may use the TickTrader platform with us at FXOpen.
Note that Wyckoff accumulations and distributions are practically identical, just flipped upside down. The key concepts, points, and phases across Wyckoff schematics are all the same.
Type 1 Schematics
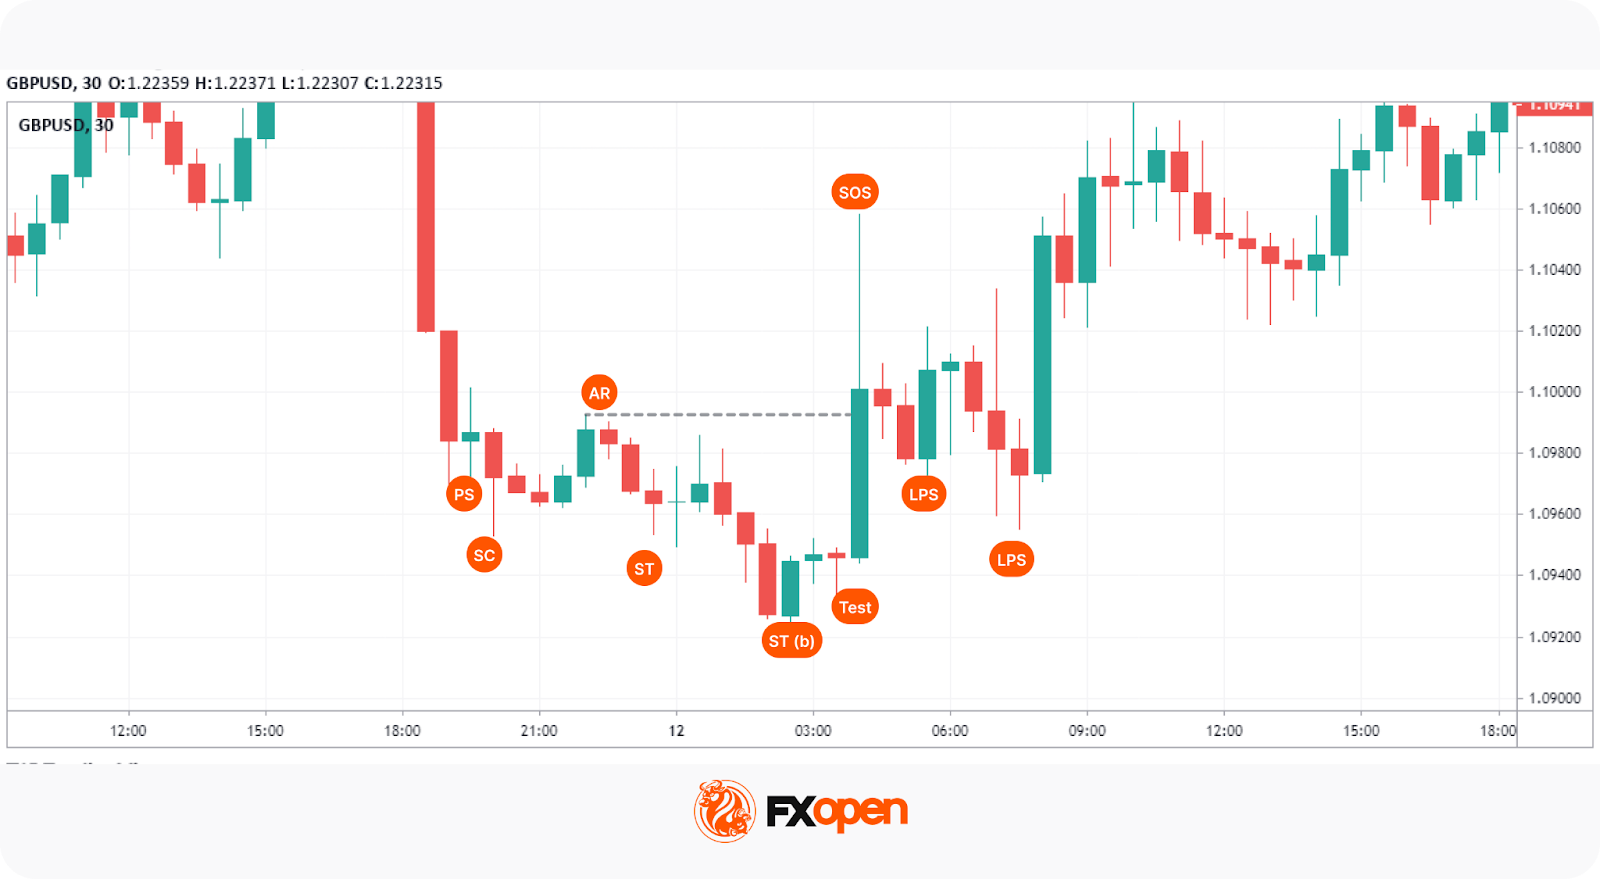
Wyckoff Accumulation Schematic
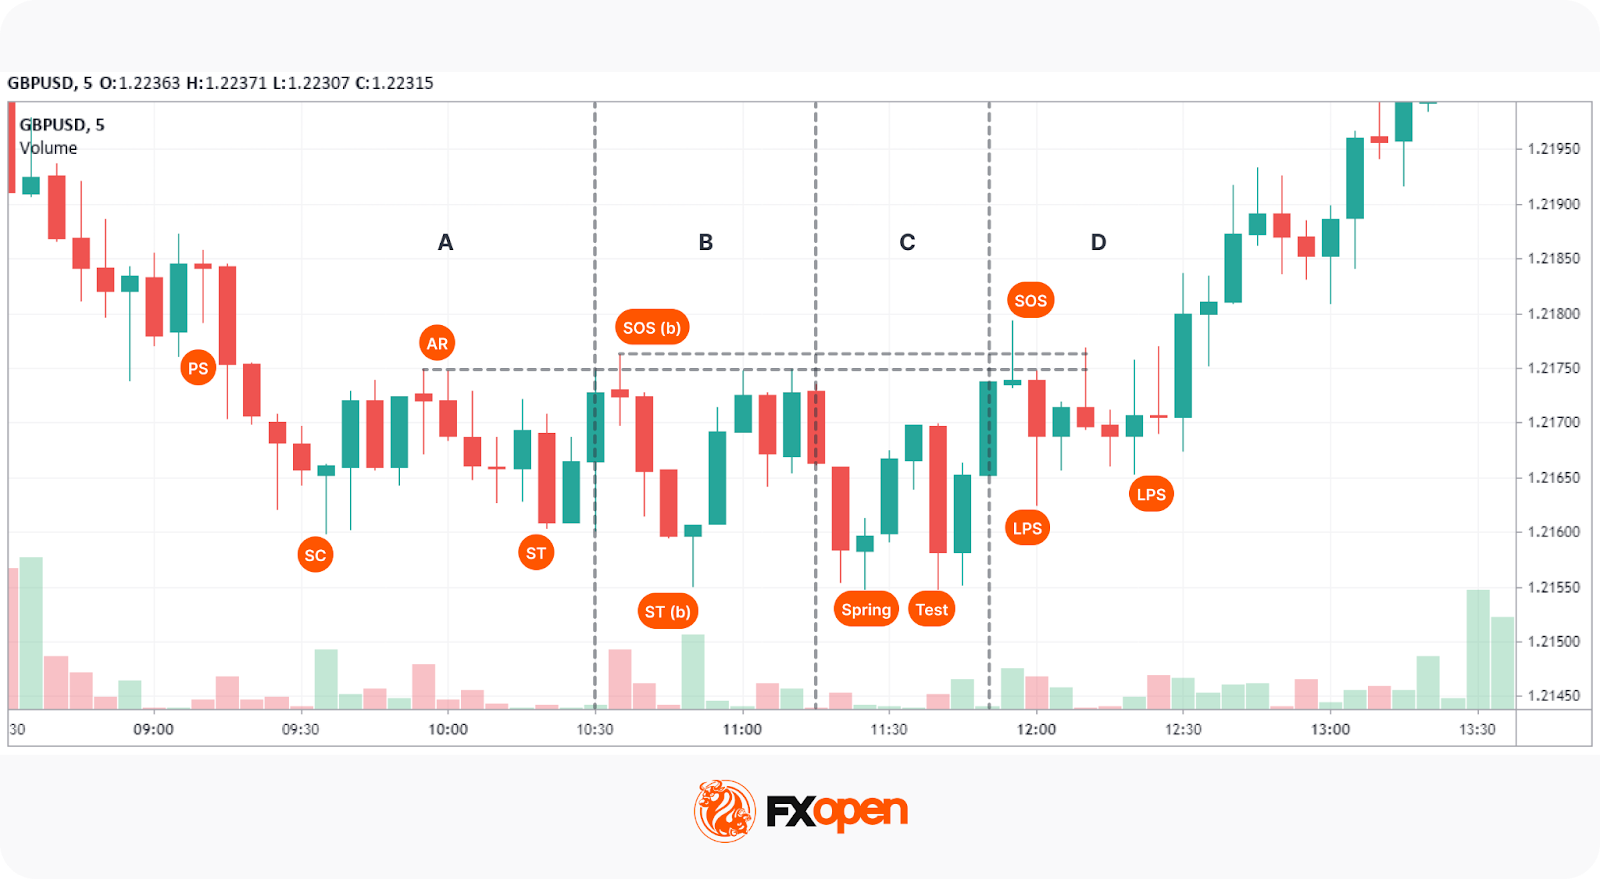
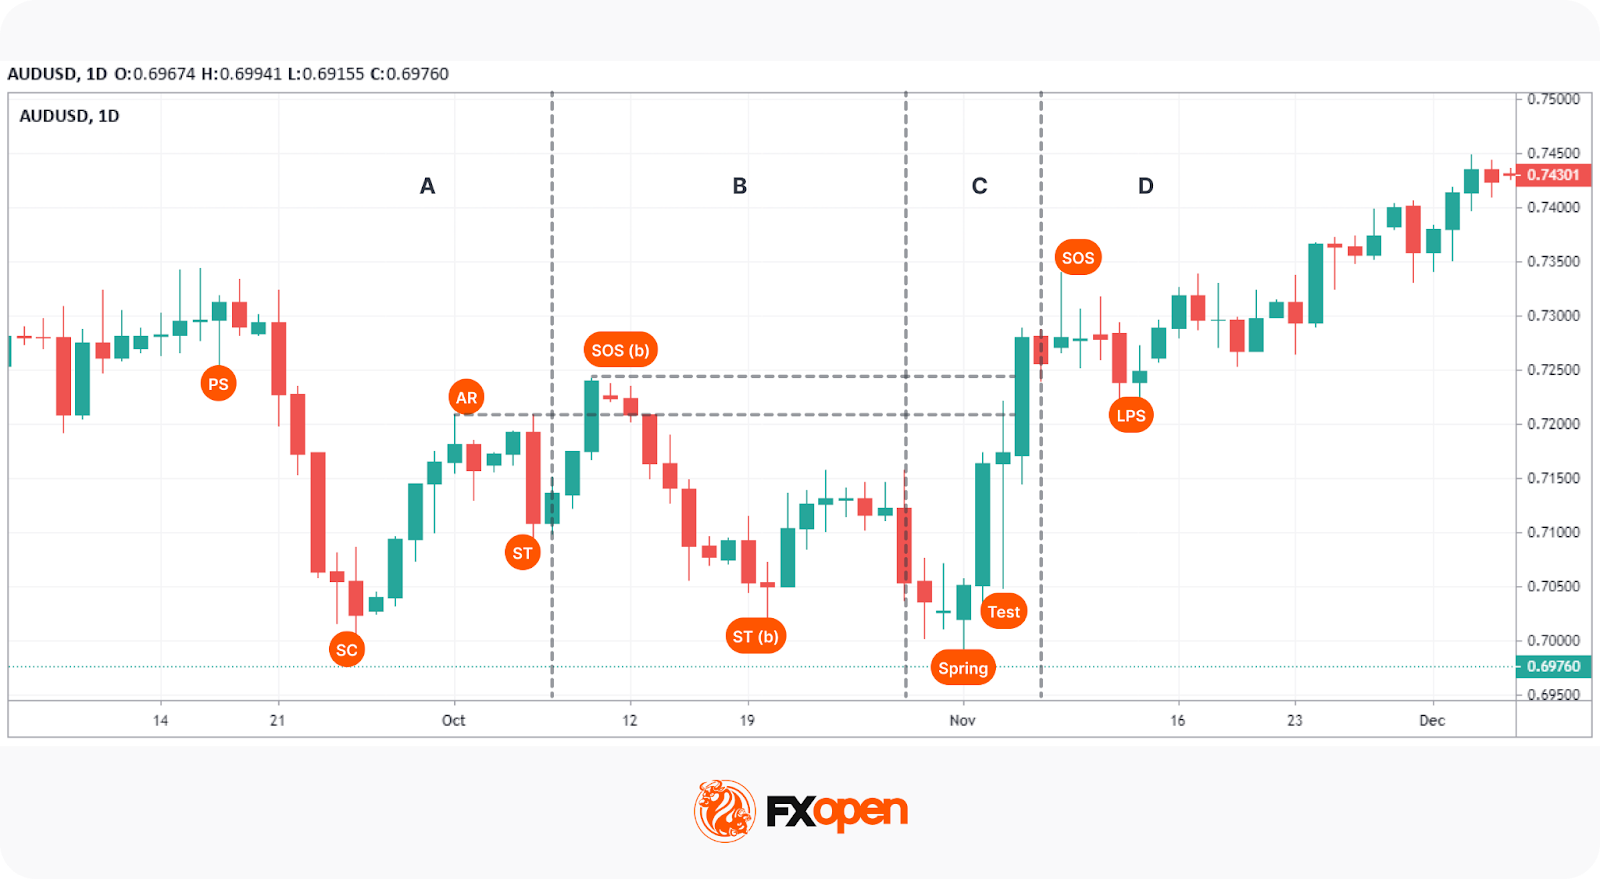
Phase A
- Preliminary Support (PS): After a markdown, buying action interrupts the downtrend and causes a slight uptick in price. Volume increases.
- Selling Climax (SC): Long traders have their stop losses triggered, while breakout traders jump in short, believing the downtrend will continue. Here, the Composite Man absorbs the selling pressure. The SC may sometimes leave a long wick that shows the buying pressure.
- Automatic Rally (AR): Given that selling pressure is exhausted, buy orders push prices up easily, and shorts exit their trades, typically below PS. Note that the high of the AR sets the first upper bound for the accumulation, as seen in the Wyckoff accumulation examples above.
- Secondary Test (ST): The price falls from the AR to form a low near the SC, creating the ST. It can create equal lows or end up slightly higher or lower than the SC. This may also occur multiple times, creating a visual area of support. Volume is likely to be low.
Phase B
- Sign of Strength in Phase B (SOS(b)): After the ST, the price can rebound higher than the AR, forming the SOS(b). This won’t always occur, but if it does, it creates our second upper bound. Again, it is supposed to fall below the PS.
- Secondary Test in Phase B (ST(b)): This is the first “liquidation” event of the accumulation. A sharp move downward takes out the ST and, ideally, the SC. Here, the Composite Man taps into the stop losses below the ST and breakout sell orders to fill his buy orders, creating the Cause.
Phase C
- Spring: Following the ST(b), the price will likely test the first and second upper bounds, but it is supposed to always stay within them. After doing so, the Composite Man will push the price down for the last time below the ST(b), liquidating any orders resting below here to form the Spring.
- Test: After creating the Spring, the Composite Man will often test the area to see if there’s any supply left. The price will make a higher low near the Spring, often with a lower volume. Note that there can be multiple tests.
Phase D
- Last Point of Support (LPS): Following the test and another leg higher, the price will pull back to test supply once again. LPSs are usually much higher than the initial Tests and are often the last move before the markup begins. LPSs can form both before and after the SOS, depending on how the price action plays out.
- Sign of Strength (SOS): Here, the price breaks above the highest upper bound and confirms the schematic, often with higher volume. As mentioned, the LPS can form after the breakout and fall back in the range or test the upper resistance line. After the SOS forms, the markup begins and produces the Effect as seen in the Wyckoff accumulation chart above.
Wyckoff Distribution Schematics
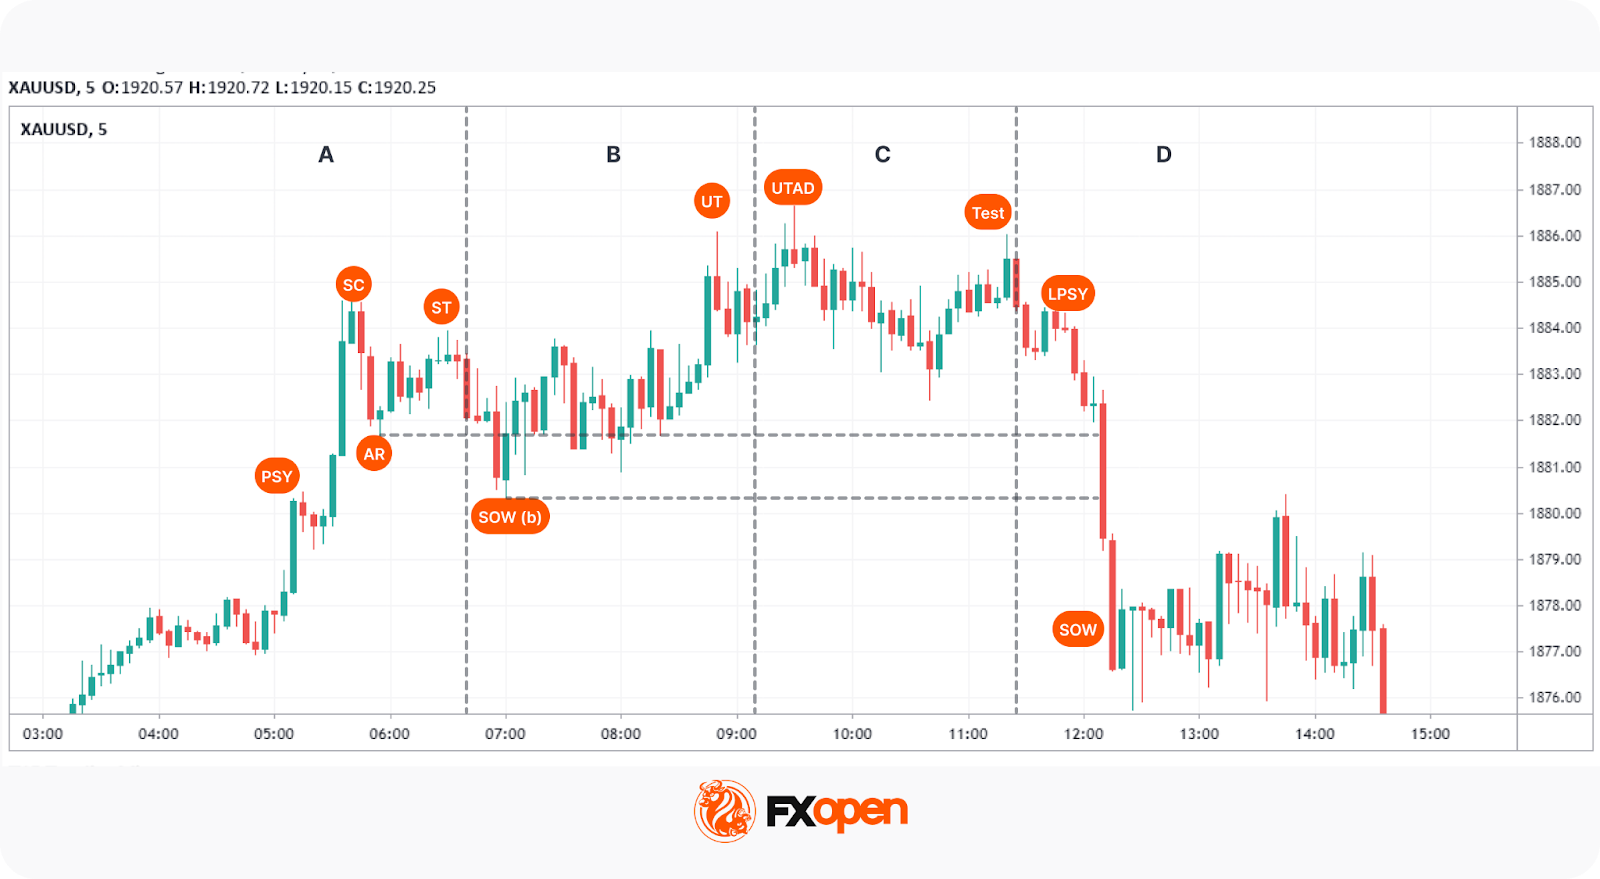
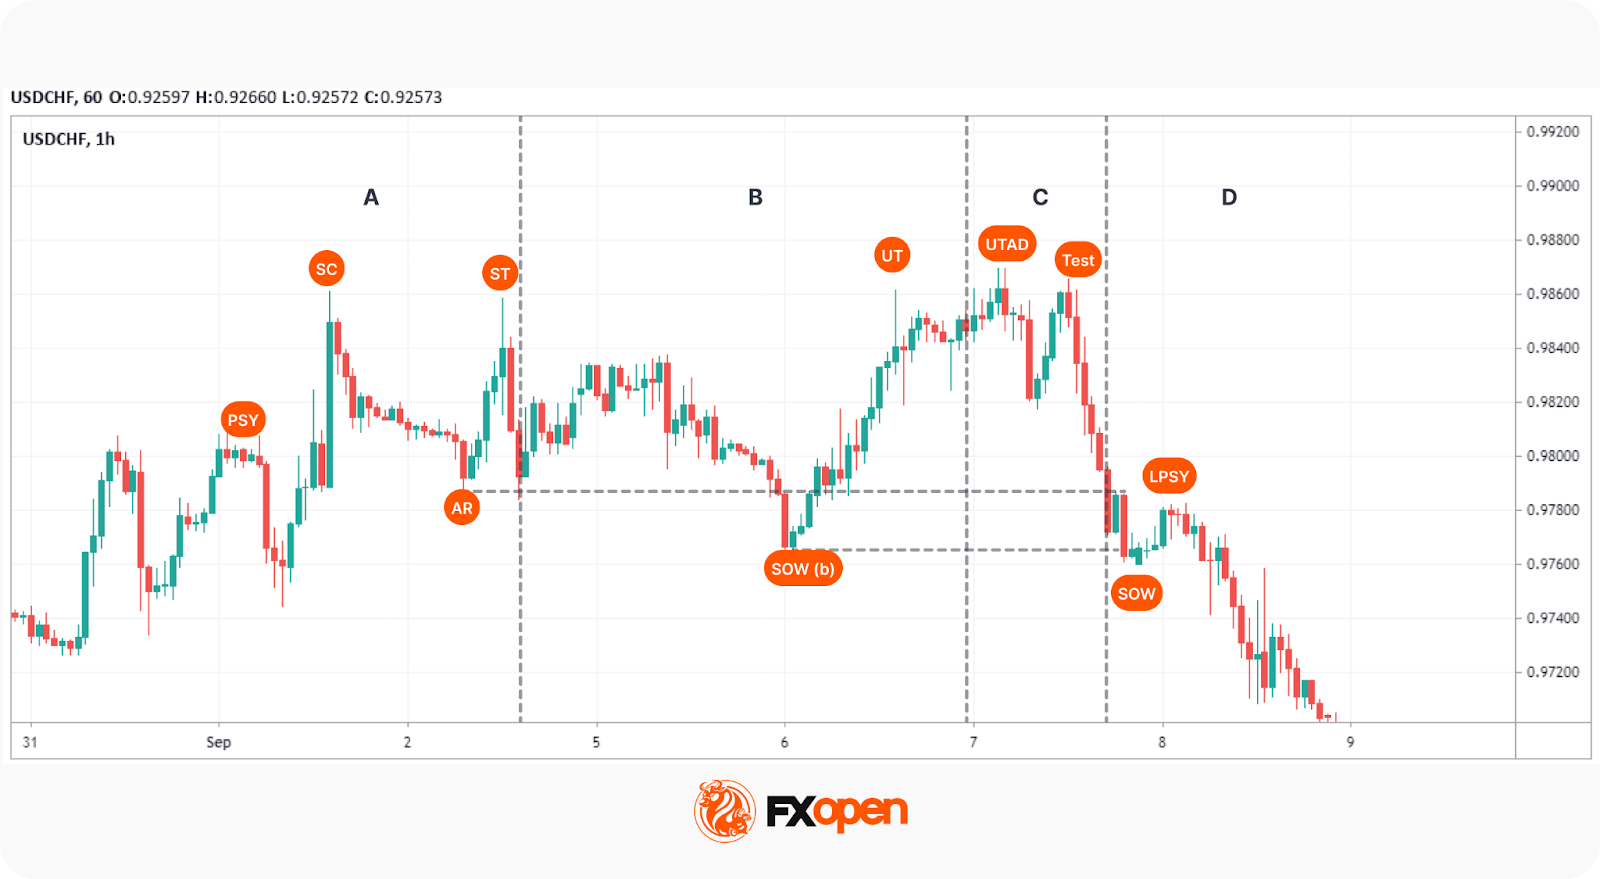
Phase A
- Preliminary Supply (PSY): After an uptrend, the Composite Man begins to unload his position, causing the price to fall slightly.
- Buying Climax (BC): Like the SC, the BC is where buying pressure is at its most extreme, coinciding with high volume.
- Automatic Rally (AR): After buying subsidies, prices fall to form the AR, usually above the PSY. This is our first lower bound, shown in the Wyckoff distribution examples.
- Secondary Test (ST): The price revisits the BC area to create another high usually below the BC, building up liquidity for future phases. The volume should be low.
Phase B
- Sign of Weakness in Phase B (SOW(b)): A move down past the AR that indicates supply is entering the market. Like the SOS(b), the SOW(b) doesn’t always occur, but if it does, it forms our second lower bound.
- Upthrust (UT): This is the distribution equivalent of an ST(b). It must reach higher than the ST and may take out the BC. Here, the Composite Man uses short stop losses and breakout trades to fill his sell orders.
Phase C
- Upthrust After Distribution (UTAD): The UTAD is analogous to an accumulation’s Spring. Following the UT, one last tap into areas of liquidity is made before the markdown.
- Test: Similar to accumulation, there are usually one or more tests made near the UTAD attempting to see if any demand remains.
Phase D
- Last Point of Supply (LPSY): After the price declines, the final demand tests are made. Like accumulations, these points can occur before or after the Sign of Weakness. They’re typically the last bullish moves made before the markdown begins.
- Sign of Weakness (SOW): The lowest bound is broken as the price begins to confirm its bearish structure. Another LPSY can be made, but this is the final step before the markdown.
Type 2 Schematics
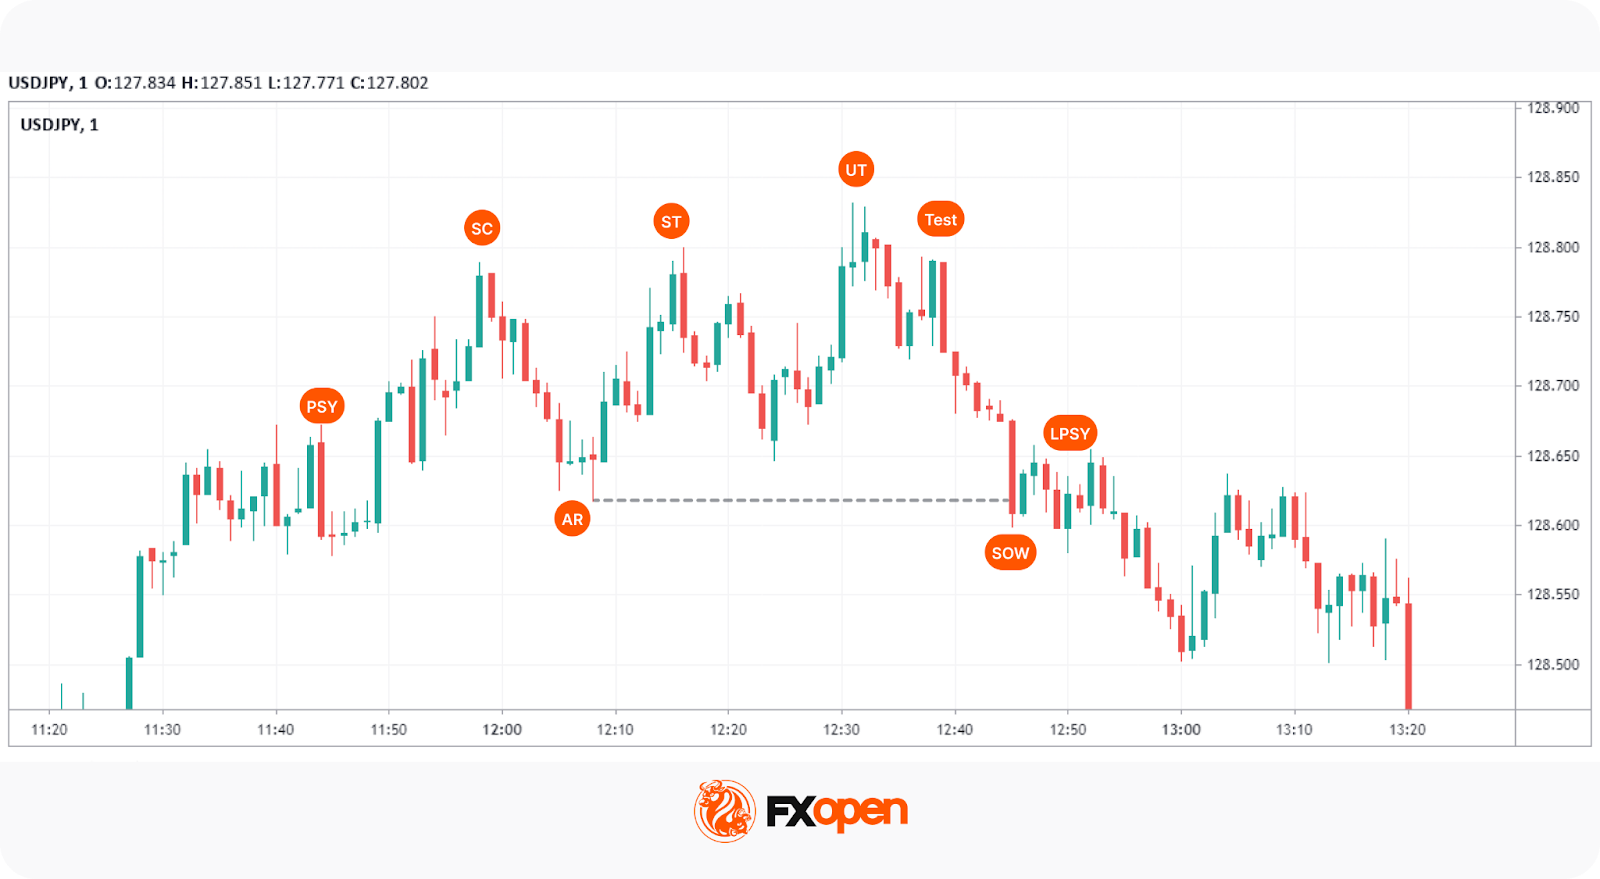
Type 2 Wyckoff schematics have all of the same ingredients, just without a Spring or UTAD. Wait for the SOS or SOW to occur. If you have just a single ST and an ST(b), or an ST and UT, and the markup or markdown begins, you know it’s a Type 2. This is seen in the Wyckoff graph above. Both can be traded in the same ways as a Type 1.
Wyckoff Trading: Pros and Cons
The Wyckoff trading method offers a systematic approach to analysing market trends and making trading decisions. Like any trading strategy, it comes with its advantages and disadvantages that traders often consider.
Pros
- Structured Framework: The Wyckoff method provides a clear framework for identifying market phases, supporting traders when building entry or exit strategies.
- Focus on Market Psychology: It emphasises understanding the behaviour of the “Composite Man,” which can offer insights into market sentiment and potential moves.
- Versatility: The Wyckoff strategy can be applied across various markets, including forex, stocks, commodities, and cryptocurrencies*.
- Incorporates Volume Analysis: Analysing volume in relation to price action may help traders to gauge the strength of trends and potential reversals.
Cons
- Complexity: The Wyckoff trading method requires a deep understanding of market mechanics and chart patterns, which may be challenging for beginners.
- Requires Patience: Identifying the correct phase of a Wyckoff accumulation or distribution can take time, and trades may require waiting for confirmation signals.
- Subjective Interpretation: Like many technical analysis tools, the Wyckoff method depends on the trader’s interpretation, leading to varying results.
- Not Foolproof: While the Wyckoff market cycle method is powerful, it is not infallible and is typically used in conjunction with other analysis tools.
The Five-Step Wyckoff Trading Strategy
Luckily, Wyckoff developed a five-step framework for applying his methodology. The following structure outlines how traders build Wyckoff trading strategies using price and volume analysis. It can be adapted to develop a Wyckoff forex trading strategy.
1. Determine the current market trend. Assess whether the overall market is bullish or bearish.
2. Choose your market. Find a pair that strongly correlates to this overall trend.
3. Find a pair currently undergoing accumulation or distribution.
4. Determine the pair’s readiness to move. This involves examining the Wyckoff phase of the asset and volume. If a Spring or UTAD has just occurred, you could consider it viable.
5. Find your entry. Traders often enter on Tests or LPS/LPSYs.
Final Thoughts
Despite its age, Wyckoff’s logic in forex trading remains relevant. It reflects important price–volume relationships and market structure, which support traders when determining key turning points. It may form the basis of a trading approach when combined with other types of technical analysis, such as harmonic patterns, indicators, and support/resistance levels.
If you want to apply the Wyckoff method or test other trading approaches, you can consider opening an FXOpen account to trade over 700 markets with tight spreads and low commissions.
FAQ
What Are the 4 Stages of the Wyckoff Cycle?
The Wyckoff cycle is a four-phase model that describes how markets move from consolidation to trend and back again. The four stages are accumulation (where institutional players build positions), markup (the resulting uptrend), distribution (where those positions are sold), and markdown (the subsequent downtrend).
What Are the Three Laws of Wyckoff?
The three laws of Wyckoff are foundational principles that govern price behaviour within the methodology. The Law of Supply and Demand determines the direction of price. The Law of Cause and Effect links the size of an accumulation or distribution phase to the magnitude of the resulting move. The Law of Effort vs Results compares volume (effort) to price movement (result) to assess whether a trend is likely to continue or reverse.
What Is the Wyckoff Trading Range?
The Wyckoff trading range is a consolidation phase where accumulation or distribution occurs before a trend develops. It reflects a balance between supply and demand, often preceding a breakout or reversal.
What Timeframe Is Popular for the Wyckoff Method?
The Wyckoff method is a multi-timeframe approach, though daily and weekly charts are the most commonly referenced. Patterns on higher timeframes tend to produce more defined schematics and more significant price moves.
Can You Use Wyckoff for Day Trading?
Day trading with the Wyckoff method is possible, though it demands a strong grasp of short-term market structure and fast interpretation of price and volume shifts. Traders typically apply Wyckoff schematics on intraday charts (e.g., 5-minute or 15-minute) while referencing higher timeframes for context.
What Are Wyckoff Trading Strategies?
Wyckoff trading strategies are systematic approaches built around identifying accumulation and distribution phases using price and volume analysis. They typically involve recognising a Wyckoff schematic, confirming its phase, and acting on key events like Springs, Tests, or Signs of Strength.
*Important: At FXOpen UK, Cryptocurrency trading via CFDs is only available to our Professional clients. They are not available for trading by Retail clients. To find out more information about how this may affect you, please get in touch with our team.
This article represents the opinion of the Companies operating under the FXOpen brand only. It is not to be construed as an offer, solicitation, or recommendation with respect to products and services provided by the Companies operating under the FXOpen brand, nor is it to be considered financial advice.

Ethereum’s native token, Ether (ETH), has fallen more than 35% against Bitcoin (BTC) over the past year, and the downtrend may still have further to go.
Key takeaways:
- ETH may plunge another 40% as it mirrors the 2025 bear trend setup.
- Rising Ether reserves on Binance, even as Bitcoin reserves decline, add to the case for further ETH downside.
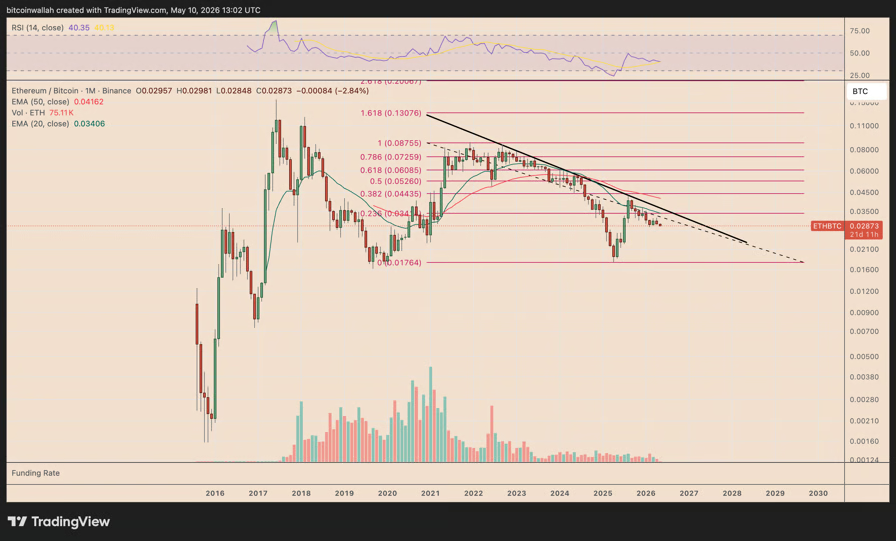
ETH risks 40% decline after topping near multi-year trend line
ETH/BTC remains stuck below a multi-year descending trend line that has capped every breakout attempt since 2022, including one that preceded the nearly 70% decline between 2024 and 2025.

ETH/BTC monthly chart. Source: TradingView
A similar setup now appears to be taking shape again.
After retesting the same trend line in August 2025, ETH/BTC was rejected near a confluence of resistance that included the 0.382 Fibonacci retracement level and the 50-month exponential moving average (50-month EMA, red).
The pair has since turned lower and slipped back below its 20-month EMA (green) support near 0.034 BTC, a sign that sellers continue to dominate the trend.
The next major downside target for 2026 comes in around 0.0176 BTC if the weakness persists. This level, down about 40% from current rates, aligns with the 2020 cycle bottom.
Exchange reserves highlight ETH-BTC divergence
Exchange data points to persistent sell-side risk for Ether.
As of May, ETH reserves on Binance, the world’s largest crypto exchange by volume, had climbed to 3.62 million ETH, accounting for roughly 24.6% of all Ether held across exchanges, according to data resource CryptoQuant.

Ethereum reserves on Binance. Source: CryptoQuant
In comparison, Bitcoin reserves on Binance have fallen.

Bitcoin reserves on Binance. Source: CryptoQuant
Rising exchange balances usually signal that more tokens are available for sale, which can weigh on price when demand is not strong enough to absorb the added supply.
Falling reserves, on the other hand, often suggest coins are being moved off exchanges for longer-term holding.
In that sense, Binance reserve trends reinforce the broader market picture: Ether is facing relatively higher available supply, while Bitcoin is showing signs of tighter exchange-side liquidity.
Related: Four signs that show Ethereum’s rally is exhausted at $2.4K
Ethereum’s weakness reflects a broader shift in fundamentals. For years, Ether has lagged behind Bitcoin in part because Ethereum’s “ultrasound money” narrative has lost momentum.
BTC, on the other hand, continues to draw strength from corporate accumulation led by firms like Strategy and its growing integration into Wall Street portfolios.
Bitcoin extended its sideways drift around the $80,000 level as traders weighed a possible retest lower ahead of the week’s end. After a midweek push toward the $83,000 mark that failed to hold, market participants are watching whether BTC can sustain above $80,000 or slip toward established support as momentum remains broadly constructive for a continuation higher.
Key takeaways:
- Bitcoin has held above $80,000 through the weekend, but a sub-$80,000 retest remains on the radar for a test of nearby support.
- The prevailing bullish narrative hinges on a confluence of support levels just under $80,000—the so-called bull market support band formed by two moving averages—and a broader high-timeframe blue zone around $75,000.
- Inflation data in the U.S. next week is viewed as a potential catalyst, with traders saying the CPI release is largely priced in for the near term.
- Key levels to monitor include the $74,000 area as a critical fallback and liquidity sweeps that could signal the next move.
Near-term path: bulls test the 2D bull market band
Price action on the hourly to short-term charts shows BTC padding gains after a quiet weekend, avoiding a drop back below the $80,000 threshold. The decline from the midweek high near $83,000 failed to establish a sustained breakout, prompting traders to re-emphasize a retest of support as a prerequisite for a renewed upside move. Analysts point to the “bull market support band”—a duo of moving averages just below the $80,000 level—as a critical zone where buyers have previously stepped in during pullbacks.
“On the low-timeframes, after rejecting at the high-timeframe resistance range, I believe the most likely outcome is a short-term pullback toward the 2D Bull Market Support Band, which has been a strong reversal zone over the last couple of months,” Cryptic Trades wrote in a recent post.
In the view of Cryptic Trades, as long as BTC holds above the band and the adjacent blue-highlighted high-timeframe support around $75,000—which aligns with a notable bottoming formation observed in April 2025—the door remains open to higher prices. The note underscores how these zones have repeatedly proven to be meaningful turning points during the current rally phase.
Support levels and what traders want to see
Market participants highlighted a preference for a clean break above the stubborn area in the low $80,000s to confirm a more durable move higher. Daan Crypto Trades noted that the initial advance above the band was not a decisive breakout, signaling the need for a sustained hold in the upper $80,000s to validate continued upside. “Would want to see a move to at least clear that sticky area around the low $80Ks and hold there for a week or two,” they advised on social media.
From a broader perspective, the $74,000 region remains in view as a potential liquidity pivot should selling pressure intensify. Traders caution that a sweep of liquidity around key pivots could signal the next directional shift, making the area around the $74k–$75k zone particularly consequential for the near-term trajectory.
Inflation data as a potential catalyst
The upcoming release of the U.S. Consumer Price Index (CPI) for April looms as a defining factor for the near-term path of BTC, with traders arguing that the data is largely priced in by the market. The CPI print is expected to reflect continuing macro pressures stemming from oil prices and broader geopolitical developments, with some observers suggesting the outcome could influence how large players adjust their risk profiles around this event.
“It’s priced in,” wrote Killa, a consistently watched figure on X, noting that BTC has tended to rally after the last two CPI releases. However, following 2025 CPI price action, he warned, there could be a shift as big players de-risk into the event counter-narrative.
Cryptocurrency traders point to the CPI milestone as a potential catalyst that may either reinforce Bitcoin’s upside or reintroduce volatility as participants reassess inflation trajectories and macro risk. While a hotter-than-expected print could inject risk-off sentiment, a cooler outcome could keep the bulls in control as liquidity conditions remain supportive in the longer horizon. The immediate question remains whether price action can maintain its footing above the core support bands while traders await fresh cues from the inflation data.
In addition to the CPI narrative, traders continue to monitor the response around the bull market support band and the broader blue-support region near $75,000. Should price manage to stabilize and then clear the upper resistance area, the odds of a renewed ascent improve, according to multiple analysts who weighed in on the weekend chatter.
Overall, the market appears to be trading with a structured plan: hold above the key support zones to preserve the upside thesis, while waiting for a clearer signal from price action and the CPI release. The outcome this week may hinge on whether buyers can demonstrate resilience in the face of a potential near-term pullback or whether selling pressure intensifies, prompting a deeper test of the lower support band.
As the week unfolds, traders will be paying close attention to whether Bitcoin sustains above the 2D bull market band and the blue higher-timeframe support near $75,000, and how the CPI reading translates into shifts in risk appetite. If the price remains anchored above these levels, the case for further upside remains plausible; if not, a test of the $74,000 area could reframe the near-term outlook and set the stage for a more measured consolidation before the next leg higher.
Crypto World
Binance Reports 77% Emerging Market User Share as 1.4 Billion Adults Remain Unbanked Globally

TLDR:
- Binance’s emerging market user share rose sharply from 49% in 2020 to 77% in 2026, per platform data.
- Around 83% of Binance’s multi-product users are based in emerging markets, showing deep regional engagement.
- Stablecoin savers on Binance grew from 4% in 2020 to 28% in 2026, with 73% based in emerging markets.
- Crypto platforms like Binance operate 24/7 with no minimum balance, lowering barriers for unbanked users globally.
Binance is addressing global financial exclusion by offering a full spectrum of products within one account. The platform aims to serve users across income levels, from basic savings to advanced trading tools.
With 1.4 billion adults still unbanked worldwide, according to the World Bank, crypto infrastructure is emerging as a practical alternative.
Binance’s data shows growing adoption in emerging markets, where its user share climbed from 49% in 2020 to 77% in 2026.
Crypto Infrastructure Reshaping the Economics of Financial Access
Traditional finance has long placed high barriers on participation. Geography, account minimums, and eligibility standards have historically shut out hundreds of millions of people.
Crypto platforms operate differently — they run 24/7, require no minimum balance, and function across borders through a single mobile interface.
Digital-asset platforms allow users to hold assets, earn yield, make payments, and access global markets. This changes who gets to participate and on what terms.
A person with limited access to traditional investment products can still engage with financial markets through one digital account.
Binance has built its platform around this premise. The company offers tools for capital preservation, passive yield, on-chain utility, and advanced trading — all within one account.
As Binance noted, “one account, access to a full spectrum of products so users can start where they are and grow on their own terms.” Users can start at any level and expand their participation over time as their needs evolve.
This range of options makes access more practical and durable. When diverse products exist on one platform, users are not forced to move between services as their financial goals change. That continuity matters, especially in markets where financial infrastructure is still developing.
Emerging Markets Drive Multi-Product Engagement on Binance
Binance’s growth in emerging markets reflects real demand for broader financial services. Users in these regions are not just trading — they are saving, sending money across borders, and generating yield.
Platform data shows that 83% of multi-product users are based in emerging markets. Binance has described its role as building “a platform where more of those financial functions can come together in a usable way.”
Stablecoin adoption further supports this pattern. Approximately 28% of Binance users holding at least $10 keep more than half their portfolio in stablecoins.
That figure was just 4% in 2020. Around 73% of all stablecoin savers on the platform are based in emerging markets.
This behavior points to Binance functioning as an integrated financial account for many users. Rather than a trading venue alone, the platform is serving savings and payments needs alongside crypto investing.
Binance stated that “the next era of finance will not be defined only by whether markets are open, but by whether more people can actually navigate them.” That is a meaningful shift in how users in lower-income environments are engaging with digital finance.
The data also shows that users with access to more products stay more engaged. Those using three or more products account for 14% of total active users. Broader product access, therefore, directly connects to deeper financial participation.

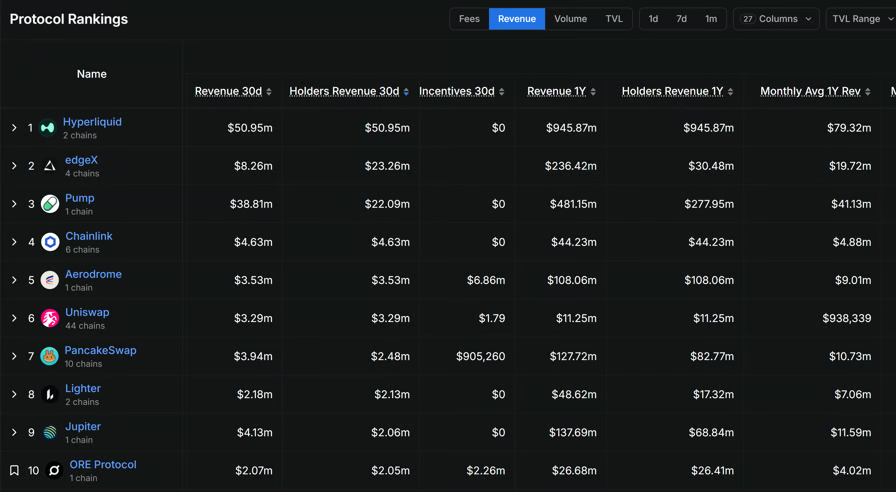
Three of DeFi’s relatively young applications, including Hyperliquid, EdgeX and Pump.fun, have distributed a combined $96.3 million to token holders over the past 30 days, as the sector’s focus shifts to actual earnings.
Hyperliquid led the pack, generating $50.95 million in revenue over the period, all of which went directly to token holders with zero spent on incentives, according to data from DefiLlama. Pump.fun came in second with $22.09 million returned to holders out of $38.81 million in total revenue. EdgeX followed with $23.26 million distributed to holders from $8.26 million in protocol revenue, suggesting that the platform is drawing on reserves or alternative income streams to reward holders.
On an annualized basis, Hyperliquid has generated $945.87 million in revenue over the past year, all returned to holders, while Pump.fun sits at $481.15 million and EdgeX at $236.42 million.
Among other major protocols, Chainlink returned $4.63 million to holders, Aerodrome $3.53 million and Uniswap $3.29 million across 44 chains. PancakeSwap generated $3.94 million in revenue but returned $2.48 million to holders while spending $905,260 on incentives.
Related: DeFi can freeze stolen funds, but not everyone agrees it should
Crypto community now focuses on revenue
The data comes as revenue is becoming the metric that matters most in crypto, with token holders pushing protocols to justify their valuations through actual earnings rather than transaction volumes or network growth figures.
“Nobody cares that your chain does 10x the TPS anymore,” wrote Robbie Klages, co-founder of The Rollup, referring to a blockchain’s measure of transactions per second. “The market is ‘show me the money right now.’ Treat it like a business not a network growth thesis,” he added.

Top DeFi protocols by Holders Revenue. Source: DefiLlama
Another X user wrote that the shift from narrative to earnings is “permanent now,” warning that protocols unable to show real revenue will be valued like pre-revenue startups in a rate hike environment, a reference to the kind of sharp devaluations that hit speculative assets when capital gets expensive.
Related: Aave-Linked DeFi United Details rsETH Recovery Plan
DeFi is becoming backend for onchain economy
Andre Cronje, founder of the popular DeFi protocol Yearn.Finance, said that DeFi in 2026 looks less like a speculative playground and more like functioning financial infrastructure. He noted that stablecoins have grown into a $320 billion market led by Tether and Circle, decentralized exchanges are processing over $160 billion in monthly spot volume and perpetual DEXs are handling $540 billion monthly.
Cronje added that lending protocols, including Aave, Morpho and Maple Finance, are sitting on $28 billion in active loans, while real-world assets are increasingly being used as onchain collateral. “DeFi is no longer just competing for APY. It is becoming the backend for the onchain economy,” he wrote on X.
Magazine: Guide to the top and emerging global crypto hubs — Mid-2026
Crypto World
BeInCrypto Institutional Research: 15 Digital Asset Custody Providers Behind Crypto Adoption


Digital asset custody is one of the core trust layers behind institutional crypto adoption. Best Custody Provider is an award category within The BeInCrypto Institutional 100, an annual research-driven program recognising institutional digital asset excellence across 26 categories and six pillars.
This category sits in Pillar 2: Capital Markets & Infrastructure. The 15 firms below are its longlist. A shortlist will be named in May 2026, with the winner announced at Proof of Talk in Paris on June 2–3, 2026.
- Long list: 15 custody providers across federal charters, NYDFS trust companies, MPC platforms, bank-backed JVs, APAC custodians, and off-exchange settlement networks
- Initial pool: More than 30 qualified custodians and digital asset custody platforms screened; 15 advanced to the long list
- Scoring: 50% quantitative data · 50% Expert Council
- Criteria assessed: Qualified custodian status, assets under custody, institutional client base, audit posture, product depth, jurisdictional reach, settlement innovation, reputation
- Data sources: OCC, NYDFS, FCA, FINMA, BaFin, MAS, MiCA-CASP registers, Jersey FSC, audited filings, company disclosures, PitchBook, Tracxn, and Crunchbase
| # | Firm | Custody Sub-Segment | HQ | Reach | Top Licensure / Charter | Representative Work |
|---|---|---|---|---|---|---|
| 1 | Anchorage Digital | Federal-chartered crypto custody | SF / NY / Sioux Falls / Singapore / Porto | $4.2B valuation Backed by a16z, GIC, Goldman Sachs, KKR, Visa, Tether |
First federally chartered US crypto bank Atlas Settlement Network is live with institutional integrations |
OCC National Trust Bank Charter MiCA via BaFin, VARA, Singapore, Korea |
| 2 | Coinbase Custody | US ETF custody provider | Wilmington / SF, USA | Custodian for 8 of 11 spot Bitcoin ETFs 80%+ of US Bitcoin ETF assets routed via Coinbase |
NYDFS Limited Purpose Trust Charter Coinbase Custody Trust Company |
Primary custodian for IBIT Co-custodian for Morgan Stanley Bitcoin Trust |
| 3 | BitGo | Federally chartered public custody | Sioux Falls / Palo Alto, USA | $104B+ AUC Thousands of institutional clients |
Custody tech used by TradFi banks Coverage across the US, EU, Switzerland, UAE, Singapore, Australia, Hong Kong |
NYSE IPO completed in Jan 2026 First public federally chartered digital asset infrastructure firm |
| 4 | Fidelity Digital Assets, NA | Asset manager-operated federal trust | Boston, USA | Custody for FBTC and FETH Backed by Fidelity’s ~$15T+ AUA platform |
Acquired TRES Finance and Dynamic Building a custody, wallet, and accounting operating system |
OCC charter approved Dec 2025 Plans include stablecoin issuance and staking services |
| 5 | BNY | Global custodian with crypto surface | New York, USA | ~$55.8T AUC/A Live BTC and ETH custody since 2022 |
OCC-regulated bank Institutional custody operations |
Co-custodian for Morgan Stanley MSBT IBIT cash custodian and administrator |
| 6 | Fireblocks | MPC-native institutional platform | New York / Tel Aviv | 2,400+ institutional clients $4T+ annual digital asset transfers in 2025 |
NYDFS BitLicense SOC 2 Type II + ISO 27001 |
OCC conditional national trust bank charter Conversion from the New York State trust |
| 7 | Ripple Custody (Metaco) | Bank custody technology stack | Lausanne / SF | Acquired Tungsten Custody in the UAE Standard Chartered reportedly weighing full takeover |
OCC conditional charter FINMA-regulated custody stack |
Ripple rebranded Metaco as Ripple Custody Ripple National Trust Bank’s charter was conditionally approved |
| 8 | Sygnum | Swiss-licensed crypto bank | Zurich, Switzerland | 2,000+ institutional clients $5B+ AUM; unicorn valuation |
FINMA banking licence MAS, Liechtenstein, ADGM permissions |
Reached unicorn status in Jan 2025 Sygnum Connect and Sygnum Protect live |
| 9 | Komainu | TradFi-backed custody JV | St Helier, Jersey | Operations across Jersey, UK, Italy, Singapore, UAE, Japan ~120 staff target |
Jersey FSC, UK FCA, UAE VARA Italy OAM and Singapore MAS via Propine |
$75M Series B funded in Bitcoin Propine acquisition expanded Singapore custody hub |
| 10 | Zodia Custody | Standard Chartered-backed custody | London, UK | ~150 staff across 7 offices 75+ digital assets supported |
UK FCA, Ireland MiCA-CASP, Lux, ADGM Hong Kong and Japan FSA coverage |
Sub-custodian for Clearstream Crypto offering AnchorNote off-exchange settlement launched |
| 11 | Crypto Finance Group | Exchange-parent regulated custody | Zurich, Switzerland | Deutsche Börse majority-owned Clearstream institutional distribution |
FINMA Switzerland BaFin licences + MiCA-CASP |
Aura private wealth platform launched Qualified custodian in the Fireblocks network |
| 12 | Hex Trust | APAC custody anchor | Hong Kong | $104M raised APAC and MENA institutional coverage |
HK SFC, MAS CMS, ADGM, VARA, DFSA Multiple licence categories |
ClearLoop settlement network expanded Komainu was integrated into ClearLoop in 2025 |
| 13 | Copper | Off-exchange settlement custody | London, UK | 200+ institutional clients Multi-billion-dollar assets under custody |
Switzerland SO-FIT affiliation Abu Dhabi ADGM licence |
~$2B valuation 9+ exchanges on the ClearLoop network |
| 14 | Ceffu | Institutional MPC and OES | Lithuania | 200+ institutional clients Multi-billion assets under custody |
Lithuania MiCA-CASP Multi-jurisdiction sub-custody arrangements |
MirrorX off-exchange settlement integrated with KuCoin EU institutional custody status expanded |
| 15 | Bakkt Trust | NYDFS-regulated US custody | New York, USA | ICE-origin institutional custody Multi-asset custody platform |
NYDFS Limited Purpose Trust Charter BitLicense + 50-state MTLs |
Bakkt Warehouse supports institutional custody $125M+ insurance across cold and warm wallets |
About This List
The BeInCrypto Institutional 100 — Digital Asset Custody (2026 Long List) identifies custody providers supporting institutional digital asset adoption. The category covers federally chartered crypto banks, NYDFS trust-company custodians, MPC-native platforms, bank-backed custody ventures, APAC-regulated custodians, exchange-parent custody platforms, and off-exchange settlement networks.
Firms primarily focused on stablecoin issuance are evaluated separately under stablecoin infrastructure categories. Parent firms may appear in other categories when their custody product line meets that category’s threshold independently.
Methodology
This category is evaluated under Track A of the BeInCrypto Institutional 100 methodology: 50% based on quantitative metrics and 50% on Expert Council scoring.
Assessment spans seven weighted criteria: regulator-recognized qualified custodian status, assets under custody and institutional client base, regulatory and audit posture, product depth, multi-jurisdiction reach, settlement and capital-efficiency innovation, and reputation.
Data was verified using OCC national trust bank charter approvals, NYDFS BitLicense and trust-company registers, FCA, FINMA, BaFin, MAS, MiCA-CASP authorizations, Jersey FSC records, audited filings, company disclosures, partnership announcements, and private-market sources, including PitchBook, Tracxn, and Crunchbase. Figures reflect the most recent available data at the time of publication.
The post BeInCrypto Institutional Research: 15 Digital Asset Custody Providers Behind Crypto Adoption appeared first on BeInCrypto.
TLDR:
- Hyperliquid burned over 45 million HYPE tokens worth more than $2 billion using collected platform fees.
- The exchange generates close to $1 billion annually and directs 100% of revenue toward HYPE buybacks and burns.
- Burned tokens represent roughly 14.5% of the 310 million HYPE distributed in the first trader airdrop.
- Hyperliquid recorded $1.5 billion in net inflows over three months as Arbitrum lost the same amount in outflows.
Hyperliquid has burned more than 45 million HYPE tokens as its fee-driven buyback model gains attention across the crypto market. The decentralized exchange recorded approximately $824,688 in fees within a single 24-hour period.
All collected fees went directly toward purchasing and burning HYPE tokens. The platform now reports close to $1 billion in annual revenue. Net flow data further shows $1.5 billion in inflows over the past three months.
Hyperliquid’s Buyback and Burn Model Sets a New Standard
Hyperliquid’s tokenomics structure differs from most crypto projects in circulation today. Rather than selling tokens to cover operational costs, the platform channels all revenue into buybacks. This approach has resulted in the permanent removal of 45,116,933 HYPE tokens from supply.
According to data shared by Hyperliquid Hub on X, the burned tokens carry a market value of over $2 billion. That figure equals roughly 14.5% of the entire first trader airdrop, which totaled 310,000,000 HYPE tokens. The scale of this burn reflects a consistent and structured approach to reducing supply.
The daily burn has remained steady, which sets it apart from one-time or irregular token removal events seen elsewhere.
Each fee cycle feeds directly into the Auto-Fill mechanism, which executes the buyback and burn automatically. Users who sell their HYPE to the AF effectively contribute to the permanent reduction of circulating supply.
With close to $1 billion in annual revenue, the platform sustains this model without relying on external funding or token sales.
This positions Hyperliquid as a revenue-generating protocol that returns value to its token holders through supply reduction rather than direct distributions.
Hyperliquid Records $1.5 Billion in Net Inflows Over Three Months
Capital movement data shows a strong preference for Hyperliquid among traders shifting funds between platforms.
The exchange recorded $1.5 billion in net inflows over the last three months alone. This trend points to growing user confidence in the platform’s structure and reliability.
By contrast, Hyperliquid Hub on X noted that Arbitrum recorded $1.5 billion in net outflows during the same period.
The contrast between the two figures shows a clear directional shift in where traders are choosing to deploy capital. Hyperliquid appears to be the primary destination for those exiting Arbitrum.
Net flow figures are a common measure of capital movement across blockchain platforms. Consistent inflows typically reflect user acquisition and growing liquidity. For Hyperliquid, the $1.5 billion figure adds to an already active period of protocol growth.
Together, the burn data and the net flow numbers paint a picture of a platform gaining both liquidity and long-term token value. The combination of revenue-backed buybacks and rising inflows continues to draw attention from traders watching on-chain activity closely.
Bitcoin (BTC) eyed $81,000 into Sunday’s weekly close as traders saw a fresh support retest next.
Key points:
- Bitcoin preserves $80,000 over the weekend, but traders are waiting for a dip to retest a familiar chart feature.
- Continuation higher remains the overall consensus for what happens afterward.
- US CPI data is due out, with Bitcoin already “pricing in” the result.
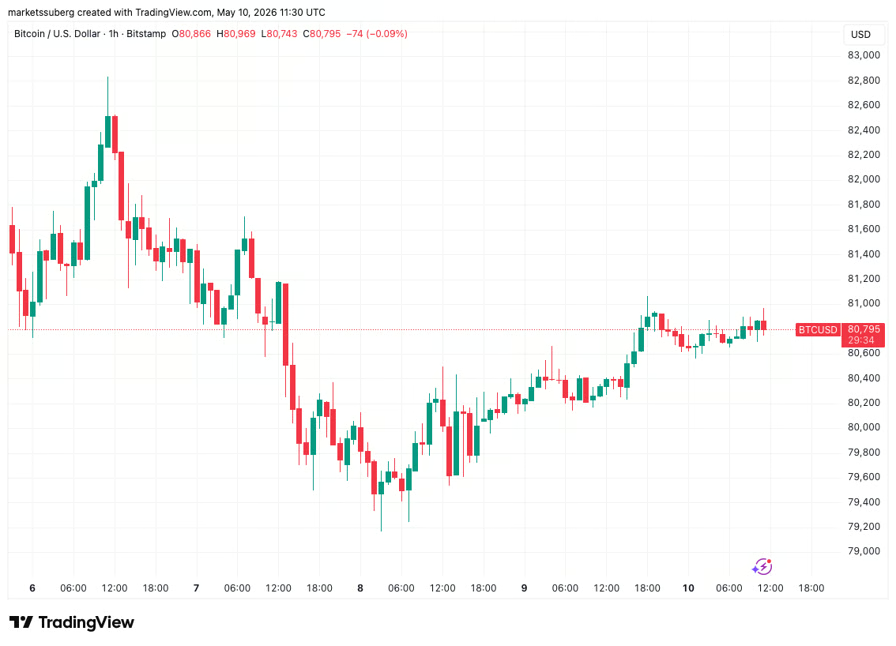
Bitcoin traders: Sub-$80,000 retest next
Data from TradingView showed BTC price action trending higher after a mostly flat weekend, avoiding a return below $80,000.

BTC/USD one-hour chart. Source: Cointelegraph/TradingView
After a midweek trip to near $83,000 failed to hold, however, traders saw the need for BTC/USD to retest support — something that they now reiterated.
Of particular interest was the bull market support band — two moving averages just below the $80,000 mark.
“On the low-timeframes, after rejecting at the high-timeframe resistance range marked in purple, I believe the most likely outcome is a short-term pullback toward the 2D Bull Market Support Band, which has been a strong reversal zone over the last couple of months,” analytics account Cryptic Trades wrote alongside a chart in its latest post on X.
“As long as price continues to hold above the support band and the broader high-timeframe support range marked in blue around $75K, which aligns with the April 2025 bottoming formation, I believe the most likely outcome remains further upside.”

BTC/USD one-day chart. Source: Cryptic Trades/X
Trader Daan Crypto Trades agreed, calling the initial move above the support band “not a clean break.”
“Would want to see a move to at least clear that sticky area around the low $80Ks and hold there for a week or two,” he told X followers.

BTC/USD one-week chart. Source: Daan Crypto Trades/X
CPI already “priced in” to BTC
Ahead of fresh US inflation data next week, trader Killa warned of headwinds returning for BTC price strength.
Related: Bitcoin Bollinger Bands push key breakout as creator acts on positive signal
The Consumer Price Index (CPI) for April, due out on Tuesday, was set to show the ongoing impact of the US-Iran war and oil-price rises on the economy.
“Its priced in,” Killa wrote on X.
“BTC has rallied after the last two CPI releases. However, if we follow 2025 CPI price action, we may see bigger players start de-risking into the event counter narrative.”

BTC/USD chart with CPI releases. Source: Killa/X
Support levels to watch also included the area around the bull market support band, with $74,000 on the radar, should it fail.
“I would watch for liquidity sweeps around this pivot to signal the next move,” Killa added.

Consumer fintechs and payment platforms are becoming one of the main distribution layers for crypto access. Best Digital Assets Fintech is an award category within The BeInCrypto Institutional 100, an annual research-driven program recognising institutional digital asset excellence across 26 categories and six pillars.
This category sits in Pillar 1: Retail to Crypto Bridge. The 15 firms below are its longlist. A shortlist will be named in May 2026, with the winner announced at Proof of Talk in Paris on June 2–3, 2026.
- Long list: 15 fintechs across crypto-native payment infrastructure, stablecoin wallets, Lightning-based consumer rails, retail brokers, enterprise acquirers, and cross-border fintech platforms.
- Initial pool: More than 30 consumer and B2B fintechs screened; 15 advanced to the long list.
- Scoring: 30% quantitative data · 50% Expert Council · 20% disclosed company data.
- Criteria assessed: Crypto product depth, distribution scale, regulatory standing, innovation, capital maturity, geographic reach, and reputation.
- Data sources: NYDFS, FinCEN, FCA, MiCA-CASP, OCC, MAS, CySEC, AUSTRAC, FINTRAC, audited filings, company disclosures, PitchBook, Tracxn, and Crunchbase.
| # | Firm | Fintech Sub-Segment | HQ | Reach | Top Crypto Licensure / Product | Representative Work |
|---|---|---|---|---|---|---|
| 1 | Stripe | Crypto-native payment infrastructure | South San Francisco / Dublin | 100+ country stablecoin accounts 100M+ businesses on Stripe |
Bridge OCC charter conditionally approved | Acquired Bridge and Privy Open Issuance powers Phantom CASH and MetaMask mUSD |
| 2 | PayPal / Venmo | Consumer wallet + stablecoin issuer | San Jose, USA | 436M active accounts PYUSD across 4 chains |
PYUSD issued by Paxos Trust | Expanded PYUSD into 70 markets Launched PYUSDx framework with MoonPay and M0 |
| 3 | Block (Cash App) | BTC-native consumer fintech | San Francisco, USA | 57M Cash App monthly actives $2.4B+ Bitcoin revenue Q4 2024 |
FinCEN MSB + state MTLs | Expanded Lightning integration globally Spiral continued Bitcoin core funding |
| 4 | Robinhood | Retail broker with crypto stack | Menlo Park, USA | 26M funded customers Bitstamp adds 5M+ users |
MiCAR access in EU Bitstamp FCA + NYDFS licences |
Closed Bitstamp acquisition in 2025 Expanded into Canada through WonderFi |
| 5 | Circle | Stablecoin issuer + banking distribution | Boston / NYC | USDC $73B market cap Embedded into core banking platforms |
OCC conditional charter approval | NYSE IPO completed in 2025 Circle Payments Network expanded to 200+ banks |
| 6 | Revolut | Multi-product fintech with crypto | London, UK | 65M customers globally Revolut X across the UK and the EEA |
FCA crypto registration + MiCAR-CASP | Expanded Revolut X across Europe Launched self-custody Revolut Wallet |
| 7 | SoFi Technologies | US fintech with crypto relaunch | San Francisco, USA | 10.9M members Galileo powers 100M+ accounts |
FinCEN MSB + state MTLs | Relaunched crypto trading in 2025 Stablecoin payments roadmap disclosed |
| 8 | KAST | Stablecoin-native cross-border fintech | Singapore | 1M+ users 190+ countries |
Operates through licensed partners | Closed $80M Series A in 2026 Stablecoin spending integrated with Visa |
| 9 | Nubank | LatAm fintech crypto distribution | São Paulo, Brazil | 65M customers globally Revolut X across UK and the EEA |
Paxos institutional trust framework | Expanded token support during 2025 Cross-border crypto custody rollout planned |
| 10 | eToro | Social trading + crypto platform | Tel Aviv / Bnei Brak | 30M users globally 100+ countries |
FCA crypto registration + AUSTRAC + FinCEN | Nasdaq IPO completed in May 2025 Unified crypto, stocks, and ETF trading |
| 11 | Strike | Bitcoin and Lightning fintech | Chicago, USA | 100+ countries 50-state US coverage achieved |
NY BitLicense + FinCEN MSB | Approved for NY operations in 2026 Launched Bitcoin-backed lending products |
| 12 | ChangeNOW | Non-custodial fintech ecosystem | Saint Vincent and the Grenadines | 8M+ users $1B+ monthly volume |
SOC 2 Type II + ISO 27001 | Expanded NOW ecosystem across wallets, custody, APIs, and payments Integrated across major wallet providers |
| 13 | Adyen | Enterprise payment processor | Amsterdam, Netherlands | MiCAR access in the EU Bitstamp FCA + NYDFS licences |
DNB + ECB supervised | Crypto acceptance expanded for Web3 merchants Stablecoin payout rails under development |
| 14 | Checkout.com | Enterprise merchant acquirer | London, UK | 2,000+ employees globally | FCA-authorized + DIFC regulated | Stablecoin settlement pilot announced in 2025 Expanded infrastructure for exchanges and onramps |
| 15 | BitPay | Crypto payments processor | Atlanta, USA | Active since 2011 Supports BTC + 12 other assets |
FinCEN MSB + multi-state MTLs | Expanded BitPay Card nationally Maintained merchant partnerships across retail and payments |
About This List
The BeInCrypto Institutional 100 — Digital Assets Fintech (2026 Long List) identifies fintech firms connecting fiat payment systems with digital assets through consumer apps, enterprise infrastructure, stablecoins, Lightning rails, wallets, and embedded crypto services.
The category includes crypto-native payment processors, retail fintech platforms, enterprise acquirers, stablecoin-driven fintechs, and non-custodial ecosystems. Firms whose primary role is fiat onramp infrastructure are evaluated separately under the Onramp/Offramp category.
Methodology
This category is evaluated under Track B of the BeInCrypto Institutional 100 methodology: 30% quantitative metrics, 50% Expert Council scoring, and 20% disclosed data.
Assessment spans seven weighted criteria: crypto product depth, distribution scale, regulatory standing, innovation, capital maturity, geographic reach, reputation, and contribution across fintech sub-segments.
Data was verified against NYDFS, FinCEN, FCA, MiCA-CASP, OCC, MAS, CySEC, AUSTRAC, and FINTRAC registers, as well as audited filings, company disclosures, partnership announcements, and private-market sources such as PitchBook, Tracxn, and Crunchbase.
The post BeInCrypto Institutional Research: 15 Fintechs Bridging Fiat and Digital Assets appeared first on BeInCrypto.
TLDR:
- CME Group listed SUI futures, making Sui only the fourth L1 alongside BTC, ETH, and SOL in regulated derivatives.
- Sui processed 65.8 million transactions in a single day within two months of its May 2023 mainnet launch.
- Three US staking ETFs from Grayscale, Canary Capital, and 21Shares listed in early 2026 on major exchanges.
- Hashi enables native Bitcoin collateral on Sui without wrapping or custody, with 20-plus institutions committing on day one.
Sui Network has completed three years since its May 2023 mainnet launch, marking the milestone with a string of institutional developments.
CME Group listed SUI futures contracts, making Sui only the fourth Layer-1 blockchain to enter CME’s regulated derivatives market.
The others before it were Bitcoin, Ethereum, and Solana. Three staking ETFs have listed in the US, cumulative active addresses passed 228 million, and DeFi total value locked peaked at $2.6 billion.
From Parallel Execution to Protocol Maturity
Sui launched with a clear architectural thesis: parallel execution should be built into a blockchain’s foundation, not added as an afterthought.
Within two months of launch, the network processed 65.8 million transactions in a single day. That figure was the highest recorded across all blockchains at the time, and gas fees remained nearly flat throughout.
Two infrastructure additions in 2023 shaped the chain’s long-term trajectory. In July, the Sui Foundation launched DeepBook, a native central limit order book embedded directly into the protocol.
Every DeFi application on Sui draws liquidity from the same shared pool, which is an uncommon design choice among Layer-1 networks.
In September 2023, zkLogin went live, allowing users to authenticate Web3 apps using Google or Facebook credentials.
Zero-knowledge proofs handle identity on-chain, removing the need for seed phrases or separate wallet setup. This lowered the entry barrier for mainstream users considerably.
By 2024, the focus shifted to consensus performance. In August, Mysticeti launched as a DAG-based consensus engine, cutting latency by 80% and bringing finality to 640 milliseconds.
Traditional financial players responded: Franklin Templeton announced a strategic partnership, and Grayscale launched the Grayscale Sui Trust.
Stablecoins, Bitcoin Collateral, and Regulated Products
Heading into 2025 and 2026, the infrastructure stack filled in steadily. Walrus Protocol added decentralized storage in March 2025, completing the native stack from execution to data storage. Mysticeti V2 followed in November, delivering sub-second finality and horizontal validator scaling.
In December 2025, 21Shares listed the first-ever SUI ETF on Nasdaq, a 2x leveraged product. By February 2026, three staking ETFs from Grayscale, Canary Capital, and 21Shares had listed in the US.
That same period saw USDsui launch through Stripe’s subsidiary Bridge, and cumulative stablecoin transfers on Sui crossed $1 trillion in March 2026.
Perhaps the most consequential development came with Hashi, developed by Mysten Labs. Hashi is a native Bitcoin collateralization primitive that allows BTC to be used directly as on-chain collateral, without wrapping or centralized custody.
The system is secured through MPC and Move’s ownership model. Over 20 institutions committed on day one, as noted in a post from the official Sui Network account.
Zero-fee stablecoin transfers were also announced at Sui Live Miami as coming soon, extending the chain’s payments utility further.
Crypto World
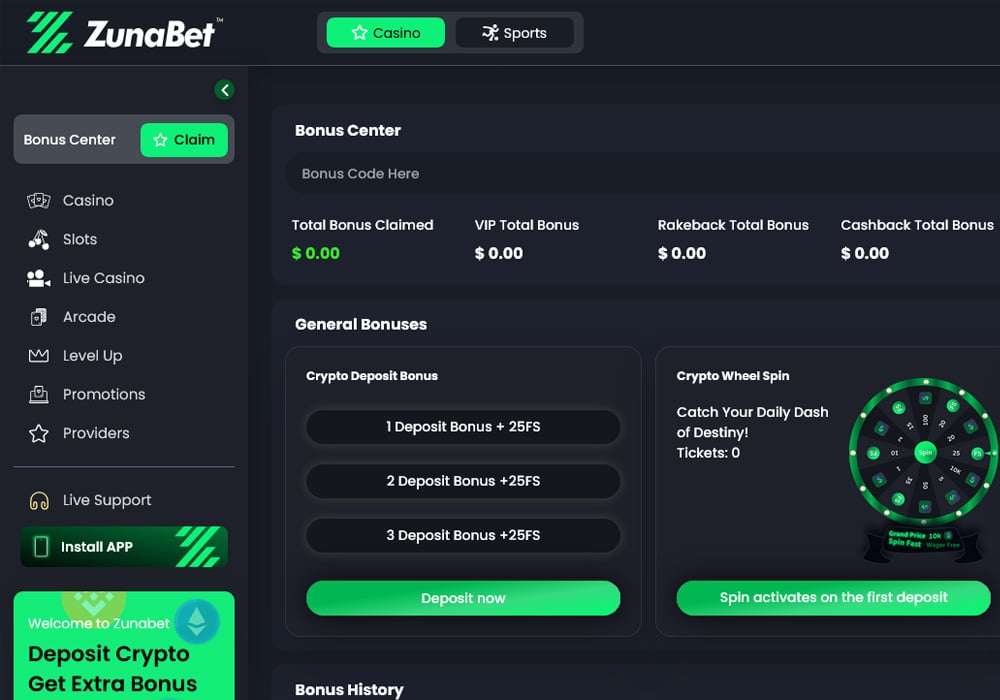
Caesars Brought Las Vegas Online. DraftKings Brought Fantasy Sports Online. ZunaBet Brought The Future Online.

Every platform’s identity is shaped by where it came from. Caesars brought the weight of Las Vegas online — decades of land-based casino heritage, a loyalty program connecting digital play to physical properties, and a brand that carried implied quality into the online space before the product had to prove it independently. DraftKings brought daily fantasy sports online — an existing engaged audience, American sports cultural fluency, and the operational readiness to capture the US sports betting market when regulation opened it.
Both identities produced genuine platforms for genuine players. The Caesars player who trusts the name from their Las Vegas visits. The DraftKings player who was already using the platform for fantasy leagues before real-money betting was legal. Both platforms continued to serve those players after the transition to licensed gambling.
ZunaBet brought something different online in 2026. Not a land-based heritage. Not a fantasy sports audience. The future — a platform built from scratch in the current year for the player who exists in the current year. The crypto-native player. The esports bettor. The player who wants sixty-three providers worth of game variety and a loyalty program that states its return before the first deposit. This article examines all three and explains what each identity produced.
Caesars: The Las Vegas Identity Online
The Caesars identity online is built on the transfer of trust from physical to digital. A player who has stayed at a Caesars hotel, played at a Caesars casino floor, or earned tier status through land-based activity finds the online product a continuation of a relationship that already existed. The brand’s implied quality arrived before the product had to earn it independently.
The casino product reflects genuine casino heritage. A substantial library from established providers, live dealer content informed by physical table game expertise, and a product that benefits from decades of understanding how casino players engage with their favourite games. The Caesars online casino is built by people who have been operating casinos long enough to understand the category deeply.
The sportsbook covers major US and global sports with in-play betting. The product serves the player who wants sports alongside casino from a trusted name.
Caesars Rewards is the identity’s most distinctive product feature. The cross-platform connection between online activity and land-based tier status — hotel rooms, dining, entertainment, physical casino status — has genuine value for the player who uses Caesars properties. Online gambling becomes part of a broader relationship with the brand rather than a standalone product.
The identity has clear limits for the player outside its profile. The cross-platform loyalty feature that makes Caesars distinctive is irrelevant to the exclusively online player who never visits a physical property — the program reduces to a standard points system for that player. Payment infrastructure is fiat-based with business-day withdrawal timelines. Crypto support is minimal. Geographic operation is bounded by US state licensing.
DraftKings: The Fantasy Sports Identity Online
The DraftKings identity online is built on audience conversion. The daily fantasy sports player who spent years managing lineups and tracking statistical outcomes found the transition to real-money sports betting natural when the legal framework allowed it. The brand they trusted for fantasy became the brand they trusted for betting without requiring them to learn a new platform or extend trust to a new name.
The sportsbook is the product that audience conversion produced. American sports coverage built for the fantasy-origin bettor — NFL with the market depth and statistical orientation that reflects genuine understanding of how this player engages with football, NBA, MLB, NHL, and college sports with comparable investment. The app is refined through years of this specific player’s feedback. In-play coverage is reliable. The product serves its converted audience consistently.
The casino has grown in proportion. A reasonable library, live dealer content, standard table game variants. The product serves the sports-first player’s secondary casino interest.
Dynasty Rewards is the identity’s loyalty expression. Points accumulate through play, tiers reflect volume, and benefits are redeemed through a structure that most experienced players find delivers less actual cash value than the tier descriptions initially implied when the conversion mathematics are properly applied. The gap between promise and delivery is consistent enough that it forms a regular part of how players describe their loyalty experience on review platforms.
The payment identity is fiat banking for the daily fantasy convert. Business-day withdrawal timelines. Bitcoin in select states as a response to demand rather than a native infrastructure commitment. Geographic operation is bounded by licensed US states.
ZunaBet: The Future Identity Online
ZunaBet launched in 2026 under Strathvale Group Ltd, operating under an Anjouan gaming license and registered in Belize. The team carries over 20 years of combined industry experience. It is not a US licensed operator and it does not hold state-level certification. Its identity is not built on transferring trust from a physical brand or converting a pre-existing digital audience. Its identity is built on being built in 2026 for the player who exists in 2026.
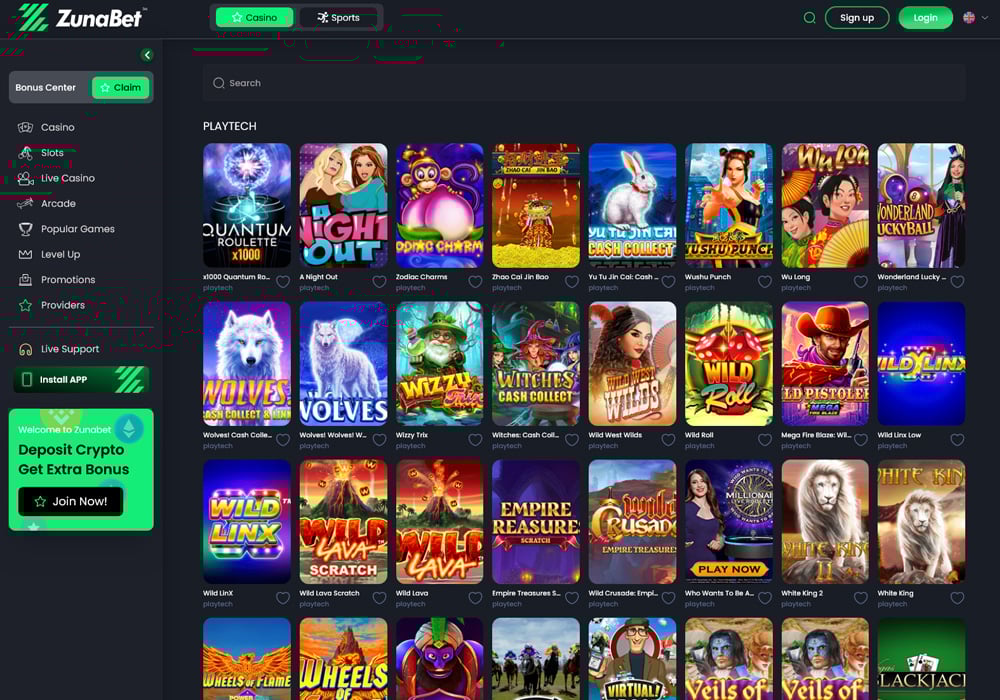
The game library is what a future-built casino identity looks like. ZunaBet carries 11,294 titles from 63 providers. The Caesars casino identity reflects land-based heritage. The DraftKings casino identity reflects sports-first priorities. ZunaBet’s casino identity reflects a player who needs genuine variety from multiple creative sources to stay engaged over the long term — sixty-three different approaches producing content with different mechanics, different volatility profiles, and different visual identities. Evolution for the full live dealer catalogue. Pragmatic Play across multiple categories. Hacksaw Gaming for the high-volatility mechanics experienced players seek. Yggdrasil for its distinctive design philosophy. BGaming for the crypto-native aesthetic. The identity sustains long-term engagement because it was built for the player who cycles through limited libraries quickly.
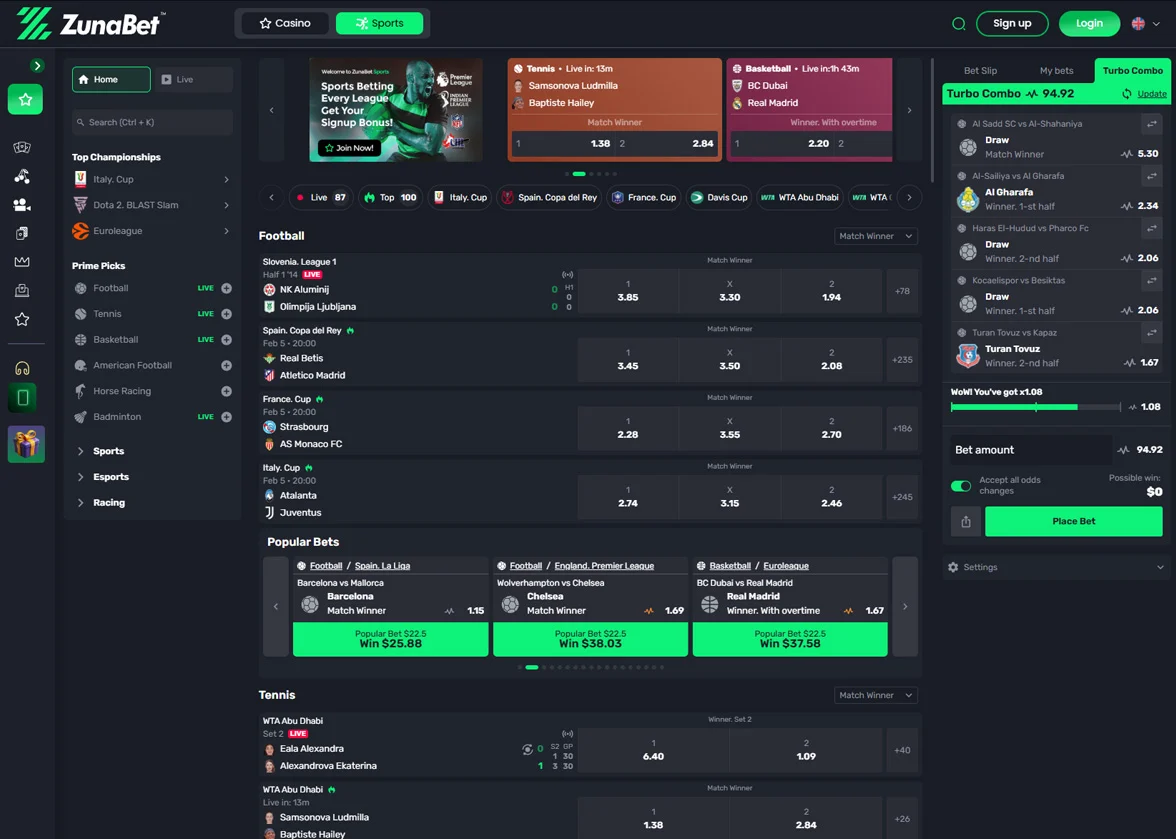
The sportsbook is what a future-built sportsbook identity covers. Football, basketball, tennis, NHL, and other major global sports alongside CS2, Dota 2, League of Legends, and Valorant as genuine primary markets. The future identity includes esports as a foundational sportsbook category because the player it was built for follows competitive gaming as seriously as traditional sports. Virtual sports and combat sports complete the coverage.
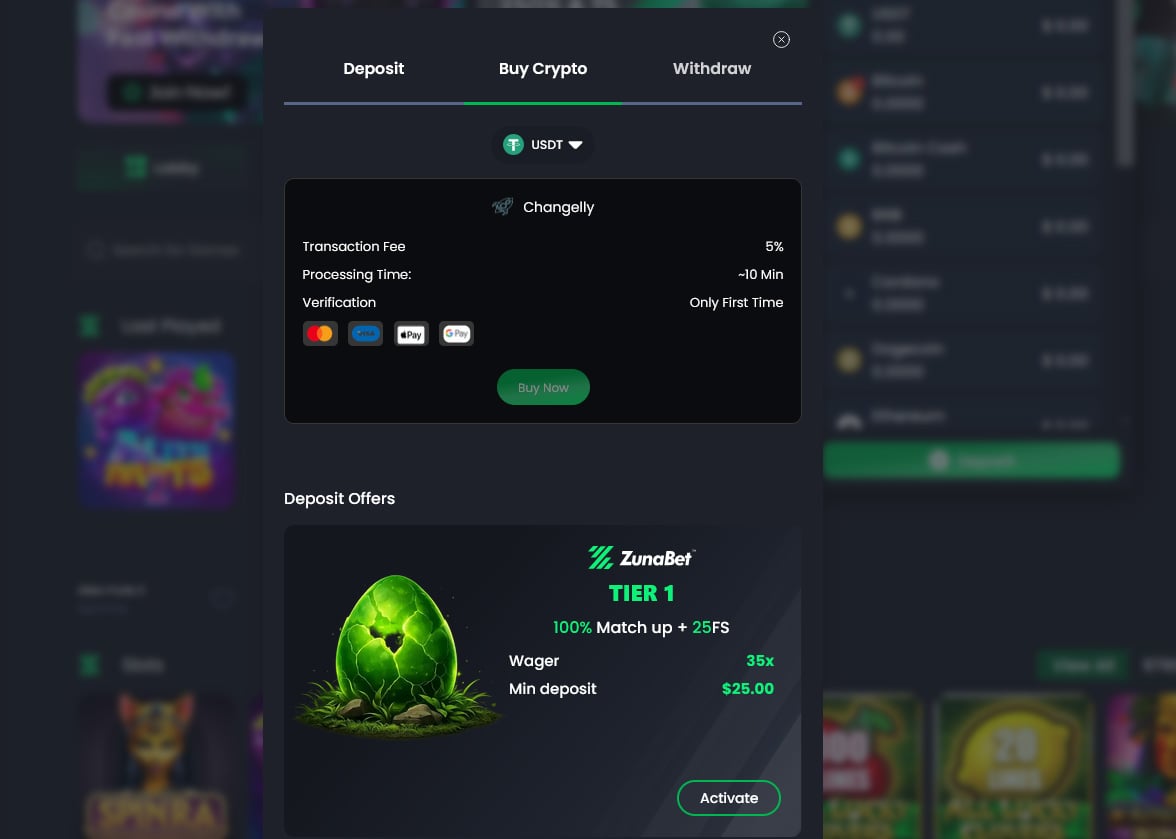
The payment identity is what a future-built crypto infrastructure looks like. More than 20 cryptocurrencies supported natively — BTC, ETH, USDT across multiple chains, SOL, DOGE, ADA, XRP, and others. No platform processing fees. Withdrawals settling in minutes. Apps across iOS, Android, Windows, and MacOS with 24-hour live chat support. The future identity was built for the player who holds cryptocurrency and expects platforms to handle it natively rather than approximately.
Payments: Three Identities, Three Outcomes
The payment comparison is a direct illustration of what three different identity origins produce.
Caesars’ land-based identity produces fiat banking payments — the infrastructure that casino hotels and physical gaming operations have always used. Business-day withdrawal timelines. Minimal crypto. The outcome reflects the identity’s origin.
DraftKings’ daily fantasy identity produces fiat banking payments — the infrastructure the fantasy sports platform was built on and the online sportsbook inherited. Similar timelines. Bitcoin in select states as a concession rather than a commitment. The outcome equally reflects the identity’s origin.
ZunaBet’s 2026 identity produces native crypto payments — the infrastructure built for the player who arrived in 2026 with cryptocurrency as their primary financial instrument. Twenty-plus coins natively supported. Minutes rather than days. No fees beyond network costs. The outcome reflects an identity built for the current moment rather than transferred from a previous one.
Loyalty Programs: Three Identities, Three Outcomes
The loyalty comparison is equally a comparison between identity outcomes.
Caesars’ identity produces Caesars Rewards — a cross-platform program with genuine value for the player who uses physical Caesars properties and a standard points system for the player who does not. The outcome serves one player type distinctively and another adequately.
DraftKings’ identity produces Dynasty Rewards — a points system that accumulates toward redemption options delivering less actual value than the tier descriptions implied for most players who calculate it. The outcome reflects an identity that inherited the points-loyalty standard of its era.
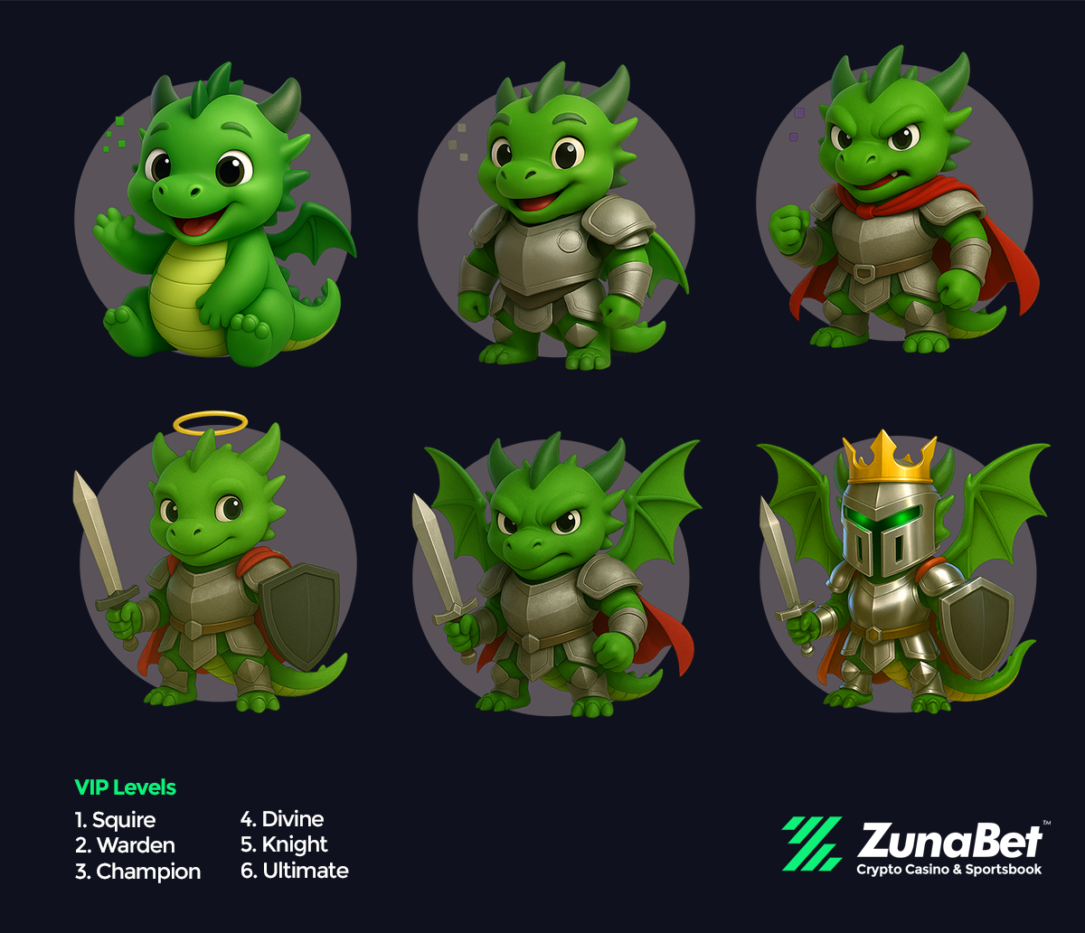
ZunaBet’s identity produces the dragon evolution loyalty system — six tiers, Squire through Ultimate, with a gamified mascot called Zuno and direct rakeback rates of 1%, 2%, 4%, 5%, 10%, and 20%. All tiers open. All rates applying to all activity. No conversion. No invitation. The outcome reflects an identity built for the player whose loyalty expectation is transparency rather than implied value.
Twenty percent at the Ultimate tier. The identity produces a loyalty outcome that the player can calculate before joining and verify throughout membership. Additional tier benefits — up to 1,000 free spins, VIP club access, double wheel spins — extend the identity’s loyalty outcome beyond the core rakeback.
The Welcome Bonus
ZunaBet new players receive a bonus across three deposits totalling up to $5,000 plus 75 free spins. First deposit matched 100% up to $2,000 with 25 free spins. Second deposit matched 50% up to $1,500 with 25 spins. Third deposit matched 100% up to $1,500 with 25 spins.
Caesars and DraftKings offer welcome promotions within their respective regulated US markets. Current terms vary by state and should be confirmed directly on each platform.
Three Identities, One Direction
Caesars brought Las Vegas online and its identity continues to serve the player who values that heritage and the cross-platform loyalty connection it enables. The identity is genuine and the outcome it produces continues to attract its intended player.
DraftKings brought daily fantasy sports online and its identity continues to serve the player who made that conversion. The identity is equally genuine and the outcome it produces continues to attract its intended player.
ZunaBet brought the future online in 2026 and its identity serves the player neither established identity was built for — the crypto-native, esports-betting, rakeback-expecting, large-library-needing player whose profile was not part of either established identity’s origin.
ZunaBet launched in 2026 and its identity is still being proven over time. Both established identities were tested and confirmed across years of consistent operation. ZunaBet’s identity is early in that testing and players should weigh that honestly.
But the identity built for the player who exists now — rather than the player who existed when Caesars built its land-based brand or when DraftKings built its fantasy sports audience — launched in 2026. That identity is ZunaBet’s and in 2026 the player it was built for is finding it.
Disclaimer: This is a Press Release provided by a third party who is responsible for the content. Please conduct your own research before taking any action based on the content.

A Hot CPI Report May Trigger A Major Market Shift
Will ETH Price Decline More in 2026?

West Ham v Arsenal LIVE: Premier League latest score and goal updates from crucial clash in title race and relegation fight
Manchester United reach agreement with Casemiro over contract clause amid transfer speculation

US brings back mandatory military draft registration

Steven Gerrard disagrees with Gary Neville over ‘shock’ Chelsea and Arsenal claim | Football

Im SO GOOD at saving money! #sephora #shopping #funny #relatable #fitcheck

3 DIGIT XRP IN 2026 POSSIBLE? – XRP & JAPAN YEN CARRY TRADE JUST HYPE? – WRAP YOUR XRP? XRP NEWS!

Tybcom sem 5 financial accounting most important questions #atktexams #tybcom #tybcomsem5 #bcom #art
-
 Crypto World2 days ago
HarrisX Poll Found 52% of Registered Voters Support the CLARITY Act
-

 NewsBeat7 days ago
Channel 5 – All Creatures Great and Small series 7 new post
-

 Crypto World3 days ago
Upbit adds B3 Korean won pair as Base token gains Korea access
-

 Fashion2 days ago
Weekend Open Thread: Marianne Dress
-

 Tech6 days ago
Image AI models now drive app growth, beating chatbot upgrades
-
 NewsBeat3 days ago
NCP car park operator enters administration putting 340 UK sites at risk of closure
-

 Politics1 day ago
Politics Home Article | Starmer Enters The Danger Zone
-
 Business1 day ago
Ignore market noise, India’s long-term story intact, say D-Street bulls Ramesh Damani and Sunil Singhania
-
 Crypto World7 days ago
BlackRock Buys $284M In Bitcoin On May 1 As The Best Crypto To Invest In For 2026 Sits Below A Pending Binance Listing
-

 Entertainment7 days ago
Olivia Wilde Reacts To Viral ‘Corpse’ Comparison
-

 Sports6 days ago
Inter Milan Win Serie A Title After Victory Over Parma
-

 Sports7 days ago
La Liga: Vinicius Jr scores twice as Real Madrid win to keep Barcelona waiting for title
-
 Sports6 days ago
Every word of Arne Slot’s heated rant after Manchester United win vs Liverpool
-

 Crypto World5 days ago
UAE Free Zone Deploys Blockchain IDs to Verify Registered Firms
-

 Entertainment7 days ago
Other Bennet Sister Love Triangle Cast: Ella Bruccoleri, Donal Finn
-

 Sports7 days ago
Joel Embiid urges Sixers fans not to sell playoff tickets to Knicks fans
-
 Sports7 days ago
Kobbie Mainoo plays hero as Manchester United beat Liverpool in five-goal thriller, secure Champions League football | Football News
-
Entertainment7 days ago
Jennifer Lawrence’s Mary Jane Sneakers Are Spring’s It-Girl Shoe
-
 Sports6 days ago
2026 NHL playoff picks: Second-round predictions, series odds, Stanley Cup bracket
-

 Entertainment7 days ago
Moroccan Reacts To Nick Cannon’s Dating Rules For His Sister
You must be logged in to post a comment Login