
Crypto World
Bitcoin price targets $65,000: Bear market bottom?

This moment is quite precarious for Bitcoin. After rejecting the upper boundary of its long-standing ascending channel, Bitcoin has transitioned into a corrective phase, pulling back toward a critical support zone around $65,000.
Summary
- Bitcoin corrected lower after rejecting the channel high resistance
- $65,000 aligns with POC, Fibonacci, channel low, and daily support
- Bullish volume is required to confirm a macro bottom and rotation higher
The current Bitcoin (BTC) price is just above $73,000. Following a rejection at the upper boundary of a long-standing ascending channel, the largest digital asset by market cap has transitioned into a controlled pullback rather than a disorderly sell-off.
This corrective move has gradually guided the price lower toward a region that carries significant technical weight across multiple analytical frameworks.
The $65,000 level is now emerging as a focal point for market participants. This area represents not just a psychological round number, but a dense cluster of technical confluences that historically attract demand.
As Bitcoin approaches this zone, the market is testing whether buyers are willing to defend the value and establish a potential bear-market bottom within the broader macro uptrend.
Bitcoin price key technical points
- Corrective rotation from channel high: Bitcoin respected upper channel resistance before rotating lower.
- $65,000 aligns with multiple confluences: Daily support, Fibonacci retracement, channel low, and POC converge.
- Bullish volume required for confirmation: Accumulation must be backed by strong demand to validate a bottom.
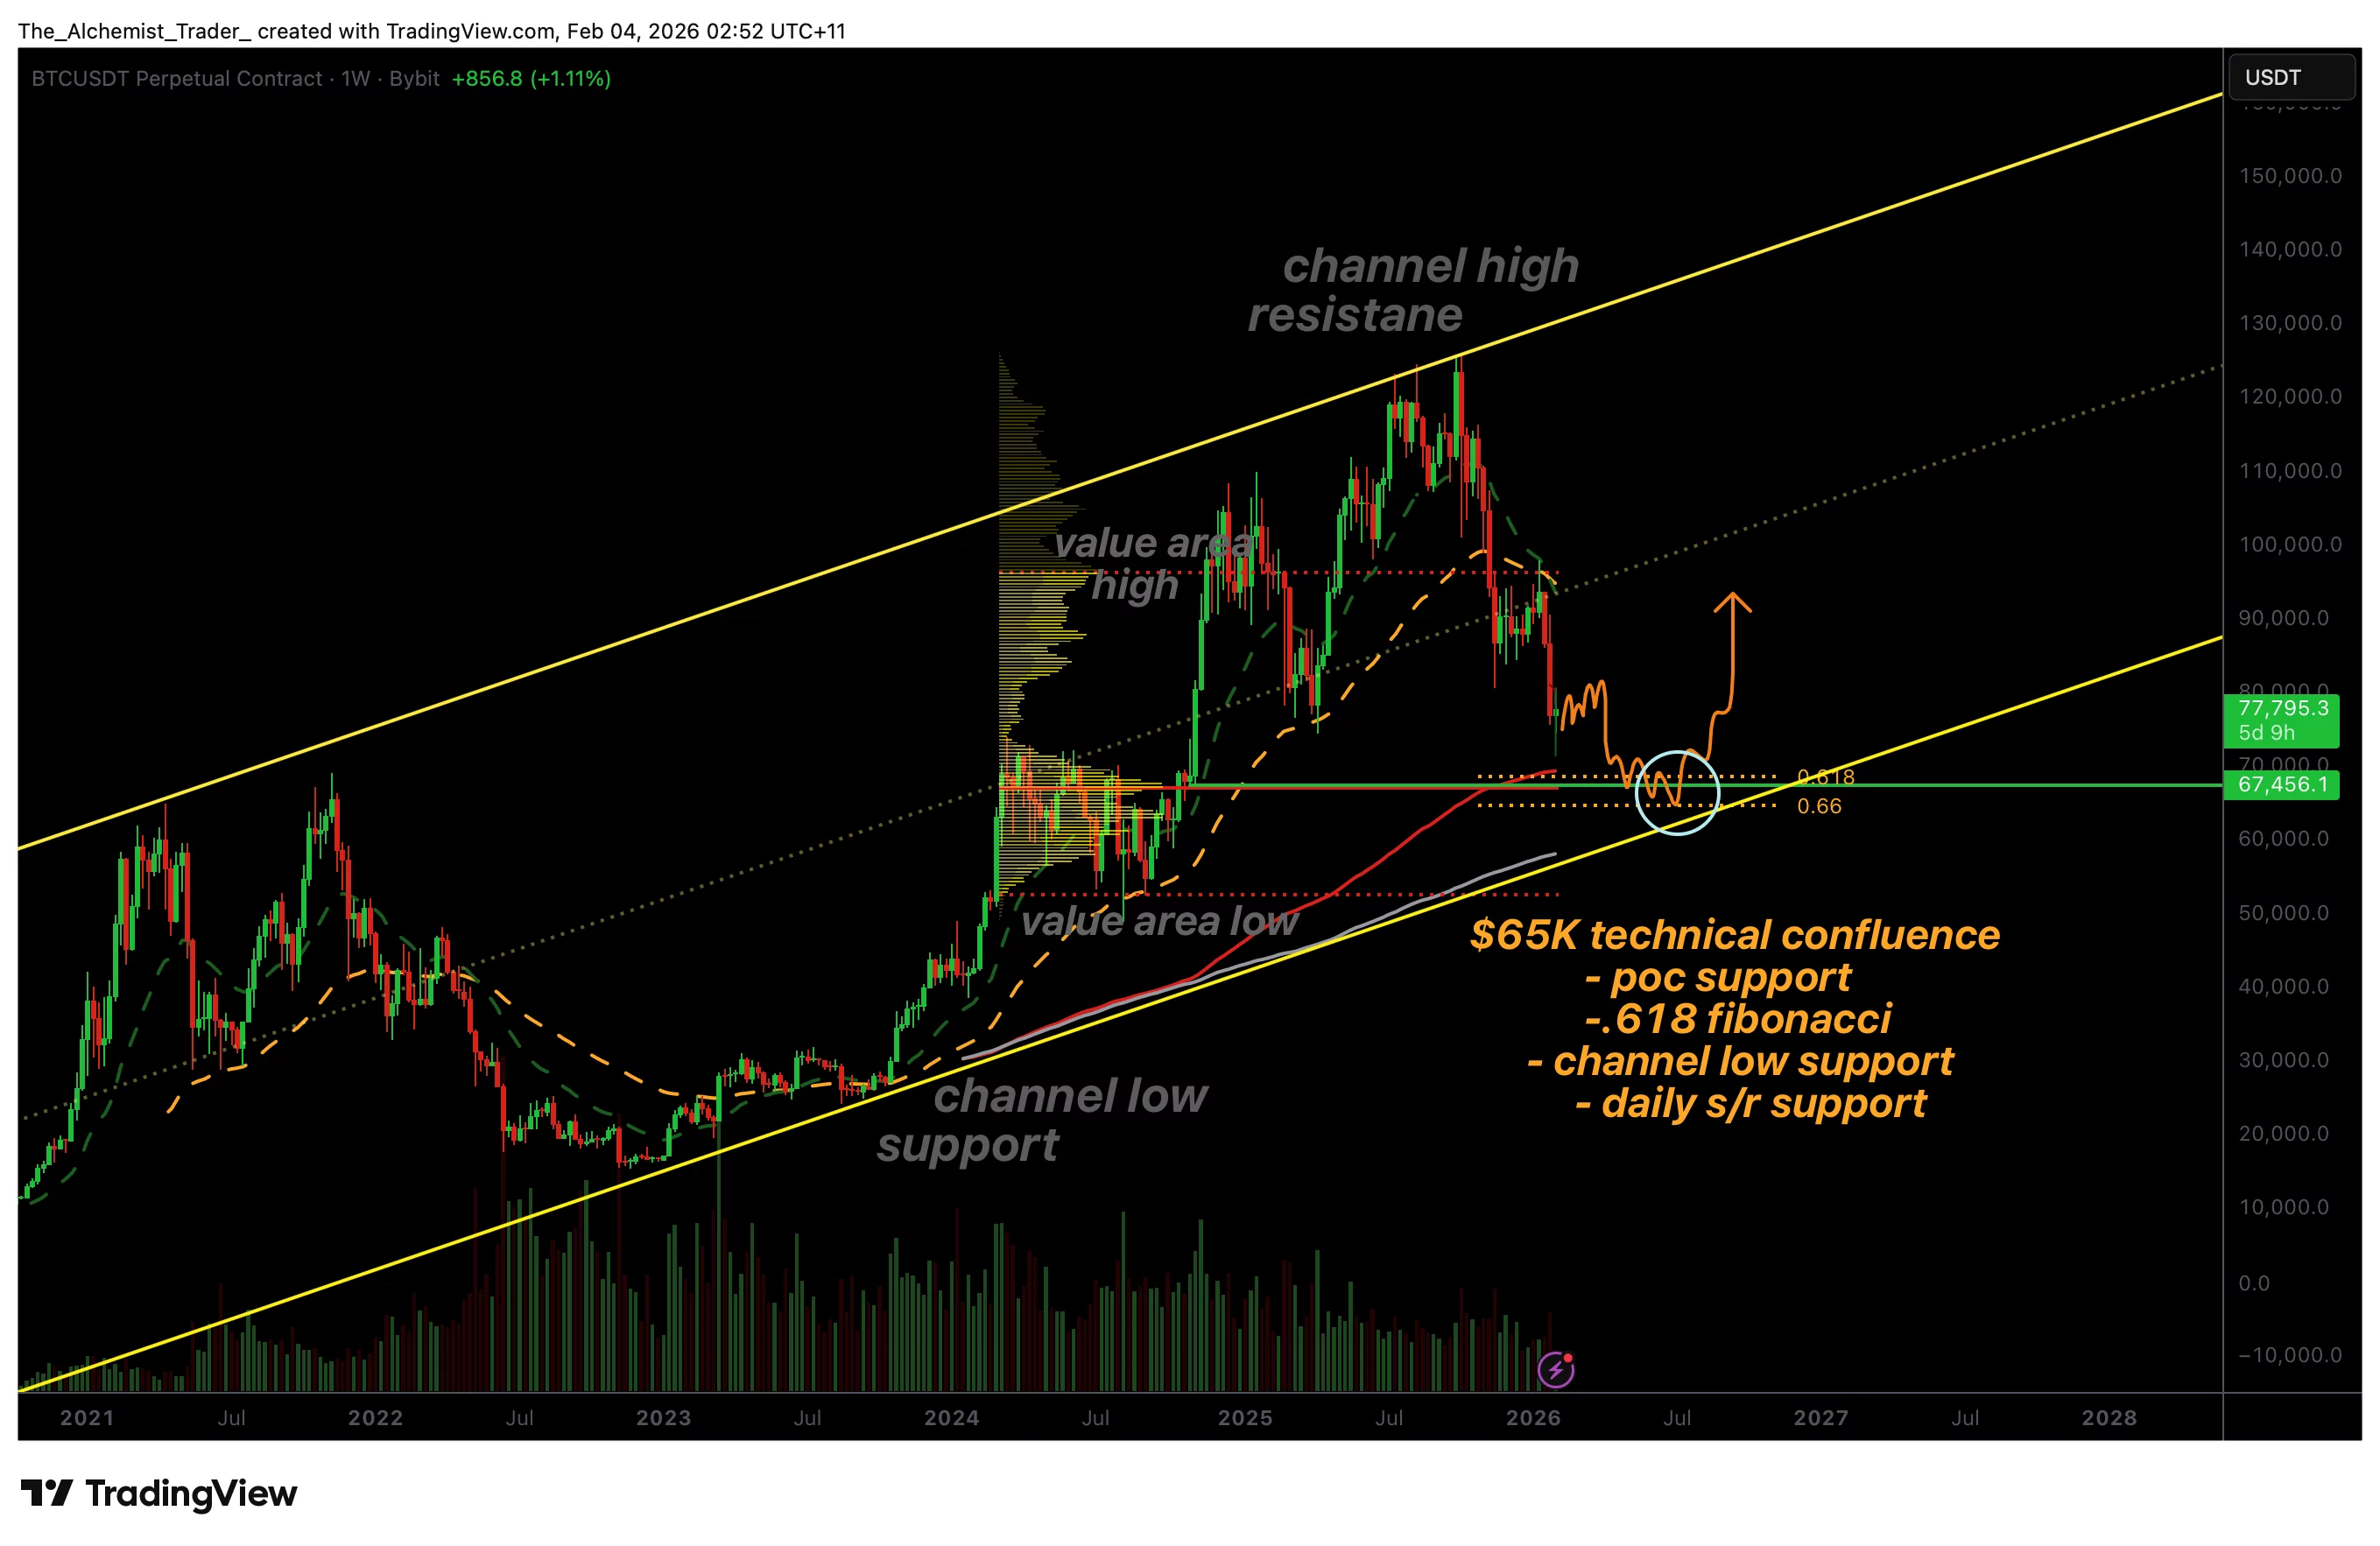
From a structural perspective, Bitcoin remains within a clearly defined higher-timeframe trading channel. The recent move lower followed a clean rejection at channel high resistance, reinforcing the integrity of this structure. Rather than breaking down impulsively, price has respected the channel dynamics, suggesting that the move lower is corrective rather than trend-ending.
After the rejection, Bitcoin initially rotated toward the value area low, a zone often associated with downside exploration following failed attempts at higher value. This rotation also coincided with the channel midpoint, a level that frequently acts as a pivot between bullish continuation and deeper corrective phases. Once price lost acceptance above both the channel midpoint and the value area high, downside pressure accelerated.
This loss of key mid-range levels triggered a cascading move lower toward the point of control (POC), where the highest historical trading volume has occurred. Importantly, this POC region is near $65,000, reinforcing its potential as a stabilization zone.
Why $65,000 is a high-probability support zone
The $65,000 level stands out due to the sheer number of technical factors converging at this price. First, it represents a daily support level that has previously acted as both resistance and support, making it a well-recognized reference point for market participants.
Second, the 0.618 Fibonacci retracement of the prior impulsive move aligns closely with this region. The 0.618 level is widely monitored as a corrective support zone within trending markets and often serves as a location where larger players re-enter positions.
Third, $65,000 sits near the lower boundary of the higher-timeframe channel, completing a textbook channel rotation from high to low. When price respects both channel extremes, it strengthens the validity of the structure and increases the probability of mean reversion back toward the midpoint.
Finally, the presence of the point of control in this area suggests that the market views this zone as fair value. When price returns to the POC after a directional move, it often pauses or reverses as buyers and sellers reassess positioning.
Volume, accumulation, and market psychology
While technical confluence increases the probability of a reaction, confirmation depends heavily on volume behavior. For $65,000 to act as a meaningful bear market bottom, Bitcoin must show signs of accumulation, characterized by strong bullish volume influxes and slowing downside momentum.
Without volume confirmation, any bounce risks being short-lived. However, if buyers step in aggressively and defend this level, it would signal that demand is present at discount prices. This type of behavior is often observed near macro bottoms, where long-term participants accumulate while short-term sentiment remains cautious.
From a psychological standpoint, a successful defense of $65,000 would also reinforce confidence in the broader market structure. It would demonstrate that Bitcoin continues to respect its channel framework, even during periods of corrective pressure.
What to expect in the coming price action
From a technical, price-action, and market-structure perspective, Bitcoin is approaching one of the most important support regions in the current cycle. The $65,000 level has multiple strong confluences that increase the likelihood of a bear-market bottom forming.
If bullish volume emerges and price stabilizes within this zone, a rotational move back toward the channel midpoint becomes increasingly probable, keeping the broader uptrend intact. Failure to attract demand, however, would weaken the channel structure and increase downside risk.
As Bitcoin tests this region, the market’s response will provide critical insight into whether $65,000 becomes a defining macro bottom or merely a temporary pause within a deeper corrective phase.


The U.S. Department of Justice unveiled a concrete restitution track for victims of the OneCoin scheme, revealing roughly $40 million in assets that may be available to investors who purchased OneCoin between 2014 and 2019 and suffered net losses. The development represents a rare, tangible path to recovery for millions of individuals from a case that has hovered between notoriety and conviction for years. By contrast, earlier global efforts, including a 2024 UK class action, faltered when funding for litigation was terminated, underscoring the uneven landscape of redress in cross-border crypto fraud cases.
OneCoin’s rise and fall remains a archetype of the era’s crypto Wild West: ambitious promises, a centralized “coin” that lacked a true decentralized backbone, and an expansive network built on multi-level marketing tactics. Regulators worldwide began circling the project as concerns about its structure and viability intensified from 2015 onward. The case later spiraled into a long-running criminal saga, with arrests, prosecutions, and a global pursuit of the ringleaders that continues to shape how authorities approach similar schemes today.
Key takeaways
- The DoJ says about $40 million in OneCoin-related assets are available to compensate eligible victims who bought OneCoin between 2014 and 2019 with net losses.
- Estimates put the total amount of money lost to OneCoin at roughly $4 billion across the 3.5 million people affected, based on prosecutors’ assessments.
- OneCoin operated as a centralized program rather than a true cryptocurrency, with coins hosted on OneCoin Ltd. servers and trade limited to a closed system rather than public markets.
- Promoters earned commissions for recruiting other investors, a hallmark of the MLM-style expansion that aided the scheme’s rapid global reach.
- Key prosecutions and indictments over the years include the sentencing of co-founder Karl Sebastian Greenwood, the ongoing status of founder Ruja Ignatova on the FBI’s Ten Most Wanted list, and recent charges against William Morro in 2024.
A restitution path emerges after a long regulatory chase
According to the Department of Justice, specific assets are now earmarked to compensate victims who bought OneCoin during the defined window and who sustained net losses. The DoJ’s announcement in mid-April signposts a procedural checkpoint in a case that has stretched over nearly a decade, with investigators detailing a schema that drew in millions of dollars and investors across multiple continents.
What makes this development notable is the volume of potential relief relative to the scale of loss. While $40 million will not restore all victims’ losses, it offers a recognized mechanism for recovery within a case where most individuals had little or no recourse for restitution in the past. The DoJ statement aligns with broader enforcement aims: to recover assets from criminal activity and distribute them to those who were harmed, even when the perpetrators have fled or faced lengthy sentences.
OneCoin’s architecture and the regulatory crackdown that followed
To understand why restitution remains such a pressing issue, it helps to revisit OneCoin’s mechanics. Launched in 2014 by Ruja Ignatova and Karl Sebastian Greenwood, the project promoted a “cryptocurrency” that relied on centralized servers and a tiered packaging system. Investors purchased tokenized “packages” that purportedly allowed them to mine OneCoin, with a spectrum of entry points, including some of substantial price. However, unlike genuine cryptocurrencies, OneCoin was not truly decentralized and did not offer public trading on an open exchange. Ownership and transfers occurred within a closed ecosystem controlled by OneCoin Ltd., leaving little chance for real market liquidity or independent verification of value.
The regulatory response was swift and global. By late 2015, Bulgaria’s Financial Supervision Commission issued a warning, and operations in the country ceased. Across Europe and beyond, regulators in countries including Norway, Finland, Sweden, Latvia, and Hungary weighed in with cautions and actions that labeled OneCoin a potential pyramid scheme. Italy formally categorized OneCoin as illegal and halted promotional activities, while China initiated investigations and detained some investors. In 2017, Germany, Thailand, Belize, and Vietnam issued cease-and-desist orders or declared OneCoin unlawful. In India, undercover police arrested organizers of an OneCoin event; Ignatova herself faced charges in connection with the scheme.
The saga continued into the 2018–2020 period with high-profile law-enforcement actions: Bulgarian and German authorities raided OneCoin offices; Greenwood was arrested in Thailand in 2018 to face charges; Ignatova’s legal and public profile grew as investigations advanced. A US case culminated in 2023 with Greenwood receiving a 20-year prison sentence and an order to pay about $300 million in damages for fraud and money laundering. The FBI designated Ignatova as one of its Ten Most Wanted Fugitives in 2023, underscoring the unresolved status of the founder’s whereabouts. Meanwhile, public focus on the scheme persisted as DoJ actions broadened to address money flows and related offenses.
Prosecutions, fugitives, and the ongoing enforcement narrative
Greenwood’s 2023 sentencing highlighted the scale of the fraud and the legal consequences for organizers. The court’s decision to impose a 20-year term reflected the gravity of charges including money laundering and fraud, though it was notably shorter than the initial 60-year sentence sought by prosecutors. A parallel line of enforcement continued into 2024, with DoJ actions against William Morro, who moved substantial OneCoin funds across banking corridors in Asia and the United States and subsequently pleaded guilty to conspiracy to commit bank fraud. Morro’s case illustrated how prosecutors pursued cross-border financial movements linked to OneCoin’s operations.
Ignatova remains at large, with the FBI offering a substantial reward—up to $5 million—for information leading to her arrest or conviction. The ongoing status of Ignatova hangs over the broader OneCoin narrative and serves as a reminder of the difficulties regulators face when high-profile operators evade capture across multiple jurisdictions.
What the restitution development means for the market and stakeholders
For victims and their advocates, the new asset pool offers a semblance of closure after years of uncertainty. It also signals a continued appetite among U.S. authorities to pursue asset recovery in cases involving cross-border crypto-adjacent fraud, even when the underlying assets were never truly decentralized currencies. For investors and builders in the broader crypto space, the OneCoin case underscores several enduring risk factors: the appeal of high-yield promises paired with opaque compliance profiles, the reliance on recruitment-driven growth, and the dangers of conflating MLM incentives with genuine asset innovation.
On the regulatory front, OneCoin’s arc contributes to a growing sense that authorities will pursue both criminal prosecutions and civil forfeiture where possible, particularly in schemes that blend traditional fraud with crypto elements. The UK’s failed 2024 class action also illustrates the complexities of cross-border litigation funding and the practical limits of collective redress in transnational crypto cases. As restitution progresses, readers should watch how the DoJ formulates distribution criteria, how many victims ultimately receive payments, and whether more assets are identified for recovery in related proceedings.
For traders and developers, the OneCoin saga offers a cautionary reminder: the crypto market thrives on credible, transparent structures and verifiable liquidity. Where those features are absent, enforcement and restitution can lag, but they remain on the radar of prosecutors and regulators with a growing toolkit for recovering proceeds and protecting the public.
Looking ahead, readers should monitor updates from the Department of Justice regarding the distribution process for the $40 million pool, any additional forfeiture actions tied to OneCoin, and continuing efforts to locate Ruja Ignatova. As the investigative and judicial processes unfold, the case will continue to shape how authorities approach similar schemes and how victims seek redress in a landscape where borders and technologies intersect.
Tether is leading a $150M recovery initiative for Drift Protocol; the plan will also shift the perp DEX’s primary settlement asset to USDT on Solana.
Tether announced a strategic collaboration with Drift Protocol on Thursday, April 16, to support user recovery and facilitate the platform’s relaunch following the exploit earlier this month.
The recovery plan is backed by up to $150 million in combined support, including up to $127.5 million from Tether, according to the announcement from the firm. The structure links funding to trading activity on Drift’s platform, enabling user balance restoration as the exchange resumes operations and generates revenue.
As the Defiant reported previously, the perpetual futures DEX was hacked for over $270 million in crypto on April 1. An April 5 postmortem from Drift revealed that the attack was the result of a complex social engineering and corporate infiltration scheme that began at least six months before the exploit occurred. Per Drift’s report, independent, nonprofit on-chain security group SEAL 911 found that the exploit was likely carried out by a North Korean state-affiliated group.
USDT Settlement
As part of the relaunch, Drift will transition its settlement asset from USDC to USDT, bringing its over 128,000 users and 35 ecosystem teams, including Gauntlet, Neutral, and M1, onto USDT-based trading on Solana, per the announcement. The move positions USDT as a primary settlement asset on what was Solana’s largest perp DEX.
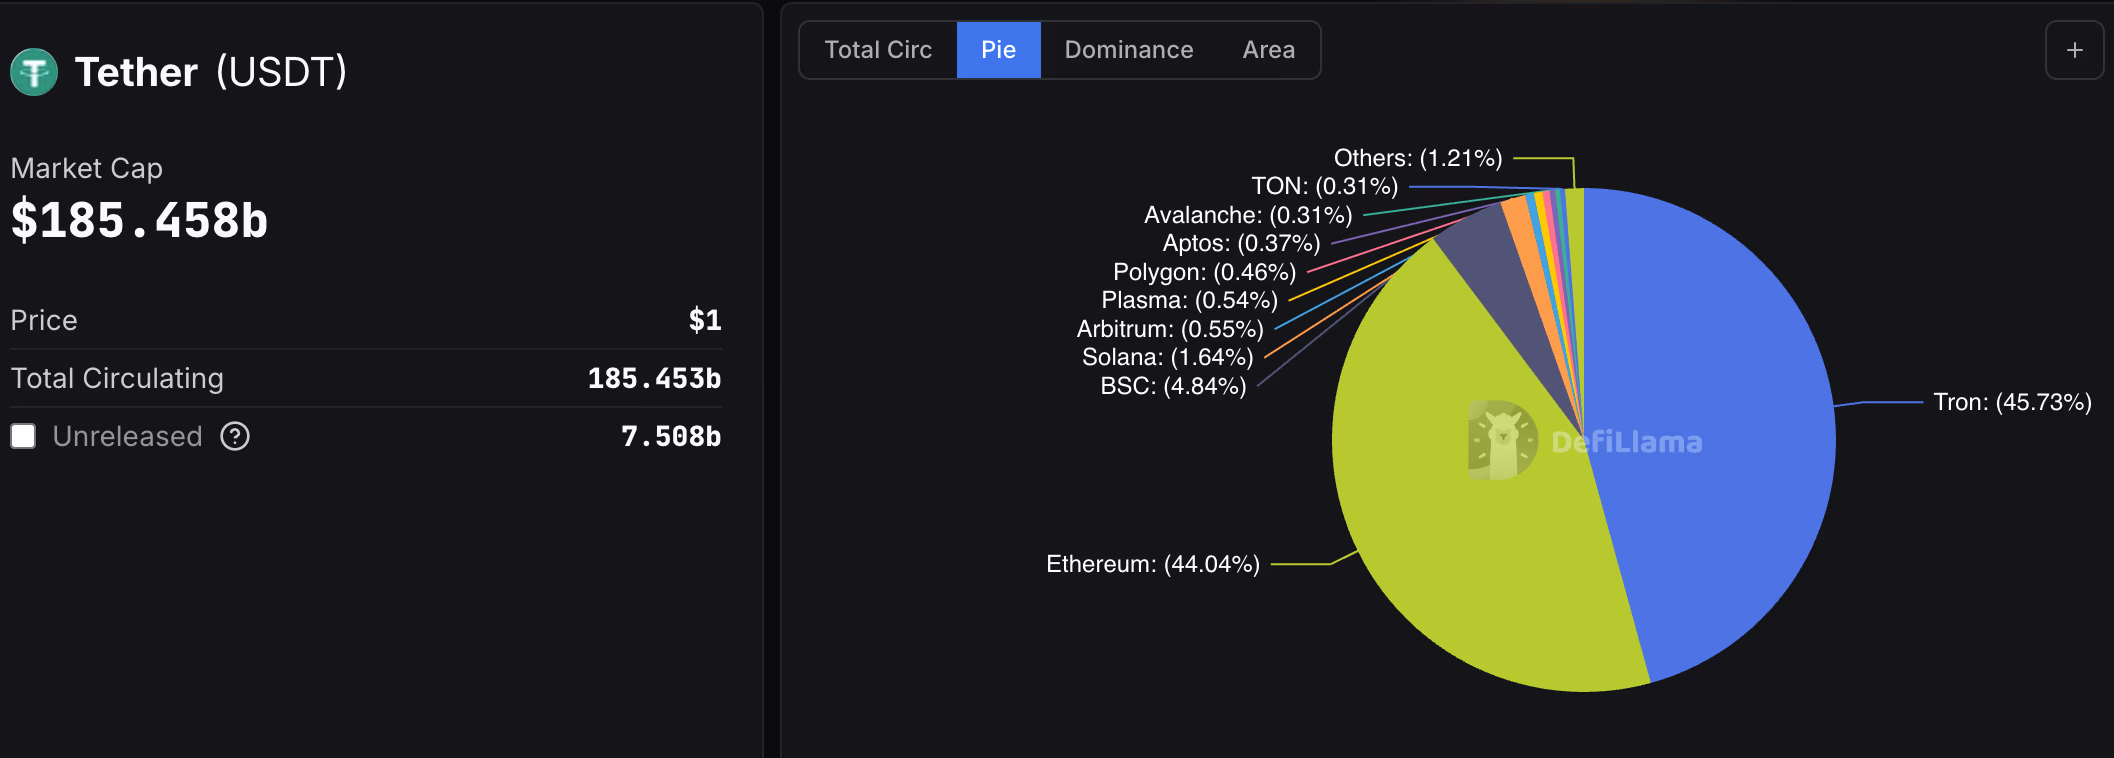
The bulk of USDT’s over $185.4 billion circulating supply is currently on Ethereum and TRON, with both chains holding about 45% of the stablecoin’s market cap. About $3 billion in USDT is currently on Solana, making it the fourth-largest chain by USDT market cap, following BNB Smart Chain (BSC).

Tether CEO Paolo Ardoino said in today’s announcement that the investment and collaboration reflect confidence in Drift’s role in DeFi, and emphasized aligning recovery with real activity and long-term growth.
The DRIFT token rallied over 14% today on the news to ab0out $0.05, after falling sharply after the exploit. The token remains down 98% from its all-time high of $2.60 set in November 2024, per CoinGecko data.
Earlier this week, Tether launched its own wallet app, a multichain, self-custodial wallet that supports USDT, USAT, XAUT, and Bitcoin.
This article was written with the assistance of AI workflows. All our stories are curated, edited and fact-checked by a human.

BitMEX, one of the safest crypto exchanges, announced today the launch of the TradFi Trade and Earn Campaign for users who trade its TradFi derivatives contracts, available for trading 24/7. The campaign allows traders to win their share of a 50,000 USDT prize pool by completing a series of trading missions.
BitMEX currently offers a range of TradFi products, including perpetual swaps on global stocks, indices, commodities, and forex. Unlike other platforms, its TradFi derivatives are available 24/7, allowing users to access markets outside of traditional hours. The campaign will run from 16 April 2026 at 12:00 PM (UTC) to 16 May 2026 at 11:59 PM (UTC). Users can participate at any time during the campaign period.
Rewards will be distributed across 3 categories:
- The Beginner’s Boost: New traders can claim $5 in trading credits by trading TradFi Perps on BitMEX.
- Get Paid to Trade: By achieving trading volume tiers, all participants can claim up to $500 in trading credits.
- Get Paid to Post: Any participant that trades TradFi Perps over the weekend and shares proof of their trades to their X accounts can claim $5 in trading credits.
To participate in the TradFi Trade and Earn campaign, traders must be fully verified on BitMEX. Competition details and registration can be found here. For more details on BitMEX TradFi Perps, visit this page.
About BitMEX
BitMEX is the OG crypto derivatives exchange, providing professional crypto traders with a platform that caters to their needs through low latency, deep crypto native liquidity and unmatched reliability.
Since its founding, no cryptocurrency has been lost through intrusion or hacking, allowing BitMEX users to trade safely in the knowledge that their funds are secure. So too that they have access to the products and tools they require to be profitable.
BitMEX was also one of the first exchanges to publish their on-chain Proof of Reserves and Proof of Liabilities data. The exchange continues to publish this data twice a week – proving assurance that they safely store and segregate the funds they are entrusted with.
For more information on BitMEX, please visit the BitMEX Blog or www.bitmex.com, and follow Telegram, Twitter, Discord, and its online communities. For further inquiries, please contact press@bitmex.com.
The post BitMEX Launches the 24/7 TradFi Campaign Featuring a 50,000 USDT Prize Pool appeared first on BeInCrypto.
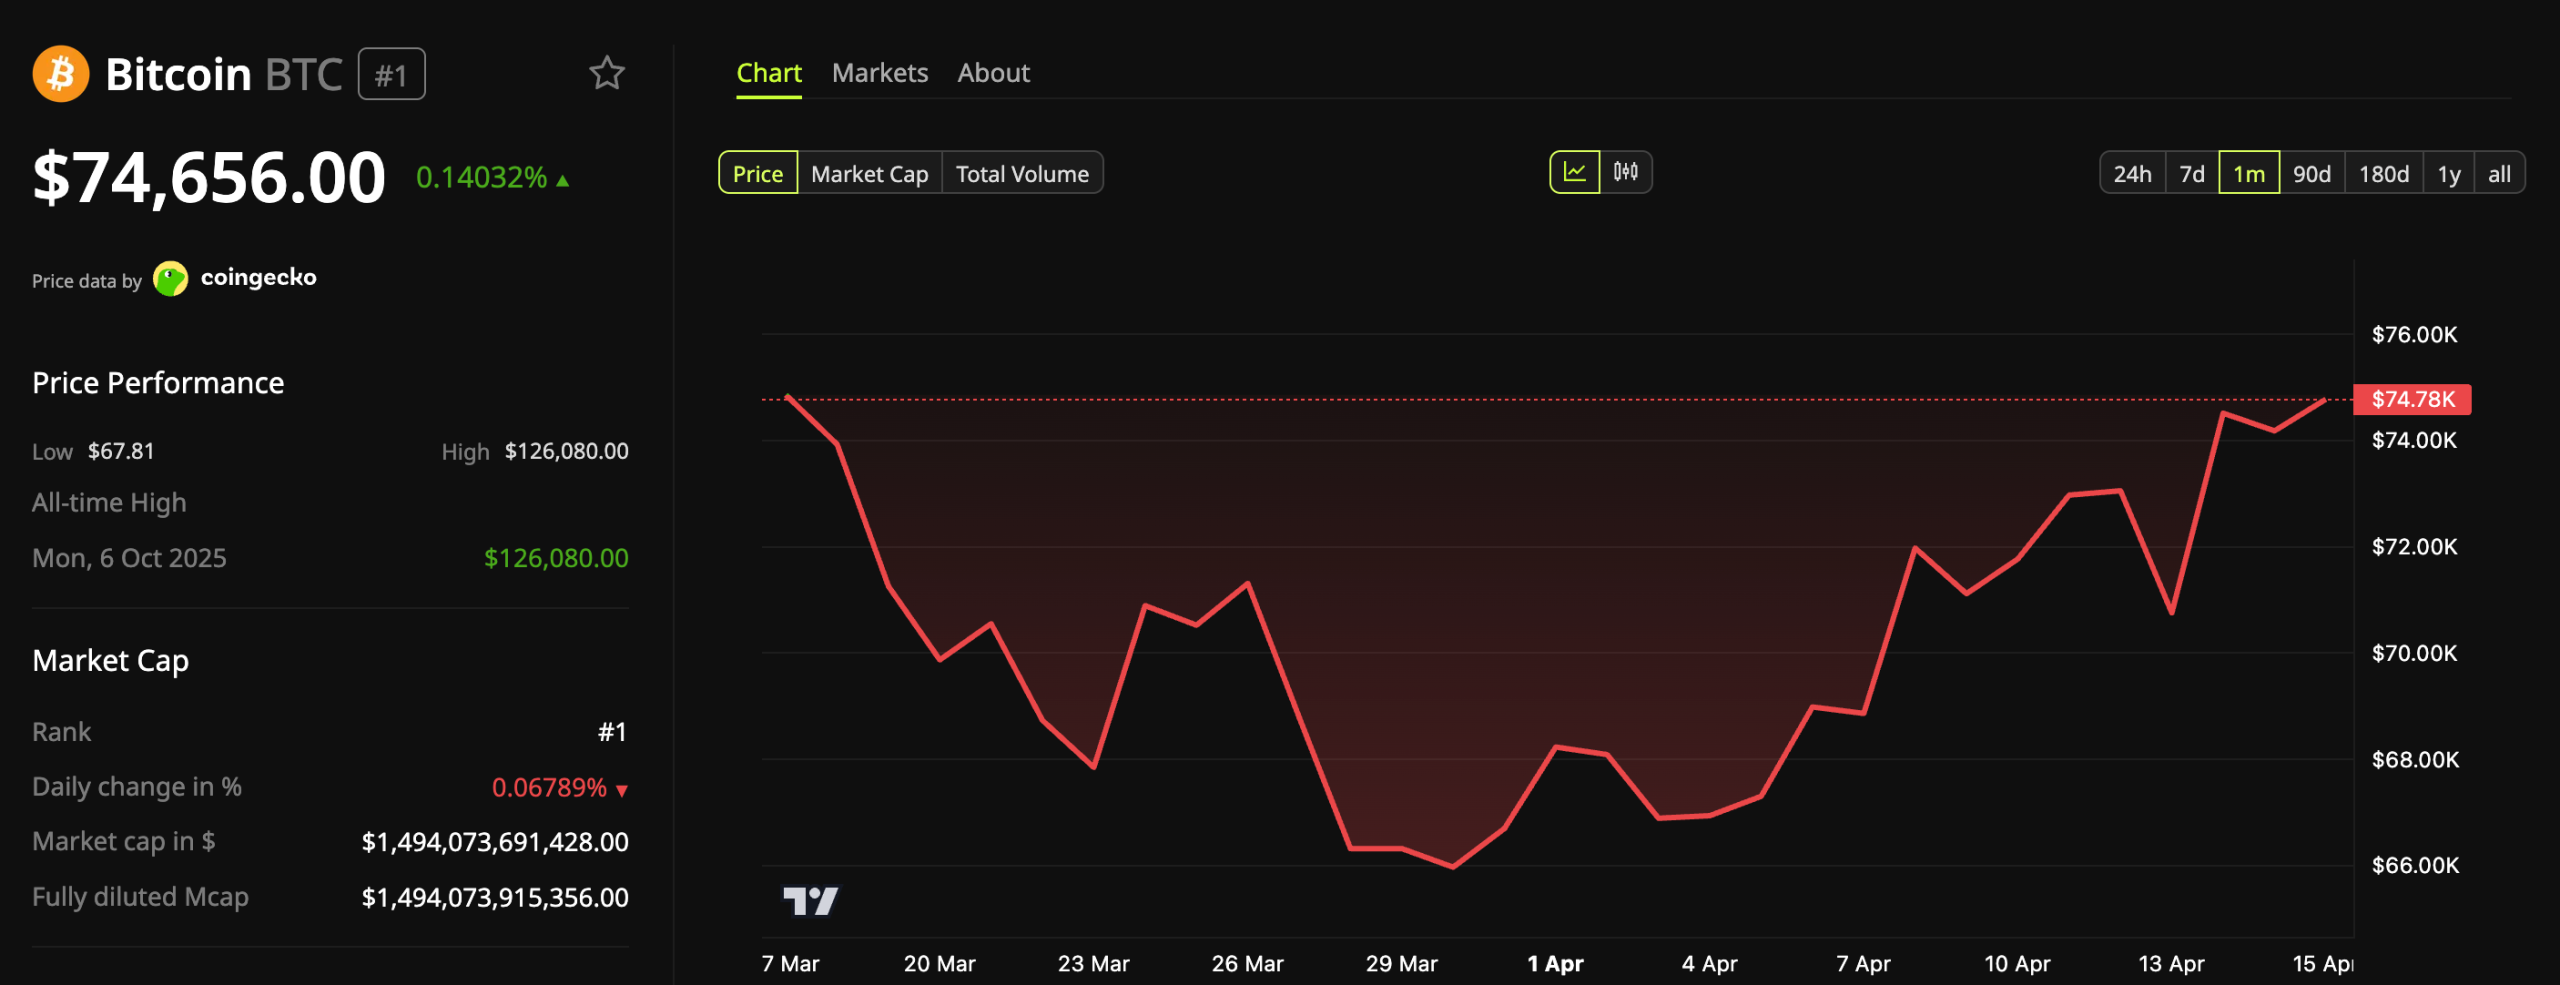
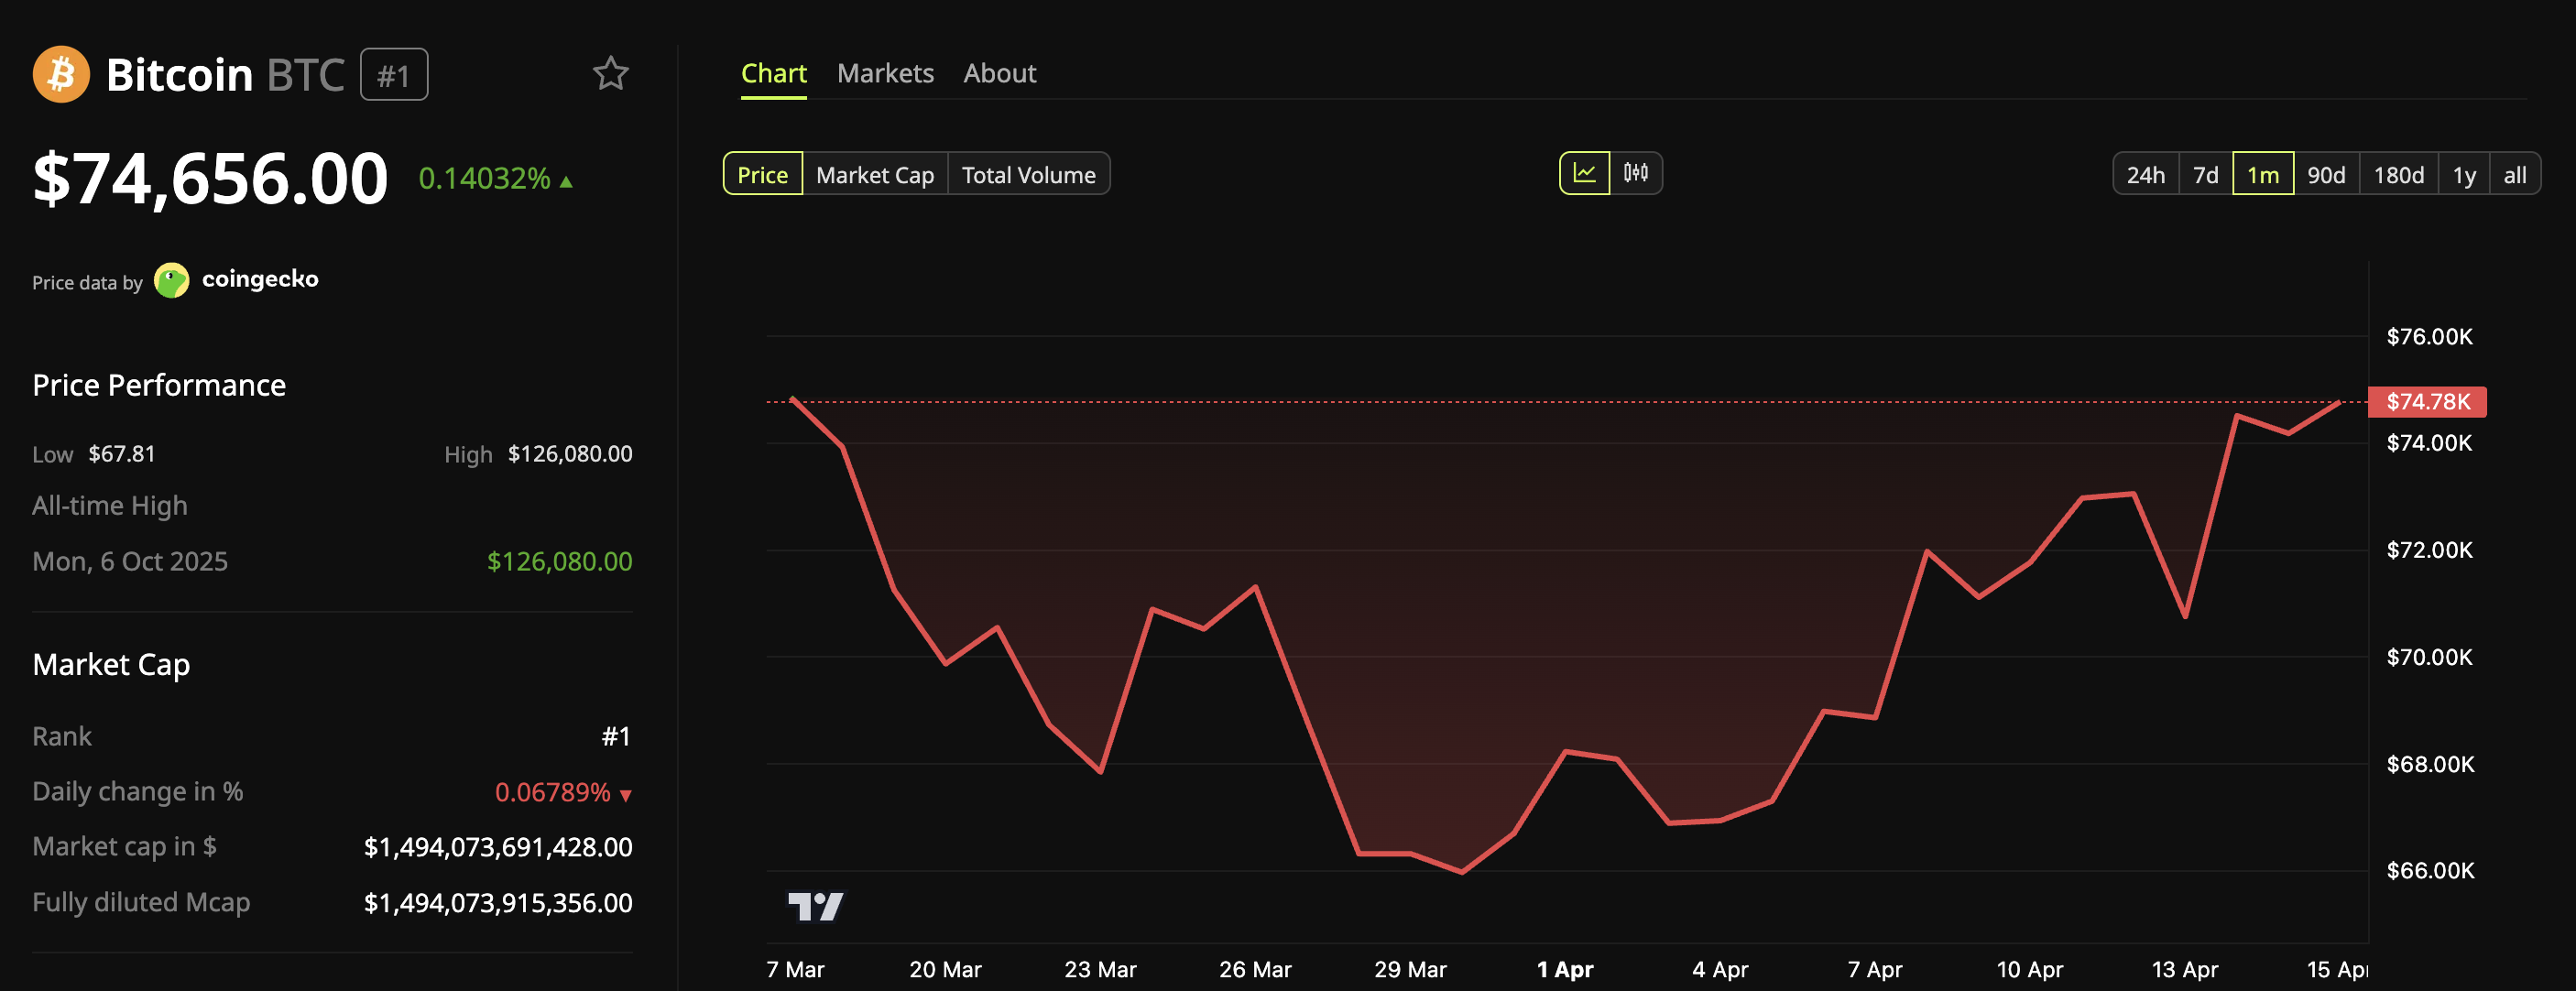
Bitcoin’s (BTC) price trajectory has largely been positive since the US-Iran war, though it has also been volatile. On April 14, BTC briefly climbed above $76,000, its highest price level since early February.
Realized profits hit $1.14 billion during the spike, one of the year’s largest single-day readings. However, the gains failed to hold.
Similarly, BTC’s surge over $75,000 yesterday was met with resistance again. The price adjusted to $74,656 as of press time.
But what is hindering Bitcoin’s rally? According to on-chain signals, it’s short-term holders.
Why Short-Term Holders Are Capping Bitcoin’s Rally
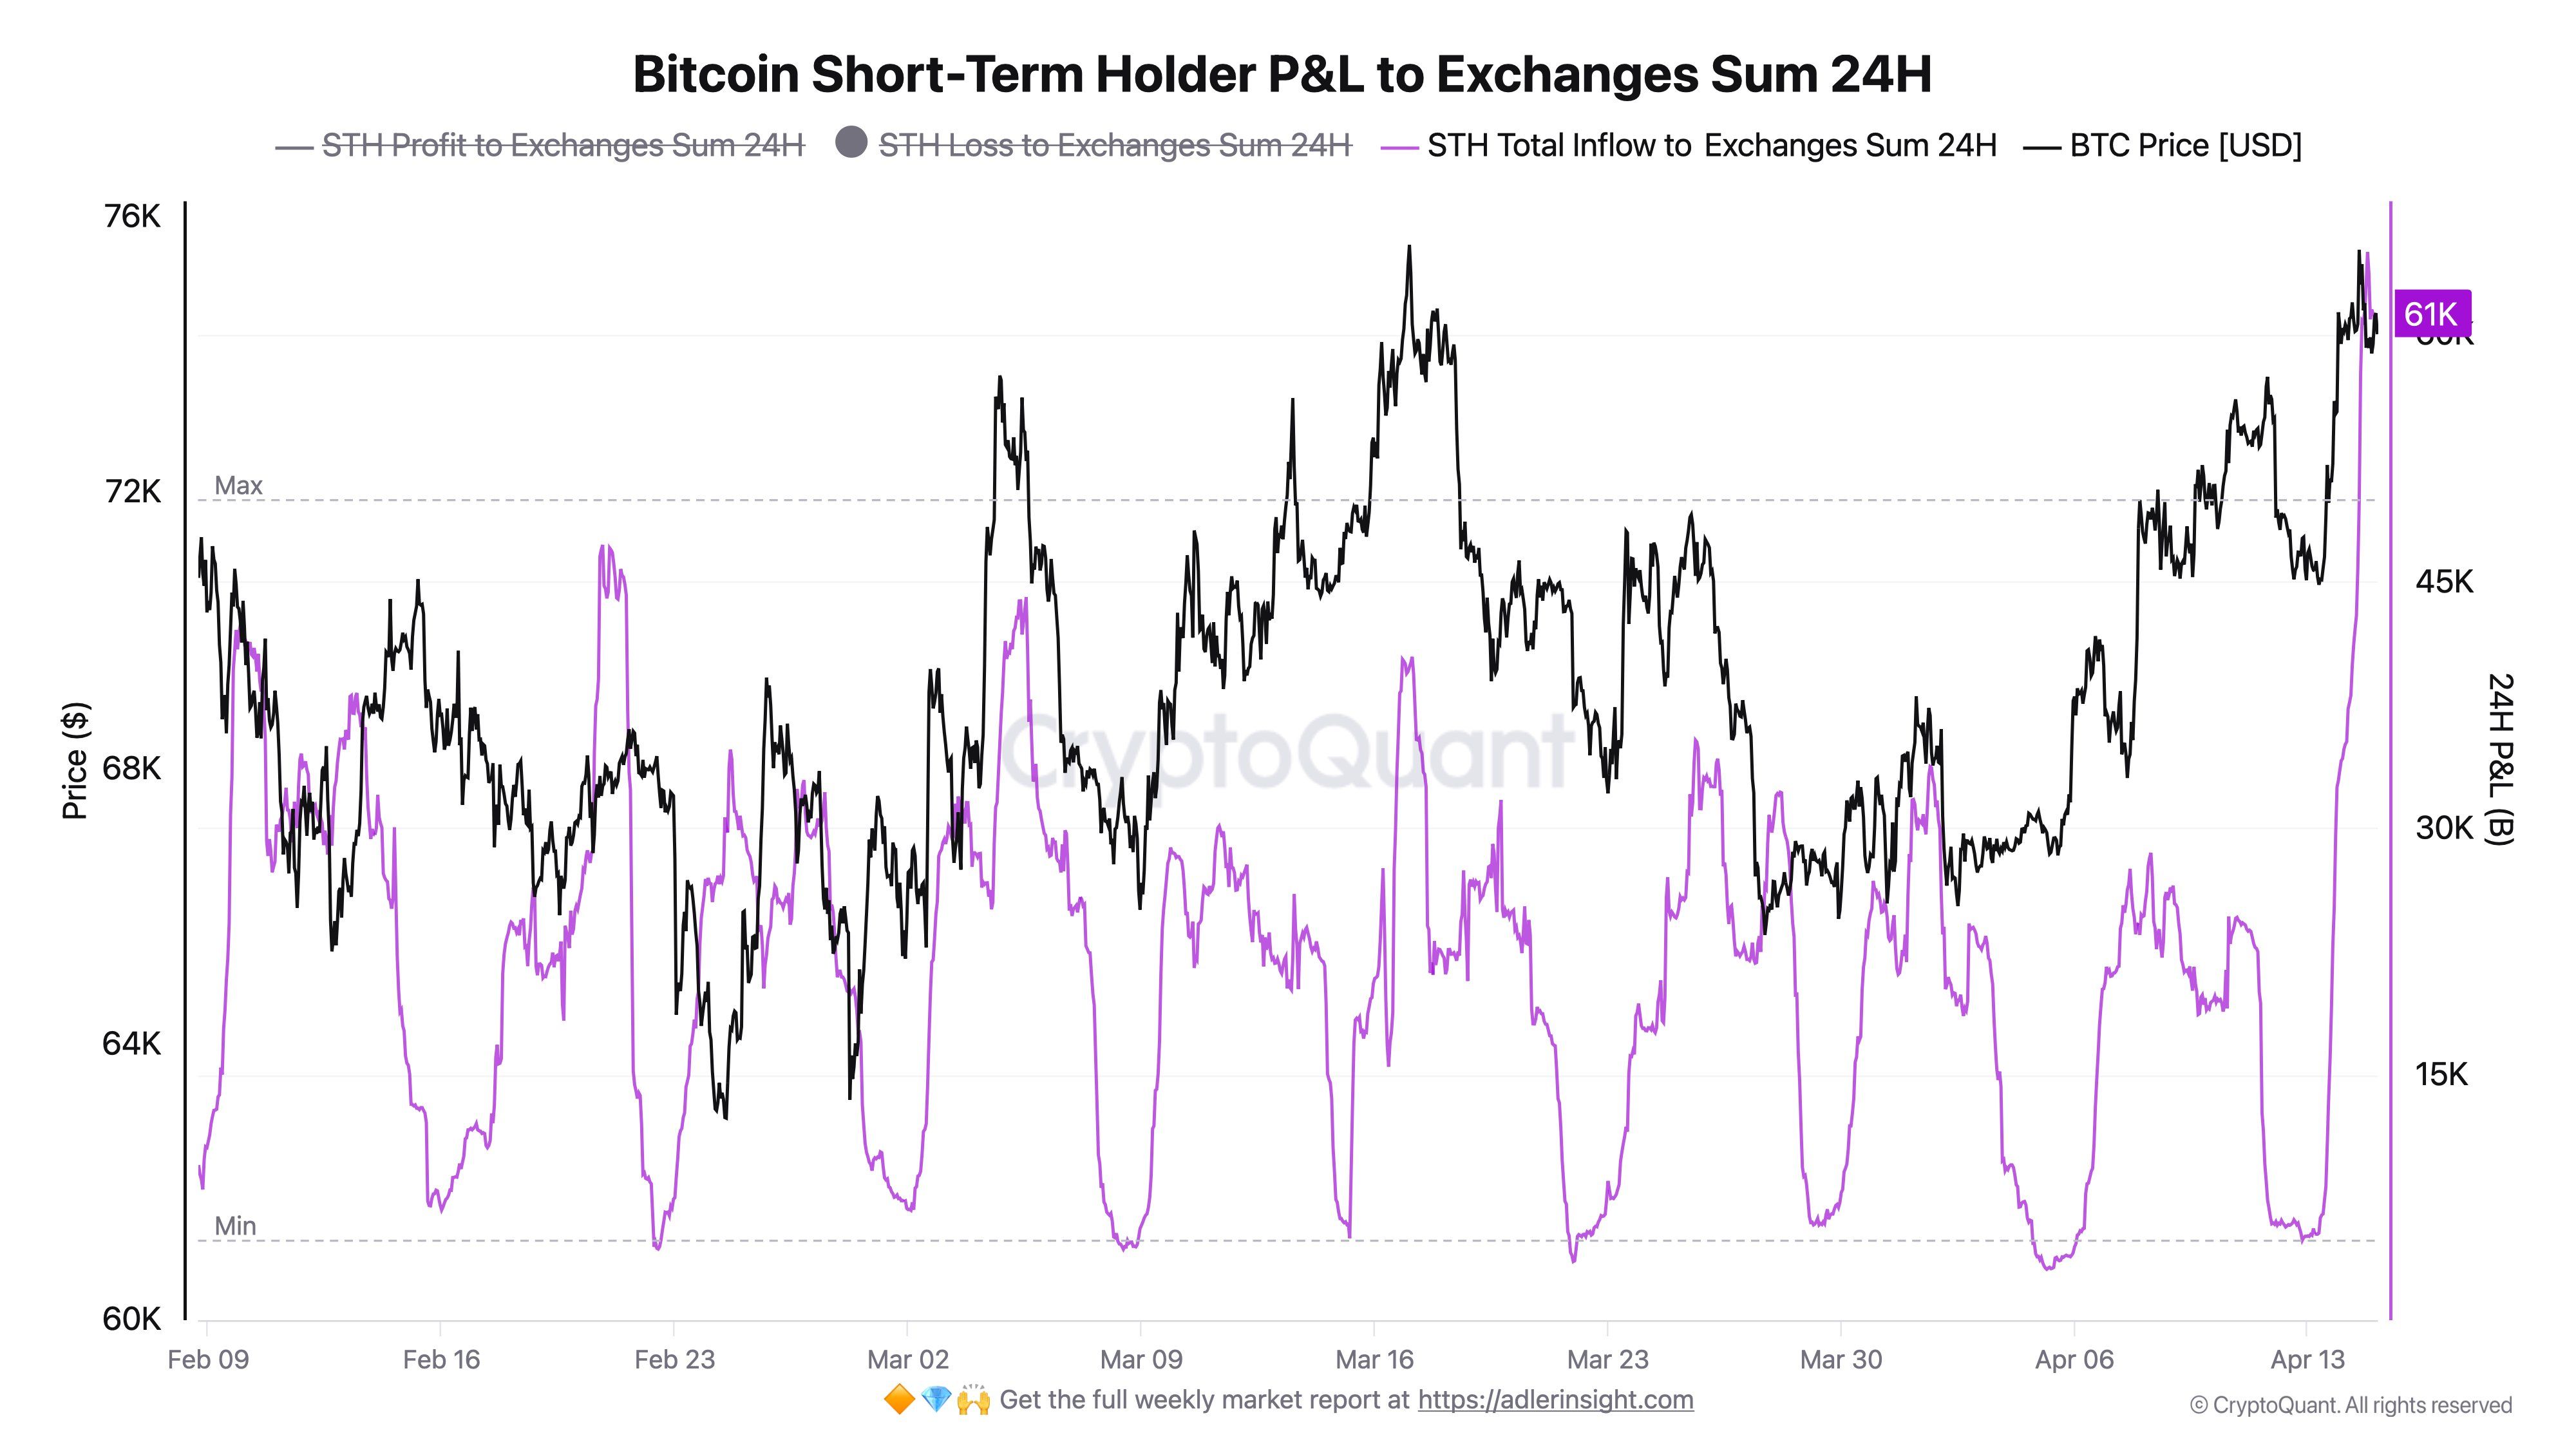
Analyst Darkfost noted that Short-Term Holders (STHs) significantly ramped up exchange flows as BTC tested $75,000 on April 15. Within 24 hours, more than 65,000 BTC moved to exchanges, with 61,000 BTC sent in profit.
“For now, any price increase is being treated as an opportunity to exit the market, whether in profit or at a loss.Yesterday, profits dominated, with 61,000 BTC sent to exchanges in profit. At this stage, STHs remain highly reactive to price movements,” the analyst wrote.
Follow us on X to get the latest news as it happens
On-chain analytics firm CryptoQuant identified the Traders’ On-Chain Realized Price at $76,800 as a key resistance level. This metric reflects the average cost basis of short-term traders and has historically capped relief rallies, including the January 2026 bounce.
As BTC tested $76,000 earlier this week, hourly exchange inflows rose to approximately 11,000 BTC. This marked the highest reading since late December 2025. According to CryptoQuant, this is,
“A historically reliable warning signal of near-term selling pressure, as holders move coins to exchanges in preparation for potential distribution at key resistance zones.”
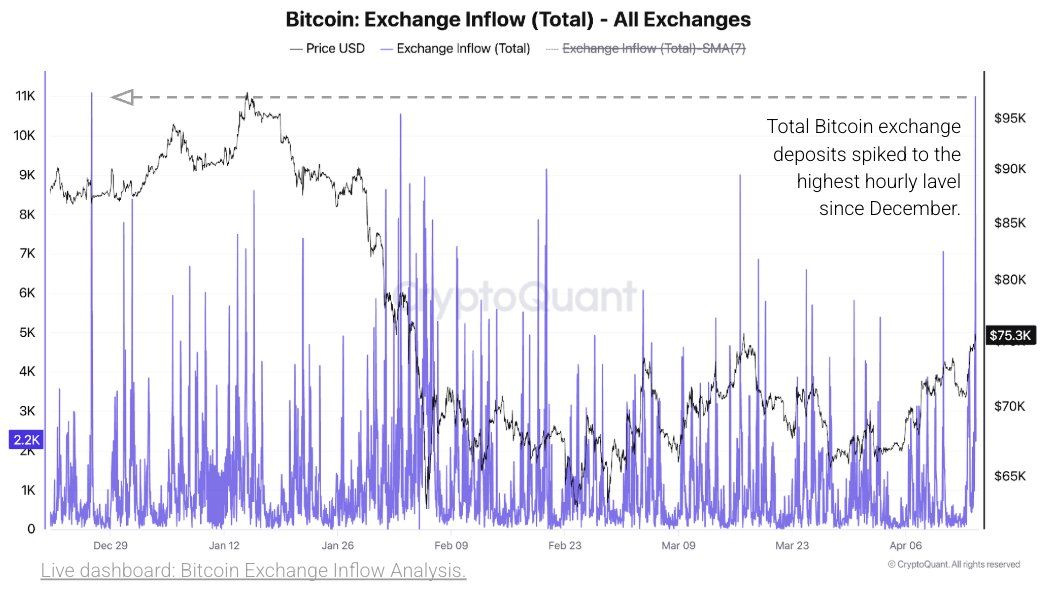
The average exchange deposit jumped to 2.25 BTC, the highest daily reading since July 2024. Large individual transfers exceeding 1,000 BTC to Binance drove the increase.
Moreover, the share of large deposits as a percentage of total exchange inflows surged from below 10% to above 40% within days around the $76,000 level.
“Daily realized profits remain at approximately $500 million—below the $1 billion threshold that historically marks a significant profit realization spike in bear markets—suggesting that profit-taking has not yet peaked. If Bitcoin sustains near $76K or rallies further toward the $76.8K Traders’ Realized Price, realized profits could accelerate sharply, adding further near-term selling pressure,” the analysis added.
Glassnode’s weekly report reinforced this view. The 30-day EMA of the Realized Profit/Loss Ratio is 1.16, indicating that investors are broadly selling into strength.
The firm identified the True Market Mean at $78,100 as the critical level for any sustained recovery. A move above that threshold would require the market to absorb the current wave of profit-taking on a sustained basis, something that would demand a significant catalyst, according to the report.
With short-term holders treating every rally as an exit opportunity and institutional participation still rebuilding, Bitcoin faces a clear supply overhang that must be absorbed before any structural trend change can develop.
Subscribe to our YouTube channel to watch leaders and journalists provide expert insights
The post Bitcoin’s Biggest Problem Right Now Isn’t the Market, It’s Its Own Holders appeared first on BeInCrypto.
Crypto World
Drift gets $148 million rescue fund and Tether will replace Circle’s USDC for settlement after massive exploit


Drift Protocol, the victim of a recent North Korean exploit, plans to relaunch with Tether’s USDT as its settlement layer after securing a proposed funding package of up to $147.5 million from the stablecoin issuer and partners, the companies said on Thursday.
The deal includes up to $127.5 million from Tether and $20 million from the other partners, structured to support user recovery following Drift’s April 1 exploit and to reboot the platform as a USDT-based perpetual futures exchange on Solana. Previously, the platform used Circle’s stablecoin USDC as its settlement layer.
The rescue package combines a revenue-linked credit facility, ecosystem grants and loans to market makers. A portion of trading revenue, alongside committed capital, will be directed to a recovery pool aimed at covering roughly $295 million in user losses over time.
The funding comes after a North Korea-linked group infiltrated Drift Protocol, posing as a quantitative trading firm for about six months before carrying out an exploit that was more than $270 million on April 1. Drift’s governance token, DRIFT, has lost about 70% of its value since the exploit.
Circle came under fire from the crypto community for its seeming unwillingness to halt the money transfer after the exploit. The attacker moved about $232 million in USDC from Solana to Ethereum using Circle’s cross-chain transfer protocol. Some critics, including blockchain investigator ZachXBT, said Circle could have moved faster to blacklist wallets and freeze funds to prevent (or at least slow down) the attacker from moving the assets.
However, Circle’s didn’t take any such actions due to legal risks.
Its CEO, Jeremy Allaire, later said that his company freezes USDC wallets only when directed by law enforcement or courts, not in real time during hacks. The approach reflects Circle’s broader strategy to align closely with regulators and institutions.
Its rival, USDT, meanwhile, is more nimble at freezing funds. The stablecoin issuer has repeatedly frozen assets linked to hacks or other illicit activities previously.
Drift is the largest decentralized perpetual futures exchange on Solana, with more than 175,000 users and roughly $150 billion in cumulative trading volume. Founded in 2021, it offers perpetuals, spot trading, lending, borrowing and cross-margin trading.
Stablecoin war
Competition in stablecoins is intensifying as exchanges, fintechs, and traditional financial institutions race to control the on-ramps, liquidity, and settlement layers that underpin digital asset markets.
Circle’s USDC has been steadily chipping away at Tether’s long-standing dominance of the stablecoin market, gaining share on the back of regulatory alignment and growing institutional use.
While USDT still leads by a wide margin, according to CoinDesk data, with roughly $185.5 billion in supply versus about $78.6 billion for USDC, Circle’s transaction volume outpaced Tether’s in recent months as its market share expanded.
With the new funding package, Tether also plans to fund fee reductions and user incentives tied to Drift’s transition to USDT, while extending liquidity support to designated market makers to bolster trading depth at relaunch.
Drift said the move positions USDT at the center of its trading infrastructure while providing a pathway to restore user funds and resume operations.
Read more: How a Solana feature designed for convenience let attackers drain more than $270 million from Drift


HIVE Digital is raising $75m in 0% exchangeable notes to fund GPUs and data centers as it pivots from pure bitcoin mining toward AI cloud and eyes a TSX up‑listing.
Summary
- HIVE Digital plans a $75m private placement of 0% exchangeable senior notes due 2031.
- Proceeds will fund GPU purchases, AI data center expansion and capped call hedging.
- The miner has TSX conditional approval after posting record $93.1m quarterly revenue.
HIVE Digital Technologies is raising $75 million via a private offering of 0% exchangeable senior notes due 2031, doubling down on artificial intelligence infrastructure and data centers as it prepares to move its listing to the Toronto Stock Exchange.
The notes will be issued by HIVE Bermuda 2026 Ltd., a wholly owned subsidiary, to qualified investors in a deal that also includes a 13‑day option for an additional $15 million of paper.
According to HIVE, net proceeds will fund “general corporate purposes and capital investment, including the purchase of graphics processing units and data center expansion,” as the company accelerates its pivot from pure bitcoin mining toward high‑performance computing and AI workloads.
The securities will not bear regular interest and can be exchanged into cash, HIVE common shares, or a mix of both once final pricing and the initial exchange rate are set, giving investors equity‑linked upside without conventional coupons.
To offset potential dilution from the exchangeable notes, HIVE “intends to fund capped call transactions using cash on hand,” a structure designed to cap the effective conversion price and reduce pressure on common shareholders if the stock rallies.
The company said part of the net proceeds may be used to reimburse the issuer for those capped call costs, linking the financing directly to equity‑protection mechanics.
HIVE also disclosed it has received conditional approval to list its common shares on the Toronto Stock Exchange, with trading expected to transition from the TSX Venture Exchange around April 30, subject to meeting TSX requirements by June 30, 2026. The miner’s shares closed at $2.47 on Nasdaq on Wednesday, with roughly $42 million in volume, compared with an average of about $24.6 million.
The financing push follows what HIVE called “record” quarterly results in its fiscal third quarter ended Dec. 31, 2025, where it reported $93.1 million in revenue, up 219% year‑over‑year and 7% quarter‑over‑quarter. The company still posted a net loss of $91.3 million, driven by accelerated depreciation tied to its Paraguay expansion and non‑cash revaluation adjustments, underscoring the capital‑intensive nature of its shift beyond bitcoin mining.
In March, HIVE announced it would progressively “phase down” ASIC‑based bitcoin mining at its Boden facility in Sweden amid tax disputes with local authorities while upgrading the site into a Tier‑III high‑performance computing data center. The firm has already launched its first GPU cluster in Asunción, Paraguay, where its BUZZ AI Cloud platform is processing early large language model training workloads, signaling how quickly the business is re‑orienting toward AI cloud services.
In previous crypto.news coverage of miners diversifying into high‑performance computing, reporters highlighted how firms are seeking to smooth bitcoin cycle risk by monetizing GPU compute for AI and enterprise clients, a trend HIVE’s latest financing appears designed to accelerate.
Other crypto.news reporting on miners’ capital markets moves and AI pivots has tracked a similar shift, including pieces on public miners’ debt raises and data‑center conversions in North America.
Crypto World
Ethereum Crypto Open Interest Just Hit $34 Billion in 24 Hours: Is a Breakout or a Liquidation Cascade Coming?

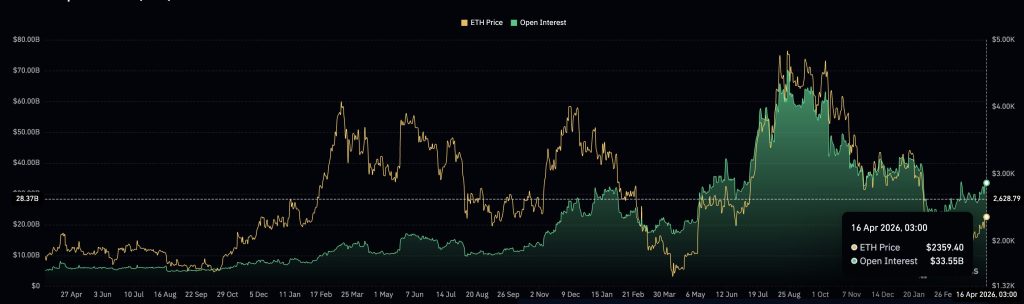
Ethereum (ETH) Crypto is trading above $2,300, and its futures market is heating up fast. Open interest across derivatives venues has surged 26%, with total ETH OI climbing to $34.165 billion after an 11.59% single-day jump, the kind of move that historically precedes either a decisive breakout or a sharp liquidation cascade.
The question isn’t whether institutional money is back in ETH. It’s whether the on-chain fundamentals can keep pace with the leverage being piled on.

Ethereum (ETH) Crypto Derivatives OI Hits $34B – Who’s Holding the Risk?
Binance leads all venues with $7.416 billion in ETH open interest, followed by Gate at $4.36 billion, Bybit at $2.331 billion, and OKX at $1.943 billion.
Those four exchanges concentrate the majority of leveraged exposure, and Binance plus OKX alone control 53.3% of the global derivatives market share, a venue concentration that amplifies cascade risk if either platform experiences a squeeze or outage.
This isn’t the first time ETH OI has ballooned into the $30 billion range. An earlier buildup pushed totals to $30.451 billion, with Binance at $6.593 billion and Gate at $3.875 billion, a near-identical distribution to today’s setup.
Analysts tracking prior episodes note that mid- to high-$20 billion OI levels consistently preceded 24-48 hour liquidation spikes when funding rates flipped. At $34 billion, the setup is more pronounced.
The OI buildup creates what traders describe as a reflexive structure: rising prices pull in more leverage, which amplifies the move higher, but also primes sharper drawdowns if momentum stalls.
Funding rates and liquidation cluster data above the $2,300 handle are the metrics to watch in real time. A 4-6% OI drop, consistent with prior deleveraging episodes, would represent roughly $1.4-2 billion in forced unwinds.
Ethereum Price Prediction: Can ETH Clear $2,400 and Target $2,940?
ETH price is forming a rounded bottom on the 12-hour chart after bouncing from a local low of $1,940 on March 29, with a 20% rebound to $2,330 fueled by improving macro conditions.
The key technical level is $2,400, the neckline of the base structure. If bulls can close above it on meaningful volume, the measured move targets $2,940, representing roughly 32% upside from current levels.
For a deeper look at the recent ETH rally and price structure, the setup has been building since the March flush.
Support is anchored at $2,140, near the 20-day EMA, which acted as a retest zone during the recovery. Bears need a close back below that level to invalidate the rounded bottom thesis, if that breaks, $1,940 comes back into play.
CryptoQuant data shows whale profitability has returned post-rebound, with large-holder optimism pointing toward a $3,000 psychological target.
However, OI at $34 billion without a corresponding increase in network activity means leverage is outpacing fundamentals.
If Ethereum’s on-chain transaction volume and fee generation don’t expand alongside the price recovery, the rally lacks structural support and becomes purely a derivatives-driven phenomenon, fragile by definition.
Institutional ETF inflows into ETH remain a secondary catalyst worth monitoring as a confirmation signal.
The post Ethereum Crypto Open Interest Just Hit $34 Billion in 24 Hours: Is a Breakout or a Liquidation Cascade Coming? appeared first on Cryptonews.
Crypto World
VerifiedX launches Bitcoin privacy layer amid industry push to close institutional privacy gap


A growing push to bring privacy to public blockchains has reached Bitcoin, with VerifiedX unveiling a new layer designed to shield transactions while maintaining auditability.
The system, called Prism, enables encrypted balances, shielded addresses and selective disclosure, allowing users to transact privately while still proving compliance when required, according to an emailed announcement shared with CoinDesk on Thursday.
The timing reflects a broader shift across the industry. The XRP Ledger this week introduced zero-knowledge proof (ZKP) capabilities aimed squarely at institutional users seeking to transact without exposing sensitive data on public ledgers.
That effort highlights what many see as a core barrier to institutional adoption: transparency. While public blockchains provide trust through openness, they also expose balances, counterparties and transaction flows — something institutions typically avoid in traditional finance (TradFi).
Any such development carries added weight when applied to Bitcoin. As the largest digital asset — worth more than the rest of the crypto market combined at times — Bitcoin remains the primary gateway for institutional capital. That means improvements to its functionality, particularly around privacy and usability, have the potential to influence the entire sector more profoundly than similar upgrades on smaller networks.
VerifiedX is applying this model directly to Bitcoin-linked activity rather than building a separate privacy chain. Assets can move between transparent and shielded states, while “viewing keys” enable selective access for auditors or regulators.
Beyond payments, the system supports programmable use cases such as private lending, trading and automated transactions, including agent-driven finance, all without revealing positions or intent onchain.

South Korea’s Ministry of Economy and Finance (MOEF) is advancing a blockchain-based payments experiment for government operating expenses within a regulatory sandbox focused on distributed ledger technology (DLT). In a Thursday announcement, the MOEF said it had selected a pilot that will use tokenized deposits to execute government spending, with a full rollout planned for the fourth quarter of 2026. The program will begin in Sejong City and will test predefined spending conditions, including limits on timing and usage categories.
Tokenized deposits are digital representations of traditional bank deposits that sit on blockchain or other DLT infrastructure. They are designed to function as bank liabilities within the existing financial system, rather than as independent stablecoins or new money. By moving government payments onto a tokenized layer, Seoul aims to investigate whether programmable, bank-backed money can improve traceability, reduce misuse, and streamline public-finance processes while staying anchored to the conventional banking system.
The MOEF’s pilot signals a shift from subsidy-focused experiments toward day-to-day public spending. If successful, the tokenized-deposit framework could become a tested backbone for more transparent and auditable government payments, potentially expanding to broader fiscal operations beyond the initial operational expenses.
Key takeaways
- The Ministry of Economy and Finance has chosen a pilot to test tokenized deposits for government operational spending, with a staged rollout targeting Q4 2026 in Sejong City.
- Tokenized deposits represent bank liabilities issued on blockchain technology, offering a way to digitize government spending while remaining within the conventional financial system.
- The sandbox will define spending scope through predefined time windows and permitted categories, aiming to improve oversight and curb fund misuse.
- South Korea has previously explored tokenized deposits for other public-finance use cases, and the MOEF has signaled broader ambitions to digitalize treasury fund execution in the coming years.
- If the program proves viable, authorities will consider regulatory and legal changes to accommodate larger-scale, programmable government payments.
From subsidies to daily government spending: what changes with tokenized payments
The MOEF described the pilot as a move beyond subsidies toward implementing tokenized deposits in routine public-finance operations. The trial will involve collaboration with participating institutions to delineate the project’s scope, including how spending windows and category permissions are defined. The controlled environment is meant to test both the practicalities of tokenized settlement and the governance mechanisms required to monitor and audit such transactions.
Under the framework, government operational expenses—currently processed through government-issued cards and subsequent reporting—will be reimagined within a tokenized-deposit rails environment. The test is designed to demonstrate whether programmable, bank-backed digital money can enhance oversight and reduce the risk of misuse, all while preserving compatibility with the existing financial ecosystem.
Crucially, the ministry underscored that the tokenized deposits used in this pilot are still bank liabilities. The objective is not to replace conventional payment rails but to explore whether an additional, auditable channel can improve efficiency and transparency in public spending without disrupting traditional financial relationships.
Broader policy arc: past milestones and future implications
South Korea’s approach to tokenized deposits isn’t new. The MOEF has referenced earlier efforts to pilot tokenized deposits for policy objectives, including a March initiative with the Environment Ministry and the Bank of Korea to fund electric-vehicle charging infrastructure subsidies. Those programs reflect a broader ambition to integrate tokenized payment rails into public finance, with the MOEF signaling a goal of converting a significant portion of treasury fund execution to digital instruments by 2030. The current Sejong pilot appears to be a natural extension of that strategy, moving from subsidy-specific pilots toward more routine public-spending workflows.
The evolution of these pilots sits within a wider regulatory and financial landscape in which central banks, ministries, and financial institutions are testing how tokenized, bank-backed money could coexist with traditional currency and payments. If the Sejong test succeeds, it could provide a concrete blueprint for how government agencies implement programmable money in a controlled, auditable manner before expanding to other departments or broader categories of spending.
Implications for investors, builders, and public governance
For the crypto and fintech communities, the MOEF’s sandbox demonstrates a growing appetite for studying how tokenized financial instruments can operate within a regulated government-finance context. Success would offer several potential benefits: enhanced visibility into government disbursements, tighter controls over spending categories and timing, and the opportunity to build interoperable rails that connect banks, public agencies, and private-sector contractors in a traceable, programmable framework.
From an investment and development perspective, the project highlights a potential market for public-sector digital-finance tooling that blends conventional liability structures with modern distributed-ledger infrastructure. Companies and platforms that can demonstrate robust security, compliance with existing financial regulations, and interoperability with public procurement and accounting systems could see demand grow as governments pursue similar pilots domestically and abroad.
However, the path forward is contingent on regulatory clarity and the outcomes of the Sejong trial. Key questions include how the government will govern access to tokenized deposits, how to ensure robust auditability and privacy, and how to manage potential cyber risks inherent in new digital-money rails. Observers will also watch how the experience translates into policy decisions—whether to scale the program, adjust spending rules, or adopt new legal frameworks that explicitly accommodate tokenized, programmable government payments.
In the near term, the MOEF’s announcement underscores a measured, evidence-driven approach to digital finance in the public sector. The focus on predefined parameters—timing, categories, and oversight mechanisms—reflects a cautious but purposeful experiment aimed at extracting concrete lessons before expanding beyond Sejong and beyond operational expenses.
Readers should monitor how the sandbox defines success metrics, how the pilot interfaces with banks and public agencies, and what regulatory changes ministries may pursue as a result. The coming months will reveal whether tokenized deposits can practically streamline public spending while maintaining the governance standards required for public funds.
As South Korea charts this course, the broader question for the market is whether this model can scale, what institutional partners will be involved, and how quickly such technology can translate into tangible improvements in transparency, efficiency, and accountability in government payments.
Ultimately, the Sejong pilot marks a notable milestone in the ongoing exploration of programmable public money—an initiative that could reshape how governments transact, how contractors get paid, and how citizens experience the accountability of public finance.


Coinglass flags $1.64b in BTC longs at risk below $70,721 and $1.25b in shorts above $78,068 as Bitcoin grinds in a tightly leveraged $70k–$78k range.
Summary
- Coinglass data shows $1.64b in BTC longs at risk if price dips below $70,721.
- Another $1.25b in BTC shorts could be wiped out if Bitcoin breaks above $78,068.
- Traders face a narrow band between major liquidation pockets as BTC hovers in the mid-$70,000s.
According to Coinglass, if Bitcoin (BTC) falls below $70,721, the cumulative long liquidation intensity on major centralized exchanges (CEXs) climbs to roughly $1.644 billion. Conversely, if BTC breaks above $78,068, the platform estimates cumulative short liquidations of about $1.25 billion, underscoring how tightly clustered leverage has become around the current range.
At 8:30 a.m. Eastern Time on April 14, the price of Bitcoin stood near $74,315, up from about $71,189 a day earlier but still roughly $10,250 lower than a year ago, illustrating how volatility persists even as BTC trades in the mid‑$70,000s. Prediction markets on Polymarket currently assign roughly a 71% chance that Bitcoin will settle between $74,000 and $76,000 on April 16, with the $72,000 to $74,000 band priced at about 22%, reflecting expectations that BTC will stay pinned near the middle of the liquidation corridor in the short term.
The liquidation bands highlighted by Coinglass suggest that a clean break below $70,721 or above $78,068 could trigger forced selling or buying, amplifying moves as exchanges close out underwater futures positions. In practice, that means spot moves near those levels risk cascading into hundreds of millions of dollars in additional flow as over‑leveraged longs or shorts are flushed.
Recent crypto.news coverage of Bitcoin’s range‑bound trading and liquidity build‑up has pointed to a similar setup, with BTC grinding sideways while leverage and open interest quietly rise. In another crypto.news story on Brazil’s B3 exchange and its tokenized real‑world asset and stablecoin plans, analysts described how Bitcoin’s growing role in institutional portfolios is increasingly tied to broader digital asset infrastructure rather than purely retail speculation.
Grayscale’s institutional outlook for 2026, as reported by crypto.news, framed this phase as “the dawn of crypto’s institutional era,” with Bitcoin at the center of a broader shift toward on‑chain capital markets and stablecoin‑driven settlement. Against that backdrop, the current $70,721 to $78,068 liquidation bracket around BTC is more than just a trading range: it is the zone where aggressive leverage meets a maturing, increasingly institutional market structure.
Relevant crypto.news articles include a deep dive on decentralized governance in DeFi, an analysis of Bitcoin’s range‑bound price action and liquidity, and a report on B3’s tokenization and stablecoin strategy, which together contextualize how BTC’s current trading band fits into a larger evolution of crypto market plumbing.

US Victims Gain a Path to Restitution
Victoria Beckham breaks silence on family's estrangement from son Brooklyn

Lewis Capaldi and Sam Fender tribute night to aid Darlington Mind


-

 Politics6 days ago
US brings back mandatory military draft registration
-
 Sports6 days ago
Man United discover Nico Schlotterbeck transfer fee as defender reaches Dortmund agreement
-

 Fashion6 days ago
Weekend Open Thread: Veronica Beard
-

 Politics6 days ago
Malcolm In The Middle OG Turned Down ‘Buckets Of Money’ To Appear In Reboot
-

 Politics4 days ago
World Cup exit makes Italy enter crisis mode
-

 Business6 days ago
Tesla Model Y Tops China Auto Sales in March 2026 With 39,827 Registrations, Beating Cheaper EVs and Gas Cars
-

 Crypto World3 days ago
The SEC Conditionalises DeFi Platforms to Be Avoided for Broker Registration
-

 Crypto World3 days ago
SEC Signals Exemption for Crypto Interfaces From Broker Registration
-

 News Videos1 day ago
Secure crypto trading starts with an FIU-registered
-
 NewsBeat4 days ago
Pep Guardiola and Gary Neville agree over Arsenal title problem that benefits Man City
-

 Business5 days ago
Ireland Fuel Protests Enter Day 5 as Blockades Spark Shortages and Government Prepares Support Package
-

 Business6 days ago
OpenAI Halts Stargate UK Data Centre Project Over Energy Costs and Copyright Row
-

 Politics6 days ago
LBC Presenter Mocks Trump Over Iran War Failures
-

 Crypto World6 days ago
Federal judge blocks Arizona from bringing criminal charges against Kalshi
-

 NewsBeat2 days ago
Trump and Pope Leo: Behind their disagreement over Iran war
-

 Crypto World2 days ago
SEC Proposes Certain Crypto Interfaces Don’t Need to Register as Brokers
-
 NewsBeat4 days ago
JD Vance announces ‘no agreement’ with Iran over nuclear weapons fear
-

 Tech7 days ago
A version of Windows 10 released a decade ago is now eligible for additional security patches
-

 Business6 days ago
IMF retains floor for precautionary balances at SDR 20 billion
-

 Business6 days ago
Former Liverpool CEO eviscerates FIFA for World Cup ticket pricing
You must be logged in to post a comment Login