
Crypto World
Bitcoin’s $47K Discount: Why Math Shows $123K Target While Price Sits at $76K

TLDR:
- Bitcoin’s power-law z-score at -0.69 indicates 38.2% discount from $122,681 mathematical trend value
- ETF outflows accelerated 265% to $15.25 billion in 30 days, driving persistent mechanical selling
- Open interest dropped 21.6% alongside 19.5% price decline, signaling deleveraging not panic selling
- Maximum gamma at $75K creates price compression with call wall at $90K and flip level at $71K
Bitcoin trades at $76,337 as of writing while mathematical models place its trend value at $122,681, creating a 38.2% discount that stems from mechanical deleveraging rather than fundamental weakness.
Data analyst David highlights this gap between short-term price formation driven by exchange-traded fund flows and long-run anchors determined by fixed supply and production costs.
The power-law z-score stands at -0.69, suggesting the asset trades significantly below its statistical trend despite unchanged underlying fundamentals.
ETF Outflows Drive Persistent Price Pressure
The primary catalyst behind Bitcoin’s current price weakness appears through exchange-traded fund activity.
Estimated net outflows reached $15.25 billion over the past 30 days, representing a 265% acceleration in redemptions. Trading volume remains at 0.8 times normal levels, indicating sustained rather than panicked selling pressure.
David explains that “this is how a scarce asset gets pushed below its ‘map’ without a dramatic capitulation.” The flow remains persistent but measured, avoiding the high-volume liquidation cascades typical of market crashes. Spot trading volume corresponds with gradual position unwinding rather than forced selling.
The distinction matters because mechanical selling creates different market dynamics than sentiment-driven crashes.
Exchange-traded fund investors can redeem shares steadily without triggering the feedback loops that amplify volatility. This steady pressure pushes price lower while maintaining relatively orderly market conditions.
Traditional panic selling typically accompanies volume spikes and accelerating price declines. Current market behavior shows neither characteristic, suggesting the selling pressure stems from portfolio rebalancing or institutional allocation shifts.
The absence of volatility expansion supports this interpretation of gradual rather than distressed selling.
Derivative Positioning Reveals Compression Dynamics
Open interest declined 21.6% over 30 days while price dropped 19.5%, producing a positive correlation of 0.66 between the two metrics.
David notes that “when price falls with collapsing open interest, you’re not seeing panic. You’re seeing balance sheets quietly shrink.” This synchronized decline indicates deleveraging rather than new short positions accumulating.
The paper-to-spot ratio stands at just 1.9%, reflecting reduced derivative activity relative to underlying asset trading. Options market structure shows net gamma exposure at negative $43 million, near neutral territory.
Maximum gamma concentrates at the $75,000 strike, creating a gravitational effect around current prices.
Put walls sit at $75,000 approximately 1.3% below spot, while call walls emerge at $90,000 roughly 18.5% higher. The gamma flip level appears at $70,999, about 6.5% below current trading levels.
David observes that “price feels ‘stuck’ because hedging flows are absorbing movement near the strike. Not because demand disappeared.”
The analyst emphasizes the asymmetric setup this creates, stating that “downside needs the persistent seller to keep selling. Upside mostly needs the seller to stop.”
The derivative structure adds friction to large moves in either direction until flow patterns shift materially or positioning constraints change substantially.


Bitcoin (BTC) appears on track to hit $90,000 in the coming weeks as whales accumulated about 20 times the cryptocurrency’s daily new supply in the past weeks.
Key takeaways:
-
Whales bought roughly 270,000 BTC in the past 30 days.
-
BTC broke out of its symmetrical pattern setup with a measured target at around $92,220.
BTC whales accumulate at fastest pace since 2013
Whales, entities that hold over 1,000 BTC, have added roughly 270,000 coins to their wallets in the past 30 days, marking their largest buying spree since 2013, according to onchain data resource CryptoQuant.

Part of that whale accumulation likely came from Strategy. The company’s recent filings show that it bought about 42,166 BTC between March and April, accounting for roughly 16% of the 270,000 BTC added by whale wallets over the same period.
US-based spot Bitcoin ETFs also recorded more than $200 million in net inflows during that stretch. Still, those inflows remain modest compared with earlier phases of the cycle, pointing to cautious re-engagement by Wall Street traders.

The accumulation came even as Bitcoin whipsawed sharply in recent weeks, including a roughly 15% drawdown before fully recovering those losses, with easing US–Iran tensions helping drive the rebound in risk appetite.
Related: Bitcoin traders cash out 63K BTC profit as price rallied above $76K: Will the market rebound?
BTC triangle setup hints at rebound to $90,000
From a technical perspective, Bitcoin has entered the breakout stage of its prevailing symmetrical triangle pattern.
Triangle patterns can break in either direction regardless of the prevailing trend, with the resulting move often matching the formation’s maximum height.
In Bitcoin’s case, price has broken to the upside after moving above the triangle’s upper trendline, opening the door for a potential rally toward the measured target near $92,220 by April or May.

Bitcoin’s price must break decisively above its 200-day exponential moving average (200-day EMA, the blue line) at around $83,000 to reach the triangle target. This EMA was instrumental in limiting BTC’s attempts at an upside breakout in January.
Earlier, Nic Puckrin, crypto analyst and founder of Coin Bureau, said Bitcoin could push toward $90,000 if the current US–Iran ceasefire holds, oil prices fall toward $80, and softer economic data helps ease stagflation fears.
This article is produced in accordance with Cointelegraph’s Editorial Policy and is intended for informational purposes only. It does not constitute investment advice or recommendations. All investments and trades carry risk; readers are encouraged to conduct independent research before making any decisions. Cointelegraph makes no guarantees regarding the accuracy or completeness of the information presented, including forward-looking statements, and will not be liable for any loss or damage arising from reliance on this content.

TLDR:
- Binance recorded daily stablecoin net inflows between $100M and $450M throughout April 2025, per on-chain data.
- Stablecoin reserves on Binance recovered roughly $6B after a steep drawdown of nearly $10B earlier in April.
- U.S. Core PPI for March came in at 0.1%, well below February’s 0.3%, easing broader inflation concerns for markets.
- Easing Strait of Hormuz tensions shifted investor sentiment, prompting gradual stablecoin redeployment onto exchanges.
Stablecoins are flowing back to exchanges as geopolitical tensions ease around the Strait of Hormuz. The start of the week shifted toward de-escalation, a move the market had already begun pricing in.
Supporting this, U.S. Core PPI data for March came in at 0.1%, well below the 0.3% of February. Against this backdrop, investors are redeploying stablecoins to exchanges, with Binance emerging as the primary destination.
Binance Sees Consistent Stablecoin Inflows Throughout April
On-chain analyst Darkfost reported that stablecoin (ERC-20) netflows on Binance have been dominated by inflows throughout April. Daily net inflows ranged between $100 million and $450 million across the month.
This steady movement of capital reflects a clear shift toward exchange positioning. Investors appear to be moving funds from off-exchange wallets back into active trading environments.
Darkfost noted that Binance is recording a net monthly average of approximately $4 billion in stablecoin inflows. This figure stands out against the uncertainty that weighed on markets in early April.
The data points to renewed interest in deploying capital within the crypto market. Traders are preparing to take positions rather than staying on the sidelines.
Meanwhile, stablecoin reserves on Binance have started recovering after a sharp drawdown earlier this month. After falling by nearly $10 billion, reserves have recovered approximately $6 billion.
This marks a meaningful return of liquidity to the exchange. It also shows that capital withdrawn during the downturn is finding its way back.
The rebound in reserves acts as a broadly constructive signal for the market. It shows that capital is not leaving the crypto ecosystem but rather being repositioned within it. This trend, while still early, points to growing confidence as macro conditions improve.
Easing Macro Environment Shapes Cautious Investor Positioning
The macroeconomic picture played a direct role in shifting investor behavior this week. Easing tensions in the Strait of Hormuz reduced risk aversion across global markets.
The crypto market had already begun pricing in the de-escalation before it fully materialized. This early repricing set the tone for renewed exchange activity.
Adding to the improved mood, U.S. Core PPI data for March printed at 0.1%. This was well below the 0.3% recorded in February.
It showed the U.S. economy absorbed energy-driven inflation without it spreading broadly into production costs. For risk assets, including crypto, this was a positive reading.
Despite the improving tone, the situation remains fragile, as Darkfost cautioned in the analysis. Geopolitical conditions in the Strait of Hormuz can shift quickly and without warning.
A reversal in tensions could slow or reverse the positive trend in stablecoin flows. Investors are advised to stay alert and manage risk accordingly.
Overall, the Binance data tells a story of gradual repositioning. Stablecoins are returning to exchanges as investors prepare for market activity.
The recovery in reserves, combined with consistent daily inflows, points to a cautious but growing readiness to act.

TLDR:
- X’s smart cashtags let Canadian users trade crypto directly from posts, with US access expected soon.
- Grayscale sees X Money mirroring WeChat’s super app model, with crypto playing a central long-term role.
- Meta, Telegram, PayPal, and Cash App are all embedding crypto into platforms used by millions daily.
- Robinhood’s tokenized stocks and eToro’s wallet acquisition show crypto infrastructure entering mainstream finance.
X’s new smart cashtags are reshaping how users engage with financial assets directly inside the social media platform. The feature allows users to tap on asset identifiers like $BTC and interact with live market data.
Canada-based users can already execute trades without leaving the app. This development places X closer to becoming a full-service financial platform, with crypto expected to take a central role in that transition.
X Moves Closer to a Financial Super App
Smart cashtags on X represent a meaningful shift in how social media intersects with financial markets. Users can now click on a cashtag and access real-time pricing data for assets, including cryptocurrencies.
For Canadian users, the feature already supports direct trading from the timeline. The United States market is widely expected to gain similar access in the near future.
Grayscale noted this week that the feature pushes X closer to the “everything app” model. The firm pointed to China’s WeChat as the blueprint for this kind of all-in-one platform strategy.
WeChat allows users to message, pay, invest, and shop without switching between apps. X appears to be building toward a comparable model through its X Money initiative.
X Money is expected to launch with traditional bank and fiat infrastructure as the foundation. However, deeper integration with crypto rails is seen as a natural progression from there.
The alignment of X’s existing crypto-heavy user base with this new trading feature creates a strong environment for growth. Meme culture and crypto news are already concentrated on the platform.
A seamless post-to-trade experience could generate new demand for crypto assets among casual users. Traders and enthusiasts who already discuss markets on X would face fewer steps to act on information.
This frictionless loop between content and commerce is central to what X is building. The cashtag rollout is one visible step in a longer strategic timeline.
Consumer Apps Are Building Financial Services on Crypto Infrastructure
Beyond X, crypto is becoming a core layer across major consumer platforms. Cash App, PayPal, and Venmo already allow users to buy, hold, and transfer crypto assets.
Telegram has gone further by embedding self-custody wallets directly inside its messaging interface. These moves reflect a broader pattern of mainstream apps treating crypto as financial infrastructure.
Grayscale’s post this week framed it clearly: “Consumer apps are building on crypto infrastructure.” Meta is reportedly reconsidering stablecoin integration after stepping back from earlier efforts.
Robinhood recently launched tokenized stocks on an Ethereum Layer 2 network. This same week, eToro acquired a crypto wallet provider to strengthen its own infrastructure.
Each of these moves adds a data point to the same trend. Traditional and social finance platforms are no longer treating crypto as a niche add-on.
Instead, they are embedding it into core product features used by millions. The direction across the industry is consistent, even if the pace varies by platform.
The pattern across X, Meta, Telegram, and fintech apps points toward a future where crypto transactions are routine.
Users may soon execute trades, send stablecoins, or hold tokenized assets without ever opening a dedicated crypto app.
The infrastructure is being built quietly inside platforms people already use daily. Smart cashtags on X are simply the most visible example


JustLend DAO’s third buyback burned 271.3m JST worth $21.3m, lifting total destroyed supply to 1.36b JST, or 13.7%, as its revenue-fed deflation plan rolls on.
Summary
- JustLend DAO has completed its third JST buyback and burn, destroying 271,337,579 tokens worth about $21.3 million.
- Cumulative JST burns now total 1,356,228,332 tokens, or 13.70% of supply, funded by protocol net income and accumulated earnings.
- The Tron-based lending protocol plans to keep running quarterly buybacks and transparent burn reports as part of a revenue-driven deflation program.
JustLend DAO has carried out its third major buyback and burn of JST, permanently removing 271,337,579 tokens with an estimated value of $21.3 million from circulation. In an announcement on April 16, the Tron-based lending protocol said the burned tokens were sent to a “black hole” address and funded by its net income for the first quarter of 2026 plus past accumulated profits.
With this latest event, the total number of JST destroyed has climbed to 1,356,228,332, representing 13.70% of the token’s overall supply and extending a rapid deflationary run that began in late 2025. Earlier rounds saw JustLend wipe out roughly 1.08 billion JST across two buybacks worth nearly $40 million, equal to about 10.96% of supply in under three months.
JustLend reiterated that its buyback program is explicitly tied to protocol profitability, describing the burns as “value empowerment” driven by real cash flow from lending spreads and other revenue sources on Tron. TRONSCAN data previously cited by Phemex and other outlets showed that earlier phases of the program destroyed JST worth roughly $44.8 million, underscoring that the effort is more than a symbolic supply cut.
According to prior disclosures, JustLend’s first burn came in October 2025 amid what CryptoSlate called a “revenue-driven deflation cycle,” at a time when the broader JUST ecosystem reported about $12.2 billion in total value locked, or roughly 46% of Tron’s on-chain TVL. Subsequent January 2026 burns removed another 525 million JST tokens valued at around $21 million, bringing the cumulative tally to just over 1.08 billion before the latest Q1 2026 event.
Market reaction has been mixed. Earlier coverage from NewsDirect and other venues noted that JST’s price hovered around $0.04 with only modest gains after the second burn, even as 11% of supply was retired, suggesting traders had partly priced in the deflation schedule. CoinMarketCap’s Top Stories desk reported a 3.6% JST rally over 33 hours as markets repriced the program that destroyed 11% of supply in 90 days, a burn rate described as outpacing BNB’s deflation.
JustLend says it will keep executing quarterly buybacks and burns and “regularly provide transparent updates to the community” as the program continues. For holders, the question now is whether a total burn already at 13.70% of supply — and rising — can meaningfully shift JST’s long-term valuation, or whether, as earlier price action hinted, fundamentals and Tron DeFi demand will matter more than the sheer number of tokens sent to a black hole.


Quantum computing stocks surged in double digits on April 14 and 15, as NVIDIA’s launch of Ising, the world’s first open-source quantum AI model family, reignited investor conviction that commercial quantum computing is accelerating faster than previously priced.
Summary
- IonQ closed up 20.95% to $43.25, D-Wave Quantum gained 22.63% to $20.81, and Rigetti Computing rose 13.28% to $19.11, all driven by the NVIDIA Ising announcement.
- D-Wave’s trading volume hit 90.2 million shares, approximately 227% above its three-month average, reflecting a sector-wide rerating rather than isolated stock-specific moves.
- TD Cowen analyst Krish Sankar called NVIDIA Ising a “critical catalyst” that could speed up commercialization of the quantum industry.
Quantum computing stocks posted their strongest multi-day rally of 2026, with IonQ, D-Wave Quantum, and Rigetti Computing all closing with double-digit gains on April 14 and 15 after NVIDIA announced Ising, its open-source AI model family for quantum processor calibration and error correction.
IonQ closed up 20.95% at $43.25. D-Wave Quantum gained 22.63% to close at $20.81 on trading volume of 90.2 million shares, roughly 227% above its three-month average. Rigetti Computing rose 13.28% to $19.11.
NVIDIA Ising directly targets the two biggest engineering barriers preventing quantum computers from becoming commercially useful: error correction and processor calibration. Both processes currently require enormous manual overhead and limit the scale at which quantum hardware can operate reliably.
By providing pre-trained, open-source AI models that reduce calibration time from days to hours and improve error correction decoding by up to 3x in accuracy, NVIDIA has materially shortened the engineering roadmap for companies like IonQ, D-Wave, and Rigetti, who are all racing to demonstrate consistent commercial utility before their runways run out.
TD Cowen analyst Krish Sankar said in a note that Ising would be “a critical catalyst that would speed up commercialization of the quantum industry.” B. Riley Securities analyst Craig Ellis told MarketWatch the models “could eventually become a big catalyst for quantum adoption over time.”
IonQ Had Additional Tailwinds
IonQ’s gains were amplified by two additional developments on the same day. The company confirmed a contract award from DARPA’s Heterogeneous Architectures for Quantum program, and separately announced a photonic interconnection breakthrough linking two independent trapped-ion quantum systems, a key step toward quantum networking at scale.
IONQ’s 2025 revenue was $130 million, up 202% year over year. Its 2026 guidance of $225 million to $245 million implies roughly 81% growth. The stock still carries a consensus “Strong Buy” rating with a $65.91 average price target, implying significant upside from current levels even after this week’s rally.
Crypto Implications Worth Watching
Progress in quantum error correction brings useful quantum computers closer to practical reality, a development the crypto sector has long monitored as a quantum threat to existing blockchain encryption standards. Bitcoin’s elliptic curve cryptography and the RSA protocols securing most wallets were not designed to withstand a cryptographically relevant quantum machine.
The NVIDIA Ising launch does not change that timeline in the near term. But every technical advance in error correction, the exact bottleneck Ising targets, shortens the path from today’s fragile qubits to the systems that security researchers say would put Bitcoin closer to risk on a 15-year horizon.
TLDR:
- Counterfeit Ledger Nano S Plus devices use ESP32 chips to steal seeds and PINs in plain text format.
- A fake Ledger Live app passed Mac App Store review and drained over $9.5 million from 50+ victims.
- The fraud spans five attack vectors including Android, iOS, Windows, macOS, and physical hardware.
- Ledger’s genuine check feature fails when hardware is compromised at the supply chain source level.
Counterfeit Ledger hardware wallets are at the center of a growing threat targeting cryptocurrency users worldwide.
A security researcher has documented a large-scale operation distributing fake Ledger Nano S Plus devices through multiple online marketplaces.
The compromised units appear identical to legitimate products but carry entirely different internal hardware. Seeds, PINs, and wallet data are being sent directly to attacker-controlled servers, draining any wallet initialized on the device.
Fake Hardware Hides Malicious Chips and Firmware
The counterfeit devices replace Ledger’s secure element chip with an ESP32 microcontroller. This substitute chip runs modified firmware labeled “Nano S+ V2 1.”
Unlike the genuine secure element, this hardware stores sensitive data in plain text. That data is then transmitted to remote servers controlled by the attackers behind the operation.
Beyond the hardware, the campaign also distributes a fraudulent version of Ledger Live. This fake app is built with React Native and signed using a debug certificate.
It intercepts transactions and sends sensitive user data to multiple command-and-control servers. Users downloading this version have no visible indication that anything is wrong.
The attack spans five separate vectors: compromised hardware, Android APKs, Windows executables, macOS installers, and iOS apps.
The iOS distribution uses Apple’s TestFlight platform to bypass the standard App Store review process. This approach allows the fraudulent software to reach users without triggering typical security checks. Each channel serves as an independent entry point for the same underlying scam.
Ledger’s built-in genuine check feature is designed to verify device authenticity. However, that verification process can be bypassed when the hardware is tampered with at the source.
This makes the point of purchase a critical security variable. Buying from unauthorized sellers removes the only reliable layer of hardware-level verification.
Separate Mac App Store Fraud Drained Over $9.5 Million
Separately, on-chain investigator ZachXBT documented another fake Ledger Live app that passed through Apple’s Mac App Store review. That operation alone drained more than $9.5 million from over 50 victims.
Among those affected was musician G. Love, who lost 5.92 BTC after entering his recovery phrase into the fraudulent application. The app presented itself as the legitimate Ledger companion software.
These two operations together show a clear pattern in how attackers are targeting hardware wallet users. Rather than exploiting firmware vulnerabilities, they are intercepting users before they reach a genuine device.
The fraud happens at the distribution level, not the protocol level. This shift makes user behavior and purchase source more important than ever.
Security best practices remain unchanged despite the evolving tactics. Hardware wallets should only be purchased directly from the manufacturer’s official website.
No legitimate wallet software will ever request a 24-word recovery phrase on screen. Any application asking for seed phrase input is running a scam, without exception.
The broader message from both incidents is straightforward. The hardware itself remains secure when obtained through proper channels.
The vulnerability now lives in the supply chain and software distribution ecosystem. Staying safe requires equal attention to both where a device is bought and how companion software is sourced.
Crypto World
Solana Price Prediction: Standard Chartered Sets $250 Target While a New Crypto Nears Binance
If the regret of seeing SOL run from $8 to nearly $295 and not holding any still sits with you, the market just put another chance in front of you that looks just like the window you let close.
Standard Chartered analyst Geoffrey Kendrick set a $250 solana price prediction for 2026 in his latest April report, and the outlook is shifting as Solana spot ETF assets cross $1 billion in combined inflows while Fear and Greed sits at 12, per openPR.
Pepeto draws closer to its Binance listing with the presale moving at its fastest pace, and over $9.042 million has come in while the rest of the market stays stuck in panic.
Solana Price Prediction Shifts as Standard Chartered Sets $250 Year-End Target
Standard Chartered set a $250 solana price prediction for 2026 in its April update, cutting an earlier $310 target by 19% on macro headwinds but still projecting a 200% move from current levels, per openPR.
Solana spot ETFs from Bitwise (BSOL) and Fidelity (FSOL) have pulled in over $1 billion combined, and Forward Industries now holds 6.9 million SOL worth nearly $1 billion as a Nasdaq-listed treasury play. Morgan Stanley also filed for its own Solana Trust in January, adding another layer of institutional weight.
The SOL outlook now has real institutional backing for the first time in months, but your portfolio still has to wait for a $48 billion market cap to move before the number changes.
The Solana Price Prediction Play to Watch Right Now
Pepeto: The Tools Your Capital Needs While SOL Grinds
The Binance listing gets nearer and rounds fill faster every week. Pepeto is a token scanning and no-fee trading platform, the kind of tool that matters most when the market turns risky and the solana price prediction stays stuck in a range.
While SOL holders hope the Firedancer upgrade and returning ETF flows push prices higher, Pepeto checks every token in real time on Ethereum, BNB, and Solana, catching the bad ones before they reach your wallet and giving you the protection layer that institutional desks use but never share.
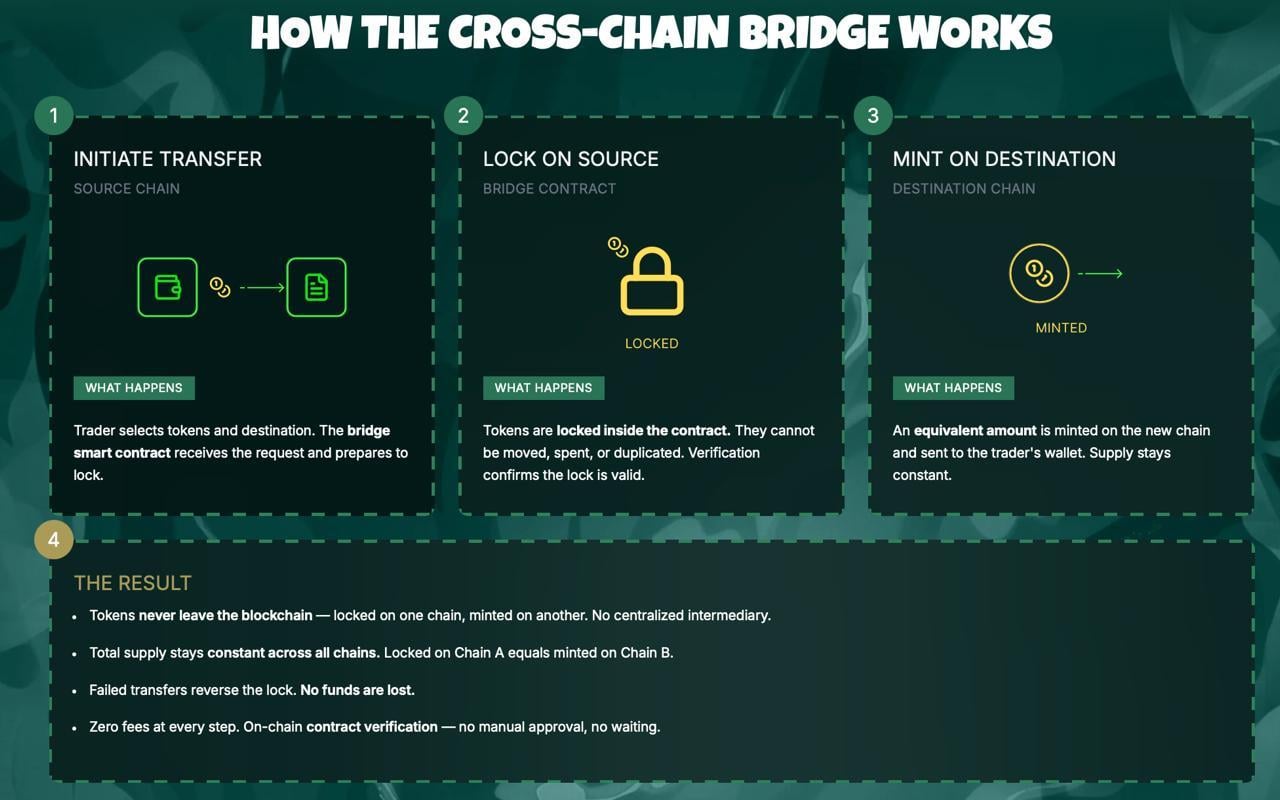
PepetoSwap runs every trade at zero cost so your entire buy turns into your entire position, and your capital starts working immediately instead of sitting inside a $48 billion market cap hoping for more money to show up. The cross-chain bridge moves tokens between all three networks at zero gas, so nothing leaks out during the transfer.
Over $9.042 million came in at $0.0000001862 during Fear 12, and the presale is small enough that 100x from this price is what analysts target because the coin runs real swaps and the Pepe creator showed the blueprint works when Pepe hit $7 billion with zero tools. Every contract passed SolidProof. A former Binance lead built the exchange.
And staking at 183% APY grows your stack every single day while listing day approaches. Your wallet gets bigger while you sleep. Buying after the Binance listing means paying whatever the latecomers decide those tokens cost, and the wallets that entered during Fear 12 are the ones whose money compounds first while everyone else pays full price.
Solana (SOL) Price at $83.60 as ETF Inflows Cross $1 Billion
Solana (SOL) trades at $83.60 on April 15 per CoinMarketCap, sitting 72% under its $295 all-time high. Solana spot ETFs from Bitwise (BSOL) and Fidelity (FSOL) have pulled in over $1 billion combined, and Forward Industries now holds 6.9 million SOL as a Nasdaq-listed treasury play.
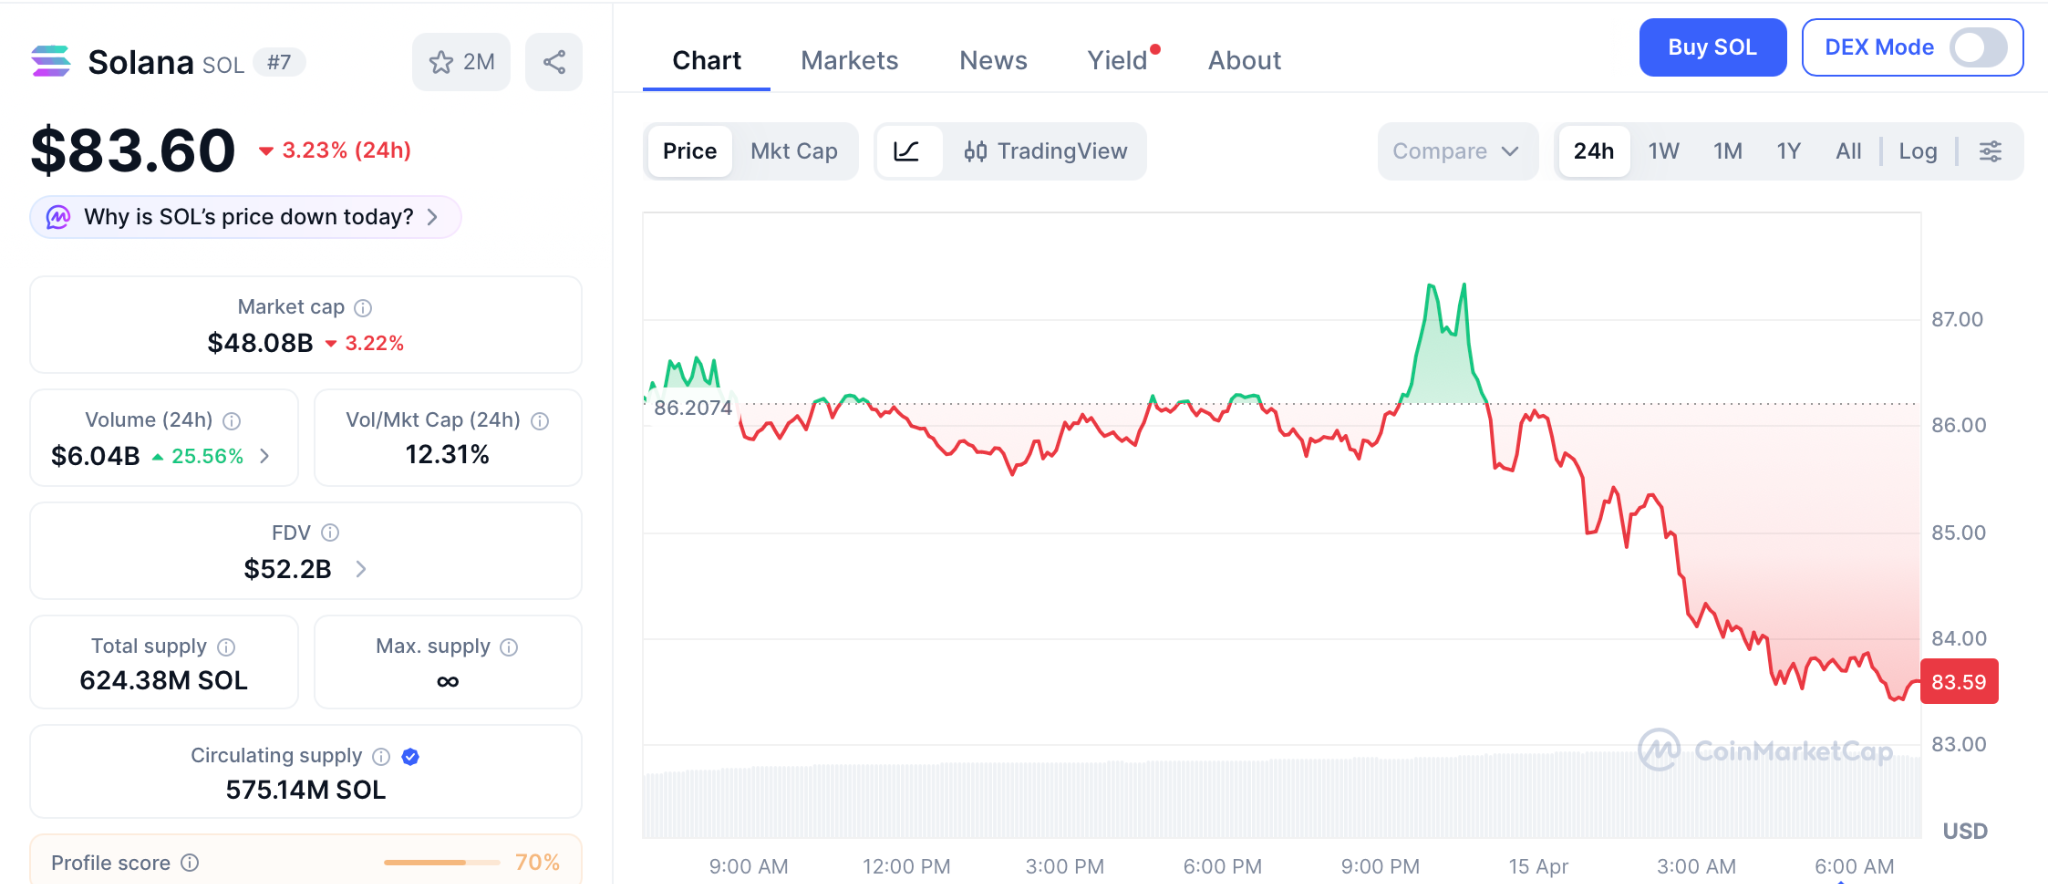
Standard Chartered targets $250 by year end, a 3x over quarters. Support holds at $81 with the first wall at $90, then $100. A drop below $81 opens a path to $75. The solana price prediction math from a $48 billion cap means even the strongest targets need a year or more to land, not the kind of return that changes the next 12 months.
Conclusion
Solana needs time and fresh capital to hit the levels that matter. But if the ache of missing SOL’s early run still sits with you, Pepeto is that exact moment happening again right now, with a Binance listing locked in and working tools that SOL never had at this stage.
The wallets that got in early last time built fortunes, and every one of them says the same thing: I should have gone bigger. The Pepeto official website still has presale pricing live while Standard Chartered calls for $250 SOL. This is the entry. This is the window. The Binance listing will shut this door forever, and once it does, the presale price becomes the number you tell people about for the rest of the cycle.
Click Here To Enter The Pepeto Presale Before Listing

FAQs
Is the solana price prediction strong enough to hold through current fear?
Standard Chartered targets $250 for SOL by year end while spot ETF assets cross $1 billion in combined inflows. Pepeto targets 100x from one listing event through the Pepeto official website.
Is Pepeto the second chance for wallets that missed early SOL?
Over $9.042 million raised during Fear 12 with a confirmed Binance listing mirrors how early cycle entries formed before. The solana price prediction takes quarters to reach its targets while Pepeto gets there from one listing day.
Disclaimer: This is a Press Release provided by a third party who is responsible for the content. Please conduct your own research before taking any action based on the content.

Bitcoin (BTC) traded in a narrow corridor of roughly $75,000 to $73,000 during the New York market open on Thursday, as a rapid swing in futures positions pressured the market. Overall, the session saw a total of about $283 million liquidated across the futures complex, underscoring the fragility of short-term momentum and the pressure points embedded in ultralow liquidity pockets.
Key takeaways
- BTC moved between $75,000 and $73,000 in a three-hour window around the New York open, prompting significant futures liquidations totaling about $283 million.
- The downside cascade triggered $166 million in long liquidations, followed by a quick rebound that liquidated roughly $117 million in short positions, creating a pronounced two-sided squeeze within the same trading session.
- The market’s funding rate turned positive to about +0.0005 after the bounce, suggesting that bearish positions were unwinding rather than a fresh wave of new long exposure driving the move.
- Spot participation lagged the rebound, with the spot cumulative volume delta continuing to drift lower as BTC hovered near the $74,000 level, signaling a need for stronger spot demand to sustain gains above key levels.
- Analysts emphasize that meaningful upside beyond the $76,000 range highs will require a synchronized pickup in spot buying and derivatives activity, aligning both sides of the market.
Bitcoin’s liquidity map and the price corridor
A closer look at liquidity layers around Bitcoin’s price reveals a stubborn regional structure that traders say continues to guide intraday moves. KriptoHolder highlighted a dense supply zone between $76,000 and $78,000, where approximately $2.81 billion in short-leveraged liquidity sits. In this zone, break-even pressure can intensify, making a sustained move through that band challenging without added demand.
In contrast, around $74,000 sits what KriptoHolder characterizes as an equilibrium area, where price tends to stall and rebound if liquidity above does not clear. Below $72,000, long-leveraged liquidity of about $2.5 billion creates a potential price magnet if the upper levels fail to clear, offering a theoretical pullback buffer for bulls but also a reminder of downside risk if selling accelerates again.
These liquidity maps are not just academic; they help explain the two-sided rapid move seen on Thursday. As the price dipped to near $73,200, long positions were aggressively liquidated across venues, amplifying the downgrade risk for short-term bulls. When the market found footing, shorts covering became the dominant driver of the bounce, rather than a surge in new buying interest from the spot market.
What the price action tells traders about market participation
During the rebound, data from the measurement tools used by traders indicated that spot demand did not surge in tandem with the short-squeeze unwind. The spot cumulative volume delta (CVD), which tracks net buying and selling in the spot market, continued its downward drift as BTC clawed back toward the mid-70s. This divergence suggests that the rebound owed more to liquidity being squeezed out of shorts than to a broad-based upmove fueled by new buyers stepping in at higher levels.
For BTC to break decisively above the $76,000 ceiling, market participants expect a renewed commitment from the spot market to corroborate the upside and prevent a return of selling pressure at resistance zones. In other words, a synchronized rise in both spot demand and derivatives participation appears necessary to convert the intraday squeeze into a durable uptrend.
These dynamics echo broader market observations captured in prior coverage, where Bitcoin’s price action has frequently traded within defined liquidity pockets and moved on the basis of urgency in liquidating or covering positions rather than incremental long exposure. For context, recent reporting noted Bitcoin rebounding toward the $74.5K area as U.S. equities pressed toward fresh records, highlighting how macro-market momentum can shape crypto intraday volatility.
Trading patterns and the road ahead
Beyond the immediate price action, a pattern of intraday behavior around Thursdays has emerged among market watchers. Killa, a noted trader, pointed out that eight of the past 11 Thursdays showed more downside than upside, framing Thursday’s session as part of a recurring pattern that can present intraday opportunities even within a broader downtrend. Thursday’s near-2% decline from the daily open offered a reminder that seasonal and intraday dynamics can influence risk appetite on shorter timeframes.
Looking ahead, analysts stress that the current price region remains sensitive to liquidity shifts. The $76,000–$78,000 window remains a critical supply zone, while the $74,000 level appears to act as an equilibrium where bids and offers balance out. A meaningful move above the upper band will likely require a clear, corroborated uptick in spot buying alongside a shift in funding dynamics, signaling a commitment from both sides of the market to push through resistance levels.
Market readers should also monitor any shifts in funding rates, which can foreshadow changes in leverage and crowd sentiment. A positive flip, as seen in the latest session, often accompanies short-covering behavior and can precede renewed price momentum if spot demand follows suit.
For continued context and alternative viewpoints, market commentary from across crypto outlets has underscored similar themes—namely, that persistent demand lags in certain regimes and liquidity-driven moves can dominate short-term price action even when the longer-term trend remains uncertain.
Related coverage noted Bitcoin’s rebound near the $74.5K area as equities climbed, illustrating how cross-asset dynamics can shape crypto volatility in real time. Investors should weigh this context against their risk tolerance and horizon, especially given the ongoing tension between liquidity pockets and price discovery in a market still adapting to evolving macro conditions.
As the week progresses, traders will be watching whether spot volumes pick up in parallel with ongoing derivatives activity. A synchronized bid across both markets would be a more durable signal of renewed appetite to push Bitcoin toward the next major milestone, while persistent divergence could leave the price oscillating within the current band until new catalysts emerge.


Gate is rolling an F1 Red Bull parade and “Racing the Future” exhibition through Hong Kong as part of its 13th‑anniversary push to fuse crypto branding with motorsport.
Summary
- Gate is staging an F1 Red Bull Racing parade around Victoria Harbour as part of a Hong Kong activation with the team.
- From April 18–24, the partners will host a “Racing the Future” exhibition at K11 MUSEA, showcasing the new 2026 Red Bull car, gear and interactive zones.
- A Blue Carpet ceremony and “Gate 13” anniversary gala at the Rosewood Hong Kong on April 20 will gather more than 300 industry guests and partners.
Gate is leaning on Formula 1 star power to anchor its 13th‑anniversary celebrations, rolling a branded Red Bull Racing parade car through Hong Kong’s Victoria Harbour district and wrapping it in a week‑long exhibition and gala. The company, an official sponsor and exclusive crypto‑exchange partner of Oracle Red Bull Racing, said the showcase is designed to bring “top‑tier racing culture into urban landmark scenes” while boosting its brand with local fans and global crypto users.
According to event materials, the F1 display car will follow a designated route around Victoria Harbour, giving spectators a close‑up view of the team’s 2026 machine as it passes through high‑traffic waterfront spots. Gate described the parade as a key offline moment in its cross‑industry tie‑up with Red Bull, positioned to “attract market and public attention” at a time when exchanges are fighting for mindshare in Asia’s post‑ETF bull market.
From April 18 to 24, Gate and Red Bull will host a “Racing the Future” outdoor exhibition at the K11 MUSEA promenade, where visitors can see the new 2026 Red Bull Racing car and core equipment, including race gear tied to drivers such as Max Verstappen and junior teammate Isack Hadjar. The event will feature a 13‑year “milestone wall” recounting Gate’s history, screenings of a new brand film and interactive zones that blend “top racing engineering and the aesthetics of speed.”
Organizers say the exhibition will be free but capacity‑controlled, with pre‑registration recommended for priority entry between 10 a.m. and 10 p.m. local time. One day of the run — April 20 — will be partially closed to the public to accommodate a private activation woven into Gate’s anniversary program.luma+1
That same day, the company will host its “Gate 13 Blue Carpet Ceremony,” formally unveiling the F1 display car and spotlighting its collaboration with Oracle Red Bull Racing and other lifestyle partners. In the evening, Gate will move the action indoors to the Rosewood Hong Kong for its “GATE GALA 13” anniversary dinner, where founder and CEO Dr. Han is scheduled to appear alongside more than 300 guests from leading institutions, partners and KOLs.
Gate’s Red Bull tie‑up dates back to a 2025 multi‑year sponsorship agreement that put its logo on the team’s cars, driver suits and pit equipment, replacing a prior $150 million deal with Bybit. The crypto exchange has since leaned heavily on the partnership in its marketing, echoing a wider trend of trading venues using elite sports sponsorships — from F1 to football — to rebuild trust and visibility after the last cycle’s blow‑ups.f1grandprix.
In previous crypto.news coverage, reporters have charted how exchanges from Binance to OKX and regional players have chased brand awareness through sports deals and experiential events, particularly in markets like Hong Kong that are racing to position themselves as regulated hubs for digital assets. Similar stories have highlighted how those efforts often converge around flagship weeks such as Paris Blockchain Week or Hong Kong’s FinTech Week, blending industry conferences with public‑facing stunts meant to pull crypto deeper into mainstream culture.
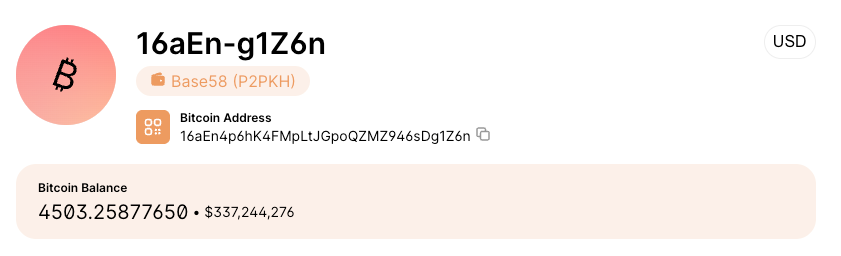
Crypto exchange Zonda said a cold wallet holding around 4,500 Bitcoin is currently inaccessible as the platform faces concerns over delayed withdrawals.
Zonda CEO Przemysław Kral posted a video statement on Thursday disclosing the exchange’s wallet address, saying the private keys to the wallet were never handed over.
In the statement, Kral denied accusations of misappropriating funds, saying the private keys were intended to be handed over by Zonda founder and former CEO Sylwester Suszek, who has been missing since 2022.
“So for all those who claim that I had anything to do with Sylwester’s disappearance, this is the prime argument that I care the most about Sylwester being found,” Kral said.
The disclosure follows weeks of controversy around the exchange after local reports suggested a probe into Zonda by Polish authorities, followed by an analysis by blockchain platform Recoveris, which alleged Zonda could have been insolvent based on a sharp drop in the exchange’s hot wallet balances.
Last recorded transaction dates to November 2025
Kral’s public disclosure of the wallet marks the first time that Zonda has disclosed the address amid the controversy.
The address cited by the CEO holds 4,503 Bitcoin (BTC) currently worth about $334 million, with the last transaction recorded in November 2025 as of the time of publication.

The CEO previously denied insolvency claims following the hot wallet investigation by Recoveris on April 6, insisting that Zonda remained fully solvent with more than 4,500 BTC in holdings.
CEO plans legal action, says Zonda will meet customer obligations
In the video, Kral said that much of Zonda’s recent withdrawal pressure was driven by an abnormal spike in withdrawal requests, which he linked to negative media coverage.
He said Zonda normally processed around 100,000 withdrawal requests per year but saw more than 25,000 requests within hours and days around April 6.
Kral said the company plans to take legal action over what he described as false claims surrounding the exchange and promised to fulfill obligations to customers amid withdrawal concerns.

Polish lawmaker Tomasz Mentzen said on X that Zonda may have lost access to its cold wallet following the disappearance of former CEO Suszek. Kral did not explicitly say the funds were lost, but said the private keys to the wallet were never transferred during the company handover.
Suszek has reportedly been missing since March 2022, with reporting referencing alleged criminal ties among certain shareholders of Zonda, formerly BitBay.
Related: French minister says new measures are coming after crypto kidnappings
The exchange was founded in Poland in 2014 and rebranded as Zonda in 2021. Kral told Cointelegraph in February that the company registered in Estonia amid regulatory uncertainty in Poland, citing delays in implementing the European Union-wide Markets in Crypto-Assets (MiCA) regulation.
The issue has drawn the exchange into a broader political debate, adding pressure on regulators and increasing scrutiny of Poland’s crypto sector.
Magazine: How crypto laws changed in 2025 — and how they’ll change in 2026

Bitcoin Eyes $90K As Whales Devour 20x Daily BTC Supply In Just 30 Days
Singer D4vd arrested on suspicion of murder after teen girl's body was found in his car

Financial Moolank Money Secrets For You! #vastu #numerology #money


-

 Politics6 days ago
US brings back mandatory military draft registration
-
 Sports6 days ago
Man United discover Nico Schlotterbeck transfer fee as defender reaches Dortmund agreement
-

 Fashion6 days ago
Weekend Open Thread: Veronica Beard
-

 Politics7 days ago
Malcolm In The Middle OG Turned Down ‘Buckets Of Money’ To Appear In Reboot
-

 Politics4 days ago
World Cup exit makes Italy enter crisis mode
-

 Business6 days ago
Tesla Model Y Tops China Auto Sales in March 2026 With 39,827 Registrations, Beating Cheaper EVs and Gas Cars
-

 Crypto World3 days ago
The SEC Conditionalises DeFi Platforms to Be Avoided for Broker Registration
-

 Crypto World3 days ago
SEC Signals Exemption for Crypto Interfaces From Broker Registration
-

 News Videos2 days ago
Secure crypto trading starts with an FIU-registered
-
 NewsBeat4 days ago
Pep Guardiola and Gary Neville agree over Arsenal title problem that benefits Man City
-

 Business5 days ago
Ireland Fuel Protests Enter Day 5 as Blockades Spark Shortages and Government Prepares Support Package
-

 Business7 days ago
OpenAI Halts Stargate UK Data Centre Project Over Energy Costs and Copyright Row
-

 Crypto World6 days ago
Federal judge blocks Arizona from bringing criminal charges against Kalshi
-

 Politics7 days ago
LBC Presenter Mocks Trump Over Iran War Failures
-

 NewsBeat3 days ago
Trump and Pope Leo: Behind their disagreement over Iran war
-

 Crypto World3 days ago
SEC Proposes Certain Crypto Interfaces Don’t Need to Register as Brokers
-
 NewsBeat5 days ago
JD Vance announces ‘no agreement’ with Iran over nuclear weapons fear
-

 Business6 days ago
IMF retains floor for precautionary balances at SDR 20 billion
-

 Business6 days ago
Former Liverpool CEO eviscerates FIFA for World Cup ticket pricing
-
Crypto World4 days ago
Sei Network Enters Quiet Reset Phase as On-Chain Metrics Signal a Slowdown in 2026
You must be logged in to post a comment Login