
Crypto World
Bitcoin Price Flashed 3 Bullish Hints in a Week and None Delivered a Breakout
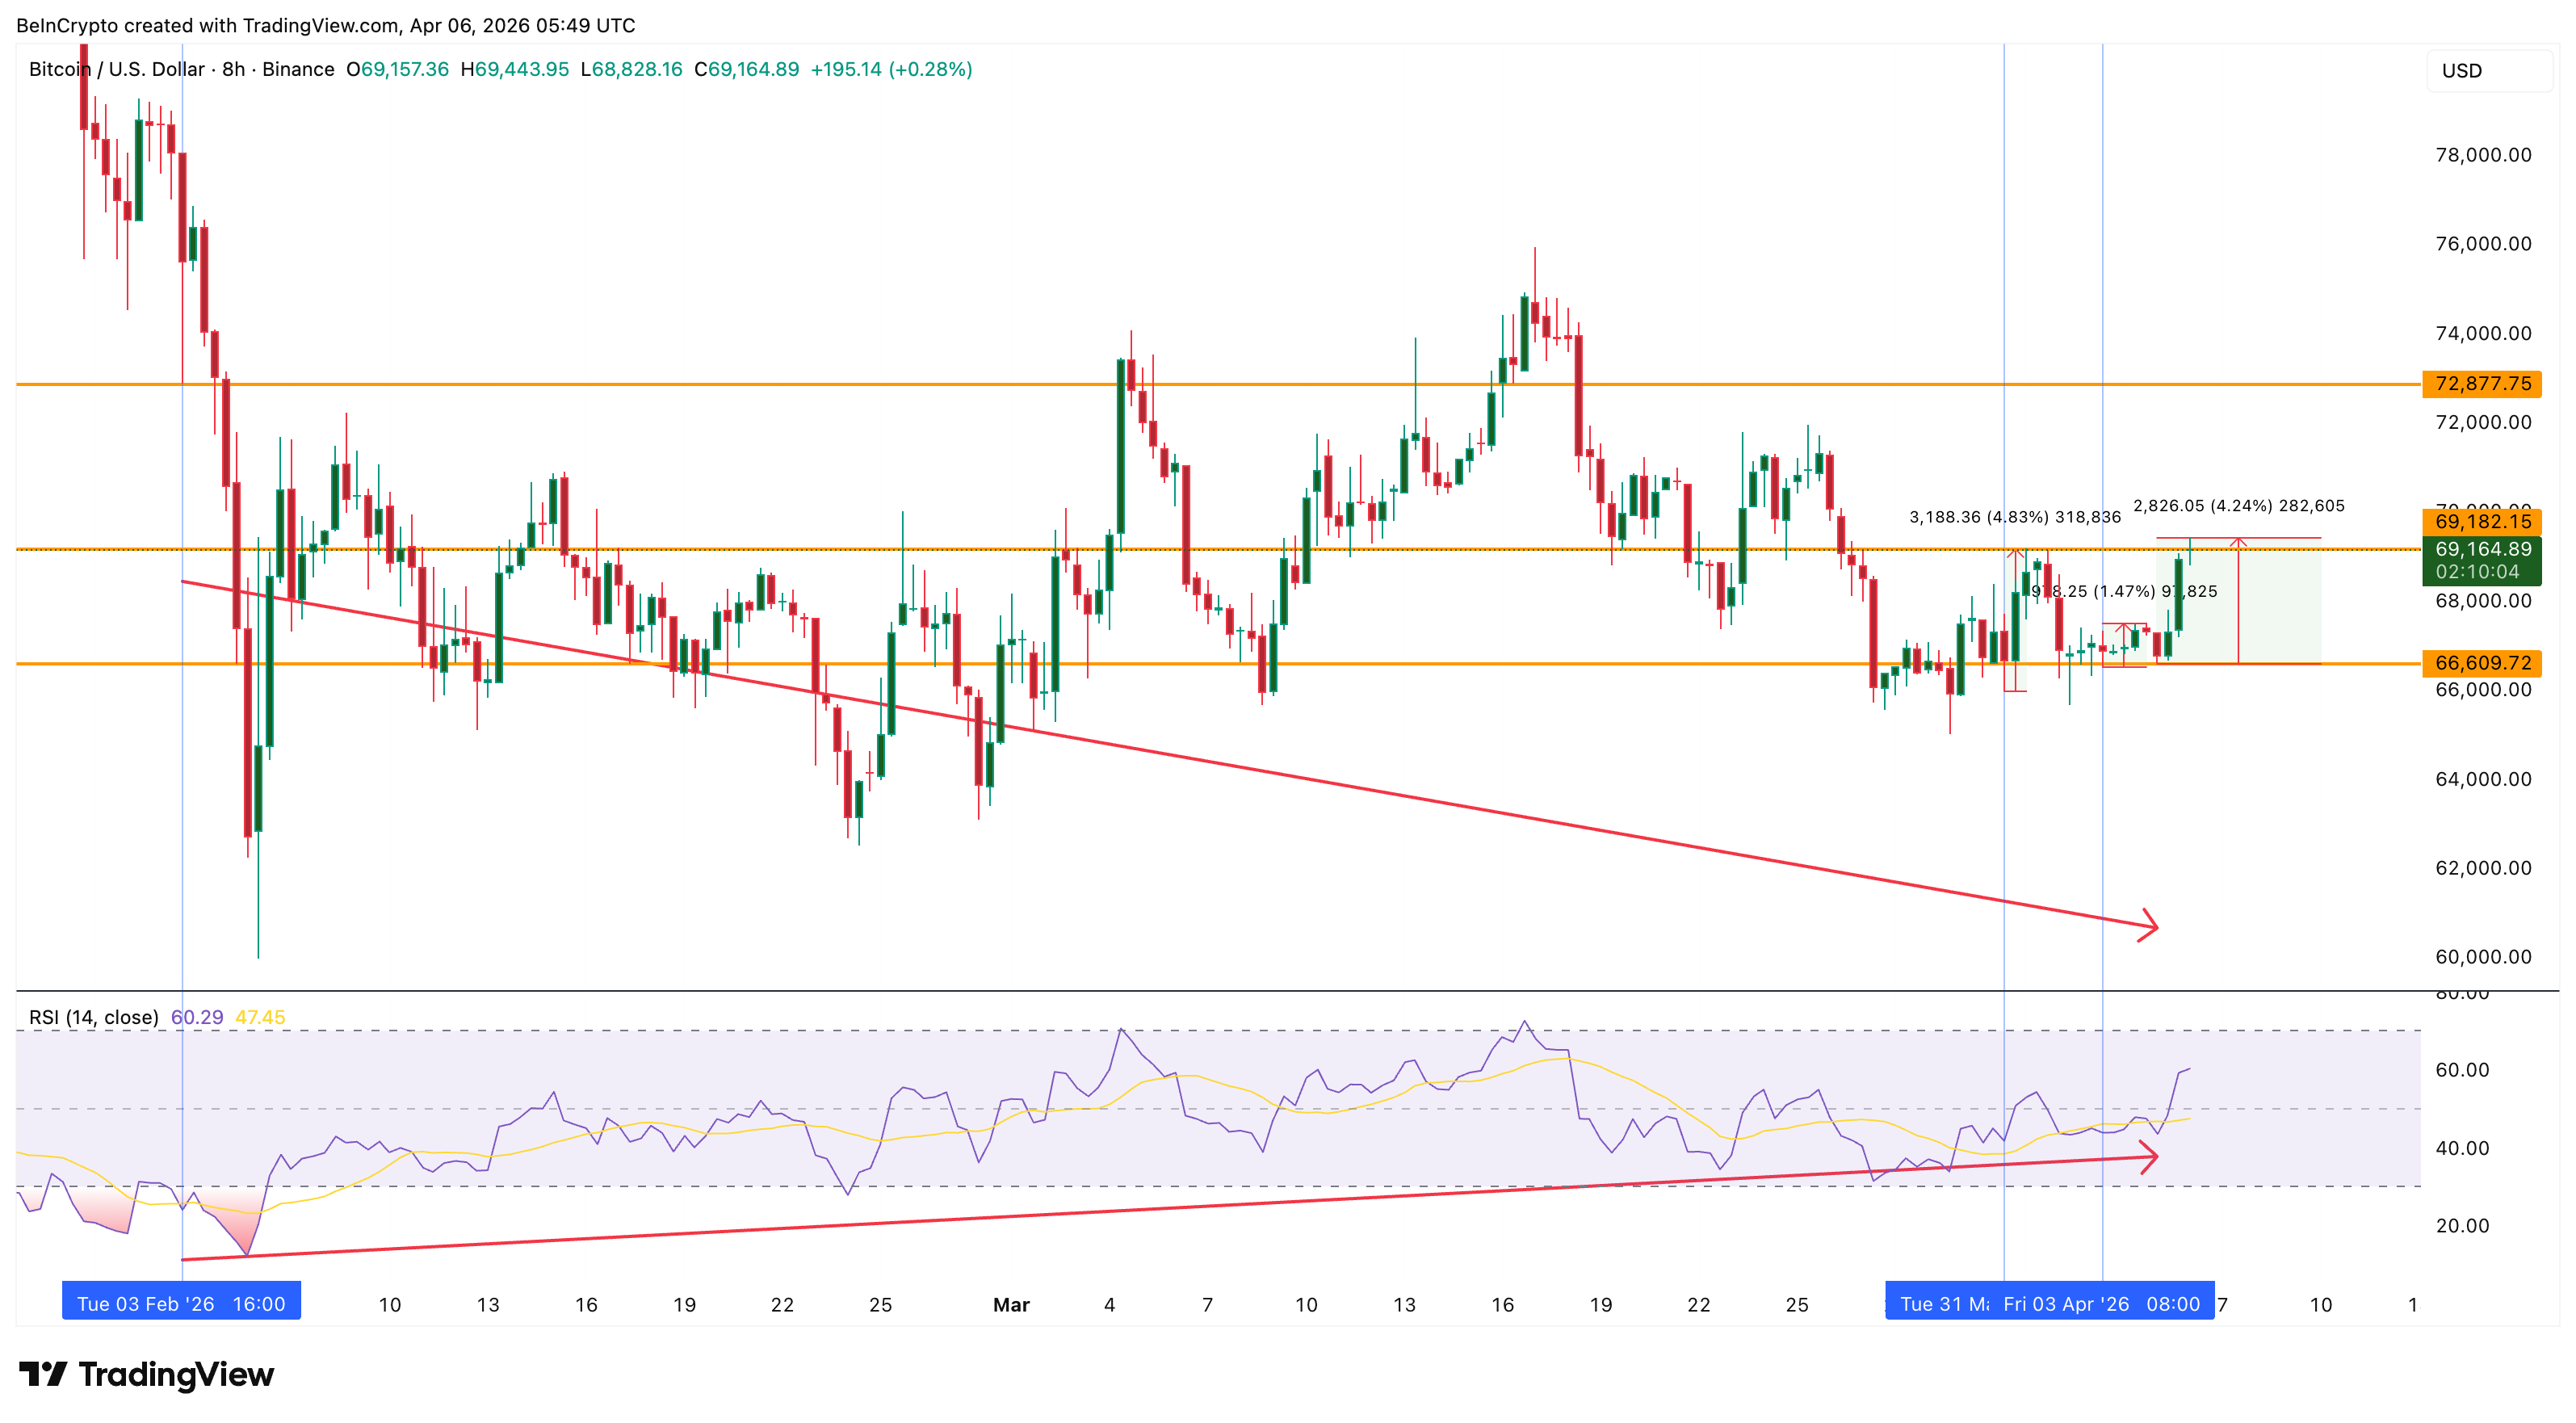
Bitcoin (BTC) price trades at $69,192 on April 6 after gaining approximately 4% from a local low on April 5. The bounce is the third in just a week to emerge from the same technical signal on the 8-hour chart.
Each time, the signal has produced a move to the upside. But each time, the rally has stalled below the same zone. The pattern raises a question that on-chain data can answer, and the answer determines whether this attempt ends differently or joins the first two as another failed breakout.
Three Cues, Same Ceiling
Bitcoin price has been forming a series of near-term standard bullish divergences on the 8-hour chart. The Relative Strength Index (RSI), a momentum oscillator that measures the speed and direction of price changes, made a higher low on each occasion while price printed a lower low. This pattern typically signals weakening selling pressure and precedes a reversal.
The first divergence completed on March 31, with the base date at February 3. Bitcoin rallied 4.83% before the move stalled. The second completed on April 3 and produced only a 1.47% bounce, the weakest of the three. The third completed on April 5 and has so far generated a 4.24% rally, pushing price back toward $69,192.
Want more token insights like this? Sign up for Editor Harsh Notariya’s Daily Crypto Newsletter here.
All three rallies share a common trait. None managed to close decisively above $69,182 on the 8-hour chart, a level where one of the previous bounces flattened. The signal keeps firing. The ceiling keeps holding.
At press time, Bitcoin price sits just above that level, testing whether the third attempt has enough momentum to break through where the first two failed. The answer lies not in the chart pattern itself but in who is buying and who is selling behind the scenes.
Two Conviction On-Chain Pillars Are Weakening
The reason the divergences have not translated into a sustained rally becomes visible in two on-chain datasets.
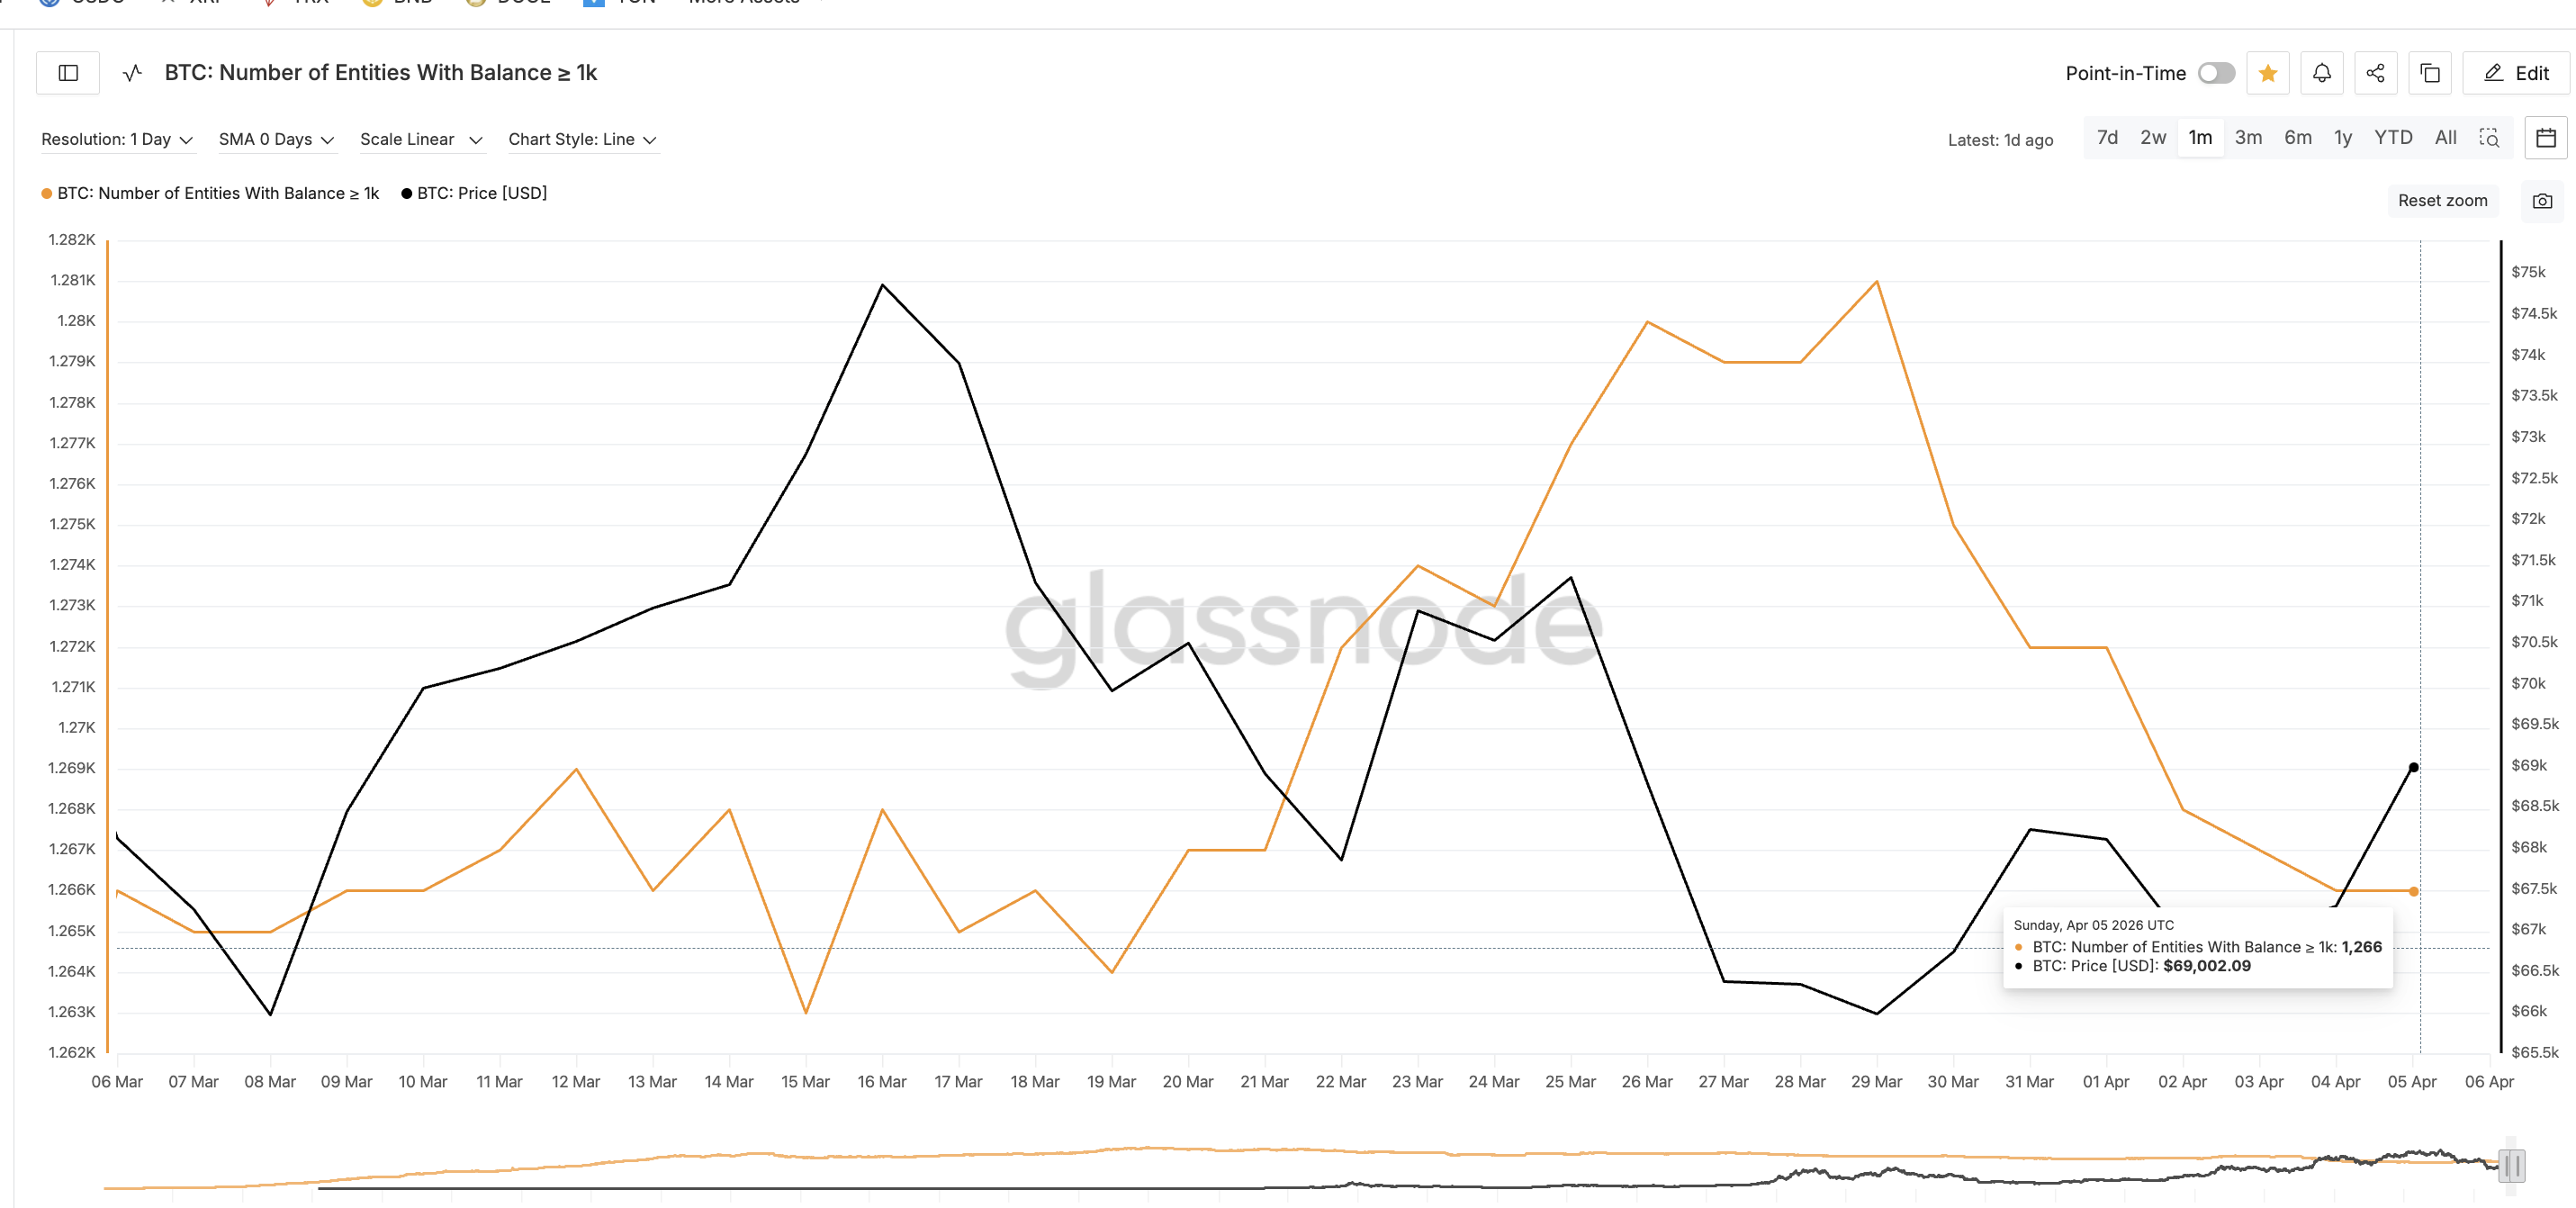
The first is whale concentration. The number of entities holding 1,000 or more BTC, a proxy for the largest holders in the market, peaked near 1,281 around mid-March. Since then, the count has declined steadily to 1,266 as of April 5. That reduction of 15 whale-tier wallets over three weeks means that the concentrated buying power which typically drives breakouts is thinning rather than building.
The decline accelerated after March 29, overlapping precisely with the window when the three divergences were forming.
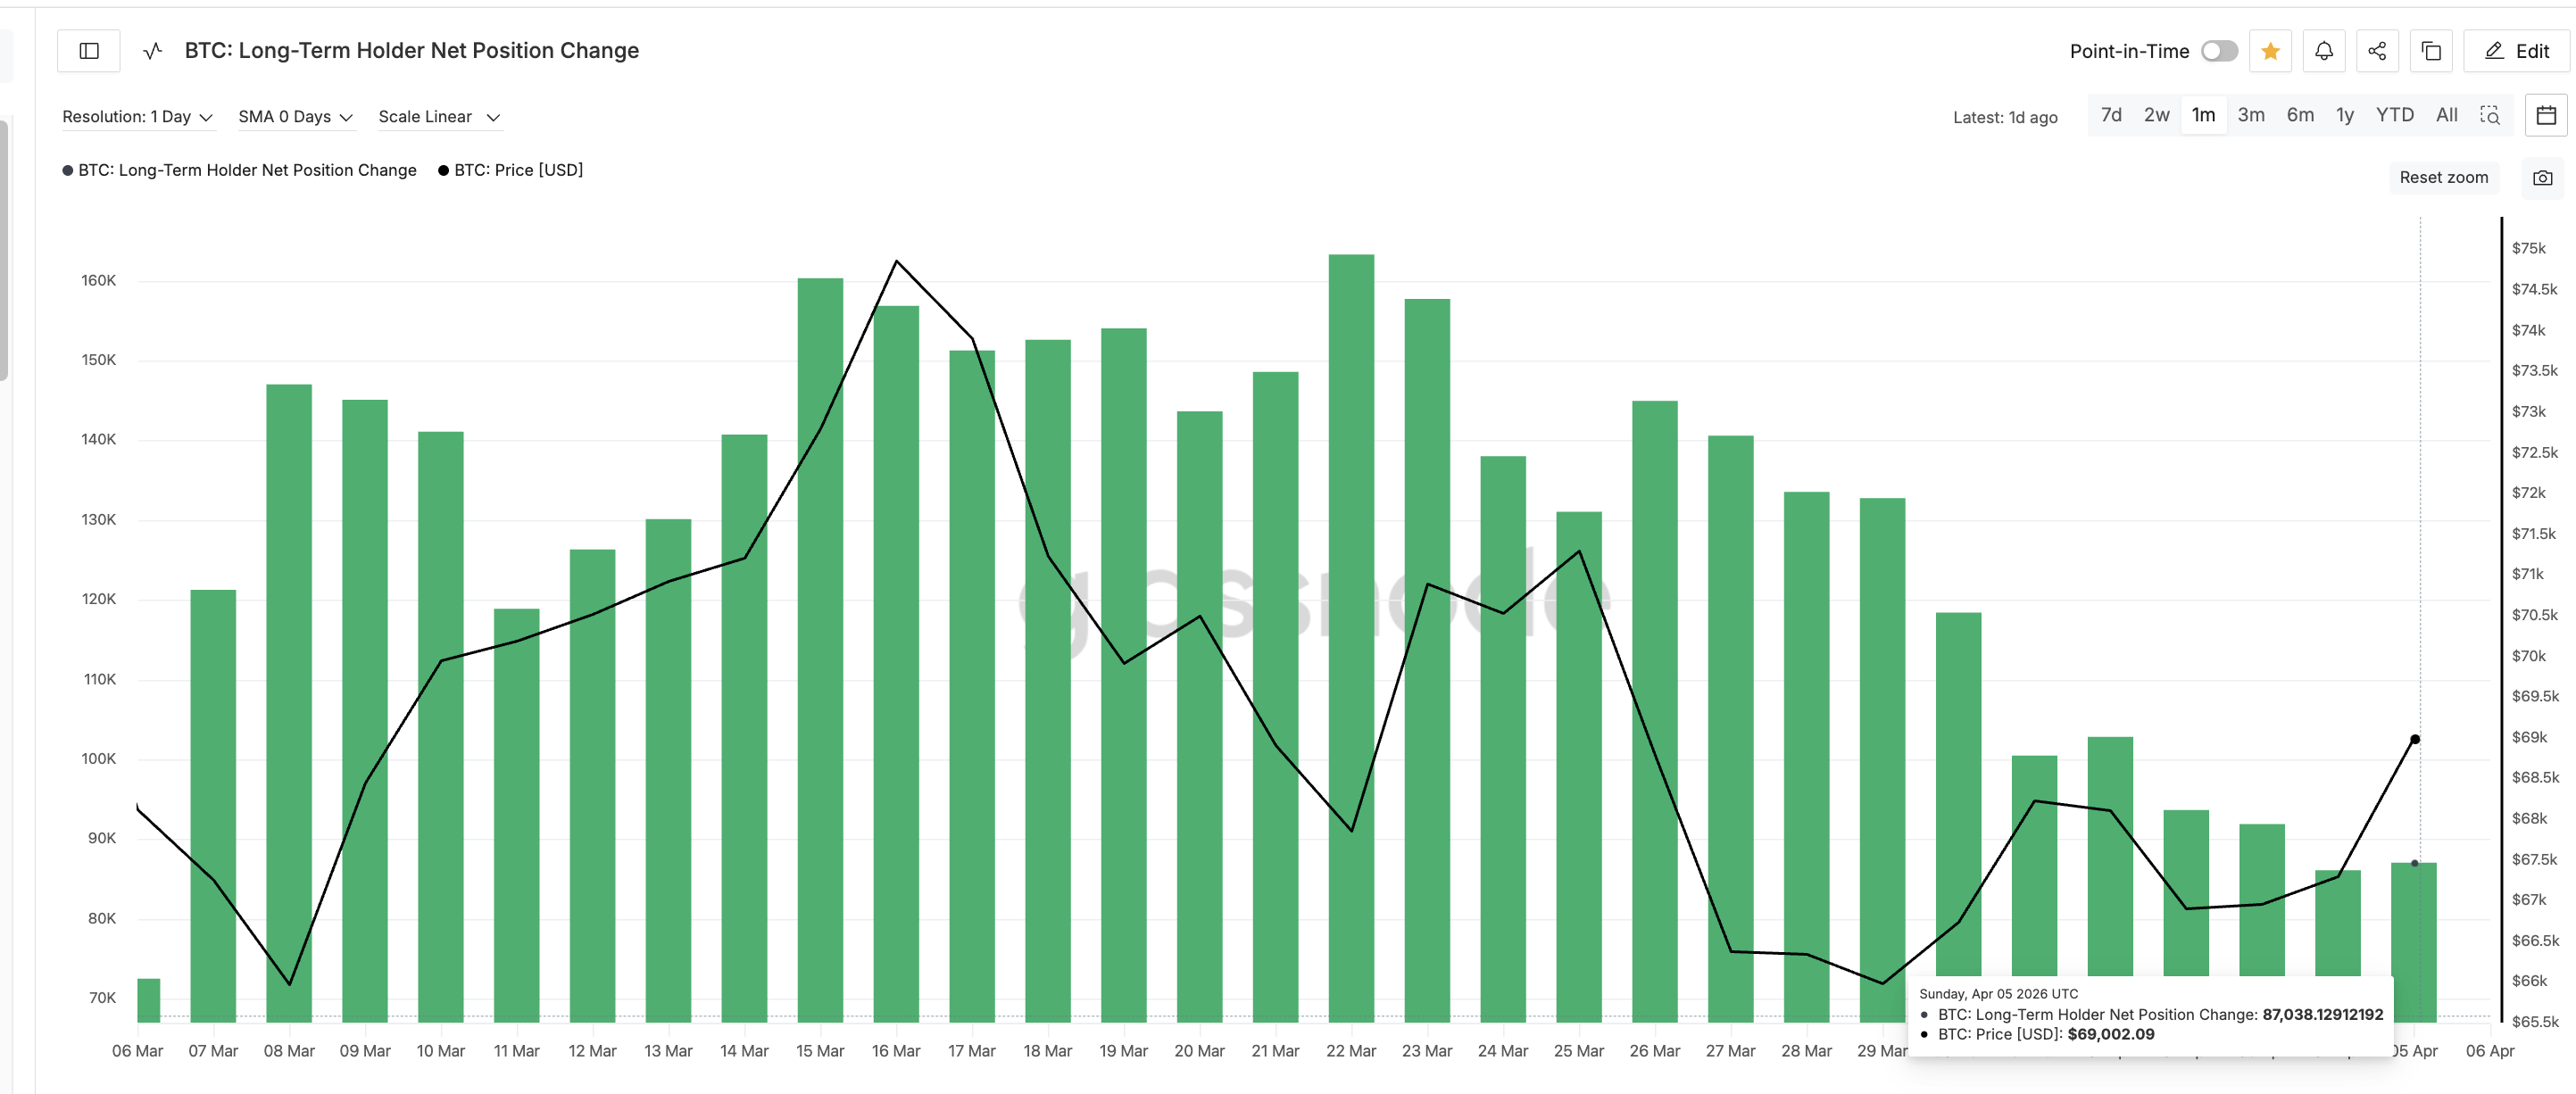
The second is long-term holder behavior. The Long-Term Holder Net Position Change, which tracks whether holders with a history of sustained positions are adding or reducing exposure, peaked at 163,262 BTC around March 22. By April 5, it had dropped to 87,038 BTC, a decline of nearly 47%. Long-term holders are not capitulating, but their conviction has weakened.
The UTXO Realized Price Distribution (URPD), which maps how much supply was last moved at each price level, reveals the structural obstacle sitting directly overhead. A 1.7% supply cluster sits at the current price range near $69,422. This means that 1.7% of all Bitcoin supply has its cost basis at or near the current level, creating a wall of potential sellers who may look to exit at breakeven.
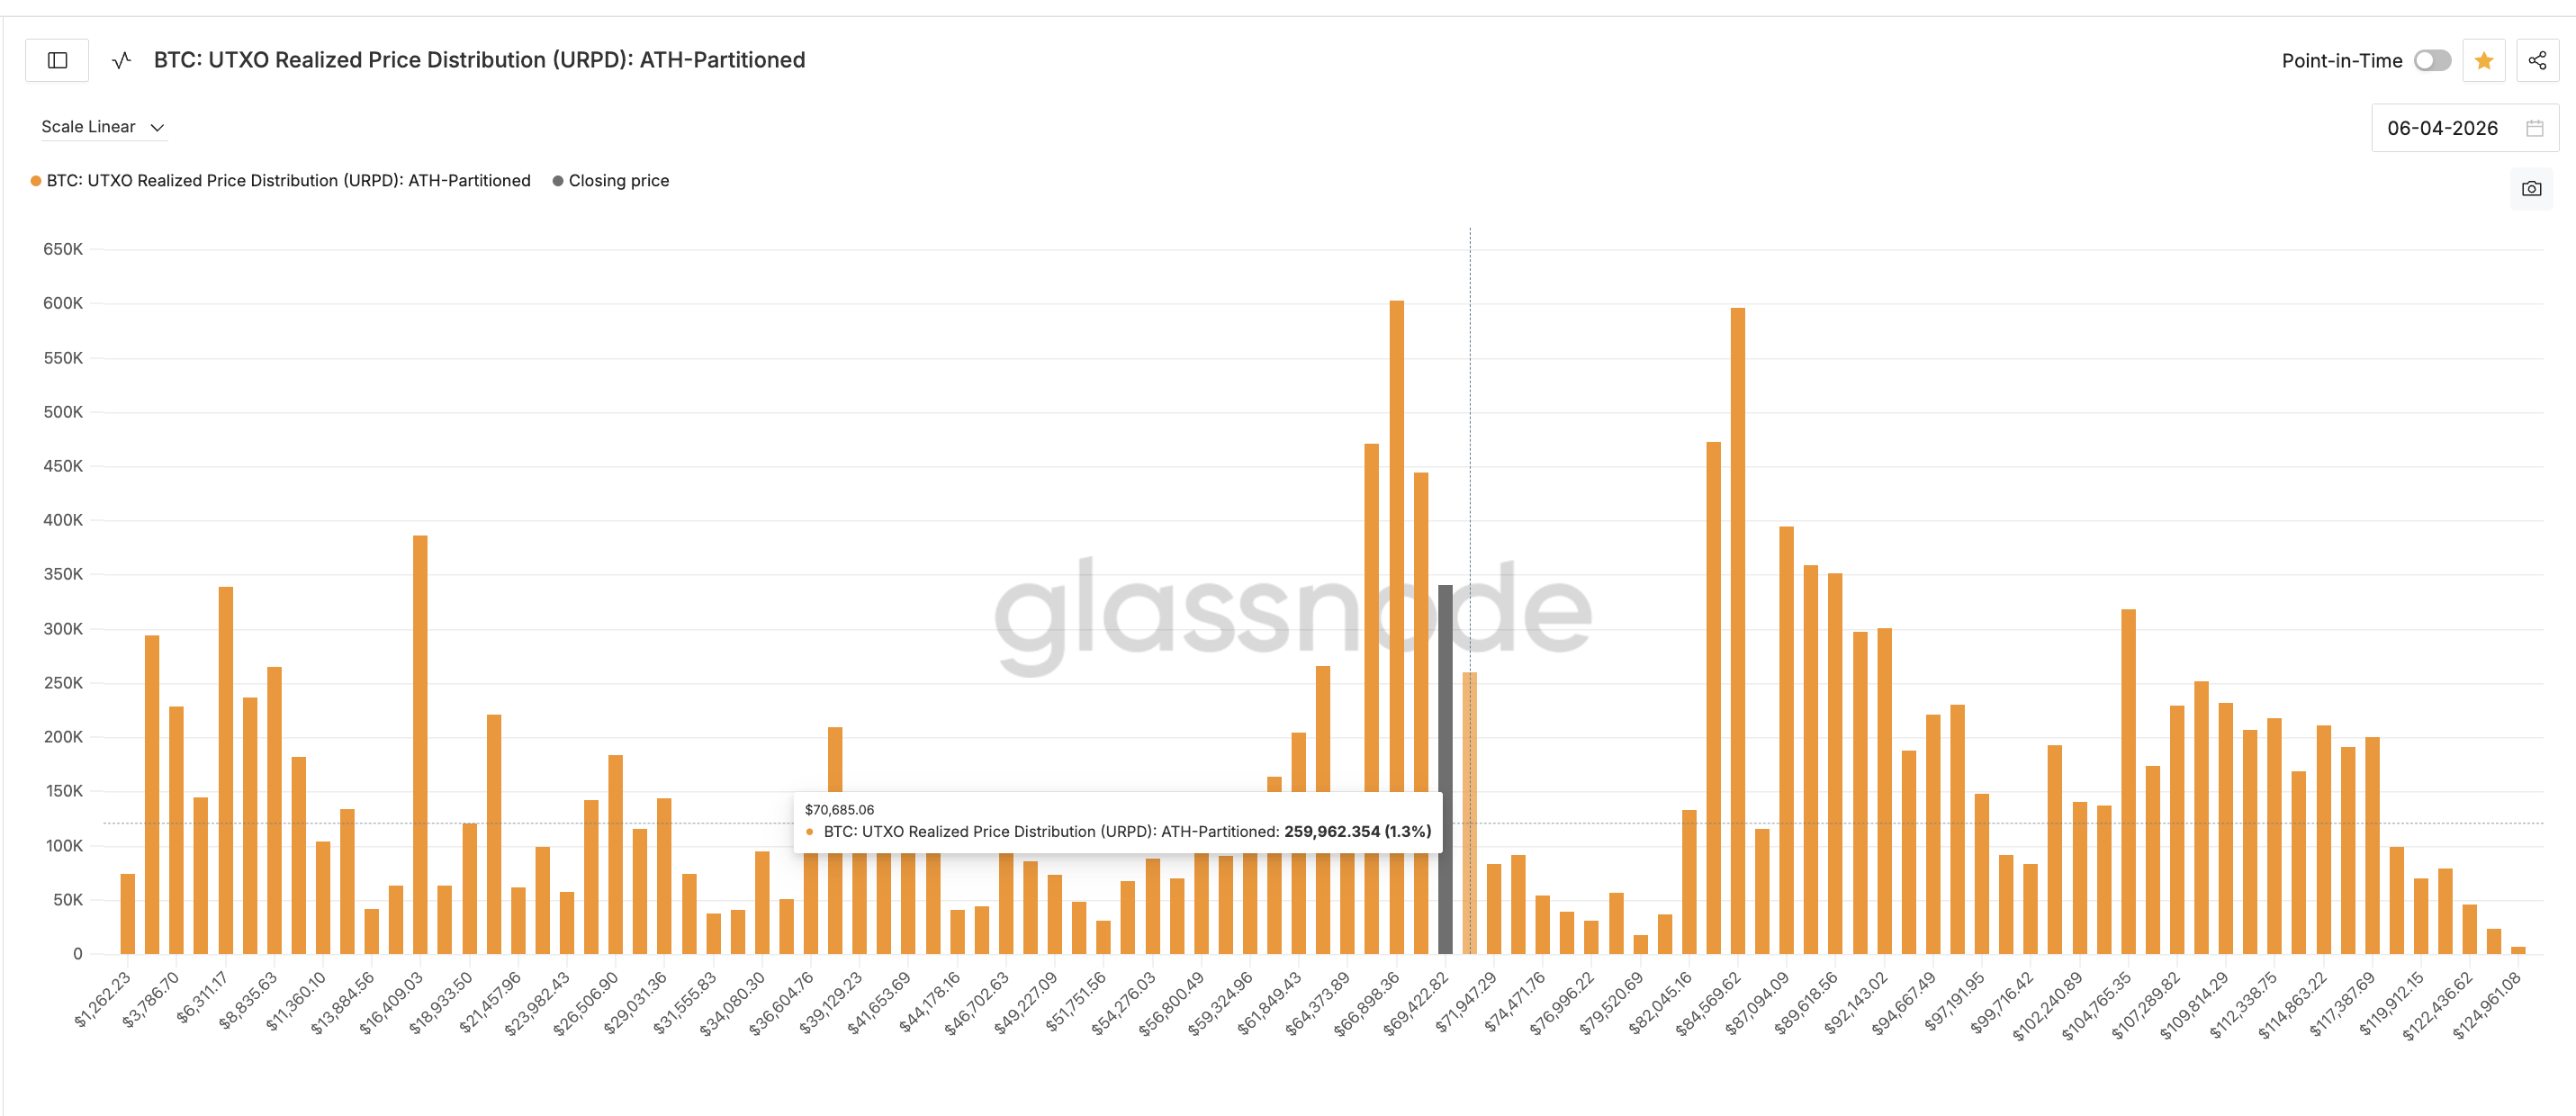
However, the cluster dynamics change quickly above that level. At $70,685, the supply concentration drops to 1.3%. Beyond that, the clusters thin significantly until around $84,000, where another dense zone appears. The difficulty is getting through the first wall without the whale and long-term holder conviction that usually support breakouts.
Bitcoin Price Levels That Separate a Breakout From Another Stall
The 8-hour chart with the completed swing between March 17 and March 25 frames every critical level for this week.
The immediate hurdle is $69,920. An 8-hour close above that level would indicate that the 1.7% supply cluster at the current range did not sell into this rally, which would be the first meaningful departure from the pattern set by the previous two divergences.
Above $69,920, the swing high at $71,956 becomes the next target, and a close above it would confirm that Bitcoin price has broken out of the range that has contained it since late-March.
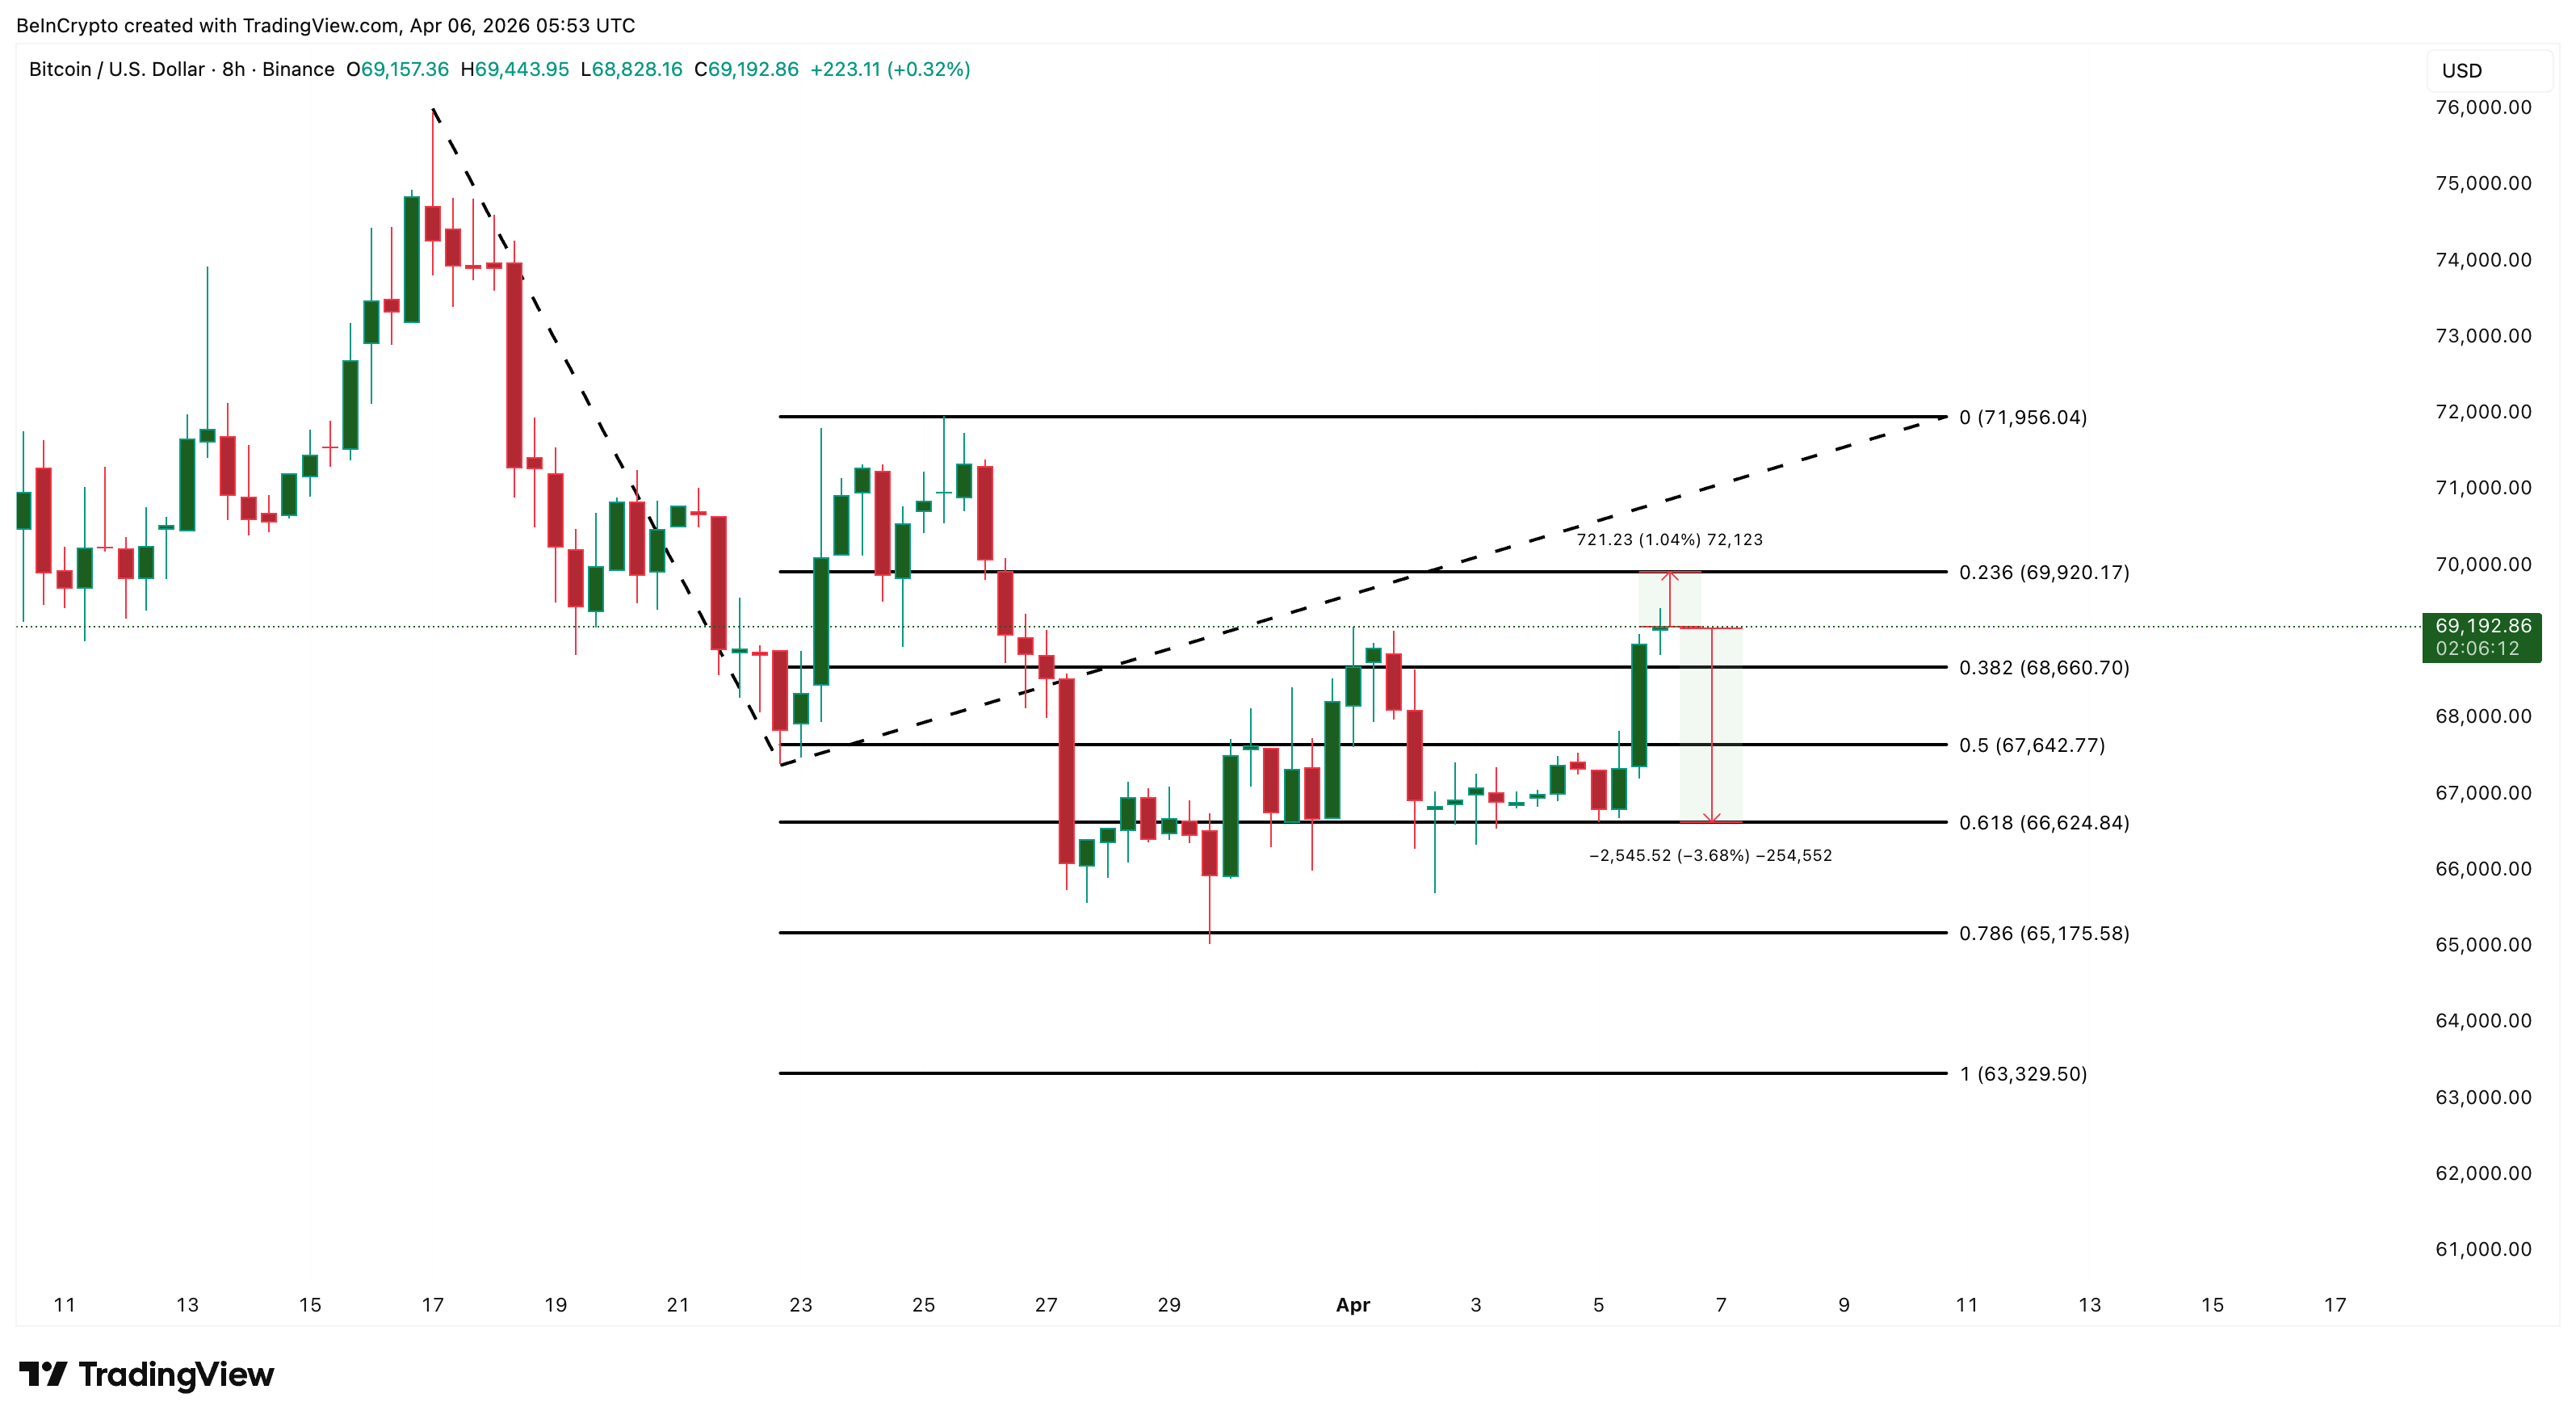
On the downside, $68,660 serves as immediate support for BTC. Below that, $66,624 has acted as a strong floor with multiple touch points since late March. If that level breaks, the structure deteriorates significantly and $63,329 becomes the next reference.
A clean 8-hour close above $69,920 would be the first sign that this divergence is different from the two that came before, while a failure to hold $66,624 would suggest the on-chain weakness has fully overtaken the technical signals and the next leg moves lower.
The post Bitcoin Price Flashed 3 Bullish Hints in a Week and None Delivered a Breakout appeared first on BeInCrypto.


Disclosure: This article does not represent investment advice. The content and materials featured on this page are for educational purposes only.
Quantum computing advances raise concerns over crypto security and volatility for major assets.
Summary
- Quantum computing advances raise concerns over crypto security and volatility, reshaping investor strategies
- AI-driven trading gains momentum as investors seek to navigate increasingly complex crypto market conditions
- ConfluxCapital promotes automated trading bots, highlighting high daily earning potential amid market volatility
Amidst continuous breakthroughs in quantum computing, the cryptocurrency market is entering a phase characterized by heightened complexity and uncertainty. Mainstream assets — exemplified by Bitcoin and Ethereum — may face a dual challenge in the future, grappling with issues of both security and volatility.
Given this trend, relying solely on manual trading has become increasingly inadequate for keeping pace with market dynamics; consequently, AI-driven automated quantitative trading is emerging as the preferred choice for a growing number of investors. Taking the ConfluxCapital fully automated quantitative trading bot as an example, its core advantages and operational steps are outlined below.
Core advantages: Why choose AI quantitative trading?
First and foremost, the most significant advantage lies in “24/7 Operation.” The system enables uninterrupted market monitoring around the clock — 24 hours a day, 7 days a week — eliminating the need for manual market surveillance and ensuring that no potential trading opportunities are missed. This is particularly critical in the cryptocurrency market, an environment that never closes.
The second advantage is “Execution Speed and Precision.” Quantitative systems can complete data analysis and execute trading decisions within milliseconds — a distinct advantage over manual trading. When the market experiences extreme volatility — such as that potentially triggered by expectations surrounding quantum computing — this difference in speed often directly determines the ultimate profit or loss outcome.
The third advantage is “Emotional Detachment.” Manual trading is often susceptible to the influence of emotions such as fear and greed; AI systems, however, operate entirely based on data and algorithms. This allows them to maintain consistent strategy execution even during extreme market conditions, thereby preventing irrational decision-making.
Furthermore, these platforms typically possess “Multi-Strategy Synergy Capabilities.” By combining various quantitative models, the system can flexibly switch between strategies to adapt to different market regimes, whether ranging, trending upward, or trending downward, thereby enhancing the stability of overall returns.
Finally, there is the “Intelligent Risk Management System.” The system automatically adjusts position sizing and risk exposure in response to market fluctuations, minimizing drawdown risk as much as possible within highly volatile environments. This feature will be particularly vital in mitigating the potential market shocks that may arise from future advancements in quantum computing.
From a practical operational standpoint, the entire participation process is relatively simple and straightforward:
Step 1: Account Registration
Visit the ConfluxCapital platform, complete the basic information registration, and set up a personal trading account.
(Sign up now and receive a $20 bonus)
Step 2: Capital Preparation
Determine an appropriate capital allocation based on personal circumstances, then deposit funds into your account to support the subsequent execution of trading strategies.
Step 3: Strategy Selection or Bot Activation
Select a quantitative strategy that aligns with risk tolerance, or directly activate a fully automated trading bot to initiate system operations.
Step 4: Automated Trade Execution
The platform will analyze real-time market data to automatically execute buy and sell orders, requiring no manual intervention.
Step 5: Profit Management and Compound Growth
Users can monitor their earnings at any time and, as needed, choose to withdraw profits or reinvest them to facilitate long-term capital growth.
Strategy Name
unit price
Days
Total Revenue
Starter Strategy
$100
2 days
$100+$6
Basic Strategy
$600
5 days
$600+$45
Advanced Strategies
$5,000
15 days
$5,000+$1,215
Elite Strategy
$25,000
25 days
$25,000+$11,250
Quantum Strategy
$90,000
20 days
$90,000+$36,000
Infinite Strategy
$200,000
25 days
$200,000+$110,000
A critical juncture: Why act early?
We are currently at an extremely critical stage: while quantum computing has not yet fully disrupted cryptographic systems, the pace of its development is already accelerating rapidly. This implies that there is still room to capitalize on market opportunities — though this window of opportunity is gradually narrowing.
By leveraging ConfluxCapital’s fully automated, free trading bot, users can capitalize on current market volatility to unlock a potential daily earning capacity of up to $5,000. Compared to the potentially more complex and volatile market environments that may lie ahead, now could be the most advantageous time to get involved.
Conclusion
When technological change arrives, the market never waits for the hesitant.
Against the backdrop of the continuous advancement of quantum computing, the landscape of cryptocurrency investment is undergoing a profound transformation.
For more information, visit the official website or download the application.
Email: [email protected]
Disclosure: This content is provided by a third party. Neither crypto.news nor the author of this article endorses any product mentioned on this page. Users should conduct their own research before taking any action related to the company.

Key Takeaways
- The number of Chainlink whale wallets holding more than 1 million LINK has increased by 25% year over year.
- Tighter LINK supply from institutional involvement is pushing prices higher.
- LINK is trading within a range but may be ready to break out to $27.
Accumulation of Whales Points to Building Confidence
The whales have shown strong activity around Chainlink’s coin in the last year, indicating growing confidence in this asset.
According to statistics, the number of addresses holding at least one million LINK has risen from 100 in April 2025 to 125 in April 2026, a 25% increase.
Although whales have been accumulating LINK tokens, prices have not responded positively.
However, accumulation by whales is generally a positive long-term outlook as opposed to short-term speculation and price increases.
Institutional Adoption Narrows Supply-Demand Dynamics
Other than whale actions, institutional adoption has become key in dictating Chainlink’s future prospects. The Chainlink Reserve fund has increased consistently by over 137,000 LINK tokens worth about $1.17 million. The total amount held in the reserve fund stands at over 2.93 million LINK tokens, thus decreasing the amount of LINK in circulation.
Moreover, Chainlink’s platform infrastructure keeps gaining traction among enterprises. Applications using Chainlink’s oracle technology are providing fee revenues, thus boosting the ecosystem’s operations. Specifically, token distribution and stablecoin distribution applications are providing enhanced liquidity and higher demand for LINK tokens.
The development of data-based platforms has led to more growth. More transactions have been seen in data feeds and oracle networks, leading to billions of dollars worth of trading volumes with thousands of active users.
Imminent Breakout Hints at Price Consolidation Point
Technically speaking, LINK has been consolidating around $8-$9.40 during the last few weeks after early February.
The period of consolidation means uncertainty in the market when neither bulls nor bears fully control the situation.
Nonetheless, the creation of a slanting resistance trend line means that the price might soon break out. Currently, the MACD is mildly bearish but the declining red histogram hints that selling strength is fading away.
In general, past history has shown that similar consolidation points have usually been followed by a breakout towards new highs in LINK’s price action. Prior times in which the asset experienced such a consolidation phase ended up in substantial rallies once the resistance was breached.
A potential breakout from the slanting resistance trend line will probably increase the bullish activity as well as the ongoing accumulation among whales.
Will LINK Return to $27?
The $27 level is a crucial resistance point for Chainlink. Although the price currently stands well below this level, it should be noted that there is nothing theoretically stopping LINK from reaching these heights.
Breaking out of the current consolidation pattern with the help of continued accumulation by whales and institutions would trigger the beginning of an uptrend. Nevertheless, traders must keep in mind other elements, including the state of the cryptocurrency market and the economy as a whole.
Chainlink is currently at an important crossroads, with whales accumulating and institutions adopting the project, but its price failing to rise correspondingly. It is clear that the limited supply and expanding network serve as a great starting point.
Although LINK appears to be in a range-bound situation, it should not be forgotten that technical analysis points toward an eventual breakout. If the momentum rises, achieving new price levels—including $27—becomes a possibility.

Solana (SOL) is trading just above $82 at the time of writing on Monday, marking its fourth consecutive day of recovery. While funding rates for SOL futures have climbed, a simultaneous drop in Open Interest suggests sentiment remains divided. From a technical perspective, the 50-day Exponential Moving Average (EMA) at $88.80 stands out as the key resistance level to watch.
Derivatives signal optimism, but participation declines
Market data points to rising bullish positioning among traders, even as overall participation in SOL futures contracts declines. According to CoinGlass, the OI-weighted funding rate has increased to 0.0067% from 0.0042% on Sunday, indicating that long-position traders are willing to pay a premium—typically a sign of growing confidence in further upside.
However, this optimism is not fully supported by market activity. Open Interest in SOL futures has dropped to $4.97 billion from $5.07 billion on Friday, signaling a reduction in total capital committed to the market. This divergence—rising funding rates alongside falling Open Interest—highlights a mixed sentiment, where bullish bias exists but conviction appears limited.
Institutional demand remains soft
On the institutional side, demand for Solana continues to show weakness. Data from Sosovalue reveals that SOL-focused exchange-traded funds (ETFs) recorded net weekly outflows of $5.24 million, marking a second straight week of withdrawals. If this trend persists, it could represent the longest streak of weekly outflows so far, potentially adding downward pressure to SOL’s spot price in the near term.
Will Solana extend its recovery to $93?
The SOL/USD 4-hour chart is bullish and inefficient, with the coin up by nearly 4% in the last 24 hours. At press time, SOL is trading at $82.50 per coin.
The near-term bias is mixed as SOL holds well below the 50-day and 100-day Exponential Moving Averages, keeping a broader corrective structure.
The momentum indicators have also switched bullish, with further gains in the near term. The Moving Average Convergence Divergence (MACD) line remains above its signal line, signaling persistent buying pressure.
The Relative Strength Index (RSI) at 60 is above the neutral 50, signaling a growing bullish momentum.
If the rally persists, Cardano would meet an immediate resistance at the 50-day EMA near $88.81, which caps rebounds and guards a stronger move toward $98.02, close to the 100-day EMA at $102.18.

However, if the sellers regain control, the support zone between $75.63 and $77.60 could serve as a bounce-back spot. An extended selling pressure would bring into focus the February 6 low at $67.50.

China’s tax and financial regulators on Monday urged banks and local authorities to use blockchain and privacy computing to upgrade the “bank-tax interaction” model and expand financing for small businesses.
The State Administration of Taxation and National Financial Regulatory Administration said in a joint policy notice that banks and taxpayers should standardize data sharing and reduce information asymmetry between tax authorities, banks and enterprises.
The report also urged banks to improve credit models, enhance credit approval efficiency and increase the supply of financing services to “honest, tax-paying enterprises.”
The directive aligns with China’s broader effort to integrate blockchain into data infrastructure, following a National Development and Reform Commission roadmap released in January 2025 targeting nationwide implementation by 2029.
Shen Zhulin, the deputy director of the National Data Administration, said in a January 2025 press conference that China expects blockchain-based data infrastructure to attract 400 billion yuan (about $58 billion) in yearly investments.

Chinese regulators outline data infrastructure push with 400 billion yuan target
While China has issued strict controls on cryptocurrencies and speculative digital asset trading, it also pushed for the incorporation of blockchain initiatives in finance and data infrastructure.
In October 2019, Chinese President Xi Jinping highlighted the technology as an important “breakthrough” for independent innovation of core technologies, urging the acceleration of the development of blockchain-based applications and their integration in the real-world economy.
Related: Trump: US has to ‘make it so that China doesn’t get the hold‘ of crypto
In April 2021, the Shenzhen Tax Bureau expanded the country’s first blockchain electronic invoice system.
However, in September that same year, China issued a nation-wide ban on crypto transactions and mining as part of a wider crackdown across multiple government agencies.

Despite the ban, China is still cited as the third-largest Bitcoin (BTC) mining country. In January 2026, it accounted for 11.7% of the global hashrate, according to data from Compass Mining.
Magazine: China’s ‘50x’ blockchain boost, Alibaba-linked AI mines Bitcoin: Asia Express
Crypto World
Bitcoin (BTC) price rallies on Iran ceasefire talks, Algorand (ALGO) extends gains: Crypto Markets Today


Bitcoin climbed to near $70,000 as traders reacted to signs of possible de-escalation in the Iran war and amid a short squeeze that liquidated more than $270 million in shorts.
Crypto prices rose, along with equity index futures and equities, as Axios reported that the U.S. and Iran are discussing a potential 45-day ceasefire. The report raised hopes that hostilities could ease, potentially lowering the risks for ships sailing through the Strait of Hormuz.
That is improving appetite for risk assets across markets, and the U.S. Dollar Index (DXY) fell. The retreat is being amplified as reports suggest Pakistan is brokering what’s being called the “Islamabad Accord.”
Under the deal, a ceasefire would take effect immediately and the Strait of Hormuz would be reopened. Nevertheless, markets still need convincing.
On Polymarket, the odds of a ceasefire this month are at around 30%, up from 18% before the Islamabad Accord came to light. Oil prices remain elevated, and the Federal Reserve is still widely expected to keep interest rates unchanged.
If a ceasefire materializes and the conflict winds down, a relief rally could further benefit risk assets. For now, though, traders appear to be treating the headlines with skepticism.
Derivatives Positioning
- Notional open interest (OI) in bitcoin and ether (ETH) has risen by 7% and 11%, respectively, outpacing spot price gains. This suggests fresh capital inflows into the market, likely chasing bullish exposure, as both funding rates and cumulative volume deltas for BTC and ETH remain positive.
- Among altcoins, ADA, AVAX and LINK stand out with double-digit increases in open interest alongside positive funding rates. In contrast, sentiment appears bearish for BCH and HYPE, which are sporting negative funding rates.
- Bitcoin’s volatility meltdown continues, signaling market calm and supporting bullish price action. The 30-day implied volatility index, BVIV, has dropped below 50% for the first time since early February. Ether’s index, EVIV, also fell to the lowest level in weeks.
- On Deribit, bitcoin’s $60,000 put and the $80,000 call are the most popular options bets, each boasting a notional open interest of $1.40 billion at press time. These, therefore, are key levels to watch, as they represent areas where traders are heavily positioned for either downside protection or upside participation.
- Volatility, therefore, could pick up sharply if prices move outside of the $60,000-$80,000 range.
- Broadly speaking, the mood in options market remains cautious despite bullish hints in futures. BTC and ETH puts remain pricier than calls, a sign of sticky demand for downside hedging. Some of the bias for puts also stems from persistent overwriting of calls, a yield-generating strategy.
Token Talk
- Algorand’s ALGO token has surged nearly 50% in the past 30 days after a Google Quantum AI research paper highlighted its approach to quantum-resistant security.
- The Google report examined how blockchains can defend against future threats from quantum computers, which might be able to break current encryption methods. Algorand drew notable attention for its use of FALCON, a post-quantum signature scheme selected by U.S. standards body NIST.
- The network already uses the system for features like state proofs, which confirm ledger updates, and for certain transaction types.
- ALGO rose from about $0.08 to near $0.12 so far, bringing its market capitalization past $1 billion. It’s up more than 7.3% in the last 24 hours amid a wider market rally.
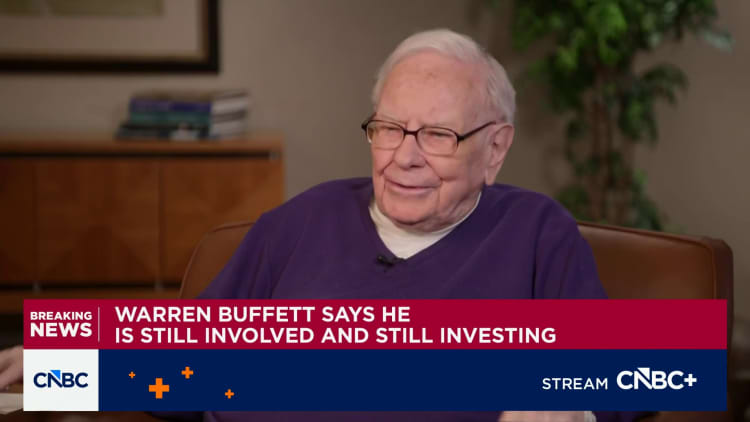

Warren Buffett said Tuesday he remains closely involved in investment decisions at Berkshire Hathaway even after stepping down as chief executive, adding that he recently made a “tiny” new purchase.
The 95-year-old investor, in an interview with Becky Quick on “Squawk Box,” said he still comes into the office daily and stays engaged with markets, working alongside colleagues on trades. Buffett described a routine that includes calling Mark Millard, Berkshire’s director of financial assets, before the opening bell to discuss market developments.
Millard, whose office sits about 20 feet away, executes trades based on those conversations, Buffett said, underscoring that he remains hands-on despite handing over the CEO role to Greg Abel in the beginning of 2026.
“I won’t make any [investments] that Greg thinks are wrong. … Greg gets the sheet every day,” Buffett said, referring to the firm’s regular investment updates. Asked whether he has made any new investments, he replied that he recently made “one tiny purchase,” without elaborating.
Buffett also downplayed recent market volatility, suggesting current conditions fall far short of past periods that created major buying opportunities.
“Three times since I took over, for sure it’s gone down more than 50%. … This is nothing to make you get excited,” Buffett said.
The “Oracle of Omaha” also revealed that Berkshire purchased $17 billion worth of Treasury bills this week at the weekly auction. Berkshire reported more than $370 billion in cash equivalents on the books at year-end, largely held in Treasury bills.
Read more from CNBC’s interview with Warren Buffett


Disclosure: This article does not represent investment advice. The content and materials featured on this page are for educational purposes only.
AI crypto trading apps is gaining popularity in 2026 as beginners seek automated ways to earn passive income.
Summary
- AI crypto trading apps surge in 2026, offering beginners automated strategies and passive income opportunities
- MoneyFlare leads AI trading platforms with no-code automation and 24/7 algorithm-driven crypto execution
- Rising demand for passive crypto income drives adoption of AI tools using real-time data and smart trading strategies
As the cryptocurrency market continues to evolve, many beginners are turning to AI crypto trading apps to automate their trading processes and earn passive income without the need for coding skills.
In 2026, AI trading technology has become more advanced, allowing investors to use smart algorithms and real-time data to make profitable trades. These tools are particularly appealing to newcomers who want to earn money without the complexities of manual trading.
In this article, we will explore the 7 best AI crypto trading apps for 2026, with MoneyFlare taking the top spot, helping anyone get started with automated trading and passive income.
1. MoneyFlare — Best AI Crypto Trading App for Beginners
Why Choose MoneyFlare?
MoneyFlare stands out as one of the leading AI-powered crypto trading platforms for beginners in 2026. Its key strength lies in its fully automated trading system. No coding experience is needed. Simply choose a strategy, and the AI executes trades on a user’s behalf 24/7, optimizing their potential profits.
Key Advantages of MoneyFlare:
- One-Click Activation: Get started quickly without any technical setup.
- Precision Algorithms: The AI uses advanced algorithms to analyze market trends in real time and adjust trading strategies for optimal performance.
- Low-Risk Settings: MoneyFlare provides tools to manage and reduce risk while maximizing profits.
- 24/7 Trading: The AI runs continuously, trading even when the user is not actively monitoring the market.
- User-Friendly Interface: The platform’s intuitive design makes it perfect for beginners who are just starting their trading journey.
How MoneyFlare works: A Step-by-Step Guide for Beginners
- Sign Up and Create an Account: New users who register will receive a free $10 real reward and a $50 trial credit!
- Deposit Funds: Choose a preferred method and fund an account to start trading.
- Select a Trading Strategy: Choose from a variety of automated strategies designed for beginners.
- Start Automated Trading: With just one click, activate the AI system, and let it handle all trades.
2. Cryptohopper — Best for Automated Portfolio Management
Why Choose Cryptohopper?
Cryptohopper offers an ideal solution for users who wish to manage multiple exchanges and portfolios with minimal effort. It combines technical analysis tools and automated strategies to help users optimize their crypto investments.
Key Advantages of Cryptohopper:
- Multi-Exchange Compatibility: Supports several major exchanges, allowing users to manage trades across multiple platforms.
- Signal Marketplace: Provides trading signals from the market, enabling users to make informed decisions.
- Pre-Built Strategy Templates: Helps beginners implement various strategies with minimal setup.
3. 3Commas — Best for experienced beginners
Why Choose 3Commas?
3Commas is ideal for beginners who are ready to move beyond basic trading and explore more complex strategies. It offers smart trading bots and provides a platform for both automated and manual strategy adjustments based on real-time market conditions.
Key Advantages of 3Commas:
- Smart Bots: Automatically adjust strategies based on real-time market fluctuations.
- Risk Management Tools: Built-in tools like stop-loss and take-profit features to limit risk.
- Social Trading Feature: Allows users to follow and copy the strategies of successful traders.
4. Pionex — Best for beginners who want to start with no fees
Why Choose Pionex?
Pionex is a no-fee platform that is perfect for beginners looking to reduce trading costs. The platform offers multiple automated trading bots to execute trades on a user’s behalf.
Key Advantages of Pionex:
- Zero Trading Fees: No extra charges on transactions, making it an affordable platform for beginners.
- Variety of Bots: A wide selection of automated bots to cater to different trading styles.
- Simple to Use: The user interface is clean and easy to navigate, making it perfect for new traders.
5. Bitsgap — Best for arbitrage trading
Why Choose Bitsgap?
Bitsgap specializes in arbitrage trading, which allows users to profit from price discrepancies across different exchanges. This is ideal for traders who want to take advantage of short-term market inefficiencies.
Key Advantages of Bitsgap:
- Cross-Exchange Trading: Connects to multiple exchanges, enabling users to trade across different platforms.
- Automated Arbitrage: Detects and capitalizes on price differences automatically to generate profit.
- Demo Account: Test strategies and learn the platform without risking real funds.
6. WunderTrading — Best for social trading
Why Choose WunderTrading?
WunderTrading is an excellent platform for those who want to participate in social trading. Beginners can follow and copy strategies of successful traders, taking advantage of their experience.
Key Advantages of WunderTrading:
- Social Trading: Users can choose to follow successful traders and automatically copy their strategies.
- Easy Setup: The platform is designed to be intuitive, so users can start trading with just a few clicks.
- Trading Community: Access to a community of traders for the latest market insights and strategies.
7. TradeSanta — Best for short-term traders
Why Choose TradeSanta?
TradeSanta is a great choice for investors who prefer short-term trading strategies. The platform provides various short-term trading strategies to help users quickly capitalize on market fluctuations.
Key Advantages of TradeSanta:
- Short-Term Focus: Optimized for traders looking to capture short-term price movements.
- Customizable Strategies: Offers a wide variety of customizable strategies for users to tailor according to their preferences.
- Cloud-Based Trading: All trading functions are executed via the cloud, allowing users to trade from anywhere.
FAQ: Common questions about AI crypto trading apps
1. How can I earn passive income with AI crypto trading apps as a beginner?
AI crypto trading apps automate the trading process, allowing anyone to earn passive income without actively managing trades. After selecting a strategy and depositing funds, the AI does the work 24/7, making profitable trades.
2. Do I need coding skills to use AI crypto trading apps?
No, these platforms are designed for beginners. There is no need for any coding knowledge. Simply choose a trading strategy, and the AI will handle everything.
3. How do AI crypto trading bots work for beginners?
AI bots use algorithms to analyze the market and execute trades automatically. As a beginner, just select a strategy and the AI does the rest, trading based on real-time market conditions.
4. How long does it take to set up an AI trading app as a beginner?
Setting up is quick and easy. Sign up, deposit funds, choose a strategy, and start trading. Most platforms, like MoneyFlare, offer a demo account to practice first.
5. Can I make money with AI crypto trading without constantly watching the market?
Yes! AI bots trade 24/7, automatically capturing profitable opportunities without active involvement. Once set up, anyone can earn passive income while focusing on other things.
6. What if I don’t understand how AI crypto trading works? Can I still use it?
Yes! Platforms like MoneyFlare are designed for beginners. No need to understand the details of how AI works; just follow the simple setup steps, and the AI will do the rest.
7. How much do AI crypto trading apps cost to use?
Most platforms offer a free trial or basic plan. Some charge a small fee when a user starts trading with real funds. Always check for any fees before using advanced features.
Conclusion
Selecting the right AI crypto trading platform can help beginners easily get started with automated trading and begin earning passive income. From MoneyFlare’s fully automated trading system to Cryptohopper’s portfolio management and Pionex’s no-fee structure, each platform offers unique benefits. Whether someone is new to crypto trading or looking to optimize their strategies, these apps will support them along the way.
For those who are ready to start their AI trading journey, begin with MoneyFlare for its simple interface and automated strategies, and watch the crypto trading experience grow!
Disclosure: This content is provided by a third party. Neither crypto.news nor the author of this article endorses any product mentioned on this page. Users should conduct their own research before taking any action related to the company.
Key insights:
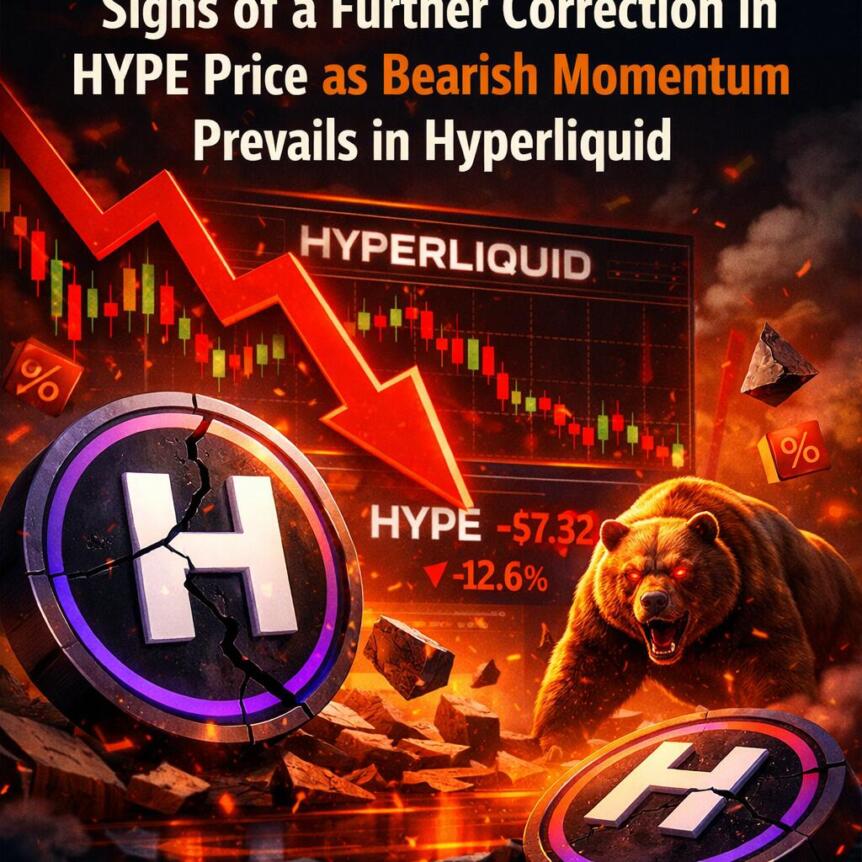
- The HYPE coin has dipped below the critical $37 support line, indicating weakening buying pressure and more bearish power.
- Fibonacci ratios imply that the $32.44 and $29.5 marks can be considered significant demand points.
- Negative readings from RSI and CMF confirm weakening momentum and capital flow, validating the prevailing bearish sentiment.
Breaking Below Crucial Support Level
The price action of Hyperliquid’s HYPE is now trading below the crucial support at $37, indicating a fundamental change in the price structure in the short term.
The support area was seen as a solid floor, having been tested on multiple occasions and bouncing back each time. However, the current breakdown shows that buying interest has diminished significantly.
Moreover, previous attempts to make a push towards the local resistance near $43.7 have not been successful, demonstrating the lack of ability of bulls to keep momentum going.
Another interesting thing to note is the breakout above $40, which took place in late March, was short-lived, as sellers took advantage of this situation.
Market Weakness in Wider Crypto Sector
The fall in the HYPE price is not an isolated incident. In the wider crypto market sector, Bitcoin, along with other cryptocurrencies, suffered declines during the same period.
The market weakness witnessed by the wider crypto sector has led to a decline in investor sentiment, which has made it difficult for HYPE to attempt any recovery moves. This has kept the bullish pressure limited, leading to further price weakness over the last two weeks.
Although there have been some negative developments in the short term, the overall picture remains positive in the long term. Earlier this year, in February 2025, HYPE reached almost $60 but declined rapidly to reach $20. Subsequently, the rise up to $43.7 was a part of a recovery phase.
Thus, the latest fall in HYPE prices can be seen as a retracement from its previous gains.
Levels Highlight Possible Drawdown
Fibonacci retracement levels through technical analysis point towards the possibility of additional drawdown in HYPE. The two levels of $32.44 and $29.5 appear significant, acting as areas for potential buying from traders.
The levels lie inside an established demand zone, which is crucial for the future movement of the crypto asset. However, trading activity currently reveals that there are no aggressive accumulations happening in these levels.
Bearishness Validated by Momentum Indicators
The momentum indicators also confirm the bearish scenario. In this regard, the RSI indicator has breached the 50 neutral level, pointing to an increase in selling activity and a slowdown in buying power.
Moreover, the CMF indicator continues to record negative readings, trading close to -0.15. This indicates that the capital is being withdrawn from the asset.
In terms of the smaller timeframes, especially the 4-hour timeframe, HYPE keeps forming lower highs, indicating the continuation of the bearish scenario. The rejection at the $42 mark in late March has formed a key resistance level that the bulls have failed to surpass.
The Resistance Level Determines the Chance for Reverse
If the stock is going to make a full recovery, HYPE needs to get past the resistance level at $41.59. Crossing this level will demonstrate new buying power and can be considered the start of the return to the $43.7 level.
Prior to that happening, the trend will remain bearish. The market’s dynamics will show that the market still approaches trading with caution and monitors vital areas of supply and demand.
In the short term, the demand zone from $29.5 to $32.5 is essential to pay attention to. If this zone is successfully maintained by buyers, there are good chances for a reversal to happen; otherwise, there might be even lower prices.
Cautious Outlook Continues
Generally speaking, the current trading prices of HYPE show that the market is under stress. The weak momentum, falling indicators, and uncertainties in the market environment are exerting significant pressure on the price of the cryptocurrency.
Even though the long-term chart shows possibilities for a recovery, it appears that the near-future prospects for HYPE remain bearish until it manages to reclaim the key resistance areas.
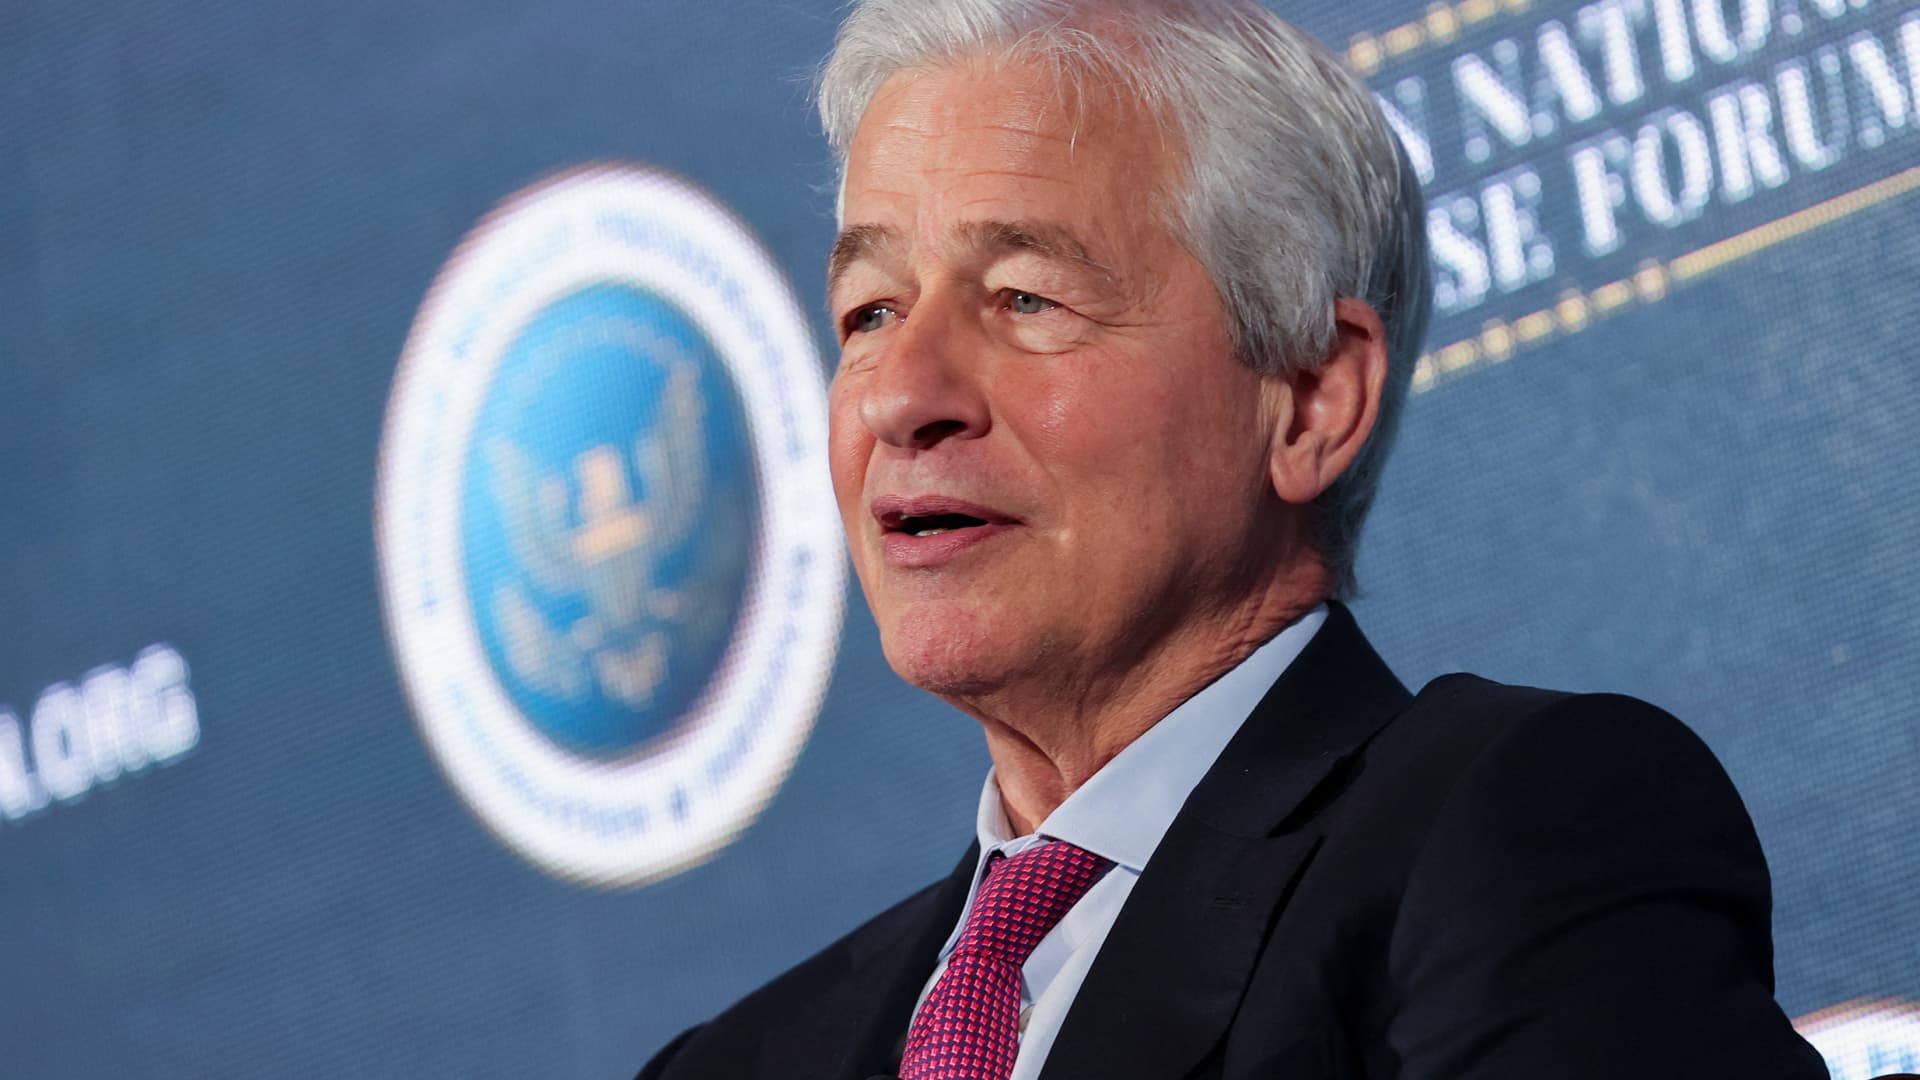
Jamie Dimon, Chairman and CEO, JPMorganChase, speaks during the Reagan National Defense Forum at the Ronald Reagan Presidential Library in Simi Valley, California, U.S. December 6, 2025.
Jonathan Alcorn | Reuters
JPMorgan Chase CEO Jamie Dimon is calling for a broad recommitment to American ideals as his bank navigates geopolitical uncertainty, a teetering economy and the revolutionary impact of artificial intelligence.
Dimon in his annual letter to shareholders, published Monday, noted the country’s 250th anniversary as “the perfect time to rededicate ourselves to the values that made this great nation of ours — freedom, liberty and opportunity.”
“The challenges we all face are significant. The list is long but at the top are the terrible ongoing war and violence in Ukraine, the current war in Iran and the broader hostilities in the Middle East, terrorist activity and growing geopolitical tensions, importantly with China,” Dimon said. “Even in troubled times, we have confidence that America do what it has always done — look to the values that have defined our singular nation and sustained our leadership of the free world.”
Dimon, the longtime leader of the world’s largest bank by market cap, is among the most outspoken of U.S. corporate leaders. His annual letter offers not only a matter of record for his firm’s performance, but also sweeping perspectives on the global state of affairs.
In Monday’s letter, Dimon noted headwinds including global conflicts, persistent inflation, private market upheaval and what he called “poor bank regulations.”
Dimon said that while regulations like those put in place after the 2008 financial crisis “accomplished some good things … they also created a fragmented, slow-moving system with expensive, overlapping and excessive rules and regulations — some of which made the financial system weaker and reduced productive lending.”
He specifically cited negative consequences of capital and liquidity requirements, the current construction of the Federal Reserve’s stress test and a “badly handled” process at the Federal Deposit Insurance Corporation.
Dimon also said JPMorgan’s reaction to revised proposals for Basel 3 Endgame and a global systemically important bank (GSIB) surcharge — issued by U.S. regulators last month — were “mixed.”
“While it was good to see that the recent proposals for the Basel 3 Endgame (B3E) and GSIB attempted to reduce the increase in required capital from the 2023 proposals, there are still some aspects that are frankly nonsensical,” Dimon said.
The CEO said the aggregate proposed surcharges of about 5%, the bank would need to hold “as much as 50% more capital across the vast majority of loans to U.S. consumers and businesses when compared with a large non-GSIB bank for the same set of loans.”
“Frankly, it’s not right, and it’s un-American,” he said.
On trade and geopolitics
Dimon identified geopolitical tensions as the primary risk facing his bank, namely the wars in Ukraine and Iran and their impacts on commodities and global markets — deeming war “the realm of uncertainty.”
“The outcome of current geopolitical events may very well be the defining factor in how the future global economic order unfolds,” he said. “Then again, it may not.”
He also cited a “realignment of economic relations in the world” brought on by U.S. trade policy. U.S. President Donald Trump has made tariffs a signature policy of his second term in office, introducing higher duties on dozens of trade partners and import categories.
“The trade battles are clearly not over, and it should be expected that many nations are analyzing how and with whom they should create trade arrangements,” Dimon said. “While some of this is necessary for national security and resiliency, which are paramount, it is hard to figure out what the long-term effects will be.”
On private markets
Dimon also spoke to recent upheaval in the private markets, as fears around loans made to software firms spur massive redemption requests at private credit funds.
“By and large, private credit does not tend to have great transparency or rigorous valuation ‘marks’ of their loans — this increases the chance that people will sell if they think the environment will get worse — even if actual realized losses barely change,” Dimon said.
The executive added that actual losses are already higher than they should be relative to the environment.
“However this plays out, it should be expected that at some point insurance regulators will insist on more rigorous ratings or markdowns, which will likely lead to demands for more capital,” he said.
On AI
Dimon reiterated Monday that the pace of AI adoption is unlike any technology that came before it. He said while its implementation will be “transformational,” it remains to be seen how the AI revolution will unfold.
“Overall, the investment in AI is not a speculative bubble; rather, it will deliver significant benefits. However, at this time, we cannot predict the ultimate winners and losers in AI- related industries,” Dimon said.
“We will not put our heads in the sand. We will deploy AI, as we deploy all technology, to do a better job for our customers (and employees),” he wrote.
JPMorgan has been at the forefront of Wall Street firms introducing AI at every level of its business. Last year, JPMorgan Chief Analytics Officer Derek Waldron gave CNBC an early demonstration into how it’s using agentic AI to speed up work and improve results for customers and shareholders.
In February, Dimon said AI was reshaping JPMorgan’s workforce and that the bank had “huge redeployment plans” for employees.
“We have focused on some of the ‘known and predictable’ and some of the ‘known unknown’ events,” he said. “But huge technological shifts like AI always have second- and third-order effects as well that can deeply impact society. … We should be monitoring for this kind of transformation, too.”
— CNBC’s Leslie Picker and Ritika Shah contributed to this report.

Key Highlights
- Shares of Soleno Therapeutics (SLNO) jumped more than 30% during premarket hours Monday following acquisition news
- Neurocrine Biosciences (NBIX) is nearing a deal to purchase Soleno in a transaction valued at $2.5B or higher
- The proposed acquisition could price SLNO shares in the low-to-mid $50 range
- According to the Financial Times, an agreement may be reached as early as Monday, April 6
- Shares of Neurocrine declined 0.4% premarket following the report
Soleno Therapeutics has experienced a challenging start to 2026 — posting losses of approximately 14% year to date — but Monday morning brought a dramatic reversal.
Soleno Therapeutics, Inc., SLNO
According to a Financial Times report, Neurocrine Biosciences has entered late-stage negotiations to acquire the rare disease-focused biotech company in a transaction exceeding $2.5 billion. News of the potential deal propelled SLNO shares more than 30% higher in premarket activity.
The proposed acquisition would place Soleno’s valuation in the low-to-mid $50s per share range. Negotiations are progressing at a rapid pace, with the FT indicating an announcement could come as soon as Monday.
Soleno’s primary commercial product is Vykat XR, which the company brought to market last year for treating hyperphagia — a medical condition associated with Prader-Willi syndrome. This condition triggers relentless, overwhelming hunger that can result in severe health complications such as gastric rupture, aspiration risks, morbid obesity, and heart disease.
Prader-Willi syndrome represents a rare genetic disorder with an incidence rate of approximately one case per 15,000 births. Vykat XR became the first FDA-approved therapeutic specifically targeting the insatiable appetite symptoms characteristic of this syndrome.
Industry analysts have projected Vykat XR could achieve peak yearly revenues reaching $2.3 billion — a commercial opportunity that has evidently attracted Neurocrine’s strategic interest.
Neurocrine’s Strategic Expansion Into Rare Diseases
Neurocrine currently maintains a market capitalization of approximately $13.21 billion. The company’s existing product lineup features Ingrezza, which addresses tardive dyskinesia and chorea associated with Huntington’s disease, alongside additional commercialized therapies and developmental pipeline assets.
Acquiring Vykat XR would establish Neurocrine’s presence in the rare disease and orphan drug sector, where companies typically benefit from premium pricing dynamics and reduced competitive pressure.
Neurocrine’s shares fell 0.4% in premarket activity Monday. Such modest declines are common when acquisition news breaks, as investors account for the premium the acquiring company must pay.
Understanding SLNO’s Recent Performance
Despite Monday’s dramatic surge, SLNO had posted year-to-date losses of roughly 14% in 2026 prior to this week’s news. The stock had underperformed despite analyst enthusiasm regarding Vykat XR’s revenue potential.
According to TipRanks, SLNO carries a Strong Buy rating based on assessments from 11 analysts. The consensus price target stands at $101.09, with the most bullish forecast reaching $125.
At the reported acquisition price in the low-to-mid $50s per share, the deal would fall considerably short of analyst price targets — although it would still represent a significant premium compared to SLNO’s recent trading levels.
The Financial Times report referenced individuals with knowledge of the negotiations, emphasizing that discussions are advancing smoothly and accelerating toward a potential finalization.

Netflix’s 98% Rotten Tomatoes Zombie Thriller Is Still One of the Best Shows Ever Made

Howard Jacobson hates protests. So what does he do to fight antisemitism? Howl

Top 10 Companies Leading Innovation in 2026


-

 NewsBeat4 days ago
Steven Gerrard disagrees with Gary Neville over ‘shock’ Chelsea and Arsenal claim | Football
-

 Business3 days ago
No Jackpot Winner and $194 Million Prize Rolls Over
-

 Fashion3 days ago
Weekend Open Thread: Spanx – Corporette.com
-
Entertainment7 days ago
Fans slam 'heartbreaking' Barbie Dream Fest convention debacle with 'cardboard cutout' experience
-

 Crypto World5 days ago
Gold Price Prediction: Worst Month in 17 Years fo Save Haven Rock
-

 Business11 hours ago
Three Gulf funds agree to back Paramount’s $81 billion takeover of Warner, WSJ reports
-
Crypto World6 days ago
Dems press CFTC, ethics board on prediction-market insider trades
-

 Sports2 days ago
India men’s 4x400m and mixed 4x100m relay teams register big progress | Other Sports News
-

 Business4 days ago
Login and Checkout Issues Spark Merchant Frustration
-

 Tech7 days ago
Apple will hide your email address from apps and websites, but not cops
-

 Tech6 days ago
EE TV is using AI to help you find something to watch
-

 Sports6 days ago
Tallest college basketball player ever, standing at 7-foot-9, entering transfer portal
-

 Politics7 days ago
Should Trump Be Scared Strait?
-
Tech6 days ago
Daily Deal: StackSkills Premium Annual Pass
-

 Tech6 days ago
Flipsnack and the shift toward motion-first business content with living visuals
-

 Fashion7 days ago
The Best Spring Trends of 2026
-

 Crypto World7 days ago
U.S. rule change may open trillions in 401(k) funds to crypto
-

 Sports7 days ago
Women’s hockey camp eyes fitness boost, tactics ahead of WC 2026 campaign | Other Sports News
-

 Tech6 days ago
How to back up your iPhone & iPad to your Mac before something goes wrong
-

 Politics7 days ago
BBC slammed for ignoring author of The Fraud
You must be logged in to post a comment Login