
Crypto World
Bitcoin Crash To $35,000? This Is What Analysts Reveal

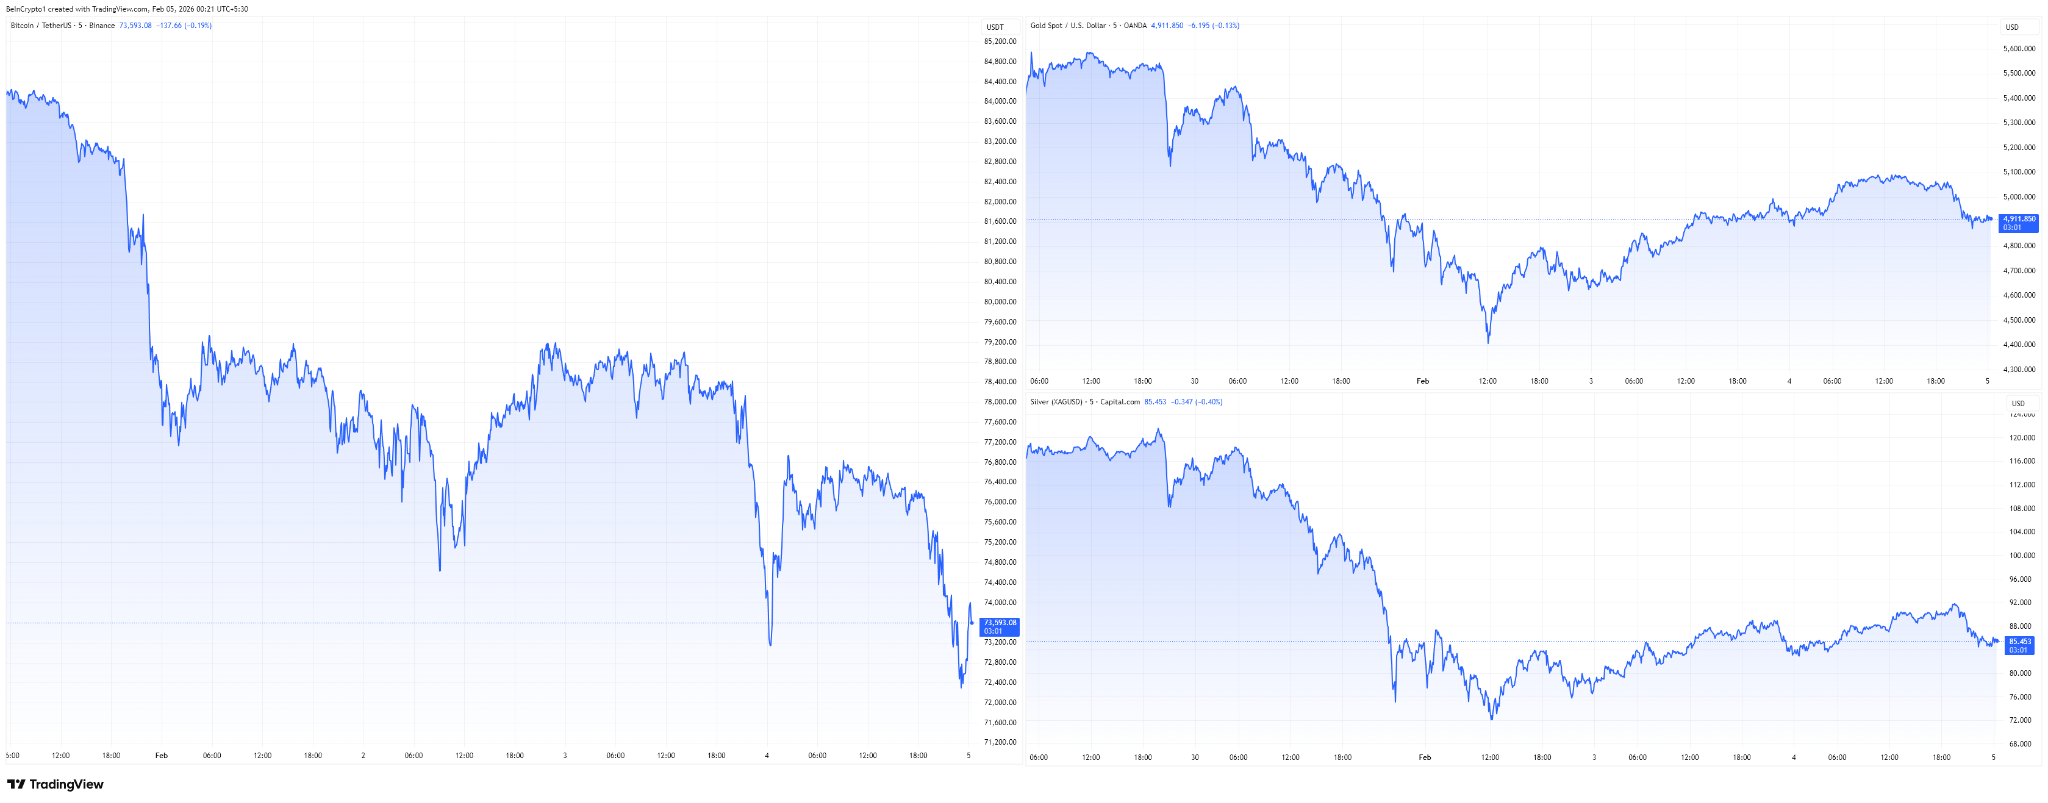
Bitcoin fell sharply to $73,000 on February 3, extending a broader bearish trend that has now erased 41% from its October 2025 all-time high above $126,000. The drawdown has intensified debate over whether the market is approaching a cyclical bottom—or entering a deeper corrective phase.
The sell-off mirrors rising anxiety across traditional markets. US equity indices weakened amid concerns about artificial intelligence-driven disruption and escalating geopolitical risks, prompting investors to rotate away from risk assets.
In that environment, capital flowed back into traditional safe havens such as gold and silver, while Bitcoin failed to attract defensive demand.
Sponsored
Sponsored
Macro and Geopolitical Stress Push Investors Toward Traditional Havens
Bitcoin’s volatility continues to reflect macro sensitivity rather than isolation from global markets. The latest leg down coincided with renewed tensions between the United States and Iran after an Iranian drone was reportedly shot down near a US aircraft carrier.
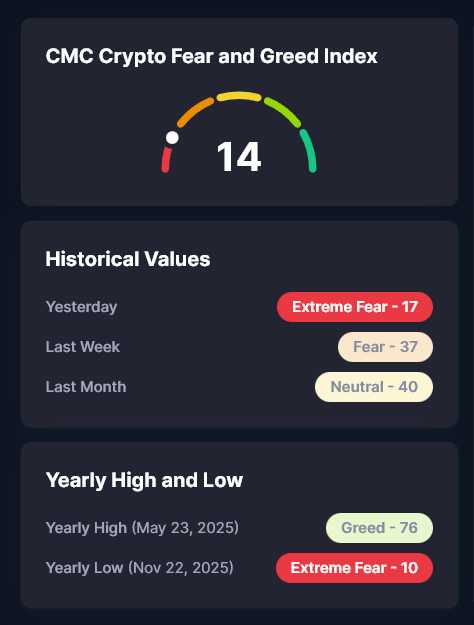
The incident pushed the VIX up roughly 10% and drove the Crypto Fear & Greed Index into “extreme fear” territory.
At the same time, developments in artificial intelligence—including new announcements around Anthropic’s Claude chatbot—sparked renewed concerns about disruption across the tech sector.
That uncertainty weighed on major technology stocks and further reduced appetite for speculative assets.
While Bitcoin declined, gold rose 6.8% and silver gained 10%, reinforcing their role as preferred hedges during periods of monetary and geopolitical stress.
Speaking to CNN, Gerry O’Shea, Global Head of Market Insights at Hashdex, noted that the divergence between Bitcoin and gold suggests investors still view precious metals as the primary safe haven during periods of uncertainty.
That shift has weakened Bitcoin’s short-term refuge narrative and added downside pressure.
Analysts Warn of Deeper Drawdowns and a Potential Bull Trap
Market participants remain divided, but several analysts are openly warning that the correction may not be over.
Sponsored
Sponsored
Crypto analyst Benjamin Cowen argued that Bitcoin’s near-term path is critical:
Other analysts are more pessimistic. Nehal, a widely followed trader on X, suggested the current structure resembles a classic bull trap, warning that the move lower may only be halfway complete.
According to Nehal’s historical comparison, Bitcoin’s previous cycles ended with drawdowns of 86% in 2018 and 78% in 2021.
Applying a similar framework to the current cycle implies a potential 72% decline, which would place Bitcoin near $35,000.
This cyclical perspective remains influential despite structural changes in the market, including ETF adoption and greater institutional participation.
Sponsored
Sponsored
On-Chain Data Signals “Bottom Discovery” Phase
On-chain indicators are adding another layer to the debate. Analyst CryptOpus noted that Bitcoin has entered what he describes as a “bottom discovery” phase for the first time this cycle.
At the 2025 peak, roughly 19.8 million BTC were held in profit. That figure has now dropped to 11.1 million BTC, a 40% reduction in profitable supply.
Historically, similar conditions have marked transitions from corrective phases toward cycle resets. In 2018, Bitcoin remained in this state for roughly eight months before stabilizing.
Key Technical Levels Under Scrutiny
From a technical standpoint, downside risks remain clearly defined. Nic, CEO of Coin Bureau, highlighted that Bitcoin has remained under pressure since breaking below the 50-week moving average in November.
Bitcoin is currently trading near MicroStrategy’s cost basis and close to the April lows around $74,400.
“If we break lower, the next major level is $70,000, just above the previous all-time high of $69,000. A clean break below that opens the door to a bear market target in the $55,700–$58,200 range, between realized price and the 200-week moving average,” Nic warned.
Sponsored
Sponsored
Conflicting Views on Whether a Bottom Is Near
Not all analysts agree with the bearish outlook. Michaël van de Poppe believes Bitcoin may already be nearing the end of its downturn.
Meanwhile, analyst David Battaglia focused on liquidation dynamics, describing current conditions as increasingly irrational.
Battaglia noted that below $85,000, liquidity gaps were significant, meaning panic sellers—whether institutional or whales—likely exited at suboptimal prices.
He contrasted this with the October 10 crash tied to Binance, which he described as structurally cleaner.
“Between $90,000 and $100,000, there’s massive short density and a 14:1 puts-to-calls imbalance, which under normal conditions already signals a strong bottom,” Battaglia said.
In Summary
Bitcoin’s drop to $73,000 has reignited fears of a deeper correction. Macro uncertainty, geopolitical tension, and mixed on-chain signals leave the market split between expectations of further downside and signs of an emerging bottom.
The coming weeks will likely determine whether this move represents a temporary pause—or the foundation of a new trend for 2026.


The BNB price reclaimed fourth place in the global crypto market cap rankings from XRP on Tuesday as seven straight months of XRP losses combined with BNB’s completed 34th quarterly burn and a broad Tuesday market rally pushed Binance’s native token back ahead in a race that has changed hands multiple times since March.
Summary
- BNB is trading around $613, down approximately 55 percent from its October 2025 high of $1,370, but the completed 34th quarterly burn removed 1.72 million BNB worth approximately $1.28 billion from circulation, reinforcing the deflationary mechanics that have historically supported price recovery.
- XRP’s seven-month decline following its July 2025 peak at $3.65 and the Iran-war-driven macro environment that has kept risk assets under pressure gave BNB the sustained momentum gap it needed to retake fourth place after XRP had briefly held it following the March 17 SEC and CFTC commodity classification.
- InvestingHaven projects BNB could trade between $590 and $900 throughout 2026 with potential peaks above $1,100 during strong bullish phases, while Coinpedia separately targets $1,000 by Q3 following the quarterly burn’s deflationary impact.
GlobeNewswire’s April 14 report confirmed the ranking shift, noting that BNB Chain handled 15 million daily transactions in Q1 2026 and that Kyrgyzstan has selected the network to host its national stablecoin with BNB included in a sovereign crypto reserve. The fourth-place ranking carries institutional significance beyond price: it determines which assets get tracked by index funds, which ETF products get approved first, and which assets are included in institutional compliance frameworks. BNB has held that position through multiple cycles and is now fighting to make the hold permanent.
The BNB versus XRP race has been one of the tightest and most volatile market cap battles of 2026, with the margin between the two assets rarely exceeding a few billion dollars in either direction.
The 34th quarterly burn is the most direct mechanical support for the analyst price targets. By removing 1.72 million tokens worth $1.28 billion from the total supply, the burn reduces the denominator in BNB’s value equation at a time when demand from BNB Chain’s 15 million daily transactions, opBNB’s Layer-2 activity, and sovereign reserve adoption is stable. The $900 level that InvestingHaven identifies as the top of its 2026 range corresponds to a roughly 47 percent gain from current prices, which is achievable within the year if the macro environment turns risk-on following a resolution to the Iran war.
What BNB Chain’s 2026 Technical Roadmap Adds to the Thesis
BNB Chain’s published 2026 roadmap targets 20,000 transactions per second and sub-second finality through software optimizations and a new Rust-based client. The opBNB Fourier hard fork already cut Layer-2 block time to 250 milliseconds. These infrastructure improvements are designed to attract DeFi and AI-based projects that need fast, low-cost execution. If they deliver developer adoption at scale, the demand for BNB as the network’s gas and settlement token grows organically alongside usage.
What XRP’s Path Back to Fourth Looks Like
XRP’s commodity classification from the SEC and CFTC in March and the CLARITY Act markup expected in late April remain the two catalysts most likely to push XRP back ahead of BNB in market cap. The ranking battle ultimately tracks which asset gets more institutional capital, and that question in 2026 is almost entirely a regulatory variable that CLARITY Act passage would resolve decisively in XRP’s favor.


Shin Hyun-song, the nominee to lead the Bank of Korea, said a central bank digital currency (CBDC) and bank-issued deposit tokens should form the core of South Korea’s digital money system, with stablecoins playing a secondary role.
“I expect that central bank digital currencies and deposit tokens will be able to coexist with stablecoins in a manner that is supplementary and competitive to each other,” he said, Yonhap reported, citing the Bank of Korea.
In written remarks submitted to parliament ahead of his confirmation hearing on April 15, Shin said he supports introducing a won-based stablecoin, but stressed that trust in the currency must come first, according to Yonhap.
He framed stablecoins as useful tools for trading tokenized assets and enabling programmable payments, not as a replacement for state-backed money.
His proposal aligns with the central bank’s existing position that stablecoin issuance should begin with regulated banks. Shin pointed to compliance demands such as anti-money laundering and customer checks as reasons to start with established lenders, which already meet these standards.
He also questioned claims that blockchain-based coins would improve foreign exchange efficiency, pointing to uncertainty around regulatory compliance and added costs.
Of cryptocurrencies more broadly, Shin said digital assets fall short of money’s core roles as a unit of account, a medium of exchange and a store of value.
The Bank of Korea has warned that privately issued tokens could pose risks to monetary policy and financial stability, and has called for strict oversight including anti-money laundering and customer verification rules.
Shin’s remarks come as policymakers debate how far to open the market. While regulators have pushed for bank-led models, lawmakers have proposed broader frameworks that would allow non-bank issuers under new legislation.
The country’s first fully regulated stablecoin, KRW1, debuted in February through a partnership between crypto custody service provider BDACS and Woori Bank.

The crypto exchange’s move could signal a challenge to platforms like Kalshi through the integration of prediction markets, expected to be a $1 trillion market by 2030.
Crypto.com has signed a definitive agreement with online casino company High Roller Technologies as part of the cryptocurrency exchange’s move into prediction markets in a challenge to companies like Kalshi and Polymarket.
In a Tuesday notice, High Roller said the deal with Crypto.com would allow the crypto exchange to launch “an event-based prediction markets offering” to US-based users. The notice emphasized that the event contracts would be offered via CDNA, a Commodity Futures Trading Commission (CFTC)-registered exchange, at a time when US state gaming authorities are cracking down on prediction markets.
“We believe this partnership gives us a strong starting position in a market with meaningful long-term potential, and we’re confident in our ability to deliver,” said High Roller CEO Seth Young.

Crypto.com’s move into prediction markets is the latest example of a crypto exchange attempting to enter what could become a $1 trillion market by 2030. Binance integrated similar features on its wallet app last week through an arrangement with Predict.fun, a prediction market platform on the BNB Chain.
Related: Polymarket bets removed from Google News after brief appearance: Report
High Roller’s (ROLR) stock price on the NYSE American more than doubled following the announcement, to $10.77 from $5.20.
While the CFTC and prediction markets like Kalshi have claimed in court that federal commodities laws preempt state gaming laws, the companies continue to face legal challenges in multiple jurisdictions. Cointelegraph sought a comment from High Roller but did not receive an immediate response.
Bernstein analysts expect prediction markets to move away from sports bets
According to a Tuesday report from analysts at wealth management company Bernstein, while event contracts on prediction markets centered around sports are the entry point for many of the platform’s users, they are “not the endgame.” The analysts expect the share of sports-based event contracts on the prediction platforms to fall from about 62% to 31% by 2030 as other markets take over.
“We expect the institutional market to develop around economics, business and political contracts, as investors seek more direct and discrete exposure to events,” said the Bernstein analysts. “We also expect hedging demand from corporates and insurance firms exposed to specific event risks.”
Magazine: Should users be allowed to bet on war and death in prediction markets?


A crypto scam posing as the official Ledger Live hardware wallet app passed Apple’s App Store review process and drained at least $9.5 million from more than 50 victims across Bitcoin, Ethereum, Solana, Tron, and XRP between April 7 and April 13, with stolen funds routed through more than 150 KuCoin deposit addresses and into a centralized mixing service.
Summary
- The three largest individual thefts were $3.23 million in USDT on April 9, $2.08 million in USDC on April 11, and $1.95 million in BTC, ETH, and stETH on April 8, with blockchain investigator ZachXBT tracing all stolen funds to deposit addresses linked to a mixing service called AudiA6, known for charging high fees to obscure illicit transactions.
- The attack worked by prompting users to enter their 24-word seed phrase into the fake app during what appeared to be a normal wallet setup flow; once a seed phrase is entered into any connected application, attackers gain full and immediate control of every wallet derived from it.
- Apple has removed the fake app from the App Store but has not publicly commented on how it passed the review process; ZachXBT separately reported that Apple appears to be blocking a security analysis tool from examining the fraudulent listing, which has complicated independent investigation.
A report on the theft brought the incident to wide attention after ZachXBT published his on-chain analysis. One of the victims, posting on X under the handle @glove, was Philadelphia musician Garrett Dutton of G. Love and Special Sauce, who lost 5.92 BTC accumulated over a decade of saving. “I worked ten years for this,” he wrote. “Be careful out there.” He was setting up his Ledger hardware wallet on a new MacBook when he searched the App Store for Ledger Live and downloaded the impersonating app. The seed phrase he entered gave attackers immediate access.
The incident is not without precedent. A nearly identical fake Ledger app scheme stole approximately $600,000 through Microsoft’s app store in 2023, using the same impersonation-plus-seed-phrase playbook.
The mechanism that makes this attack effective is not technical sophistication. It is social trust. Users going to the Apple App Store reasonably expect that the apps listed there have been reviewed and are legitimate. The fake Ledger app exploited that trust by appearing in search results for “Ledger Live” with convincing branding and a standard setup flow. Apple’s review process, which has rejected crypto apps for policy reasons, apparently did not catch a malicious application designed to steal funds from users of hardware wallets that Apple’s own review policies pushed them toward using in the first place.
Why Seed Phrases and App Stores Are Structurally Incompatible
The hardware wallet’s entire security model rests on one rule: the seed phrase never touches a connected device. The physical hardware generates the seed phrase offline and signs transactions internally, so private keys are never exposed to the internet. The moment a user types their seed phrase into any app, website, or keyboard, the hardware wallet’s protection is eliminated. No legitimate wallet provider, including Ledger, ever asks for a seed phrase during setup. Any application that requests one is either malfunctioning or malicious. Security experts recommend downloading Ledger Live only from ledger.com directly, never from any app store.
What Happens to Stolen Funds and Why Recovery Is Unlikely
ZachXBT traced the stolen funds through nine transactions into KuCoin deposit addresses linked to the AudiA6 mixing service. KuCoin has been barred from onboarding new EU users by Austrian regulators in February 2026, just three months after receiving a MiCA license, and previously paid over $300 million to US authorities in 2025 to settle anti-money laundering violations. Recovery would require coordinated law enforcement action and voluntary exchange cooperation that ZachXBT said he did not expect. The incident has prompted discussion of potential class-action lawsuits against Apple for platform liability, and reinforces why crypto security experts consistently warn against downloading wallet software from any source other than the manufacturer’s official website.

Victims of the OneCoin $4 billion fraud scheme can now seek compensation through a $40 million fund of seized assets, the U.S. Department of Justice (DOJ) announced on Monday.
Between 2014 and 2019, Ignatova and Karl Sebastian Greenwood, co-founders of OneCoin Ltd. (OneCoin), and others operated an international cryptocurrency investment scheme defrauding up to 3.4 million investors from around the globe, the DOJ said.
The Sofia, Bulgaria-based operation marketed and sold a fraudulent crypto by the same name through a global multi-level-marketing (MLM) network.
Victims worldwide invested over $4 billion worldwide in the fraudulent cryptocurrency which operated through a network of promoters, who solicited investments in return for purported tokens, but notably did not actually involve any cryptocurrencies nor did OneCoin exist on any blockchain.
The ponzi scheme, which the DOJ called “one of the largest global fraud schemes in history”, collapsed in 2017, after Ignatova and her team were found to have manipulated OneCoin’s perceived value through the automatic generation of new coins.
In June 2024, the DOJ offered a new $5 million reward for the missing Cryptqueen. Greenwood, who allegedly called the investors “idiots”, admitted to federal wire fraud and money laundering charges in 2022.
“OneCoin’s founders sold a lie disguised as cryptocurrency, costing victims more than $4 billion worldwide,” said U.S. Attorney Jay Clayton for the Southern District of New York. He also said the DOJ would continue working to seize criminal proceeds and prioritize getting money back into the hands of victims.
The compensation process for OneCoin comes roughly four weeks after the FTX Recovery Trust announced it would distribute $2.2 billion to creditors in its fourth payout under the exchange’s Chapter 11 plan. Earlier rounds totalled more than $6 billion as part of a process aimed at recovering assets for users of the once-prominent crypto trading platform, which collapsed in November 2022, triggering a steep crypto bear market.
Update (April 14 7:51 PM UTC): This article has been updated to with date of nomination hearing.
Kevin Warsh, US President Donald Trump’s pick to lead the Federal Reserve to replace Chair Jerome Powell, has reported millions of dollars in assets ahead of his confirmation hearing, including investments in crypto and AI companies.
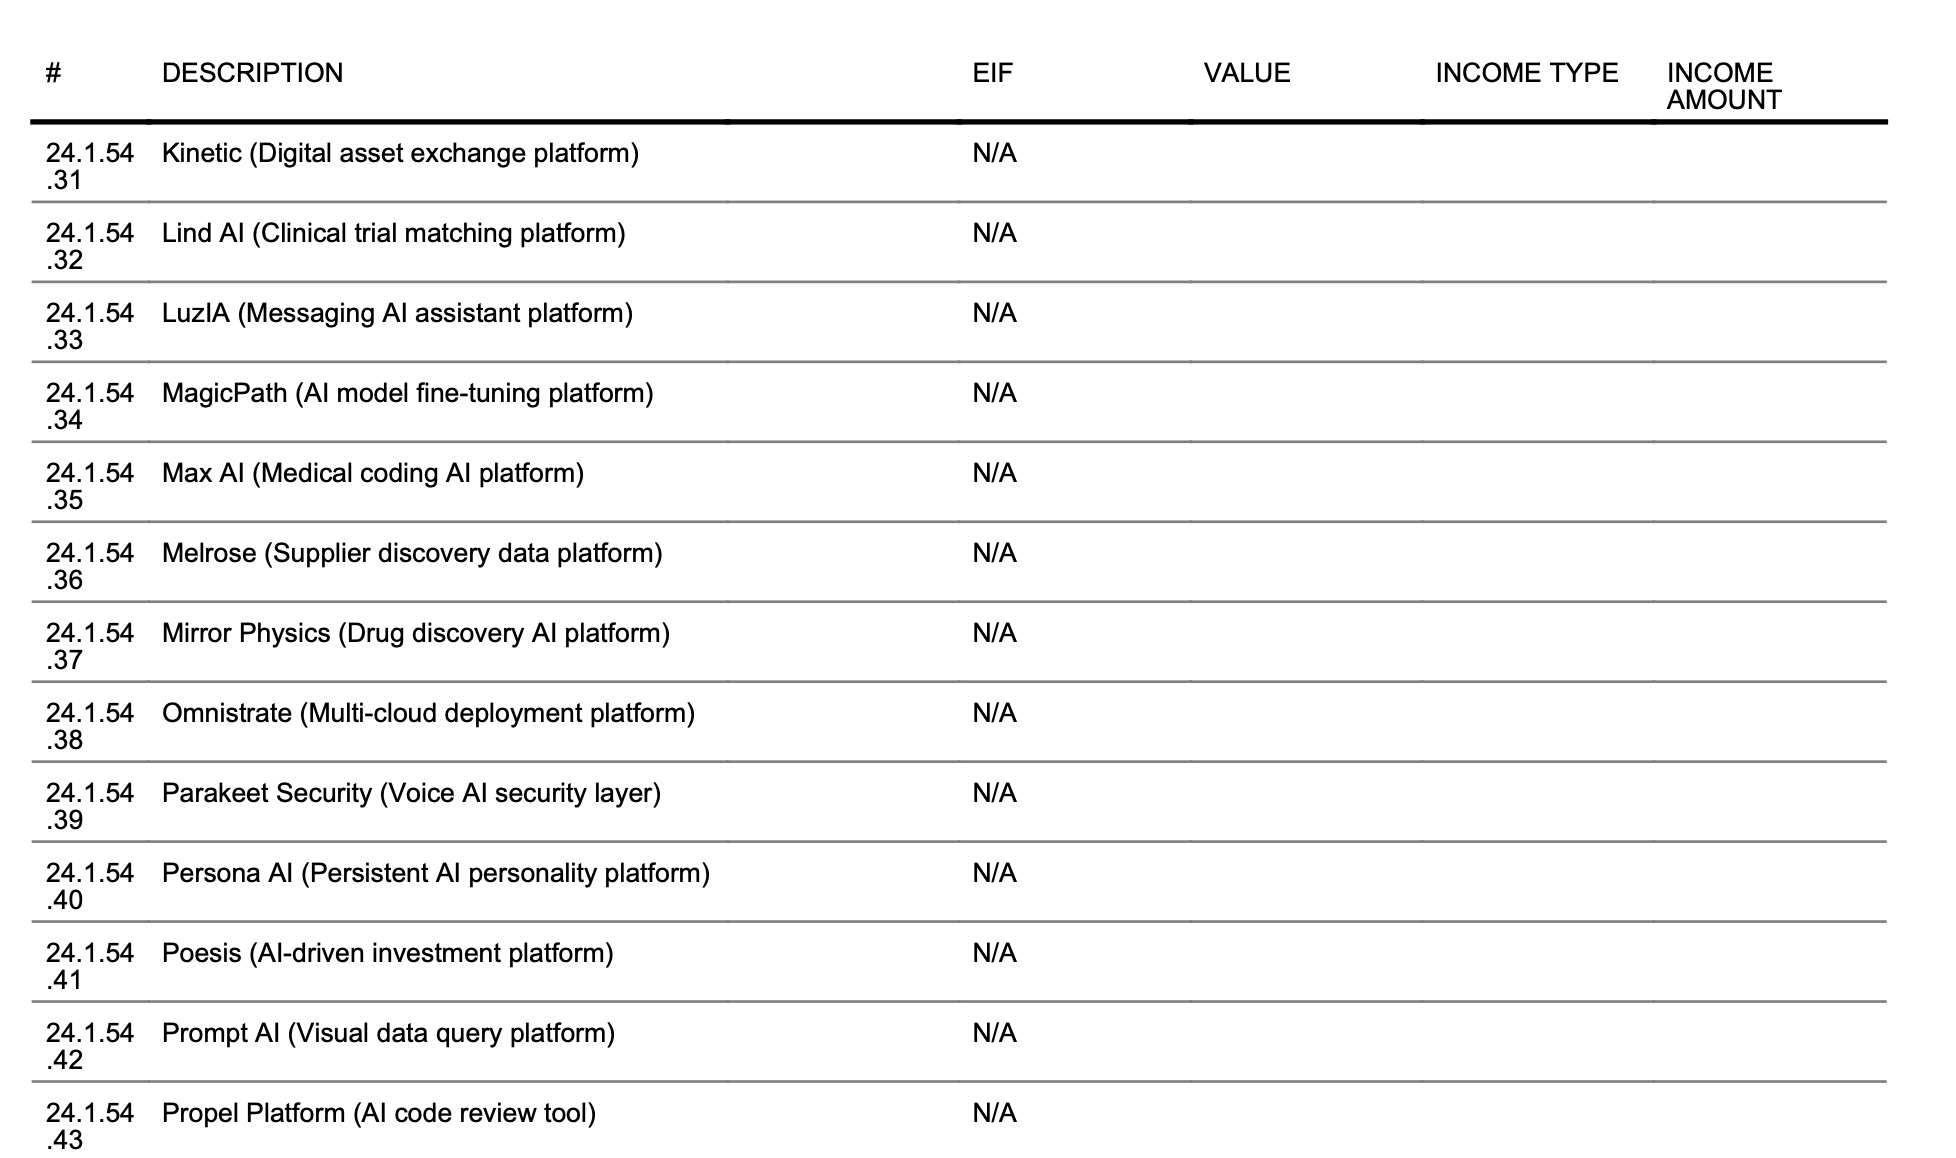
In a filing with the US Office of Government Ethics, Warsh reported Excepted Investment Funds (EIFs) in Compound, Dapper Labs, Kinetic, as well as AI companies Delphi, Conversion, Factory, Glue and others ahead of his confirmation hearing in the Senate.
While the prospective Fed chair’s assets amounted to more than $100 million, none of his crypto and AI investments included a value range, Reuters reported on Tuesday.

It’s unclear why the value of the crypto and AI investments were not included in the disclosures, but the ethics’ office rules do not require reporting for assets under $1,000. Among the biggest disclosures were more than $50 million in the Juggernaut Fund and more than $10 million in income from consulting fees for Duquesne Family Office, the investment firm of Stanley Druckenmiller.
Trump announced Warsh as his pick to lead the US central bank in January, but only formally advanced his name to the Senate in March following numerous threats to oust Powell. Whoever heads the Fed has significant influence over US financial policy, including federal interest rates.
Related: Deutsche Börse invests $200 million in Kraken parent Payward
Powell’s second four-year term as chair ends on May 15. The Senate Banking Committee announced Tuesday afternoon that it will hold a hearing on Warsh’s nomination to replace the Fed chair on April 21.
Trump still hasn’t announced key nominations for financial agencies
While the Senate Banking Committee may soon consider Warsh’s nomination, Trump has not signaled that he plans to announce additional picks for commissioners at the Securities and Exchange Commission (SEC) or Commodity Futures Trading Commission (CFTC), both of which have empty leadership seats at a crucial time for digital asset regulation.
The SEC currently has only three out of five commissioners in its leadership — all Republicans — while another Republican, Michael Selig, is the sole commissioner at the CFTC, where four remaining slots are unfilled. Both regulatory agencies are expected to play significant roles in digital asset regulation should the Senate pass a crypto market structure bill that has been stalled in the chamber since July 2025.
Magazine: Singapore is no ‘crypto hub’ — but it is serious about stablecoins: StraitX CEO

TLDR
- JPMorgan CFO Jeremy Barnum warned that stablecoins could become a form of regulatory arbitrage under inconsistent rules.
- He stated that some stablecoin models may replicate bank-like products without adhering to traditional banking safeguards.
- Barnum emphasized that equal regulation for similar financial products is necessary to prevent an uneven competitive environment.
- He noted that yield-bearing stablecoins could resemble bank deposits while avoiding capital and liquidity requirements.
- Coinbase has advocated for the ability to pass interest earned on reserve assets to stablecoin holders.
JPMorgan Chase Chief Financial Officer Jeremy Barnum warned that stablecoins could become regulatory arbitrage tools under uneven rules. He spoke during the bank’s first-quarter earnings call on Tuesday. He said inconsistent oversight could let firms replicate banking products without meeting banking standards.
Stablecoins and Regulatory Standards
Barnum framed the issue as a matter of oversight rather than technology change. He said some stablecoin structures could mirror deposit products without similar safeguards. He warned that uneven rules could create regulatory arbitrage.
“If the same product isn’t regulated the same way, you open the door to arbitrage,” Barnum said. He added that some models offer rewards that resemble yield to customers. He said firms could “run a bank” without core banking regulations in that case.
Lawmakers continue to review digital asset legislation in Washington, D.C. The proposed Clarity Act seeks to define oversight between the Securities and Exchange Commission and the Commodity Futures Trading Commission. The bill also aims to clarify rules for stablecoins and related services.
The debate also centers on whether issuers can pass reserve interest to holders. Coinbase has urged lawmakers to allow yield distribution on stablecoin reserves. The company argues that interest sharing would improve utility as a savings product.
Banks oppose yield-bearing stablecoins under current frameworks. They argue that such products resemble deposits but avoid capital and liquidity requirements. They also say non-bank firms could attract funds by offering returns that banks cannot provide.
Barnum said JPMorgan supports clear digital asset rules. However, he stressed that consistency matters more than speed in policymaking. He warned that gaps could allow new entrants to operate outside existing boundaries.
JPMorgan Earnings and Digital Infrastructure
Barnum downplayed threats to JPMorgan’s core payments operations. He said the bank already runs a large wholesale payments network. He added that it processes transactions quickly and at low cost.
Instead, JPMorgan continues to build blockchain-based tools within its infrastructure. Through its Kinexys unit, the bank developed JPM Coin and tokenized deposits. These tools allow institutional clients to move funds around the clock.
Barnum described these efforts as part of modernization plans. He said programmable payments now integrate into existing systems. He stated that these features complement rather than replace traditional services.
On consumer products, Barnum addressed compliance requirements. He said stablecoins often appear as digital cash in public discussion. However, he stressed that identity checks and compliance rules still apply.
JPMorgan reported strong first-quarter financial results. Net income rose 13% year over year to $16.49 billion. Revenue increased 10% to $50.54 billion.

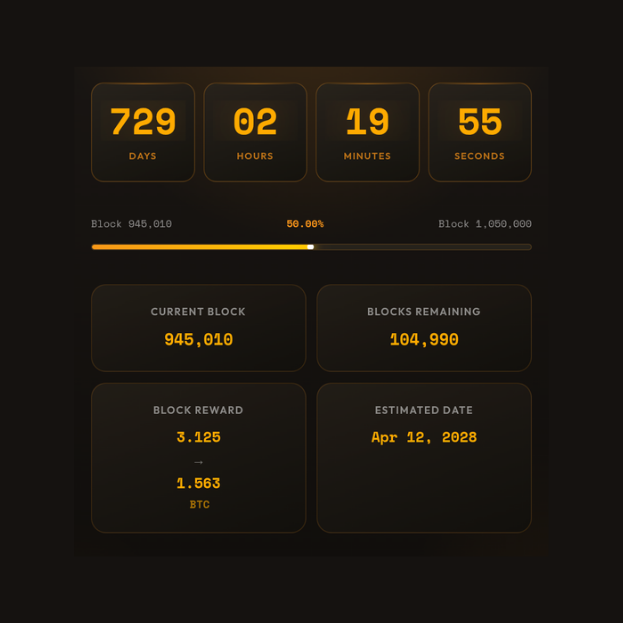
The countdown to Bitcoin’s next halving has reached its midpoint. Approximately 105,000 blocks remain before block rewards are cut in half again.
The Bitcoin network is now halfway through the current halving cycle that began in April 2024. When the network reaches block 1,050,000, estimated for April 2028, the block reward will drop from 3.125 BTC to 1.5625 BTC per block.
What the Bitcoin Halving Milestone Means for Supply
Each halving reduces the rate at which new Bitcoin enters circulation. Currently, miners produce approximately 450 BTC per day. After the 2028 halving, daily issuance will drop to roughly 225 BTC.
The halving mechanism is hardcoded into Bitcoin’s protocol and occurs every 210,000 blocks, approximately every four years. This predictable supply schedule is central to Bitcoin’s value proposition as a scarce digital asset.
With approximately 19.7 million Bitcoin already mined out of the maximum 21 million supply, halvings become increasingly significant for the remaining issuance. More than 98% of all Bitcoin will be mined by 2030.

Historical Bitcoin Halving Price Performance
Previous halvings have preceded significant price increases, though the magnitude of gains has diminished with each cycle. The pattern has made halving events closely watched by investors.
The first halving in November 2012 reduced rewards from 50 BTC to 25 BTC. The second halving in July 2016 cut rewards to 12.5 BTC. The third halving in May 2020 reduced rewards to 6.25 BTC. The most recent halving in April 2024 brought rewards down to the current 3.125 BTC.
In each case, Bitcoin’s largest price moves occurred 12 to 18 months after the halving event. However, past performance does not guarantee future results, and market conditions vary significantly between cycles.
This Cycle Is Different Due to ETF Demand
The 2024 to 2028 halving cycle differs fundamentally from previous cycles. Spot Bitcoin ETFs in the United States now hold over 1.3 million BTC, worth approximately $92 billion at current prices.
This institutional demand creates a structural floor that did not exist in prior cycles. ETF investors tend to be longer term holders, including financial advisors, pension funds, and family offices building portfolio allocations.
Meanwhile, Strategy continues accumulating Bitcoin at a pace that exceeds new mining supply. The company now holds over 780,000 BTC and absorbs more Bitcoin monthly than miners produce.
The combination of reduced new supply and sustained institutional demand could amplify the supply and demand dynamics that have historically driven post halving price appreciation.
Two Years Until the Next Bitcoin Halving
With the countdown now at 50%, approximately two years remain until the fifth Bitcoin halving. The exact date continues to shift based on mining difficulty and network hashrate changes.
Current estimates place the halving in April 2028, though projections range from March to May depending on the data source. The network targets a 10 minute block time on average, but actual block times vary.
For miners, the approaching halving means another reduction in revenue per block. Mining operations must continue optimizing costs through more efficient hardware and cheaper electricity to remain profitable after the reward cut.
The halving countdown serves as a reminder of Bitcoin’s fixed monetary policy. Unlike fiat currencies where central banks can adjust supply at will, Bitcoin’s issuance schedule is transparent and unchangeable.
The post Bitcoin Halving 2028 Is Now 50% Complete appeared first on BeInCrypto.

The Bitcoin network is now more than halfway (50.01%) through its current halving cycle, with the next halving expected on April 12, 2028, just under two years away, according to mempool.space.
This cycle, known as “epoch 5”, which began in April 2024 and will continue through to 2028.
A halving occurs every 210,000 blocks, roughly every four years, and reduces the reward miners receive by 50%.
This process controls bitcoin’s issuance and ensures a predictable decline in its inflation rate (currently under 1%). In the current epoch, the block subsidy is 3.125 BTC per block. With blocks mined on average every 10 minutes, around 450 BTC are issued daily.
This 10 minute schedule is maintained through difficulty adjustments, which occur every 2,016 blocks. The network increases or decreases mining difficulty depending on how quickly blocks are found, keeping issuance consistent.
With approximately 104,986 blocks remaining in this cycle, bitcoin’s supply continues its dependable path toward its fixed cap. Each new epoch further reduces issuance and its inflation rate, reinforcing its long term scarcity.
Bitcoin has a fixed maximum supply of 21,000,000 coins, one of its main characteristics which underpins its scarcity. Recently, the network reached a major milestone as the 20 millionth bitcoin was mined, meaning the final million will take another 114 years to mine.
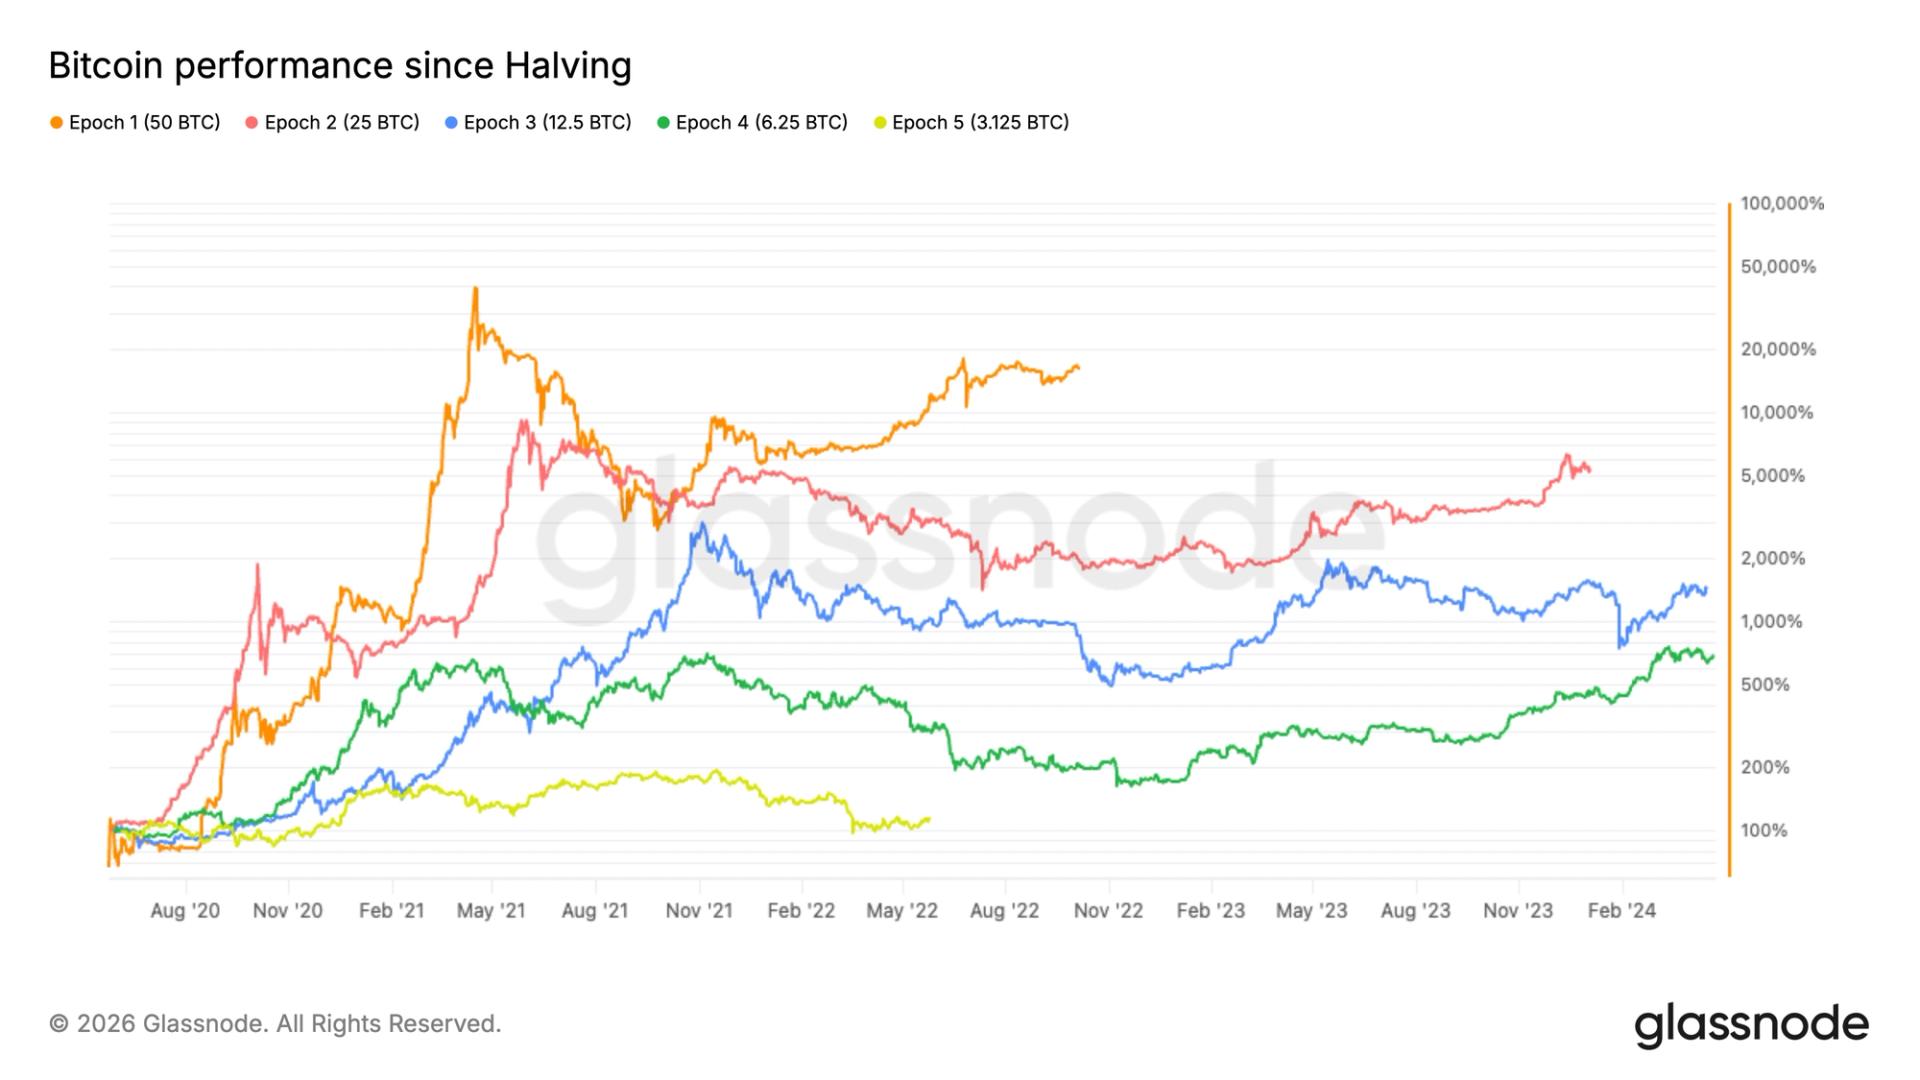
Bitcoin post-halving gains lag prior cycles
Bitcoin is up around 15% since the April 2024 halving, rising from roughly $64,000 to just under $75,000. Previously reached an all time high of around $126,000 in October 2025 before falling roughly 50% to $60,000 in early February.
However, it has underperformed previous cycles over the same post-halving period, continuing the trend of diminishing returns, according to Glassnode data.
This is largely expected as bitcoin matures, with greater adoption and a larger market cap requiring more capital to drive outsized gains. As a result, volatility is declining each cycle and price action is becoming more gradual compared to earlier cycles.


The Stripe-backed Tempo blockchain gained a pair of heavyweight validators in Visa (V) and Zodia Custody, the crypto custodian majority owned by Standard Chartered (STAN).
Alongside Stripe, Visa and Zodia will participate in the Tempo blockchain by maintaining network security and verifying transactions.
Visa, a long-time collaborator of the payments services provider, configured and managed the validator node entirely in-house, following six months of joint work with Tempo’s engineering team to integrate the card giant’s infrastructure directly into the blockchain, according to a press release.
Visa plans to run nodes on some other blockchains following the Tempo integration. The card network had previously said it will join the Canton Network, where there are plans to serve as a “Super Validator.”
For the past seven years or so, Visa’s blockchain engineers have been “living and breathing stablecoins,” said the head of Visa’s crypto team, Cuy Sheffield. Now the focus is on supporting the evolution of new payment flows such as machine-to-machine commerce using AI agents, he added.
“We’ve been an early design partner, working very closely with the Tempo team, looking at designing infrastructure that can support many types of new payment flows, and particularly agentic payment flows,” Sheffield said in an interview with CoinDesk.
Tempo, which is also backed by crypto investment firm Paradigm, went live last month with Machine Payments Protocol (MPP), a protocol that lets software and AI agents pay for services autonomously.
“Visa is a big part of MPP,” Sheffield said. “We added the MPP card spec. We announced Visa CLI, which is a wallet that is built on top of MPP where agents can use a Visa card to be able to spend. So we’ve been deeply involved in the Tempo and the MPP ecosystem, and now we’re running the underlying infrastructure on Tempo.”
There’s no doubting Stripe’s conviction when it comes to assembling an end-to-end blockchain-based system for stablecoin payments. But, taking a step back, some people might question how open and decentralized such a system is.
Sheffield, in response, said Visa is simply being pragmatic, looking for products that can drive payment volume.
“Our view has always been that decentralization is a spectrum,” Sheffield said. “There are many use cases where decentralization for the sake of decentralization doesn’t solve a problem. I think we’re now entering a phase in the crypto industry where decentralization is not the primary value prop. It’s whether a new payment infrastructure is fast, efficient, programmable and can outperform some existing payment infrastructure for certain use cases.”
Stripe moved into the stablecoin industry when it acquired stablecoin specialist Bridge for $1.1 billion in 2024. Earlier this year, Mastercard made a similar move, buying stablecoin firm BVNK for $1.8 billion.
Asked if Visa had any plans to offer its own stablecoin, Sheffield said:
“It’s so early and the rules haven’t even been fully written yet. We spent a bunch of time with the OCC (Office of the Comptroller of the Currency) and others,” he said. “I think there are many different roles that Visa can play, but everything we do, we want to make sure that we’re doing it in partnership with our clients and our network.”
UPDATE (April 14, 14:16 UTC): Rewrites headline, first paragraph to include reference to Zodia Custody.

Former US Treasury Secretary Yellen says Iran war to bring more inflationary pressure

BNB price reclaims 4th spot from XRP
“Talladega Nights” cast: See the racing comedy's stars two decades after its release

Why Israel is blocking foreign journalists from entering

Bitcoin: We’re Entering The Most Dangerous Phase

Alan Cumming Brands Baftas Ceremony A ‘Triggering S**tshow’

This Habit Is Secretly Making You Poor #habits #money #finance #shorts

Bitcoin SMASHES $72K As Ceasefire Begins & Wall Street Steps In! Real Breakout Or Trap?

These Investment Options Follow Biblically Responsible Investing (BRI) Principles #Faithful #Finance
-

 Politics4 days ago
US brings back mandatory military draft registration
-
 Sports4 days ago
Man United discover Nico Schlotterbeck transfer fee as defender reaches Dortmund agreement
-

 Fashion4 days ago
Weekend Open Thread: Veronica Beard
-

 Politics5 days ago
Malcolm In The Middle OG Turned Down ‘Buckets Of Money’ To Appear In Reboot
-

 Politics2 days ago
World Cup exit makes Italy enter crisis mode
-

 Crypto World6 days ago
Canary Capital Files SEC Registration for PEPE ETF
-

 Business4 days ago
Tesla Model Y Tops China Auto Sales in March 2026 With 39,827 Registrations, Beating Cheaper EVs and Gas Cars
-

 Crypto World1 day ago
The SEC Conditionalises DeFi Platforms to Be Avoided for Broker Registration
-

 Crypto World1 day ago
SEC Signals Exemption for Crypto Interfaces From Broker Registration
-

 Crypto World6 days ago
Bitcoin recovers as US and Iran Agree a Ceasefire Deal
-
 NewsBeat2 days ago
Pep Guardiola and Gary Neville agree over Arsenal title problem that benefits Man City
-

 Business5 days ago
OpenAI Halts Stargate UK Data Centre Project Over Energy Costs and Copyright Row
-

 Business3 days ago
Ireland Fuel Protests Enter Day 5 as Blockades Spark Shortages and Government Prepares Support Package
-

 Politics5 days ago
LBC Presenter Mocks Trump Over Iran War Failures
-

 Crypto World4 days ago
Federal judge blocks Arizona from bringing criminal charges against Kalshi
-
 NewsBeat3 days ago
JD Vance announces ‘no agreement’ with Iran over nuclear weapons fear
-

 Tech5 days ago
A version of Windows 10 released a decade ago is now eligible for additional security patches
-

 Business4 days ago
IMF retains floor for precautionary balances at SDR 20 billion
-

 Crypto World20 hours ago
SEC Proposes Certain Crypto Interfaces Don’t Need to Register as Brokers
-

 NewsBeat16 hours ago
Trump and Pope Leo: Behind their disagreement over Iran war
You must be logged in to post a comment Login