
Crypto World
Bitcoin ETFs Hold On Amid Price Plunge, Analyst Says
US-based spot Bitcoin ETF holders are showing resilience despite a four-month downtrend in Bitcoin (CRYPTO: BTC), according to ETF analyst James Seyffart. In a recent post on X, he noted that the ETFs are “hanging in there pretty good,” even as the underlying asset has endured a prolonged slide. While acknowledging the pain of the current stretch—Bitcoin trading below $73,000 has left ETF holders with what he described as their largest paper losses since the January 2024 launch—the way flows have behaved contrasts with the height of the market cycle. The narrative is nuanced: inflows have cooled from peak levels, but the existing positions remain broadly intact as investors weather the drift in price.
Key takeaways
- Spot Bitcoin ETF holders are currently underwater but continuing to hold positions, signaling a degree of conviction despite the drawdown.
- Net ETF inflows had reached roughly $62.11 billion before the October downturn, and have since cooled to around $55 billion, according to preliminary data from Farside Investors.
- Bitcoin’s price trajectory has contributed to paper losses for ETF holders, with the broader market down about 24% over a 30-day window and the spot price near $70,537 at the time of reporting.
- Industry observers highlight a pattern of extended outflows, noting that three consecutive months of withdrawals marked a first in the history of higher-frequency ETF data monitoring.
- Industry voices emphasize a longer-term perspective, arguing that Bitcoin’s performance since 2022 has outpaced traditional assets in several periods, challenging the sentiment of a uniformly bearish cycle among analysts.
Tickers mentioned: $BTC
Sentiment: Neutral
Price impact: Negative. ETF holders remain underwater as Bitcoin’s price decline drags on, though the net inflow dynamics offer a counterpoint to pure price Action.
Trading idea (Not Financial Advice): Hold. The combination of persistent holdings by ETF investors and improving inflows relative to peak levels suggests patience may be warranted amid ongoing price volatility.
Market context: The ETF landscape sits at the intersection of liquidity, risk appetite, and macro flows. Inflows into BTC-linked vehicles have cooled after a major cycle, while on-chain and market indicators show divergent signals about near-term momentum. The mix of price pressure and ongoing institutional participation shapes a cautious but not collapsing narrative for Bitcoin-focused ETFs.
Why it matters
The behavior of spot BTC ETFs helps illuminate a broader dynamic in crypto markets: institutional vehicles can provide a stabilizing, if not yet growth-driven, channel for price discovery. Even as price declines stretch across several weeks, the fact that ETF inflows remain sizable—albeit down from the peak—suggests that investors are maintaining exposure rather than exiting en masse. This matters for market liquidity, as ETF flows can dampen sharp price moves when buying or selling pressure intensifies, particularly in a sector as sensitive to macro headlines as crypto.
The discourse around investor sentiment is nuanced. On one hand, there is acknowledgment of substantial paper losses among ETF holders during the recent downturn, with Bitcoin navigating lower levels and volatility elevated. On the other hand, observers highlight that Bitcoin’s recovery potential remains tethered to macro risk appetite and the pace of flows into crypto vehicles. The conversation is further complicated by longer-term performance comparisons: Bitcoin has, in multiple cycles, outperformed traditional assets over extended horizons, which some argue justifies a longer view despite the near-term pain.
Analysts and researchers stress that focusing solely on near-term drawdowns can obscure the more complex picture of investor behavior and market structure. For instance, a well-known market observer suggested that Bitcoin’s strength in previous years—particularly its outsized gains through 2023 and 2024—remains a reference point for evaluating current demand. While the market may appear to be in a risk-off phase, the longer arc of Bitcoin’s price action has historically included substantial rallies following consolidation periods, underscoring the difficulty in drawing conclusions from a single quarter’s results.
Another thread in the discussion centers on the prudence of staying invested when ETF holders are effectively “underwater and collectively holding,” as some observers phrase it. This stance mirrors a broader crypto investing paradigm where conviction and time horizons matter as much as timing. In a space where episodic headlines can swing prices, the behavior of ETF holders offers a degree of reflexivity: ongoing participation from established vehicles can support price resilience, even when volatility remains elevated.
The discourse also touches on narrative risk—whether market participants are overly pessimistic about BTC’s near-term prospects. Some voices argue that evaluating Bitcoin’s performance in a post-2022 context should consider its outsized gains relative to gold and traditional assets, suggesting that the market’s recovery potential remains intact even after a difficult stretch. While sentiment among analysts fluctuates, the fact that a broad spectrum of commentators continues to discuss Bitcoin’s long-term trajectory hints at a market that is more nuanced than a straightforward bullish or bearish verdict.
The price action is clear: Bitcoin has shed nearly a quarter of its value in the last 30 days, with BTC trading around $70,537, according to CoinMarketCap. The linkage between ETF flows and price remains an evolving interplay, and investors are watching for how upcoming data and regulatory signals might shape the next leg of the cycle.
In the broader ecosystem, crypto analytics firms and market researchers have highlighted a pattern that may be drawing attention beyond immediate price moves. A widely cited analyst pointed out that the current period marks a historic phase in which consecutive outflows have occurred, raising questions about the implications for liquidity, volatility, and the resilience of BTC-linked products. Yet, this is not the first time the market has faced a testing environment, and some observers emphasize that Bitcoin’s fundamental narratives—scalability, network activity, and institutional adoption—remain central to the longer-term thesis.
Meanwhile, voices from the analytics community caution against a purely short-term lens. The market’s reaction to liquidity shifts, regulatory signals, and ETF flows can diverge from what is visible in day-to-day price movements. By examining the total inflows and outflows relative to the size of the market, investors can form a more balanced view of risk and opportunity in the BTC ETF space, rather than focusing solely on immediate losses or gains.
Eric Balchunas, a veteran ETF analyst, has emphasized that Bitcoin’s performance since 2022 has delivered outsized gains compared with gold and silver, arguing that those who judge BTC on a single year’s performance may be missing the broader arc. His comment underscores the importance of framing BTC’s story within a multiyear horizon, especially for investors considering exposure through spot BTC ETFs rather than direct spot markets. The ongoing debate about risk and return continues to shape how market participants approach BTC-focused ETFs and related products.
Ki Young Ju, CEO of CryptoQuant, summed up a meta-view that reflects a cautious mood among market participants: “every Bitcoin analyst is now bearish,” a remark that underscores the prevailing mood while leaving room for a counterpoint in a market that has historically proven contrarian at pivotal moments. The tension between bearish sentiment and the potential for a longer-term rebound remains a defining feature of BTC discourse as traders weigh the odds of a renewed upshift in price against continued macro uncertainty.
What to watch next
- Next wave of ETF flow data from Farside Investors and other researchers, which could show whether the contraction in inflows accelerates or stabilizes.
- Bitcoin price behavior over the next several weeks, particularly in response to macro cues and any regulatory developments impacting crypto markets.
- Further commentary from major ETF analysts and researchers on whether the current drawdown is a pause or the onset of a deeper correction.
- Updates on institutional participation in BTC-linked products, including any changes in flows into other crypto ETFs or related vehicles.
Sources & verification
- Preliminary net inflows data for spot BTC ETFs from Farside Investors (as cited in the article).
- Public X posts by James Seyffart discussing ETF holders’ performance and sentiment.
- Public X posts by Jim Bianco and Rand analyzing ETF holder underwater percentages and historical comparisons.
- Price data for Bitcoin from CoinMarketCap at the time of publication (BTC price around $70,537).
- Comments from Eric Balchunas regarding BTC’s performance since 2022 relative to other assets.
- Ki Young Ju’s remarks from CryptoQuant on market sentiment.
Bitcoin ETF flows and price action amid a four-month decline
US-based spot BTC ETFs are navigating a difficult phase that has stretched over several months, marked by a meaningful rally-to-correction cycle that has dragged prices lower while inflows have not collapsed as some bears expected. The conversation among analysts centers on a paradox: even as many investors sit underwater, the aggregate posture remains constructive enough to sustain a broad layer of market liquidity and investor confidence. From the vantage point of ETF market structure, the persistence of holdings and the scale of inflows before October point to a durable base of participants who view BTC exposure as a core, long-term component of a diversified portfolio rather than a speculative, short-term bet.
As price action remains volatile, the ETF community continues to balance risk and opportunity. The data show that, despite the downturn, the community of ETF holders has not rushed to exit en masse. This behavior aligns with a longer-run thesis that Bitcoin, despite reputational cycles, has established a persistent presence in institutional portfolios. The tension between near-term losses and longer-term potential remains a central theme in assessing BTC’s role within the ETF ecosystem, with analysts urging caution not to conflate short-term price dynamics with the asset’s ultimate trajectory.
In practical terms, the ongoing observation is that ETF inflows, while reduced from peak levels, still reflect a non-negligible demand for BTC exposure. The numbers suggest a market that is not capitulating, even as the price declines continue. For traders and investors, the key takeaway is that the ETF framework provides a stable, regulated channel for exposure that can influence liquidity dynamics in ways that are distinct from the spot market alone. The evolving narrative around ETF flows—alongside Bitcoin’s price path and macro signals—will continue to shape market psychology and the pace of the next leg in BTC’s cycle.
For readers who want to verify the underlying data and quotes, the linked posts and price data points in this report provide direct sources. The discussion around ETF flows, price levels, and analyst commentary reflects a broad cross-section of market voices, each contributing to a composite view of a market that remains highly reactive to both micro and macro catalysts. As regulation, classification of crypto assets, and ETF product design continue to mature, observers anticipate that flows into BTC-linked vehicles will adjust in response to evolving expectations for risk, return, and liquidity in the crypto space.
The subscription template at the end of the article is included to reflect ongoing engagement opportunities for readers seeking deeper insights into crypto market dynamics.
Notes: The coverage above preserves the factual statements and linked references as presented, while restructuring them into a professional, journalistic narrative. No promotional boilerplate from the publisher is included in this rewritten article.

Crypto World
Stablecoins can help businesses turn costs into revenue, but not everyone needs to issue a token:


Stablecoins, the $300 billion class of digital dollars, may have started as a faster way to move money across the globe, but companies are now asking a different question: what can they actually do with them?
That shift is driving a new phase of adoption, according to Chunda McCain, co-founder of Paxos Labs, who says the industry is moving beyond basic infrastructure toward real business use cases.
“The first step was getting a stablecoin,” McCain said in an interview with CoinDesk. “The next question is: what now?”
Last week, Paxos Labs underscored that direction by raising $12 million in a strategic funding round led by Blockchain Capital, with participation from Robot Ventures, Maelstrom and Uniswap. The lab unit was incubated under Paxos, the New York-based digital asset firm behind popular stablecoins such as PayPal’s PYUSD (PYUSD) and the Global Dollar (USDG). Paxos itself builds stablecoins and the immediate underlying infrastructure, while Paxos Labs intends to build tooling for further use of those stablecoins.
With the fresh funds, Paxos Labs is building what it calls a “financial utility stack” that lets companies turn digital assets into products through a single integration.
Its newly launched Amplify Suite bundles three core tools: Earn, which offers yield on digital assets; Borrow, which enables lending against them; and Mint, which supports branded stablecoin issuance. The idea behind that is to let firms integrate tokens into a business, then layer on capabilities over time.
Turning cost into revenue
For years, enterprise crypto adoption focused on “first-touch” capabilities like trading, custody or issuing a stablecoin. Those steps opened the door but rarely generated returns on their own, according to McCain
“Stablecoins [have been] loss leaders for years,” he said.
The opportunity lies in how those assets are used. Payments are a clear example: merchants typically give up 2% to 3% in fees, while stablecoin rails can reduce those costs and even generate yield on balances held onchain.
“You turn what has always been a cost into revenue,” he said.
Some of the more novel use cases sit at the intersection of payments and credit. Payment providers already track merchant revenues and cash flow, which puts them in a position to underwrite loans, McCain argued.
That could allow merchants to access financing based on real-time performance, while earning yield on incoming payments and settling instantly across borders. These models are still early, but the building blocks are starting to come together, he said.
Not every firm needs its own token
To capture these benefits, not every firm needs its own stablecoin.
While companies like PayPal have launched branded tokens to control payments and margins, issuing one requires significant investment in liquidity, compliance and distribution.
“If you just need the economics, you don’t need to build your own,” McCain said.
Many firms can instead integrate existing stablecoins and still benefit from lower costs and added yield.
The shift may lack the hype when big firms like Western Union announce their own token, but it carries tangible impact on how businesses operate.
Stablecoins are starting to reshape margins, unlock credit and change how money moves globally, especially where traditional systems remain costly or slow.
“It might sound boring, but this is the math,” McCain said.

TLDR:
- The Federal Reserve recorded an $18.7 billion loss in 2025, marking its third consecutive year in the red.
- Rising interest payments on reserves and reverse repos continue to exceed income from bond holdings.
- Losses peaked in 2023 and narrowed by 2025, signaling a gradual shift as rate pressures stabilize.
- The Fed has paused Treasury remittances after years of profit, reflecting ongoing balance-sheet strain.
The U.S. Federal Reserve reported a third straight annual operating loss in 2025, extending a rare financial stretch. The latest figures showed a loss of $18.7 billion, continuing a trend that began in 2023 after a long period of steady profitability.
Fed Losses Extend Into Third Year
Recent data shared in a post by The Kobeissi Letter confirmed the central bank’s ongoing losses. The tweet noted that total losses reached $210.3 billion over three years.
It also pointed out that 2023 recorded the deepest loss, followed by a smaller deficit in 2024 and a narrower gap in 2025.
https://twitter.com/KobeissiLetter/status/2045690597764186307?s=20
The post explained that the losses stem from higher interest payments to banks and money market funds. At the same time, income from bonds and mortgage-backed securities remained lower. This gap between expenses and earnings has kept the Federal Reserve in negative territory since September 2022
Before this period, the central bank had a long record of profits. From 2000 to 2007, earnings remained stable between $20 billion and $35 billion. However, profits surged after the 2008 financial crisis as policy rates dropped and asset purchases increased.
Between 2009 and 2015, profits rose sharply, reaching a peak of around $115 billion. During those years, the Federal Reserve held large amounts of higher-yielding securities while funding costs stayed near zero. As a result, earnings remained elevated for several years.
Rate Hikes Shift Financial Structure
The financial position began to change as interest rates increased. From 2016 to 2022, profits started to decline, although they remained positive. Earnings moved within a range of $55 billion to $105 billion during that period.
Conditions shifted in 2023 when aggressive rate increases raised borrowing costs across the system. The Federal Reserve began paying higher interest on reserves and reverse repurchase agreements. Meanwhile, returns from its existing bond portfolio remained fixed at lower rates.
This shift caused expenses to exceed income, leading to the first annual loss in decades. The deficit reached about $115 billion in 2023, marking the lowest point in the data series. Losses continued in 2024 at roughly $80 billion before easing in 2025.
At the same time, the Federal Reserve stopped sending profits to the U.S. Treasury. This pause ended a long streak of remittances that had totaled over $1.36 trillion since 2008. The change reflects the current financial position rather than a structural limitation.
Despite the losses, the Federal Reserve continues normal operations. The system allows it to manage shortfalls without facing solvency concerns. The central bank records deferred assets instead of halting its functions.
Recent figures show that the scale of losses has started to narrow. The move from deeper deficits toward a smaller loss in 2025 signals a shift in pace. Future results will depend on interest rate trends and changes in funding costs.


Cybersecurity and enterprise software stocks have been market dogs in 2026, with fears that AI will wipe out a wide range of companies in the enterprise space dominating the narrative. But they snapped a brutal losing streak this past week, joining in the broader market rally that saw all losses from the U.S.-Iran war regained by the Dow Jones Industrial Average and S&P 500.
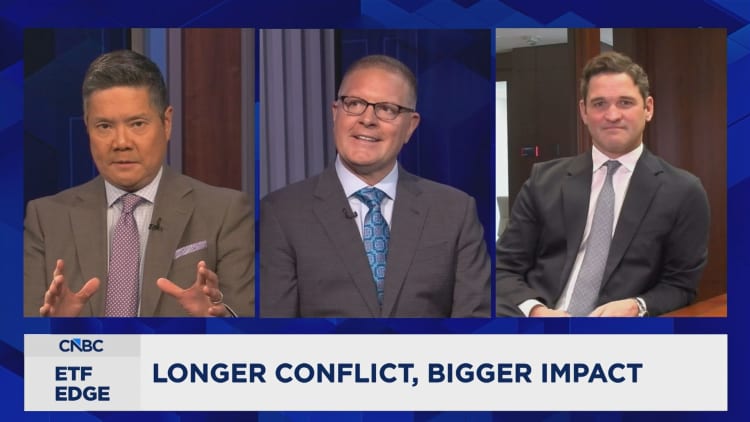
Cybersecurity has been “a victim of some of the AI-related headlines,” Christian Magoon, Amplify ETFs CEO, said on this week’s “ETF Edge.”
It wasn’t just niche cybersecurity names. Take Microsoft, for example, which was recently down close to 20% for the year. Its shares surged last week by 13%.
A big driver of the pummeling in software stocks was a rotation within tech by investors to AI infrastructure and semiconductors and some other names in large-cap tech, Magoon said, and since cybersecurity stocks and ETFs are heavily weighted towards software companies, they were left behind even as those businesses continue to grow on a fundamental basis.
But Wall Street now has become more bullish with the stocks at lower levels. Brent Thill, Jefferies tech analyst, said last week that the worst may be over for software stocks. “I think that this concept that software is dead, and then Anthropic and OpenAI are going to kill the entire industry, is just over-exaggerated,” he said on CNBC’s “Squawk Box” on Wednesday.
“Big Short” investor Michael Burry wrote in a Substack post on Wednesday that he is becoming bullish about software stocks after the recent selloff. “Software stocks remain interesting because of accelerated extreme declines last week arising from a reflexive positive feedback loop between falling software stocks and changes in the market for their bank debt,” he wrote.
The Global X Cybersecurity ETF (BUG), is down about 12% since the beginning of the year, with top holdings including Palo Alto Networks, Fortinet, Akamai Technologies and CrowdStrike. But BUG was up 12% last week. The First Trust NASDAQ Cybersecurity ETF (CIBR) is down 6% for the year, but up 9% in the past week.
Piper Sandler analyst Rob Owens reiterated an “overweight” rating on Palo Alto Networks which helped the stock pop 7% — it is now down roughly 6% on the year. Its peers saw similar moves, including CrowdStrike.

Performance of Global X cybersecurity ETF versus S&P 500 over past one-year period.
Magoon said expectations may have become too high in cybersecurity, and with a crowding effect among investors, solid results were not enough to to push stocks higher. But the down-and-then-back-up 2026 for the sector is also a reminder that when stocks fall sharply in a short period of time, opportunity may knock.
“Once you’re down over 10% in some of these subsectors, you start to see the contrarians start to say, ‘well, maybe I’ll take a look at this,’” Magoon said.
He said AI does add both opportunity and uncertainty to the cybersecurity equation, increasing demand but also introducing new competition. But he added, “I think the dip is good to buy in an AI-driven world,” specifically because the risks to companies may lead to more M&A in cyber names that benefits the stocks.
For now, investors may look for opportunity on the margins rather than rush back into beaten-up tech names. “I think investors are still going to remain underweight software,” Thill said.
But Magoon advises investors to at least take the reminder to keep an eye on niches in the market during pronounced downturns. “The best-performing are often the least bought and do the best over the next 12 months versus late-in-the-game piling on,” he said.
While that may have been a mindset that worked against the last investors into cybersecurity and enterprise software in mid-2025 when the negative sentiment started building, at least for now, it’s started working for the stocks in the sector again.
Meanwhile, this year’s biggest winner is also a good example of what can be an extended trade in either a bullish or bearish direction. Last year, institutional ownership of energy was at multi-year lows, Magoon said, referencing Bank of America data. “Reverse sentiment can be a great indicator,” he said.
But he cautioned that any selective buying of stocks that have dipped does have to contend with the risk that there is a potentially bigger drawdown in the market yet to come in 2026. That is because midterm election years historically have been marked by large drawdowns. “If you think it is bad right now, it could get a lot worse,” Magoon said. But he added that there’s a silver-lining in that data, too, for the patient investor. The market has posted very strong 12-month returns after midterm election drawdowns end. So, for investors with a longer-term time horizon and no need for short-term liquidity, Magoon said, “stick in there.”
Sign up for our weekly newsletter that goes beyond the livestream, offering a closer look at the trends and figures shaping the ETF market.


Spot Bitcoin exchange-traded funds have recorded their strongest weekly inflows in several months.
Summary
- Bitcoin ETFs recorded nearly $1 billion inflows, marking strongest weekly performance since mid-January period.
- Ethereum and XRP ETFs followed with steady inflows, reflecting renewed investor interest across crypto markets.
- Rising ETF demand coincides with improved sentiment but ongoing geopolitical uncertainty still affects market stability.
Data shows that nearly $1 billion entered these funds over the past week, marking the best performance since mid-January.
April 17 stood out as the most active day, with over $663 million in net inflows. Among the leading products, BlackRock’s IBIT attracted the largest share, followed by Fidelity’s FBTC.
The weekly trend included only one day of outflows, while the rest of the sessions recorded steady inflows. This pattern reflects renewed investor activity after a period of lower demand.
Ethereum ETFs maintain positive momentum
Ethereum-based exchange-traded funds also posted consistent inflows during the same period. The funds extended a multi-day streak of positive performance, supported by ongoing market recovery.
Over the past week, Ethereum ETFs recorded more than $275 million in inflows. This represents the highest weekly total since January for these products.
Fidelity’s FETH led the inflows among Ethereum funds, followed by BlackRock’s ETHA. Other products also contributed smaller amounts, maintaining overall positive movement.
XRP and other assets see increased interest
XRP-linked exchange-traded funds also recorded notable gains. The products attracted over $55 million during the week, marking a three-month high in inflows.
Other digital asset funds, including those tracking Solana, reported moderate inflows as well. These movements suggest broader participation across multiple crypto-based investment products.
The rise in ETF activity across Bitcoin, Ethereum, and XRP points to a short-term increase in investor engagement within the sector.
Market conditions and ongoing uncertainty
The increase in ETF inflows followed improved sentiment linked to developments in global events. Reports of easing tensions earlier in the week supported market confidence.
However, conditions remain uncertain as new statements from U.S. and Iranian officials have created mixed signals. The situation has added volatility to financial markets, including cryptocurrencies.
Bitcoin and other digital assets continue to respond to external developments. Investors are monitoring both geopolitical updates and market data as ETF flows remain active.
Crypto World
Market Preview: Tesla (TSLA) Earnings and Iran Diplomacy Dominate This Week’s Trading Focus

Key Takeaways
- Major indices achieved fresh record territory last week, extending their winning streak to three consecutive weeks
- Tesla’s Q1 financial results arrive Wednesday, with focus on artificial intelligence and robotics initiatives
- Diplomatic progress with Iran regarding the Strait of Hormuz sent crude oil prices tumbling
- The Magnificent Seven technology stocks surged 9% in just five trading sessions
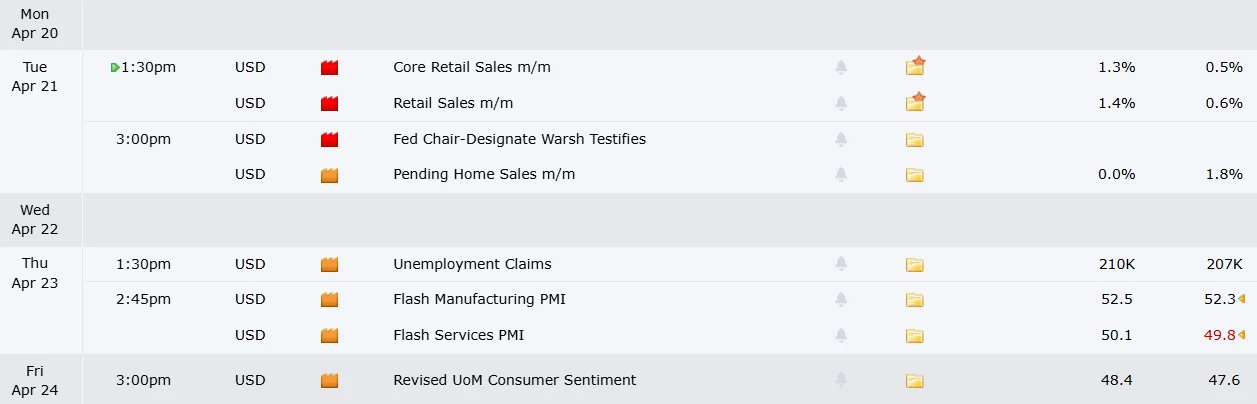
- Consumer spending patterns will be revealed Tuesday with the release of March retail sales figures
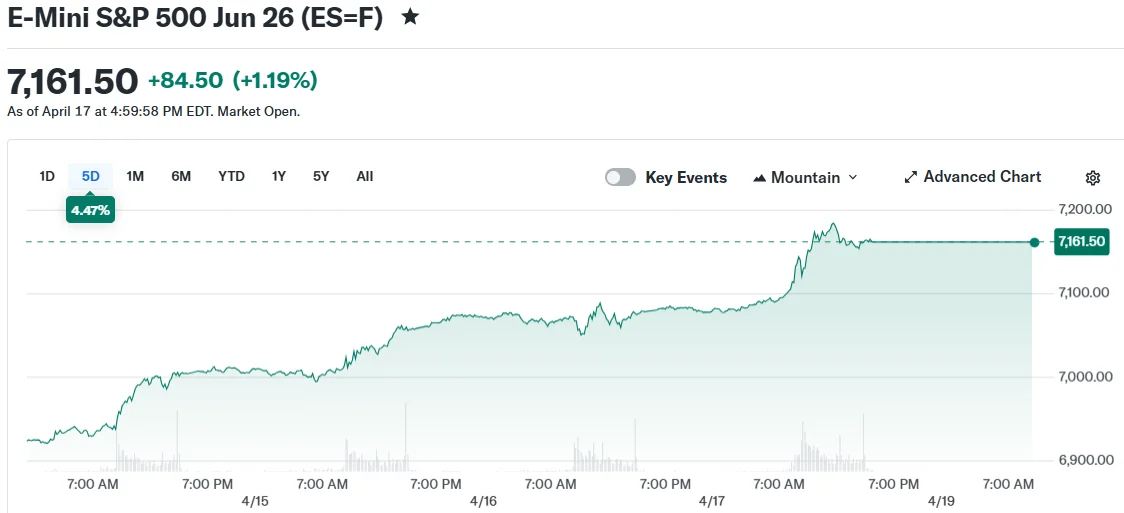
Equity markets delivered another impressive performance as benchmark indices pushed to unprecedented levels. The S&P 500 surged 4.5% during the trading week, while the Nasdaq climbed 6.8% and the Dow Jones Industrial Average advanced 3.2%. This marked the third straight week of positive returns across all three major indices.
The market surge was primarily fueled by encouraging developments in diplomatic relations between Washington and Tehran. Iran’s top diplomat announced Friday that the strategically vital Strait of Hormuz remained “completely open” to global shipping operations. President Trump confirmed Iran had committed to halting its uranium enrichment activities and pledged never to obstruct the critical waterway again. Additional diplomatic discussions were slated for the weekend.
Crude oil prices experienced significant declines following the diplomatic breakthrough. Energy analysts at Rystad Energy characterized the development as a “market-moving development of the first order.” However, industry observers cautioned that normalizing oil markets could require several weeks or even months. Numerous vessels remain stranded in Persian Gulf waters, while Middle Eastern crude production has declined by approximately 12.4 million barrels daily.
The elite group of Magnificent Seven technology stocks, monitored through a specialized exchange-traded fund, posted a remarkable 9% gain across five consecutive sessions and are nearing their historical peak values. Taiwan Semiconductor delivered first-quarter financial results that exceeded analyst projections, posting earnings per share growth of 66% compared to the previous year and revenue expansion of 40%.
According to HSBC’s Americas equity strategy chief, market participants should anticipate a “banner Q1 earnings season,” with technology stocks generating the greatest investor enthusiasm. The Magnificent Seven are projected to deliver 20% earnings expansion, significantly outpacing the 12% growth forecast for remaining S&P 500 constituents.
Tesla in the Spotlight
Tesla releases its first-quarter performance metrics on Wednesday. The electric vehicle manufacturer snapped an eight-week decline on Friday. Chief Executive Elon Musk revealed that Tesla has reached the concluding design phases for its AI5 semiconductor, engineered for electric vehicles, training infrastructure, and Optimus humanoid robots. Reuters additionally disclosed that Tesla is recruiting semiconductor specialists in Taiwan.
Tesla has unveiled ambitions to manufacture proprietary semiconductors at a proposed facility designated Terafab, with Intel serving as a strategic collaborator. Market analysts note that establishing internal chip manufacturing capabilities would represent an enormous technical undertaking.
UBS analyst Joseph Spak observed that the stock “trades more on sentiment, narrative and momentum than fundamentals.” He identified potential headwinds including electric vehicle demand concerns, energy infrastructure constraints, and gradual advancement on autonomous taxi services and Optimus development, while maintaining his view of Tesla as a frontrunner in physical artificial intelligence applications.
Additional Market Events
Intel releases quarterly results Thursday. The semiconductor giant reached its highest intraday valuation since 2000 during Friday’s trading session.
Airline sector reports from Alaska Air, United Airlines, and American Airlines will reveal how aviation companies are navigating elevated jet fuel expenses. United Airlines’ CEO Scott Kirby recently suggested a possible takeover of American Airlines.
Tuesday delivers the Census Bureau’s March retail sales report. Economic forecasters anticipate a 1.3% monthly increase. The University of Michigan’s consumer sentiment index on Friday will also attract significant attention. Its preliminary April measurement plunged to a historic nadir of 47.6 earlier this month.
UnitedHealth Group announces results Tuesday, with shares facing headwinds from reports of a probe into its insurance billing procedures and an unanticipated executive transition.
Jefferies analyst Michael Toomey warned that the technology sector may be “very near the end of this rally,” and that markets will “consolidate in the near-term.”

Recent on-chain data shows a sharp rise in Bitcoin (BTC) movement to exchanges.
Summary
- Binance inflow CDD spike suggests long-term Bitcoin holders moving funds to exchanges for profit-taking.
- NUPL indicator rise signals improving sentiment and growing unrealized profits among Bitcoin investors.
- Bitcoin Composite Index remains above 1.0, indicating no confirmed market bottom formation yet.
On April 14, Binance recorded a major spike in Exchange Inflow Coin Days Destroyed (CDD), reaching about 2.59 million.
Analysts link this surge to long-term holders moving older coins. This behavior often appears when investors prepare to take profits after price recovery phases.
The spike occurred as Bitcoin climbed back toward the $75,000 range. Data suggests that older holdings, which remained inactive for long periods, are now entering exchanges.
Analyst CryptoOnchain stated ”this surge suggests long-term holders are securing profits” while referring to the timing of the inflow spike.
NUPL indicator signals rising market confidence
Another on-chain metric, Net Unrealized Profit/Loss (NUPL), has also shown movement. The indicator recently climbed to around 0.29, its highest level since late January.
This level is commonly linked to the “belief” phase in market cycles. It reflects growing unrealized profits among investors and a shift toward positive sentiment.
Analyst Arab Chain noted ”the market is showing renewed optimism and rising profits” based on the recent NUPL trend. The increase follows a period of volatility earlier in the year.
The indicator suggests that the market has regained balance after recent declines. It also shows signs of new capital entering the market.
Composite Index shows no clear bottom formation
The Bitcoin Composite Index (BCI), which combines NUPL and MVRV data, remains above the key level of 1.0. Analysts use this level to assess whether the market has reached a bottom.
Historical data shows that strong accumulation phases often occur when the index drops below this threshold. Current readings suggest that such conditions have not yet been reached.
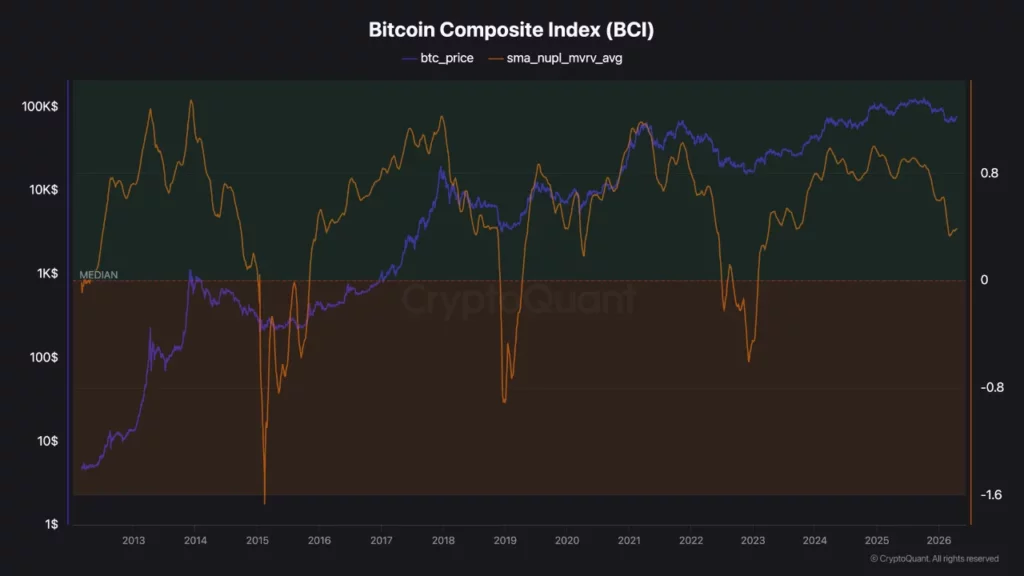
Analyst Zizcrypto stated ”the index remains above bottom levels, indicating normalization rather than full reset” when describing the current position.
This reading points to a market that is stabilizing rather than entering a deep accumulation phase.
Price movement and market conditions
Bitcoin recently failed to hold above $78,400 and has moved closer to $75,000. The price drop followed renewed geopolitical tension linked to developments in the Middle East.
The asset had earlier gained momentum after reports of progress in diplomatic talks. It moved from below $70,500 to above $76,000 before reaching a local high.
Market uncertainty returned after conflicting updates regarding the Strait of Hormuz. This led to a price correction of more than $3,000 from the peak.
The broader crypto market also declined, with total market value dropping by around $100 billion.
Disclosure: This article does not represent investment advice. The content and materials featured on this page are for educational purposes only.

Quick Summary
- Rakuten CEO Hiroshi Mikitani offloaded approximately $154.5M worth of ASTS shares, contributing to ~$274M in total insider sales last quarter
- The BlueBird 7 satellite deployment was postponed to April 19 from Kennedy Space Center
- Deutsche Bank reduced its price projection from $139 down to $117, referencing Amazon’s Globalstar purchase
- Short positions reached their highest level in eight months amid growing skepticism
- Major institutional players like Vanguard and Invesco expanded their holdings despite the turbulence
AST SpaceMobile (ASTS) endured a turbulent week as shares slid approximately 6%, pressured by a confluence of insider transactions, operational setbacks, and Wall Street recalibrations.
The most significant development came from Rakuten’s billionaire founder Hiroshi Mikitani, who liquidated 1.69 million shares on April 14 at an average execution price of $91.42, representing approximately $154.5 million. This substantial transaction rattled investor confidence. Taking a broader view, company insiders collectively divested roughly 3.08 million shares during the previous quarter, totaling approximately $274 million. Current insider ownership stands at around 30.9%.
Adding to the selling activity, Chief Technology Officer Huiwen Yao disposed of 40,000 shares on March 23 at $88.88, slashing his holdings by nearly 90%. Following this transaction, Yao retained just 4,750 shares.
BlueBird 7 Deployment Timeline Shifts
The BlueBird 7 satellite deployment, previously slated for an earlier date, has been rescheduled for April 19. The spacecraft will lift off from Kennedy Space Center aboard Blue Origin’s New Glenn-3 rocket, with the launch window opening at 6:45 a.m. and closing at 8:45 a.m. EDT.
This satellite features a sophisticated phased-array antenna spanning approximately 2,400 square feet, engineered to provide direct-to-device broadband connectivity to conventional smartphones. The system supports peak throughput exceeding 120 Mbps utilizing both 4G and 5G technologies.
A successful deployment would represent a critical technological validation for the company. ASTS maintains partnerships with more than 50 mobile network operators worldwide, collectively serving nearly 3 billion subscribers. Strategic partners encompass AT&T, Verizon, Vodafone, and Google.
The postponement amplified investor uncertainty. Short interest surged to its highest point in eight months as market participants adopted defensive positions ahead of the mission.
Wall Street Reassessments Intensify
Deutsche Bank trimmed its price objective from $139 to $117, highlighting competitive headwinds following Amazon’s announcement to acquire Globalstar. This development sparked concerns regarding ASTS’s competitive positioning within the satellite communications sector.
Scotiabank adopted a more aggressive stance, downgrading ASTS to “sector underperform” with a $45.60 target. B. Riley lowered its objective from $105 to $95 while maintaining a neutral stance. The consensus rating currently registers as “Reduce” with an average target of $77.10, substantially below present trading levels.
However, bearish sentiment isn’t universal. Deutsche Bank maintains its $117 projection. Jim Cramer offered favorable commentary about the stock during Mad Money. Barclays elevated its target to $65 from $60 following the successful BlueBird 6 deployment with ISRO, though maintaining an Underweight rating.
On the institutional front, Vanguard expanded its position by 13.4% in Q3 to nearly 20 million shares. Invesco amplified its stake by over 600%, while VanEck more than doubled its holdings. Overall institutional ownership currently represents approximately 61%.
ASTS disclosed Q4 2025 financial results on March 2, reporting revenue of $54.31 million, significantly exceeding the $39.53 million consensus forecast. EPS registered at -$0.26, falling short of the -$0.18 estimate. Management projected 2026 revenue between $150 million and $200 million.
Shares opened Friday trading at $85.53, positioned between the 50-day moving average of $88.90 and the 200-day moving average of $83.34. The 12-month trading range extends from $20.26 to $129.89.
Crypto World
Definium Therapeutics (DFTX) Stock Climbs Following White House Psychedelic Policy Shift

Key Takeaways
- Definium Therapeutics voiced support for a White House Executive Order promoting mental health innovation through psychedelic therapies
- The biotech firm is advancing DT120 ODT (lysergide tartrate), a next-generation LSD formulation, targeting GAD and MDD
- DT120 holds FDA Breakthrough Therapy Designation with four ongoing Phase 3 clinical trials
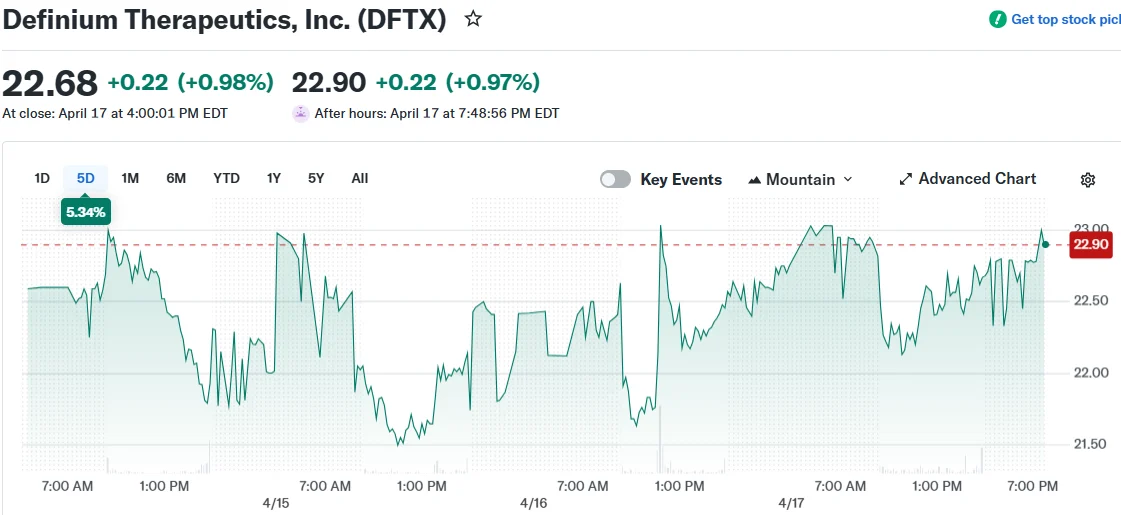
- On April 17, Stifel launched coverage with a Buy recommendation and $30 price target, compared to the current ~$22.46 trading level
- Recent insider transactions reveal zero stock purchases and approximately $0.8M in sales during the previous three months
On April 19, Definium Therapeutics (DFTX) released a public statement endorsing a recently signed White House Executive Order designed to fast-track approval for psychedelic-derived mental health interventions. Shares advanced 0.98% following the announcement.
The presidential directive instructs federal departments to make mental health therapies a top priority, reduce regulatory barriers, and enhance interagency cooperation. The order explicitly identifies psychedelic compounds as promising resources in combating America’s mental health emergency.
Chief Executive Rob Barrow praised the directive, describing it as “an important recognition of the persistent unmet treatment needs in serious mental illness.” He emphasized the company’s commitment to progressing its comprehensive clinical development program for DT120 in patients suffering from generalized anxiety disorder (GAD) and major depressive disorder (MDD).
DT120 ODT represents Definium’s lead therapeutic candidate. The compound is a scientifically refined formulation of lysergide tartrate — the tartrate salt variant of LSD — created using Catalent’s proprietary Zydis rapid-dissolve platform.
This innovative delivery system enables quicker absorption, enhanced bioavailability, and reduced digestive system complications versus conventional administration routes. The molecule functions as a partial agonist targeting serotonin-2A receptors.
DT120 has secured FDA Breakthrough Therapy Designation. Definium is presently conducting four Phase 3 clinical studies, which represent pivotal milestones for potential commercialization.
Stifel Launches Coverage With Bullish Outlook, $30 Price Objective
Just two days prior to the White House policy announcement, Stifel commenced coverage of DFTX on April 17 with a Buy rating and established a $30.00 price objective. With shares trading near $22.46 at that juncture, the target suggests approximately 34% potential appreciation.
The coverage launch signals increasing institutional attention toward the psychedelic therapeutics sector as regulatory tailwinds strengthen.
Some Warning Indicators Worth Monitoring
However, certain metrics warrant caution. Definium’s GF Score registers at merely 38 out of 100, accompanied by a profitability ranking of 1 out of 10 — consistent with the company’s pre-commercial, development-phase position.
Financial strength fares considerably better at 7 out of 10, indicating a relatively solid balance sheet foundation. Momentum achieves a score of 6, matching recent stock performance trends.
Insider transaction patterns during the past three months present a somewhat concerning picture. Zero insider buying activity has occurred, while company insiders have divested $0.8 million in shares. Though such unidirectional selling isn’t uncommon for early-stage biotechnology companies, it merits attention.
The company maintains a market capitalization of roughly $2.24 billion.
The White House policy directive complements Definium’s current clinical development strategy, and management indicated eagerness to maintain collaborative efforts with government agencies, healthcare professionals, and patient advocacy organizations.
Definium’s DT120 is undergoing evaluation for GAD, MDD, and additional severe neurological conditions. The company operates from its New York headquarters and maintains a listing on Nasdaq.


Ethereum has become the center of discussion after a statement suggested that banks could rely on its network in the future.
Summary
- Raoul Pal claims Ethereum could become core infrastructure used by banks in future financial systems.
- Bill Morgan reacts as crypto community debates whether banks will adopt Ethereum technology widely.
- Discussion follows FXRP transfer pause, raising questions about blockchain interoperability and system reliability issues.
The claim was made by macro investor Raoul Pal, who argued that Ethereum has long-term relevance in financial systems.
Pal dismissed suggestions that Ethereum is losing relevance. He described such views as ”hilarious” and pointed to its continued development and adoption as reasons for confidence.
He also stated that banks tend to adopt technologies with strong track records. Based on this, he said ”all banks will use Ethereum” when referring to future financial infrastructure.
The statement triggered a wide range of reactions across the crypto community. Some participants questioned the claim and suggested that traditional banking systems may not rely on a single blockchain network.
Pro-crypto lawyer Bill Morgan responded by sharing the statement, which some interpreted as a sarcastic reaction. He did not clearly confirm support or opposition to the claim.
Several users argued that the relationship between banks and blockchain networks remains uncertain. The discussion reflected ongoing differences in views about how financial institutions may adopt digital assets.
Context Linked to Cross-Network Developments
The debate followed developments involving FXRP and cross-network activity. Transfers linked to FXRP were temporarily paused as a precaution after an issue connected to rsETH.
The pause affected movement between networks such as Flare and Ethereum. Users holding FXRP outside the Flare network were unable to complete redemptions until assets are returned to the main network.
Despite the pause, core operations on the Flare network continued without disruption. The situation added context to the broader discussion about blockchain interoperability and system reliability.
Meanwhile, Ethereum continues to trade actively in the digital asset market. At press time, the asset is priced near $2,300 with daily trading volume exceeding $14 billion.
The token has recorded a weekly gain of over 6 percent despite a slight daily decline, based on CoinGecko data. Market capitalization remains above $280 billion based on current supply levels.


The Pi Network Core Team has outlined its position on user growth, stating that verified identities play a central role in its ecosystem.
Summary
- Pi Network reports over 18 million verified users through its identity-based KYC system.
- Team claims verified users provide stronger trust compared to unverified wallet counts on other networks.
- Community response shows growing support for identity verification as core feature in blockchain ecosystems.
Meanwhile, the team reported that the network now has over 18 million identity-verified users. The project emphasized that this figure differs from standard wallet counts seen on other blockchain networks. It stated that ”1 million verified users on Pi is not equal to 1 million users on other networks” when comparing growth metrics.
The team explained that many blockchain platforms measure adoption through wallet creation, which may include inactive or unverified accounts.
Pi Network has built its system around identity verification through Know Your Customer (KYC) processes. The Core Team said this approach helps reduce spam and ensures that users are real individuals.
The project stated that ”verified identities are needed for meaningful transactions” in digital economies. According to the team, this supports trust between participants when assets are transferred.
The network aims to create a system where each transaction can be linked to a verified participant. This model is designed to support real-world use cases and economic activity.
Community response shows increased support
Recent statements from the Core Team have received mixed reactions in the past. However, this update saw more supportive responses from community members.
Some users noted that reaching millions of verified users before full smart contract deployment is an important step. One response stated that ”this level of verified distribution stands out compared to other networks” in public discussion.
Other comments pointed to the scale of the KYC process and its role in building a structured user base. The discussion reflected growing engagement from the community.
Moreover, Pi Network continues to operate with ongoing development of its ecosystem. The project has yet to fully enable certain features, including broader smart contract functionality.
At press time, the token traded near $0.17 with a market capitalization of around $1.7 billion. Trading volume remains active, with moderate price movement over the past week.

Why does France still control the money of 14 African nations? #history
Celtic beat St Mirren 6-2 to reach Scottish Cup final after extra time drama

Carney says Canada’s US ties have become a weakness


-
 NewsBeat7 days ago
Pep Guardiola and Gary Neville agree over Arsenal title problem that benefits Man City
-

 Crypto World6 days ago
The SEC Conditionalises DeFi Platforms to Be Avoided for Broker Registration
-

 Fashion2 days ago
Weekend Open Thread: Theodora Dress
-

 Crypto World6 days ago
SEC Signals Exemption for Crypto Interfaces From Broker Registration
-

 News Videos4 days ago
Secure crypto trading starts with an FIU-registered
-

 Sports2 days ago
NWFL Suspends Two Players Over Post-Match Clash in Ado-Ekiti
-

 Crypto World5 days ago
SEC Proposes Certain Crypto Interfaces Don’t Need to Register as Brokers
-

 NewsBeat5 days ago
Trump and Pope Leo: Behind their disagreement over Iran war
-

 Business2 hours ago
Powerball Result April 18, 2026: No Jackpot Winner in Powerball Draw: $75 Million Rolls Over
-

 Politics2 days ago
Palestine barred from entering Canada for FIFA Congress
-

 Crypto World2 days ago
Russia Pushes Bill to Criminalize Unregistered Crypto Services
-

 Sports6 days ago
NWFL opens Pathway for new Clubs ahead of 2026 Season
-
 Business3 days ago
Creo Medical agree sale of its manufacturing operation
-

 Politics7 hours ago
Zack Polanski demands ‘council homes not luxury flats for foreign investors’
-

 Crypto World6 days ago
Trump whales load up ahead of Mar-a-Lago luncheon.
-
 Entertainment6 days ago
Brand New Day’ Footage Reveals the Devastating Impact of ‘Now Way Home’
-
Business6 days ago
Kering slides after Morgan Stanley downgrade, Gucci woes loom
-

 Tech6 days ago
Google adds E2E encryption to Gmail for iOS and Android enterprise users
-
Crypto World7 days ago
Sei Network Enters Quiet Reset Phase as On-Chain Metrics Signal a Slowdown in 2026
-

 Tech6 days ago
Apple glasses won’t go brand shopping like Meta did with Ray-Ban and Oakley
You must be logged in to post a comment Login