
Crypto World
Binance price eyes $615 fibonacci support as oversold conditions build
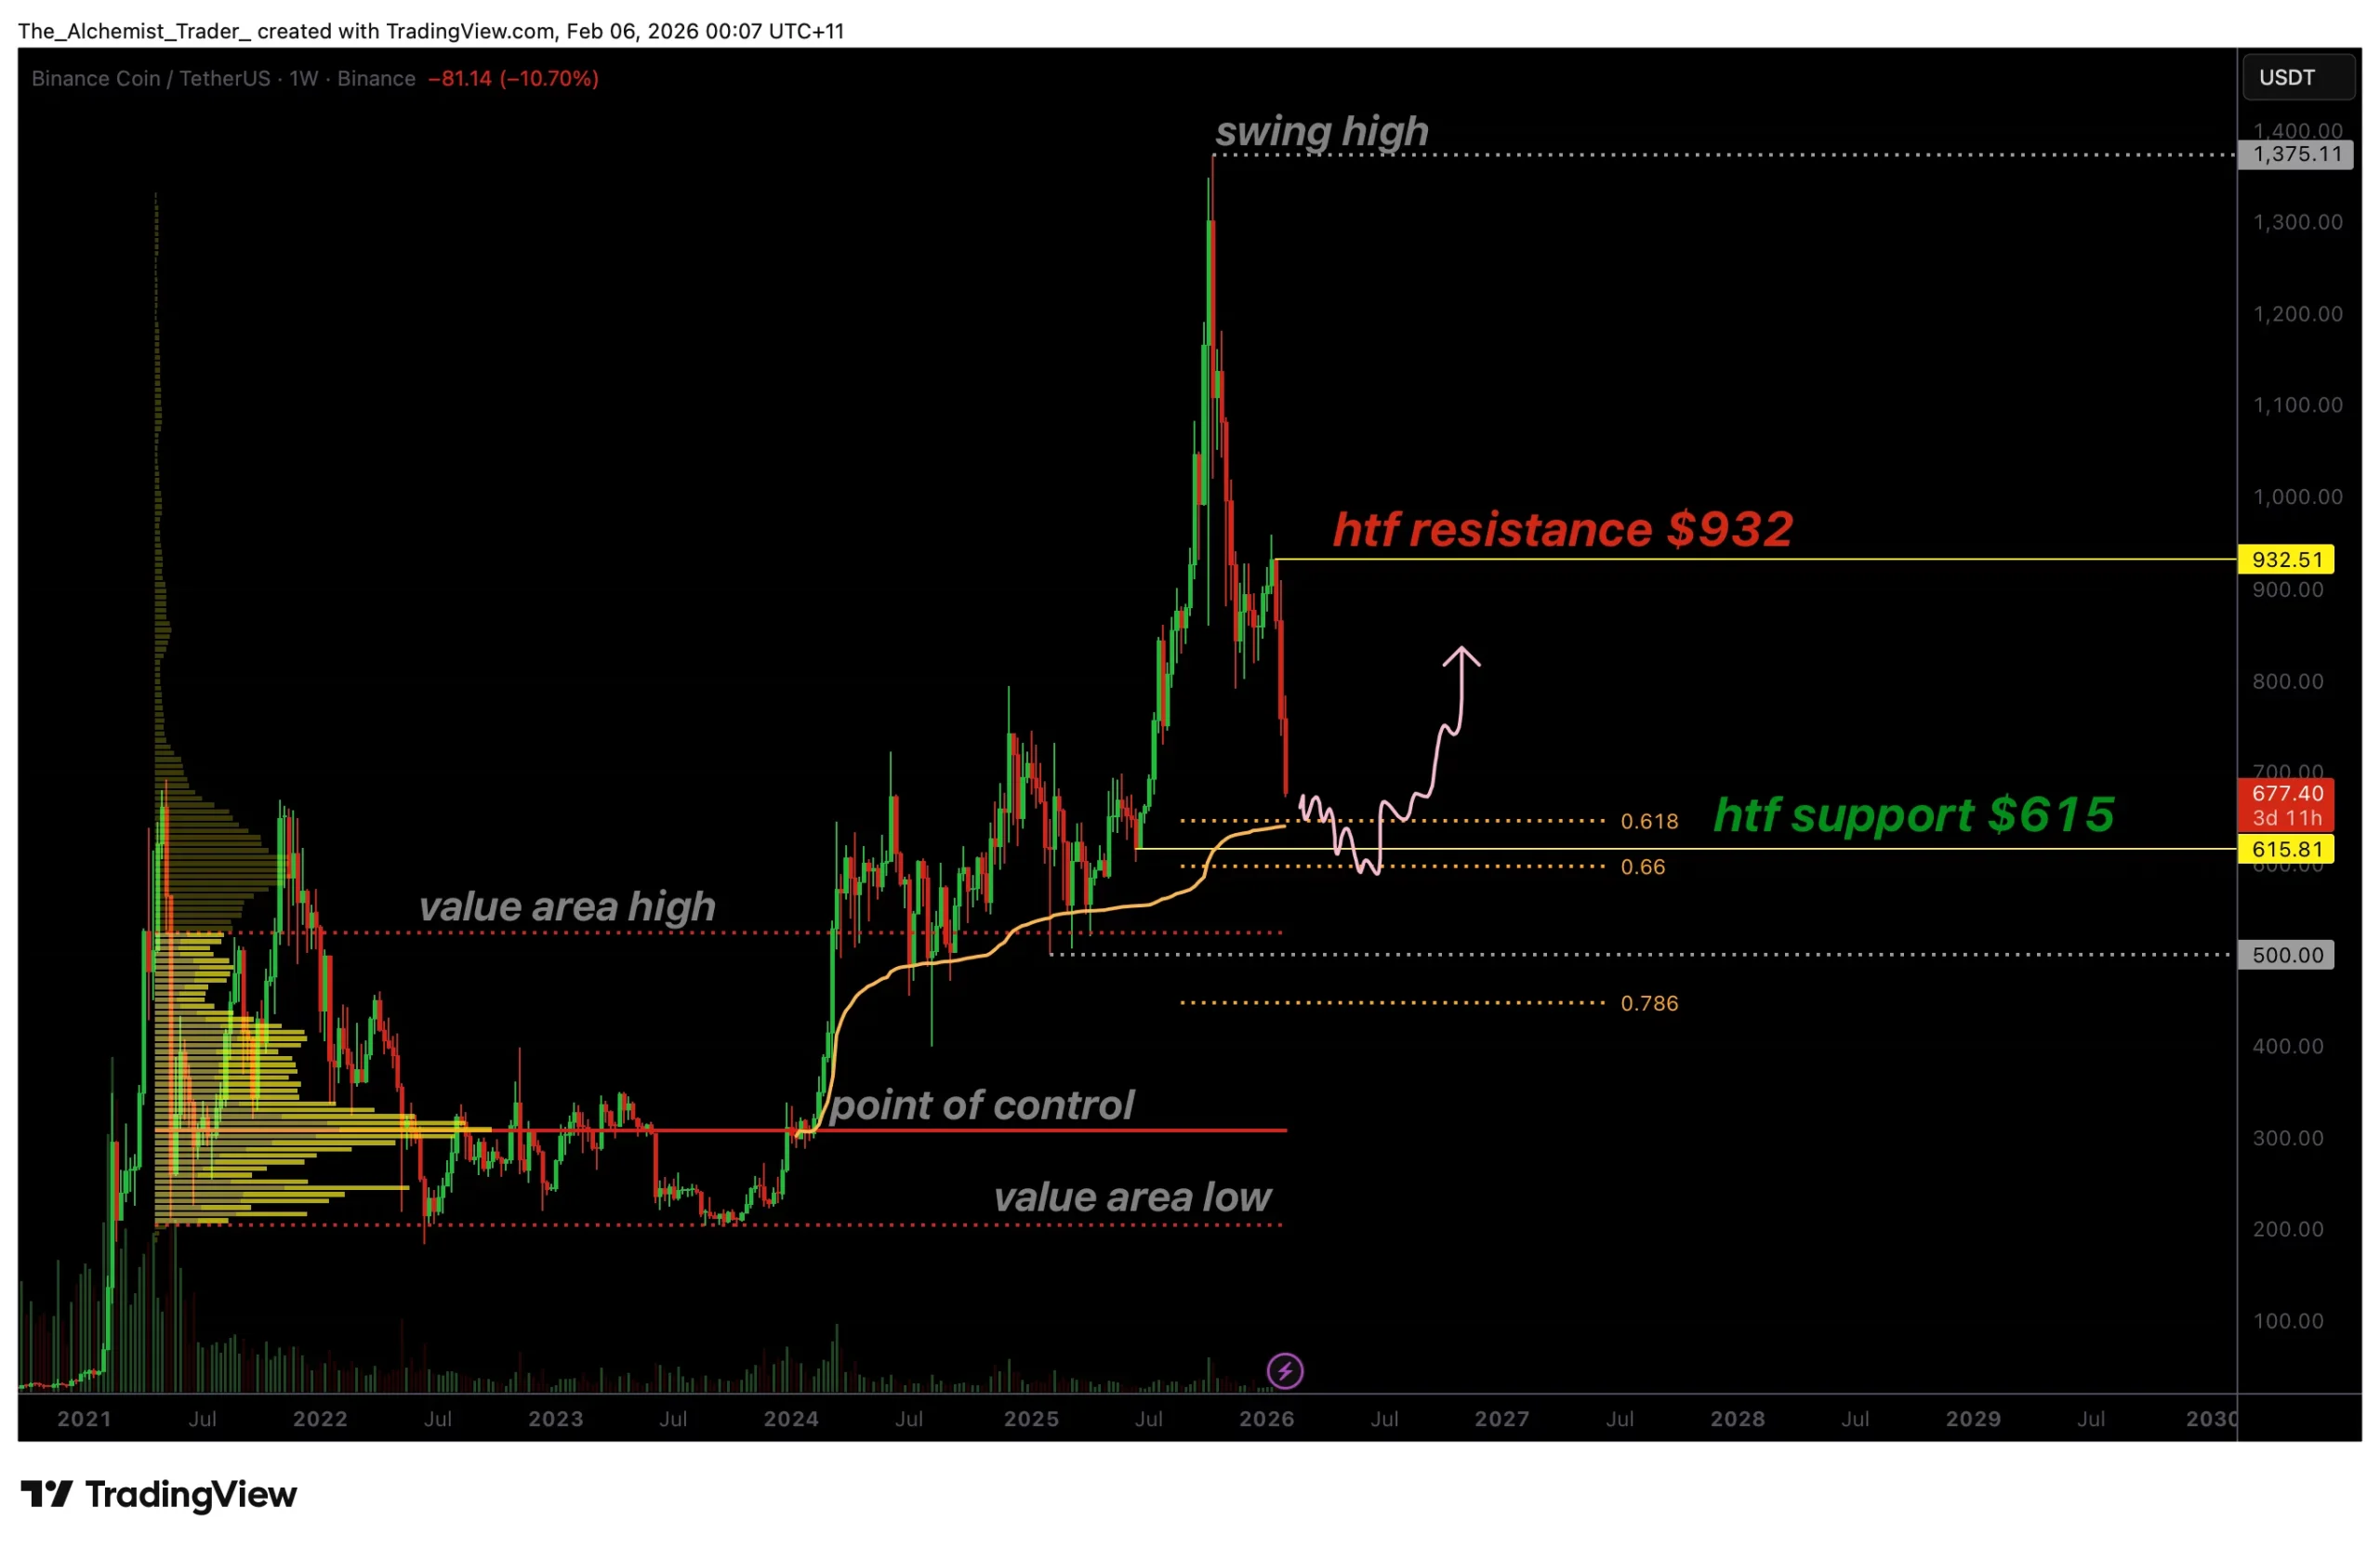
Binance’s price is approaching the $615 support zone as oversold conditions intensify, placing it at a critical technical inflection point.
Summary
- $615 is a major confluence support combining the 0.618 Fibonacci, VWAP, and prior value area high
- Rejection at $932 confirms bearish structure, keeping pressure on price in the short term
- Oversold conditions raise bounce probability, but confirmation is needed for reversal
Binance (BNB) price has entered a sharp corrective phase following its recent swing high, with bearish momentum accelerating across multiple timeframes. After failing to sustain upside continuation, price has rotated lower in an impulsive fashion, signaling a clear shift in short- to medium-term market structure.
As BNB continues to unwind recent gains, attention is now turning toward a key high-timeframe support region near $615, where technical confluence suggests this level may play a decisive role in determining the next directional move.
Binance price key technical points
- $615 marks a major confluence support zone, aligning with the 0.618 Fibonacci retracement and VWAP support
- High-timeframe resistance at $932 remains intact, reinforcing the broader corrective structure
- Oversold conditions increase the probability of a relief bounce, provided structural support holds
The current corrective move began after Binance Coin established a new high at a time-frame resistance near $932.
This level acted as a decisive rejection point, where bullish momentum stalled and sellers regained control.
The failure to reclaim acceptance above this resistance confirmed a structural low and initiated the current impulsive move to the downside.
Since that rejection, price action has remained consistently bearish, with lower highs and expanding downside candles reflecting aggressive selling pressure. This behavior suggests that the move lower is not merely a shallow pullback, but a broader corrective rotation within the prevailing market cycle.
$615 support zone comes into focus
As price continues to decline, the $615 region has emerged as the most important technical level in the near term.
This zone represents a high-confluence area where multiple technical factors align, including the 0.618 Fibonacci retracement of the broader move and VWAP-based support.
Additionally, this region sits above the previous range value area high, strengthening its relevance as a structural support level.
Historically, when price revisits such confluence zones after an impulsive move, the market often pauses to reassess value. If buyers step in to defend this area, it increases the likelihood that prices will stabilize and form a base for a corrective rebound.
Oversold conditions signal potential exhaustion
Momentum indicators are now beginning to reflect oversold conditions following the extensive selling seen over recent days and weeks. While bearish trends can persist longer than expected, oversold readings often signal that downside momentum may be nearing exhaustion, especially when price approaches major support.
Importantly, oversold conditions alone do not confirm a reversal. However, when combined with strong structural support, they increase the probability of at least a short-term relief bounce. Any such bounce would likely be corrective in nature unless accompanied by a clear reclaim of higher resistance levels.
What to expect in the coming price action
From a technical, price action, and market structure perspective, the $615 region represents a critical make-or-break level for Binance Coin. A successful defense of this support could allow BNB to establish a higher low and trigger a rotation back toward higher price targets. Conversely, failure to hold this zone would expose the market to deeper corrective levels and extend the bearish structure.
Until confirmation emerges, traders should closely monitor volume behavior and price reaction around support. A strong bullish response would signal improving demand, while continued weakness would reinforce downside risk. For now, all eyes remain on $615 as the market approaches a pivotal moment in Binance Coin’s corrective cycle.

While retail traders hold or accumulate ETH, on-chain data shows US institutions selling Ethereum at a discount.
Ethereum (ETH) broke below the crucial $2,100 price level after a fresh 8% decline amid a severe market correction. On-chain data now points to a major shift in sentiment among US investors.
In fact, those market participants are aggressively de-risking the world’s largest altcoin, even pushing the Coinbase Premium to its most negative reading since July 2022.
Institutional Exit
According to CryptoQuant, the Ethereum Coinbase Premium Index, measured on a 30-day moving average, has fallen to its lowest level since July 2022. The index tracks the price difference between the ETH/USD pair on Coinbase Pro, which is widely used as a proxy for US institutional trading activity, and the ETH/USDT pair on Binance, often viewed as a proxy for global retail participation.
CryptoQuant said that the deeply negative reading on the 30-day basis indicates that selling pressure is largely coming from US entities. While global retail traders may be holding positions or buying into the price decline, US institutions appear to be actively de-risking or exiting their Ethereum holdings.
The analytics platform revealed that the last time the Coinbase Premium Index reached similarly negative levels was during the depths of the 2022 bear market. Based on this comparison, it detailed two possible interpretations. One is that bearish momentum could continue, as US demand, described as an important driver of crypto market rallies, is currently absent, potentially limiting any near-term price recovery.
The alternative interpretation presented is that such extreme negative premiums have historically aligned with capitulation phases, which can sometimes coincide with local market bottoms once aggressive selling pressure is exhausted. CryptoQuant concluded that the $2,100 level represents an important psychological and technical zone, and added that a reversal would likely require the Coinbase Premium to normalize or turn positive.
“As long as US investors are selling at a discount compared to the global market, upside momentum will likely remain capped.”
Another Historical Warning Signal
A sharp increase in Ethereum network activity has further raised questions about potential market risks. Ethereum’s total transfer count surged to 1.17 million on January 29th, in one of the highest recorded levels for the metric, and represents a sudden, vertical rise in transaction activity across the network. Historical comparisons reveal that similar spikes have previously occurred around major turning points in ETH’s price cycle. In January 2018, for example, a comparable surge in transfer counts coincided with the market cycle top and was followed by a prolonged bear market.
You may also like:
A similar pattern appeared on May 19, 2021, when a sharp increase in transfers aligned with a major market crash and a steep price correction. While high network activity is often associated with growing usage, CryptoQuant stated that rapid and parabolic increases near price highs have historically reflected periods of market stress.
Such conditions can indicate high volatility, large-scale asset movements, or distribution by long-term holders moving funds, potentially to exchanges. Based on these historical precedents, the current spike places the crypto asset in a “high-risk” zone, where past patterns have been followed by notable price drawdowns.
SECRET PARTNERSHIP BONUS for CryptoPotato readers: Use this link to register and unlock $1,500 in exclusive BingX Exchange rewards (limited time offer).

The Aster decentralized crypto exchange (DEX) and perpetual futures platform announced on Thursday that its layer-1 blockchain testnet is now live for all users, with a potential rollout of the Aster layer-1 mainnet in Q1 2026.
Several new features are slated for a Q1 launch, including fiat currency on-ramps, the release of the Aster code for builders and the upcoming L1 mainnet, according to the Aster roadmap.
Aster will focus on infrastructure, token utility and building its ecosystem and community in 2026, according to the roadmap.

Aster rebranded as a perpetual futures DEX in March 2025 and is a direct competitor to the Hyperliquid perpetual futures DEX, which also runs on its own application-specific layer-1 blockchain network.
The launch of a dedicated layer-1 chain for Aster reflects the trend of Web3 projects shifting to custom-tailored blockchains to support high-throughput transaction volume, rather than relying on general-purpose chains like Ethereum or Solana, which host mixed traffic.
Related: Perp DEXs will ‘eat’ expensive TradFi in 2026: Delphi Digital
2025 was the year perp DEXs gained momentum
The success of Hyperliquid, a perpetual decentralized exchange (perp DEX), helped spur interest in other perpetual DEXs, such as Aster.
Traditional futures contracts feature an expiry date and must be manually rolled over, whereas a perpetual futures contract has no expiration date.
Instead, traders pay a funding rate to keep their positions open indefinitely, allowing markets to run 24 hours a day, seven days a week.
Perp DEX cumulative trading volume nearly tripled in 2025, surging from about $4 trillion to over $12 trillion by the end of the year.
About $7.9 trillion of this cumulative trading volume was generated in 2025, according to DefiLlama data.

Monthly trading volume on perpetual exchanges hit the $1 trillion milestone in October, November and December, data from DefiLlama shows.
The sharp rise in trading volume during 2025 signals growing interest and investor demand for crypto derivatives products and platforms, as more of the world’s financial transactions come onchain.
Magazine: Back to Ethereum: How Synt,hetix, Ronin and Celo saw the light

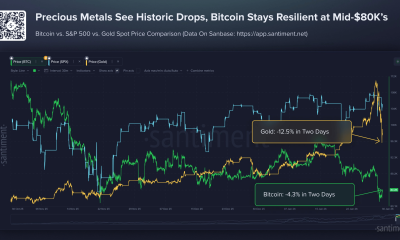
Gold prices extended gains for a second day, climbing back above $5,100 as a historical pullback from record highs offered a buying opportunity for investors.
In early trading, New York futures rose 3.4% to $5,102.90 a troy ounce following a 6% jump in the previous session.
The recent correction doesn’t signal a change in gold’s underlying drivers, with the medium-term outlook supported by continued central-bank buying, firm ETF demand, and persistent geopolitical and economic uncertainty.


BitMine’s ethereum (ETH) holdings have made unrealized losses of over $8 billion today as part of a wider crypto crash that the firm’s chairman, Tom Lee, described as “a feature, not a bug.”
The former JP Morgan strategist became chairman of the bitcoin (BTC) mining firm BitMine Immersion Technologies in June 2025 as it pivoted towards buying up ether (ETH).
Since August 24, 2025, when ETH’s hit an all-time high of $4,946, BitMine has spent over $10.6 billion purchasing over 2.76 million ETH, according to data from DropsTab.
Five months on, and ETH has fallen by almost 60%, resulting in BitMine’s ETH holdings losing over $8 billion in unrealized losses.
The firm has invested $16.4 billion in ETH since it pivoted last year and has no realized profit to date. It owns 4.29 million ETH, just over 3.5% of the entire circulating supply.
Read more: Tom Lee’s BitMine is performing as bad as Strategy
After users began to point out that BitMine’s ETH holdings hit over $6 billion in unrealized losses, Lee claimed that these sort of downturns are “a feature, not a bug,” and noted that the point of his ETH is to “outperform over the cycle (think up ETH).”
Just one day before, he noted that this crypto winter isn’t like other crypto winters, and that while prices are lagging, daily transactions are still surging.
He also noted that Binance’s actions on October 10 may have contributed to the “languished” price actions today.
ETH, BTC fall in wider crypto crash
CoinGecko claims that around $820 billion has been shed from the overall cryptocurrency market cap since January 15 this year.
ETH has shed $146 billion from its market cap over the past month, while BTC’s has lost $490 billion since last month.
Read more: Eric Trump removes ‘thank me later’ from ETH promo
This crash may not have been foreseen by the Trump family, as if somebody held onto any ETH they bought when Donald Trump’s son Eric endorsed buying ETH last year, they’d be down 31% today.
Got a tip? Send us an email securely via Protos Leaks. For more informed news, follow us on X, Bluesky, and Google News, or subscribe to our YouTube channel.

Disclosure: This article does not represent investment advice. The content and materials featured on this page are for educational purposes only.
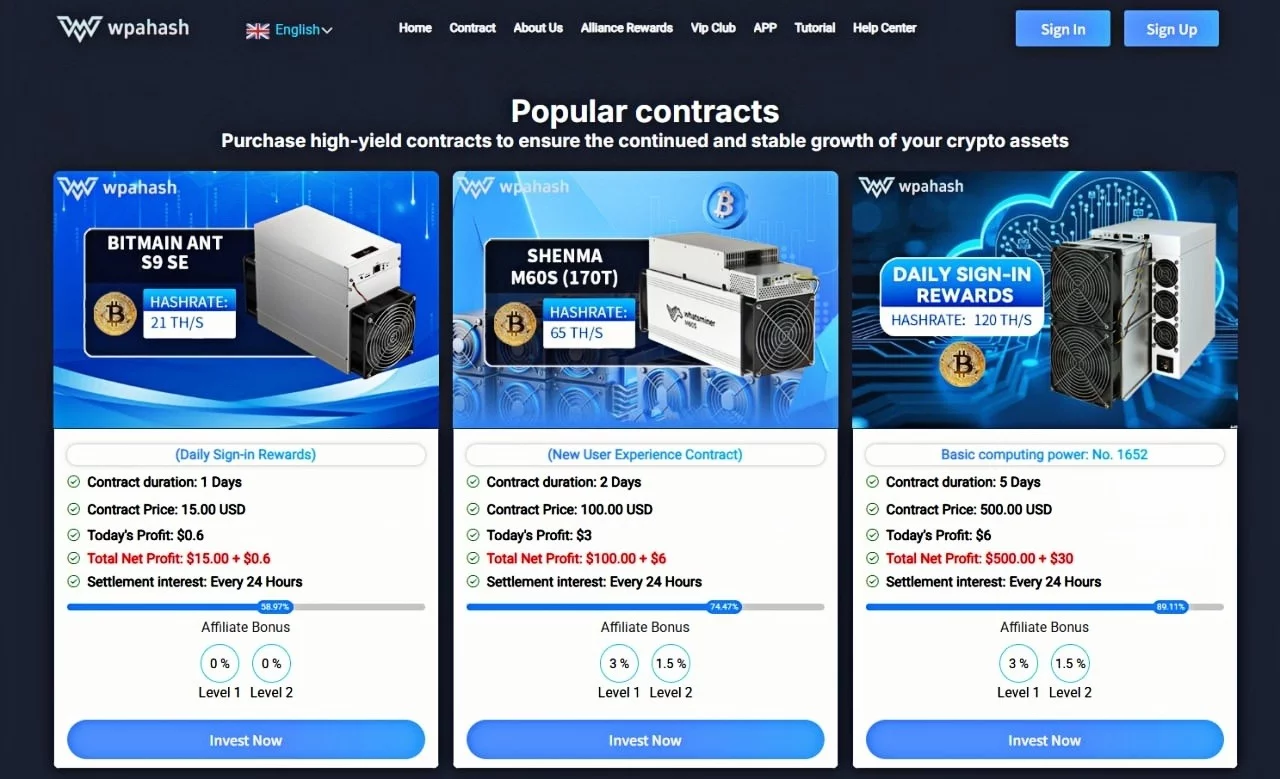
WPA Hash cloud mining gains attention in 2026 as investors seek stable crypto income beyond price swings.
Summary
- In 2026, crypto investors are shifting from trading to WPA Hash cloud mining for stable, contract-based daily income.
- WPA Hash lets users earn daily crypto returns via computing power, avoiding hardware hassle and frequent trading.
- Cloud mining gains traction as investors seek structured, low-risk crypto income beyond market price fluctuations.
In 2026, after several rounds of volatility, the cryptocurrency market is gradually becoming more structured and rational. For many investors, simply relying on price fluctuations is no longer the only option; how to obtain a relatively stable cash flow while controlling risk has become a new focus.
It is against this backdrop that someone would begin to explore and try participating in the operation of cryptocurrency networks through WPA Hash cloud mining, hoping to explore a long-term income model that does not rely on frequent trading and is based on a computing power mechanism.

From active trading to passive computing power participation
The first thing that anyone who gets in contact with cryptocurrencies focuses on is to earn profits by buying and selling cryptocurrencies. However, as market volatility increased, they gradually realize that rather than frequently judging price direction, it is better to let assets operate continuously through computing power, forming a more stable cash flow structure.
The cloud mining model provided by WPA Hash is based on this logic: users do not need to purchase mining machines or maintain hardware; they only need to allocate computing power through the platform to participate in the mining process of mainstream cryptocurrency networks, and the income is settled daily according to the contract rules. How is the “daily fixed income” achieved?
In actual use, the overall process of WPA Hash is relatively clear:
Step 1: Register an Account
Step 2: Select a BTC Cloud Mining Contract
The platform offers Bitcoin cloud mining contracts with different hashrate levels and periods, covering various options from small-scale trials to high-hashrate participation.
Step 3: Automatic Hashrate Management
After contract activation, the platform centrally allocates hashrate resources to participate in the Bitcoin network operation; users do not need to intervene in the technical aspects.
Step 4: Daily Earnings Settlement
Earnings are settled daily in BTC or equivalent assets; relevant data can be viewed in the user’s backend.
Cloud mining contract examples (platform showcase)
New User Experience Contract
Investment: $100 | Term: 2 days | Daily Yield: $3
Maturity Yield: $100 + $6
Basic Computing Power: 1659 | Investment: $500 | Term: 5 days | Daily Yield: $6
Maturity Yield: $500 + $30
Medium Computing Power: Project 2747
Investment: $3,000 | Term: 18 days
Daily Yield: $42
Maturity Yield: $3,000 + $756
Medium Computing Power: Project 2938
Investment: $5,000 | Term: 22 days
Daily Yield: $75
Maturity Yield: $5,000 + $1,650
Classic Computing Power: Project 4834
Investment: $58,000 | Term: 38 days
Daily Yield: $1,131
Maturity Yield: $58,000 + $42,978
Yields are settled automatically daily. Principal is returned upon contract maturity. Specific yields depend on real-time platform data. Click here for more contract details.
Why WPA Hash?
After comparing multiple platforms, many investors ultimately chose WPA Hash for long-term use, primarily based on the following considerations:
- No hardware or maintenance costs: Avoids mining machine depreciation, electricity, and operational issues.
- Multi-currency hashrate support: Allows for flexible adjustments to participation based on market conditions and personal preferences.
- High degree of automation: Yield settlement and data display are highly automated.
- Relatively clear transparency: Contract rules, cycles, and settlement logic are clear.
In conclusion
WPA Hash mining isn’t about “changing a financial situation overnight,” but rather using it as part of a crypto asset system to balance risk and return. Achieving a relatively stable daily income without constant monitoring or frequent trading is precisely the initial motivation for choosing cloud mining.
For users seeking to reduce operational burden and pursue long-term stable returns, participation in computing power may be a worthwhile area of research.
For more information, please visit the official platform.
Email: [email protected]
Disclosure: This content is provided by a third party. Neither crypto.news nor the author of this article endorses any product mentioned on this page. Users should conduct their own research before taking any action related to the company.
Crypto World
Heads Up! Bitcoin Enters Capitulation Mode, Trades In a ‘Phase That Rewards Discipline Over Prediction’

Bitcoin (BTC) has entered a key capitulation phase, analysts argue. However, positioning, discipline, and risk management now matter much more than price predictions.
Additionally, BTC is now moving through a sustained reset rather than a brief correction. This may last for months to come, analysts note.
That said, amid macro uncertainty, institutional outflows, declining liquidity, compressed volatility, and dampened risk appetite, Bitcoin as a barometer for broader capital sentiment is on the rise.
At the time of writing (Thursday, 14:00 UTC), BTC was trading at $69,313, having dropped 7.9% in a day.
‘Bitcoin Capitulation’
Nic Puckrin, investment analyst and co-founder of Coin Bureau, commented on BTC’s recent and major pullback, particularly its fall to the $70,000 level.
“As Bitcoin continues its slide toward the psychological barrier of $70,000, it’s clear the crypto market is now in full capitulation mode,” he said.
Per Puckrin, based on data provided by previous cycles, the current situation is “no longer a short-term correction, but rather a transition from distribution to reset.” These typically take months, not weeks, he warns.
The analyst now expects BTC to fight to defend the $70,000 threshold. If it breaks below, it could proceed lower towards its bear market low around the $55,700-$58,200 territory.
Meanwhile, Puckrin also noted that the market is slipping as Bitcoin whales are going for large-scale selling. At the same time, institutional outflows are increasing.
Yet, while Bitcoin exchange-traded funds (ETFs) are seeing negative flows, the majority of ETF holders are sitting on paper losses. It is Bitcoin OGs who are doing most of the selling, Puckrin says, citing Bloomberg data.
“This is Bitcoin’s institutionalisation in action,” the analyst concludes.
‘Discipline Over Prediction’
Nic Roberts-Huntley, CEO and co-founder of Blueprint Finance, argues that Bitcoin’s latest drop doesn’t suggest a fundamental breakdown in demand. Instead, it reflects a broader risk-off sentiment across markets.
The number one coin has struggled to hold key technical levels. Liquidity dried up and forced liquidations intensified, the CEO said.
Additionally, macro uncertainty and risk sentiment are currently driving flows, as evidenced by the demand for precious metals and other traditional hedges.
“That said, if macro clarity returns, liquidity improves, and key support holds, Bitcoin could stabilise and set the stage for a recovery rally later in the cycle,” Roberts-Huntley wrote.
“In the near term, traders and investors should be watching whether BTC can defend the mid-$70,000s and reclaim the $78,000–$80,000 zone.” These are key levels to monitor.
Meanwhile, Tony Severino, market analyst at YouHodler, wrote that the common theme across markets this week “is not direction, but compression.”
Bitcoin is “locked in one of the tightest volatility regimes in its history.” At the same time, currency volatility is rising even as the dollar softens, and metals are holding extreme levels without breaking.
“These conditions tend to frustrate short-term participants, but they also signal that markets are working off time rather than trend,” Severino wrote.
“For crypto investors, this is a phase that rewards discipline over prediction.”
He argued that macro forces are shifting, while technical structures across assets suggest that resolution is nearing. Timing, though, is still unclear.
“When volatility expands from these conditions, history suggests the move is unlikely to be subtle. Until then, patience, positioning, and risk management remain the real edge,” the analyst concluded.
‘Bitcoin Serves as a Barometer’
Bitunix analysts identified renewed tensions in the Middle East, as well as the AI-sector-fuelled “repricing-driven selloff” in technology stocks, as major factors affecting markets.
When it comes to BTC specifically, it retraced 45% from last year’s high of $126,080. The overall market pullback suggests that “the excess risk premium accumulated earlier has been systematically squeezed out.” Subsequently, this has led to market sensitivity to liquidity conditions, as well as elevated uncertainty.
Additionally, “Bitcoin is increasingly viewed as a result indicator of whether markets are willing to reabsorb risk,” the analysts say. In other words, BTC “serves as a barometer of whether capital is willing to re-engage with higher-risk assets.”
If the cryptocurrency manages to reclaim $75,000 and remain structurally stable there amid mounting macro uncertainty, it would imply that the market’s pricing of systemic liquidity risk remains restrained.
However, a sustained break below $75,000 would indicate that risk appetite has yet to recover.
— Cryptonews.com (@cryptonews) February 5, 2026
 #Bitcoin now trades ~20% below its estimated $87K production cost as miner profitability hits a 14-month low. #Crypto $BTC #Mininghttps://t.co/kBh1sj8NDD
That said, “as long as global capital remains defensively positioned and structural deleveraging is incomplete, the crypto market is unlikely to decouple from macro-driven risk pricing,” the analysts argue.
Market participants should continue to monitor geopolitical tensions and assess the risk of escalation into conflict. Another factor is that the technology sector repricing could potentially trigger a broader balance-sheet contraction across asset classes.
The post Heads Up! Bitcoin Enters Capitulation Mode, Trades In a ‘Phase That Rewards Discipline Over Prediction’ appeared first on Cryptonews.

Disclosure: This article does not represent investment advice. The content and materials featured on this page are for educational purposes only.
Vietnam’s crypto market grows fast in 2026 as users focus on choosing the right exchange for their needs.
Summary
- Vietnamese crypto beginners favor HIBT for clear onboarding, VND payments, and simple spot trading in 2026.
- HIBT simplifies early crypto adoption in Southeast Asia, emphasizing transparency, ease of use, and beginner-friendly trades.
- Amid Vietnam’s grey-area regulations, users choose exchanges like HIBT that highlight clarity, security, and straightforward fees.
Vietnam remains one of Southeast Asia’s fastest-growing cryptocurrency markets. High mobile banking penetration, a tech-savvy retail user base, and sustained interest in digital assets have shaped how Vietnamese users interact with crypto platforms. By 2026, the core question for most users is no longer whether crypto can be accessed with Vietnamese dong (VND), but how to choose the right exchange for their specific needs.
Unlike mature markets where users often rely on a single platform, crypto adoption in Vietnam is more fragmented. Exchange selection is typically driven by access method, experience level, and intended use, rather than brand size alone.
Access comes before platform
For VND users, the most critical factor is how local currency is converted into crypto. In practice, most users follow one of three common paths:
- Using fiat on-ramps or third-party payment providers
- Buying crypto through peer-to-peer (P2P) marketplaces
- Starting with region-oriented platforms designed to simplify onboarding
This explains why the concept of a single “best exchange” can be misleading. Different platforms often serve different roles across the user journey.
Global exchanges: Liquidity and market depth
Large global exchanges such as Binance and OKX are widely used in Vietnam, particularly after users have already converted VND into crypto. These platforms are valued for their liquidity, broad asset coverage, and advanced trading infrastructure.
However, access to these exchanges frequently relies on P2P markets or external payment channels. While this setup works well for experienced users, it can introduce additional complexity for beginners who are still learning how crypto transactions function.
Platforms for experienced traders
Some users prioritize execution speed, derivatives access, and advanced trading tools. Platforms like Bybit are often chosen by traders who already understand order types, risk management, and custody considerations.
For these users, fiat onboarding is treated as a functional step rather than a core experience. This model is effective for seasoned participants but may be less suitable for first-time buyers.
Region-oriented exchanges and the beginner entry point

A growing segment of Vietnamese users focuses on minimizing complexity during the early stages of crypto adoption. These users often prefer platforms that emphasize clear onboarding, localized payment flows, and spot trading, rather than feature-heavy environments.
One example of this category is HIBT, a region-oriented exchange serving Southeast Asian users. Instead of competing on advanced trading features, HIBT focuses on simplifying the path from registration to the first trade, making it more accessible for users without professional trading backgrounds. This positioning reflects a broader trend in emerging markets, where ease of use and transparency increasingly influence platform choice.
More information about HIBT’s platform approach and user positioning can be found in this Best Crypto Exchange for Beginners (2026 Guide), which outlines how beginner-oriented exchanges structure onboarding and early trading experiences.
Regulation and risk awareness in Vietnam
As of 2026, cryptocurrency in Vietnam operates within a regulatory grey area. While digital assets are not recognized as legal tender, individuals are generally allowed to hold and trade crypto at their own risk. This environment places greater responsibility on users to understand platform mechanics, fees, and security practices.
As a result, many Vietnamese users prioritize exchanges that provide visible pricing, straightforward interfaces, and clear risk exposure, especially when buying crypto with VND.
How Vietnamese users typically buy Bitcoin
In practice, buying Bitcoin in Vietnam usually involves a process rather than a single platform:
- Converting VND into crypto through fiat on-ramps or P2P markets
- Executing spot trades on an exchange aligned with the user’s experience level
- Managing custody by keeping assets on-platform or transferring to self-custody wallets
Tools that provide transparent market data and decision frameworks also play an important role in helping users make informed choices. For many beginners, understanding how to choose a crypto exchange based on usability rather than hype is often more important than comparing feature lists.
Why a multi-platform strategy is common
Market behavior suggests that many Vietnamese users adopt a multi-platform approach:
- One platform for fiat access
- Another for liquidity and broader markets
- Additional tools for research and market monitoring
This structure reflects a broader trend across emerging markets, where exchanges are viewed as infrastructure rather than all-in-one solutions.
Conclusion
In 2026, choosing a crypto exchange in Vietnam depends less on rankings and more on context. Global exchanges offer liquidity, advanced platforms cater to experienced traders, and region-oriented services help simplify entry for new users.
This diversity explains why multiple platforms — including global exchanges and beginner-focused options like HIBT — continue to coexist within Vietnam’s evolving crypto ecosystem.
Disclosure: This content is provided by a third party. Neither crypto.news nor the author of this article endorses any product mentioned on this page. Users should conduct their own research before taking any action related to the company.
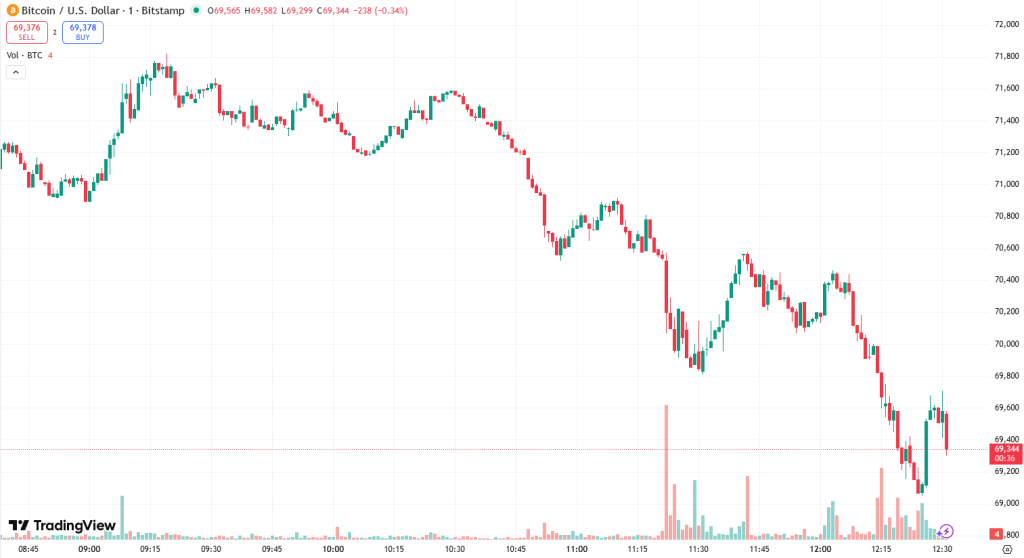
Bitcoin (CRYPTO: BTC) came under renewed selling pressure on Thursday as the price slipped below $69,000—the lowest level since November 6, 2024. The move underscored a backdrop of extreme market fear and frantic margin risk, with analysts contending that a potential bottom could be taking shape as short-term holders capitulate and on-chain activity points to exhausted selling. While the technical backdrop remains fragile, a cluster of indicators suggests that the recent wave of panic may be approaching a climax, though traders are wary of any renewed macro catalysts or liquidity shocks.
Key takeaways
- Short-term holders moved roughly 60,000 BTC to exchanges in the last 24 hours, signaling acute selling pressure and a large inflow that has contributed to the downside momentum.
- The Crypto Fear & Greed Index registered “extreme fear,” a level that has historically preceded a bottom and a subsequent bounce in prior cycles.
- Bitcoin’s RSI has reached multi-timeframe oversold levels, indicating seller exhaustion in several horizons and the potential for a near-term rebound if demand returns.
- Glassnode data show the seven-day moving average of realized losses climbing above $1.26 billion per day, a sign of rising fear in on-chain behavior and a potential capitulation event.
- Bitcoin’s capitulation metric posted its second-largest spike in two years, a pattern that historically aligns with rapid de-risking and heightened volatility as traders reset positions.
Tickers mentioned: $BTC
Sentiment: Bearish
Price impact: Negative. The renewed selling pressure and significant exchange inflows pushed BTC below key support, intensifying near-term downside risk as market participants reassess risk exposure.
Trading idea (Not Financial Advice): Hold. The combination of extreme fear, oversold RSI, and on-chain capitulation signals could precede a relief rally, but risk management remains essential while the market tests support levels.
Market context: The price action unfolds amid fragile liquidity conditions and a broader risk-off environment that has weighed on crypto assets. As traders parse on-chain signals against macro headlines, episodic capitulation events have tended to precede volatile but recoverable periods, with price action often drifting between fear-driven capitulation and later upside momentum once conviction returns.
Why it matters
The current wave of selling—centered on short-term holders—highlights a critical phase in the Bitcoin cycle. When a large bloc of supply shifts to exchanges at a loss in a short window, it can create a temporary liquidity squeeze that tests the resilience of bids at nearby levels. In the latest data, roughly 60,000 BTC moved from short-term holders to wallets on centralized venues in just one day, a move valued at about $4.2 billion at prevailing prices. This inflow exacerbates selling pressure, particularly in a market that has already faced a string of sharper-than-expected corrections. The dynamic underscores the risk that fresh headlines or macro surprises could reintroduce volatility before buyers re-emerge.”
Another powerful signal comes from the Fear & Greed Index, which sits in the realm of “extreme fear.” The gauge has historically punctured lower during capitulations, yet it also marks a potential turning point when fear peaks. The latest reading aligns with other cycles where a bottoming process has followed intense pessimism, before sentiment gradually shifts as risk appetites reappear among value-focused or long-term participants.
On-chain psychology also appears to be stabilizing, even as prices test psychological thresholds. Glassnode notes that the seven-day realized-loss metric has climbed past $1.26 billion per day, reflecting a surge in realized losses across the market. In their view, spikes in realized losses often coincide with moments of acute seller exhaustion, where marginal selling pressure begins to fade as market participants mark down losses and reassess risk. The capitulation metric, meanwhile, recorded its second-largest spike in two years, signaling a period of aggressive de-risking that typically precedes a more orderly reallocation of exposure once price discovery resumes.
The RSI, a widely watched momentum indicator, also reinforced the notion of an oversold regime across multiple timeframes. Coinglass’ heatmap shows BTC’s RSI flashing oversold conditions on five of six studied horizons. Specifically, the 12-hour RSI sits around 18, the daily around 20, and the four-hour near 23, with weekly and hourly readings also signaling distress. Some analysts have pointed to the weekly RSI near 29 as the most oversold level since the 2022 bear market, a milestone that has historically preceded relief rallies rather than fresh lows. In a market known for abrupt shifts, such readings are often interpreted as evidence of seller exhaustion rather than a guarantee of near-term direction.
Market observers have not avoided drawing parallels to prior capitulation episodes. A prominent sentiment analyst argued that this is “the most oversold” condition since the FTX crash, hinting that panic-driven selling could be approaching a climax even as price action remains fragile. Others urged patience, suggesting that risk/reward can improve when major players either accumulate at discounted levels or when the small-trader crowd exhibits a degree of disbelief that helps shore up a bottoming process. The broader narrative remains clear: extreme fear plus concentrated selling could lay the groundwork for a counter-move, but confirmation will come only with sustained price action and a shift in on-chain behavior.

Analysts cautioned that while the current conditions are telling, they do not guarantee a bottom that will immediately resume a longer-term uptrend. The price regime remains vulnerable to sudden shifts in macro liquidity, regulatory developments, or shifts in major exchange flows. Yet, the logic of capitulation—defined by a broad-based exit from risk and the erosion of conditionally profitable positions—has historically been followed by a re-pricing of risk as buyers step back in and price discovery restarts. In this context, several voices have framed this phase as a potentially fertile point for accumulation, provided that risk controls are in place and the market finds a credible catalyst to re-anchor value expectations.

What to watch next
- Price stabilization near current support levels and any intraday rebound following the extreme fear readings.
- Further on-chain data from CryptoQuant and Glassnode showing whether short-term holder outflows ease and whether realized losses begin to retreat.
- The evolution of RSI across multiple timeframes and any divergence that could hint at renewed buying interest.
- Liquidity conditions and macro developments that could reintroduce coordinated bid support for BTC and risk assets more broadly.
Sources & verification
- CryptoQuant data on 60,000 BTC moving to exchanges by short-term holders over 24 hours.
- Glassnode commentary on seven-day realized losses averaging above $1.26 billion per day and the capitulation metric spike.
- Crypto Fear & Greed Index reading at extreme fear (12) and historical context for similar levels.
- Coinglass RSI heatmap showing oversold conditions across multiple timeframes for BTC, including weekly RSI near 29.
- Santiment and other analyst commentary referencing sentiment shifts and potential near-term relief rallies.
Market reaction and key details
Bitcoin (CRYPTO: BTC) traded with renewed weakness on Thursday as the price slipped below $69,000, a level not seen since November 2024. The move came amid a confluence of on-chain signals and sentiment metrics that suggest investors are bracing for further volatility while some traders anticipate a bottom could be forming. The latest data show a substantial transfer of BTC from short-term holders—investors with a holding period under 155 days—to exchanges, with roughly 60,000 BTC moved in a single 24-hour period. At current prices this corresponds to about $4.2 billion in value, highlighting the scale of the near-term selling pressure and its potential to prolong downside risk if bids remain thin.

Observers on X noted that “the correction is so severe that no BTC in profit is being moved by LTHs,” underscoring a perceived capitulation among longer-term investors who might otherwise absorb losses and help stabilize prices. The sentiment is echoed in the weekly RSI readings, which place Bitcoin in a deeply oversold territory not seen in years. The heatmap from Coinglass confirms that the RSI is oversold on five of six timeframes, with readings such as 18 on the 12-hour and 20 on the daily frame, among others, signaling that selling pressure could be drying up even as prices test critical support. While some analysts describe the situation as an opportunity for buyers, others warn that risk remains high until a durable bid is reestablished and macro catalysts align with improved liquidity conditions.

The fear-driven mood is reinforced by the Crypto Fear & Greed Index, which sat deeply in the “extreme fear” zone. Historical patterns suggest that such levels often precede a turning point, though there is no guarantee of a swift recovery. Analysts have pointed to past episodes where heavy selling pressure and a retreat from risk assets gave way to a slower, more deliberate re-pricing of risk and a gradual incursion of buyers who see value at muted prices. Yet, the path forward remains contingent on a confluence of supportive signals, including on-chain activity that signals accumulation and renewed bid depth in the order book.
Several observers note that while the immediate narrative remains bearish, the prevailing combination of oversold momentum, high realized losses, and isolated capitulation spikes can set the stage for a temporary relief rally if buying interest returns and risk sentiment improves. The debate among market participants continues to hinge on whether the current episode is a definitive bottoming process or merely a dread-filled pause before fresh downside. As always, investors should watch liquidity, regulatory developments, and macro cues for decisive clues about the next leg of the cycle.
The move comes amid a broader Aptos TVL decline and less than two years after Merkle closed a $2 million seed round with participation from Aptos Labs.
Merkle Trade, the largest decentralized perpetual futures exchange on Aptos by trading volume, said in an X post on Feb. 3 that it will begin winding down operations over the coming weeks.
The team said the decision followed “careful consideration” and comes after the platform processed nearly $30 billion in cumulative trading volume since launch. Without specifying a reason for the winddown, the statement concludes: “But we are proud of what we built, and grateful to everyone who was part of it.”
According to the announcement, new positions will be disabled on Feb. 6, with all remaining positions forcibly closed on Feb. 10. Merkle Trade’s native MKL token will become redeemable without fees or withdrawal delays, while a final revenue distribution is scheduled for Feb. 12, after which staked MKL can also be redeemed, the announcement said.
The price of MKL spiked 11.5% in the past 24 hours, though the token is down 90% from its all-time high in December 2024.
Launched in late 2023, Merkle Trade offered non-custodial derivatives trading alongside features such as trading missions and loot boxes, leaning heavily into game-like mechanics.
That approach helped Merkle raise $2.1 million in a seed round in April 2024 led by Hashed and Arrington Capital, with participation from Aptos Labs, Morningstar Ventures, Amber Group and others.

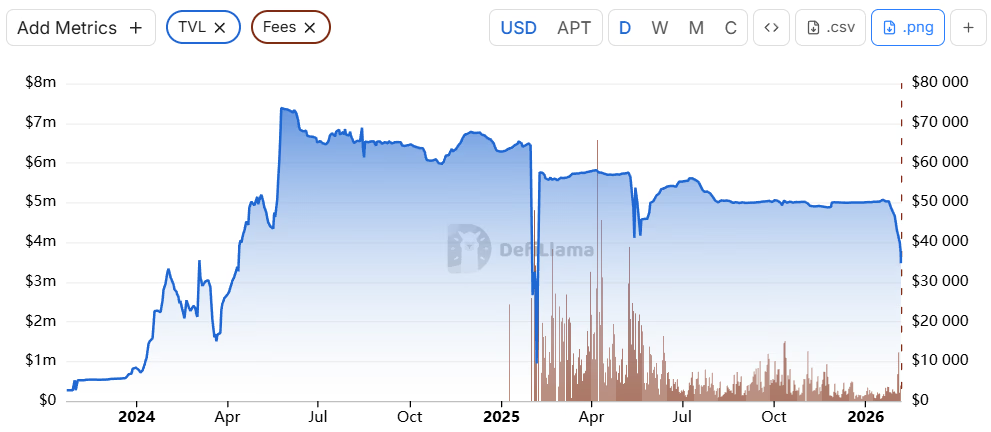
By May 2024, total value locked (TVL) on the platform peaked at more than $7.4 million, according to DefiLlama data. Since then, TVL has fallen by more than half to about $3.47 million, making Merkle Trade the 17th-largest protocol by TVL on Aptos at press time.
Among the four Aptos-based perp DEXs listed on DefiLlama, however, Merkle is the leader by far, accounting for $12.4 million of the total $13.68 million in perp volume on the chain in the past 24 hours.
Aptos Struggles
Merkle’s slide in TVL since 2024 reflects weakness across the broader Aptos ecosystem, where total value locked is currently around $332.6 million, making it the 16th-largest chain by DeFi TVL.
Current TVL across the ecosystem is down more than 70% from December 2024 where it was over $1.2 billion, and back to levels last seen in the summer of 2024.

App revenue on the network, however, increased in 2025, though it remains relatively low. Weekly revenue from decentralized applications (DApps) on Aptos is led by DEX PancakeSwap, with $44,396 followed by Merkle Trade with $29,575.
By comparison, the top-four chains by app revenue today — Solana, Hyperliquid L1, Ethereum and EdgeX — have all recorded over $1 million in the past 24 hours.
The broader perp DEX sector exploded in 2025, with 24-hour volumes now outpacing most centralized exchanges. Hyperliquid has led the sector by trading volume, with rivals Lighter and Aster sometimes taking the lead.


U.S. Treasury Secretary Scott Bessent fired warning shots at crypto insiders who are pushing back in the negotiations over a digital assets market structure bill in the Senate — briefly aligning with Democratic Senator Mark Warner in expressing frustration during a hearing on Thursday.
“There seems to be a nihilist group in the industry who prefers no regulation over this very good regulation,” Bessent said in testimony before the Senate Banking Committee.
“Amen, brother,” said Virginia Senator Warner, one of the key Democratic negotiators on the bill. “So weigh in.”
“I do,” Bessent responded. “Early and often.”
A number of crypto industry participants, including Coinbase CEO Brian Armstrong, have been critical of provisions in the bill, pointing to concerns around how it addresses decentralized finance regulation, stablecoin yield rewards and the way it defines tokens as securities. Armstrong’s withdrawal of support for a version of the legislation moving through the Senate Banking Committee last month had been consequential.
Warner said in the hearing that a further meeting is expected on the regulatory effort within the next few days, and he suggested Bessent was set to be invited. In those ongoing talks, Warner has been an outspoken voice on crypto’s illicit finance threats, leading much of that discussion in the legislative negotiations.
“I feel like I’m in crypto hell,” Warner said, eliciting some laughs in the hearing room. “We are working our tail off.”
He said other technical points in the bill can be resolved, but he suggested addressing “some of the gaps” related to national security and decentralized finance (DeFi) remains his focus.
“We’ll deal with yields and rewards; we’ll deal with a host of other issues; but these national security issues around DeFi are real, and we need to not create a set of rules that leaves huge exemptions and, candidly, takes away some of the prosecutorial powers that exist today,” Warner said.
Bessent, who didn’t call out any resistant crypto industry representatives by name, went on to underline the importance of passing the Digital Asset Market Clarity Act in the Senate. The bill has struggled to maintain momentum as lobbyists from crypto and banking have clashed with each other over the question of stablecoin yield and lawmakers from the parties can’t find agreement on certain other provisions. The Treasury secretary argued the industry can’t advance in the U.S. unless the bill passes.
“It’s impossible to proceed without it,” he said. “We have to get this Clarity Act across the finish line. And any market participants who don’t want it should move to El Salvador.”
Bessent said that he thinks the earlier GENIUS Act to regulate U.S. stablecoin issuers struck a good balance that can eventually be repeated in the Clarity Act.
“There seem to be people who want to live in the US, but not have rules for this important industry, and we’ve got to bring safe, sound and smart practices and the oversight of the U.S. government, but also allow for the freedom that is crypto,” Bessent said, adding that as both parties continue to work on the Clarity Act, it can get “across the line this year.”
Read More: Crypto’s U.S. Policy Aims May Pivot on Resistance from Democratic Senator Warner

Ferryhill sculpture Miner’s Lamp celebrates mining heritage
Nasdaq Extends Decline; AMD Sinks After Earnings
Institutional Exit? US Investors Are Dumping ETH at a Record Rate


-

 Crypto World6 days ago
Smart energy pays enters the US market, targeting scalable financial infrastructure
-
 Crypto World7 days ago
Software stocks enter bear market on AI disruption fear with ServiceNow plunging 10%
-

 Politics6 days ago
Why is the NHS registering babies as ‘theybies’?
-
 Crypto World7 days ago
Adam Back says Liquid BTC is collateralized after dashboard problem
-

 Video3 days ago
When Money Enters #motivation #mindset #selfimprovement
-

 Fashion6 days ago
Weekend Open Thread – Corporette.com
-

 Tech1 day ago
Wikipedia volunteers spent years cataloging AI tells. Now there’s a plugin to avoid them.
-

 NewsBeat7 days ago
Donald Trump Criticises Keir Starmer Over China Discussions
-

 Politics4 days ago
Sky News Presenter Criticises Lord Mandelson As Greedy And Duplicitous
-
 Crypto World5 days ago
U.S. government enters partial shutdown, here’s how it impacts bitcoin and ether
-

 Sports5 days ago
Sinner battles Australian Open heat to enter last 16, injured Osaka pulls out
-
 Crypto World5 days ago
Bitcoin Drops Below $80K, But New Buyers are Entering the Market
-
 Crypto World3 days ago
Market Analysis: GBP/USD Retreats From Highs As EUR/GBP Enters Holding Pattern
-

 Business2 hours ago
Quiz enters administration for third time
-

 Crypto World6 days ago
KuCoin CEO on MiCA, Europe entering new era of compliance
-
Business6 days ago
Entergy declares quarterly dividend of $0.64 per share
-

 Sports3 days ago
Shannon Birchard enters Canadian curling history with sixth Scotties title
-

 NewsBeat8 hours ago
Still time to enter Bolton News’ Best Hairdresser 2026 competition
-

 NewsBeat3 days ago
GAME to close all standalone stores in the UK after it enters administration
-

 NewsBeat2 days ago
US-brokered Russia-Ukraine talks are resuming this week