
Crypto World
HBAR Price Faces a 30% Crash Risk as ETFs Remain Absent
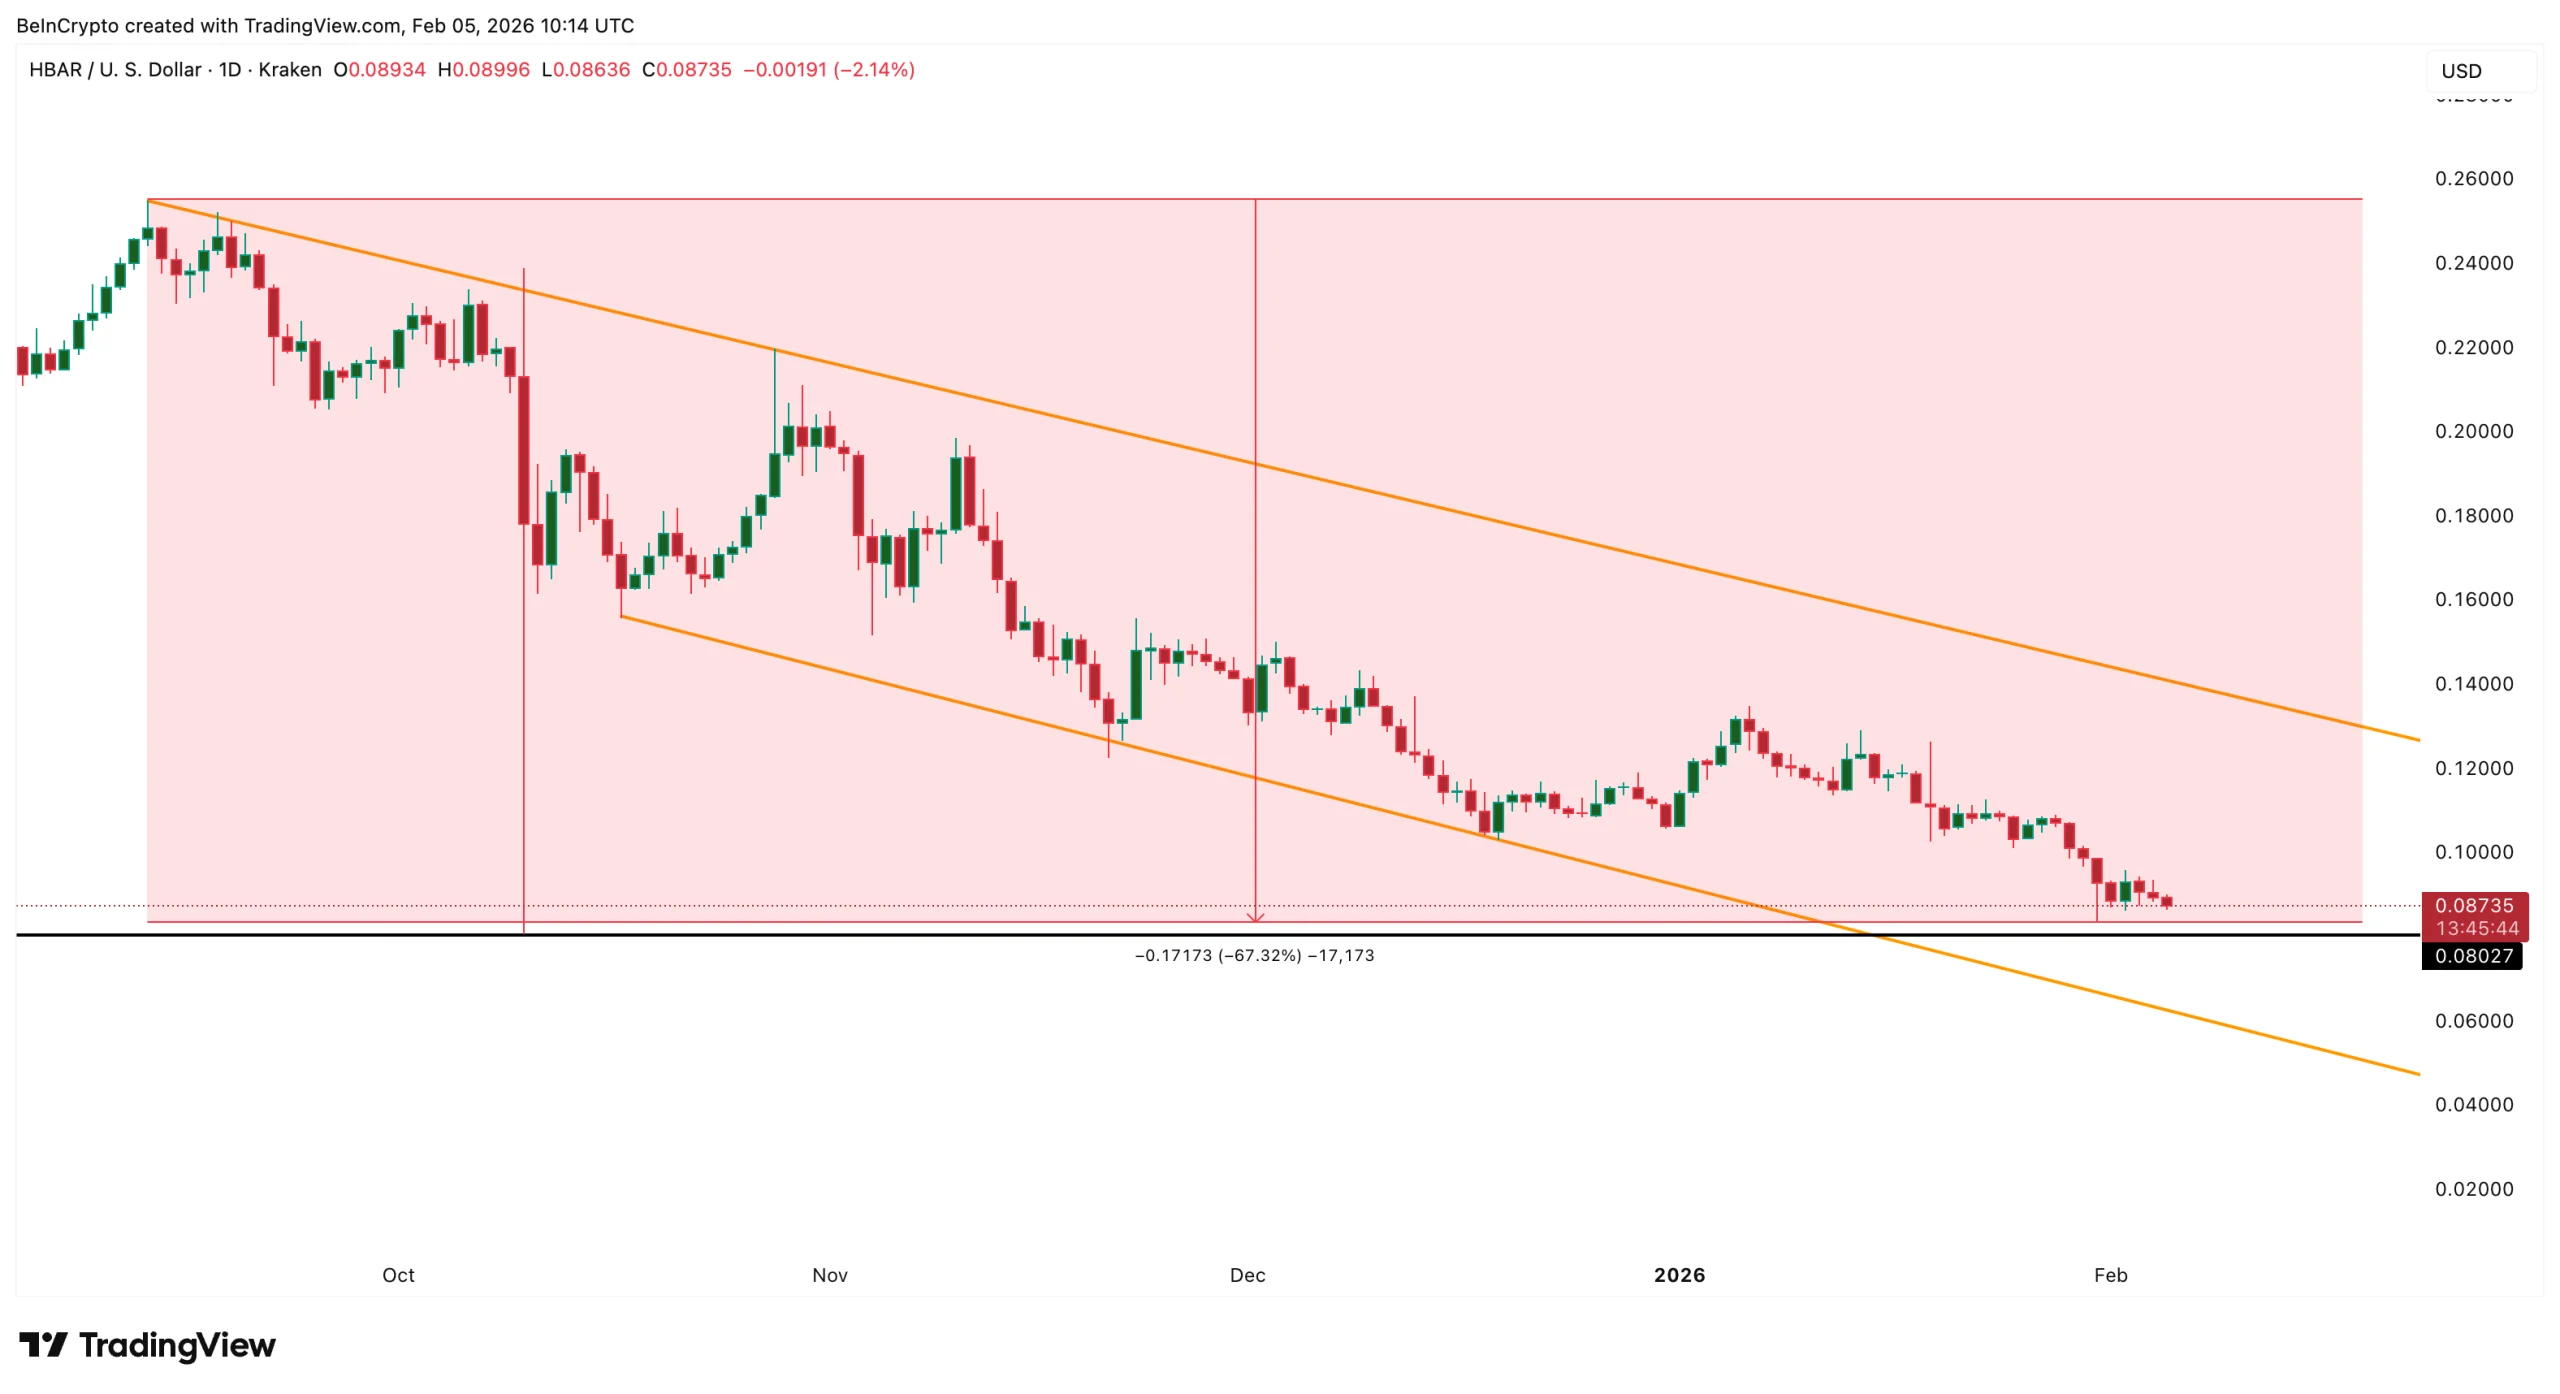
HBAR price remains under heavy pressure as the broader crypto market stays weak. The token is down nearly 47% over the past three months and has slipped another 6% in the past 24 hours, tracking Bitcoin’s latest decline. More importantly, this is not just a short-term sell-off. Hedera’s price has been falling steadily since September, losing almost 67% from its highs.
Behind this move is a deeper problem: shrinking network liquidity, weak institutional demand, and fading retail participation. As TVL continues to fall and ETF inflows remain absent, charts now suggest that HBAR could face another major downside leg. Here is what the data is showing.
Hedera’s TVL Collapse Shows Liquidity Has Been Leaving for Months
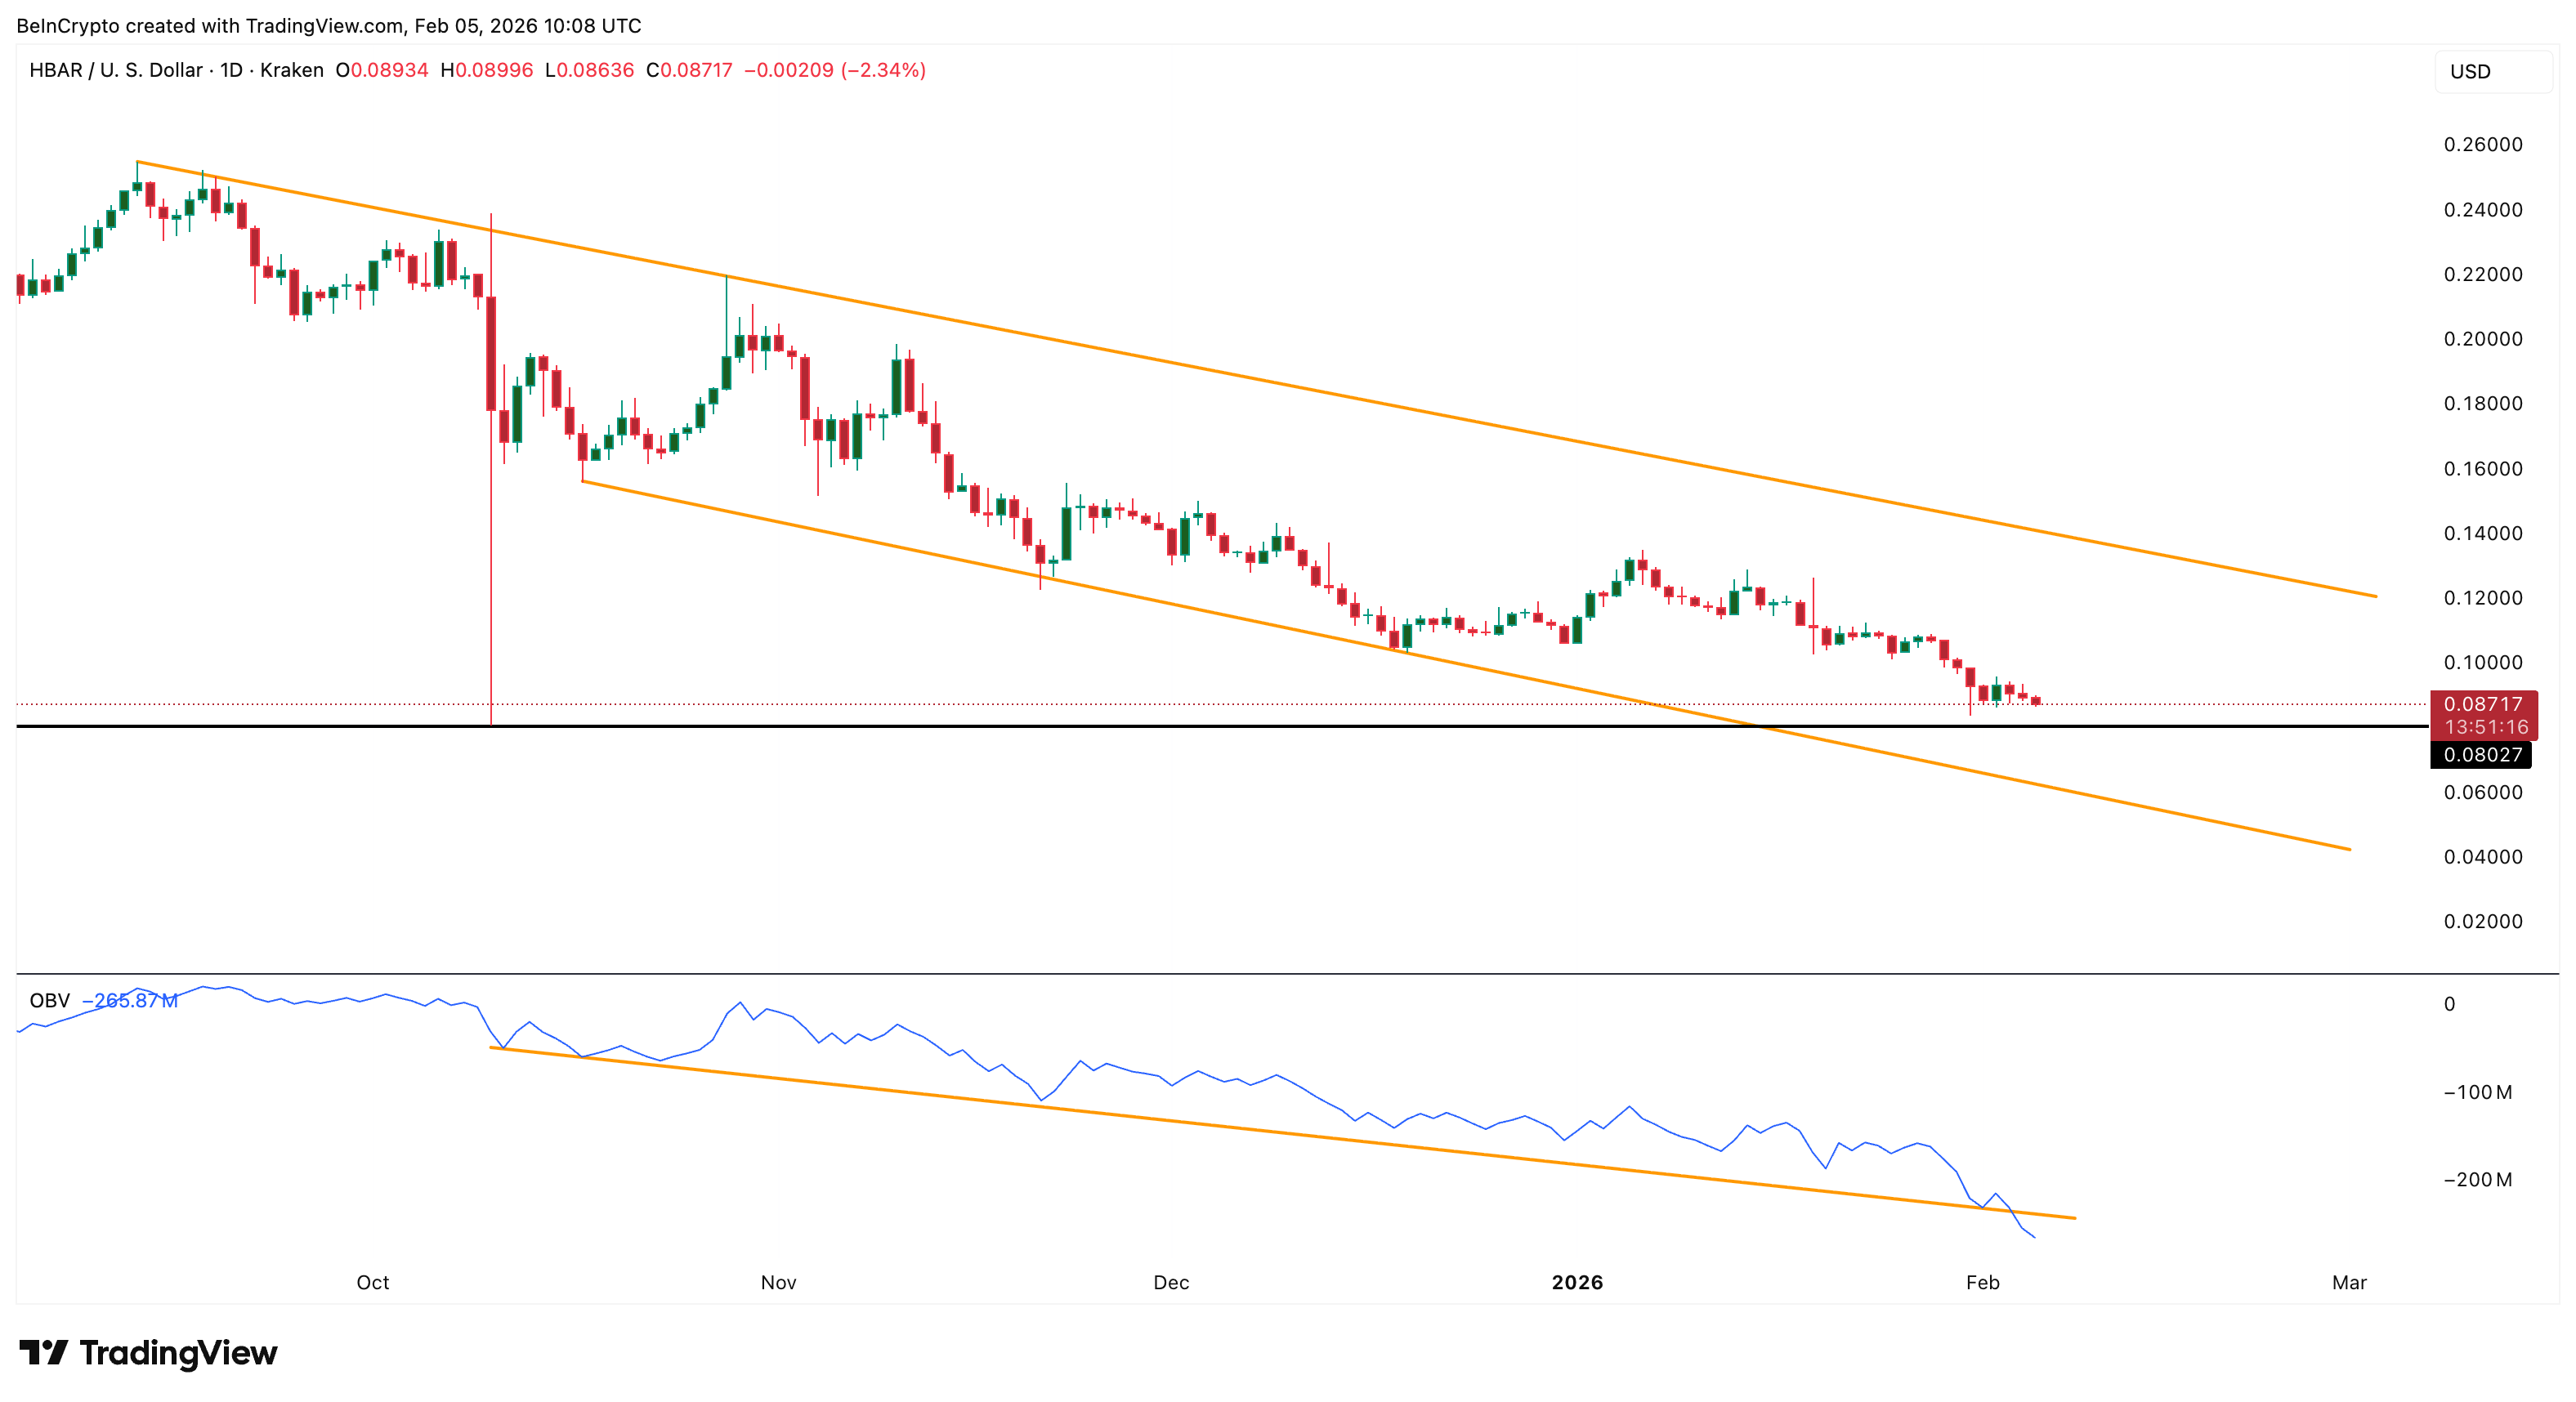
HBAR’s downtrend began in mid-September, when the price started trading against a falling trendline. Soon, the weakening prices entered a falling channel as lower highs met lower lows. Since then, every rally has been weaker, and each breakdown has pushed the token lower.
Sponsored
Sponsored
Want more token insights like this? Sign up for Editor Harsh Notariya’s Daily Crypto Newsletter here.
This HBAR price action mirrors what happened to Hedera’s on-chain liquidity.
Total value locked was near $122.5 million in September. It has now dropped to around $56 million, a decline of more than 50%. TVL measures how much capital is locked inside DeFi protocols. When TVL falls, it usually means users are withdrawing funds and activity is slowing.
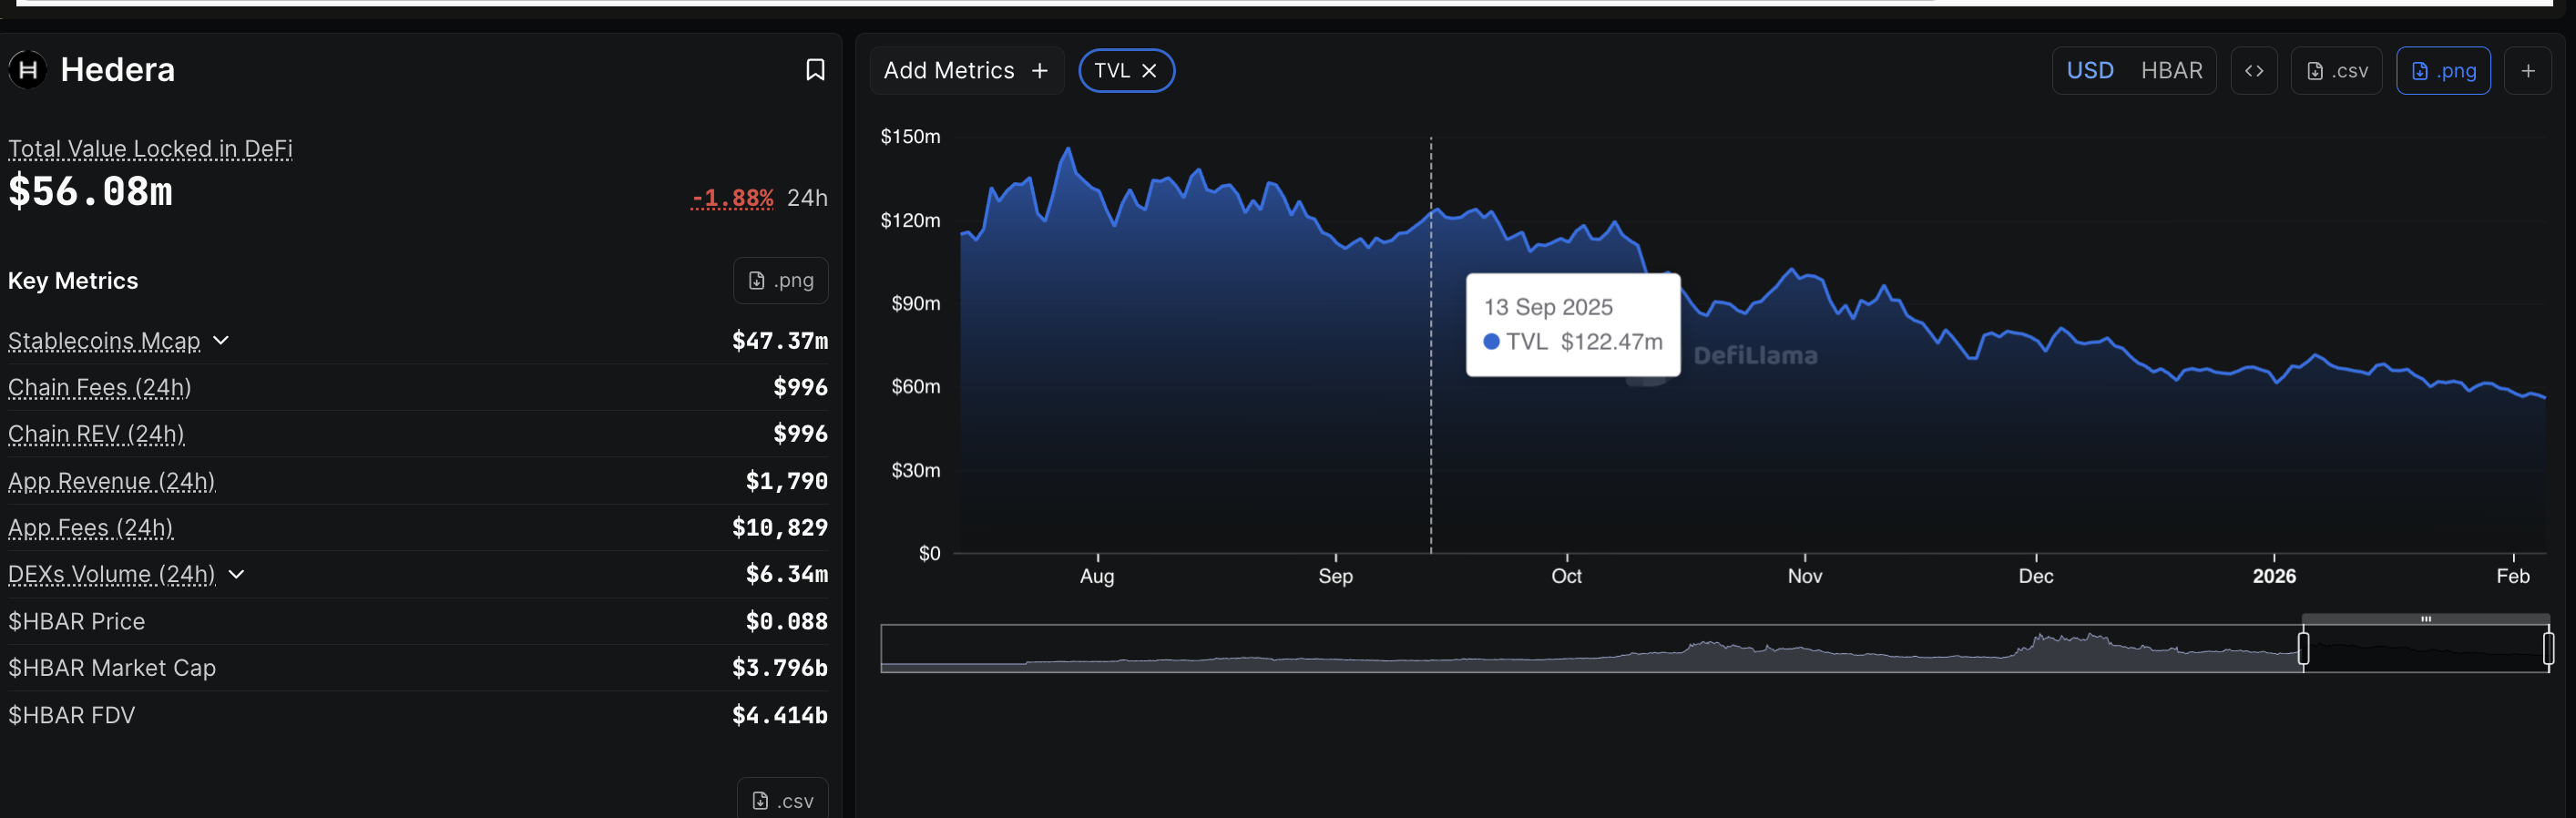
In simple terms, money started leaving the network months ago. The price just followed this fundamental weakness. This explains why HBAR’s decline looks gradual rather than sudden. Liquidity has been drying up steadily. Without fresh capital, rallies fail quickly.
As long as TVL stays weak, HBAR’s upside remains structurally limited.
Sponsored
Sponsored
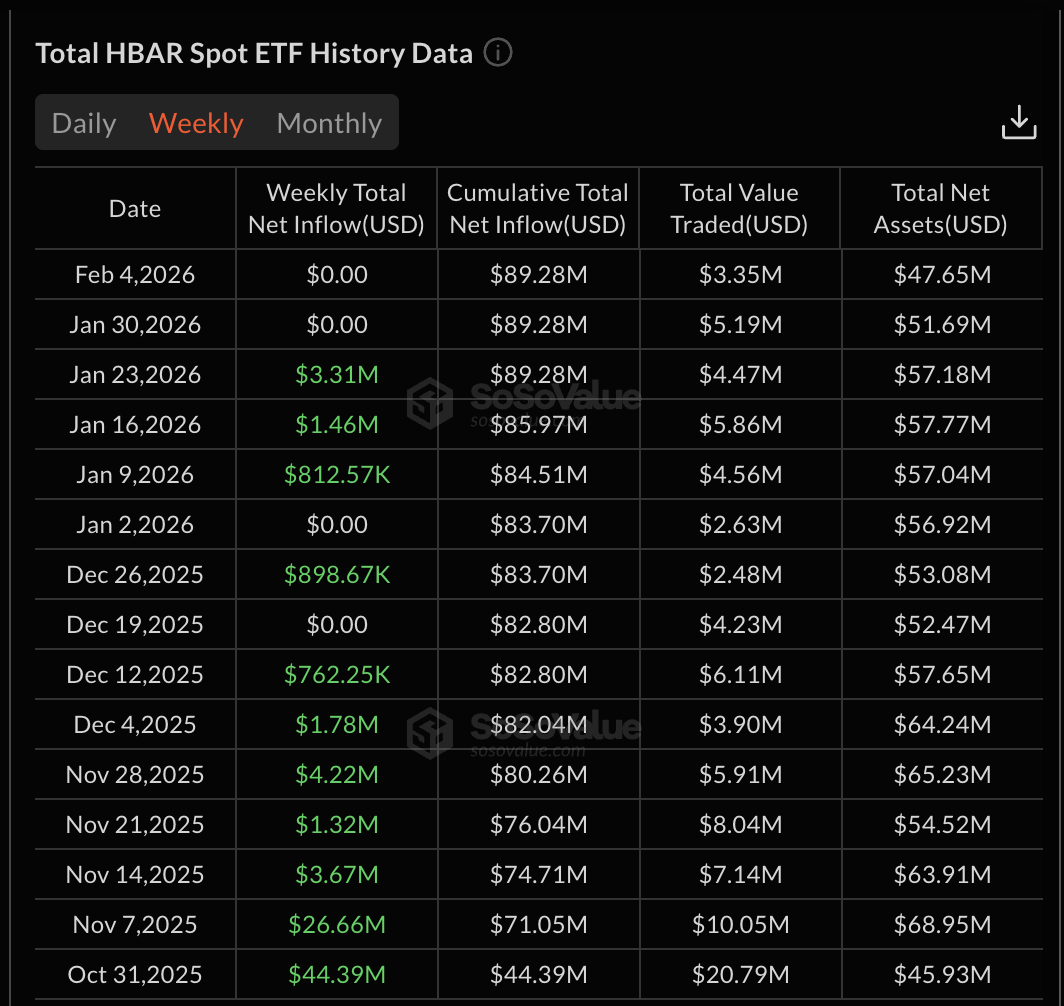
CMF Shows Selective Buying, But ETF and Retail Demand Remain Weak
Not all signals are bearish.
The Chaikin Money Flow has been rising since mid-December, even as the price moved lower. This creates a bullish divergence, showing that some larger investors are accumulating. However, CMF is still below zero. Outflows still dominate. Inflows are improving, but not strongly enough.
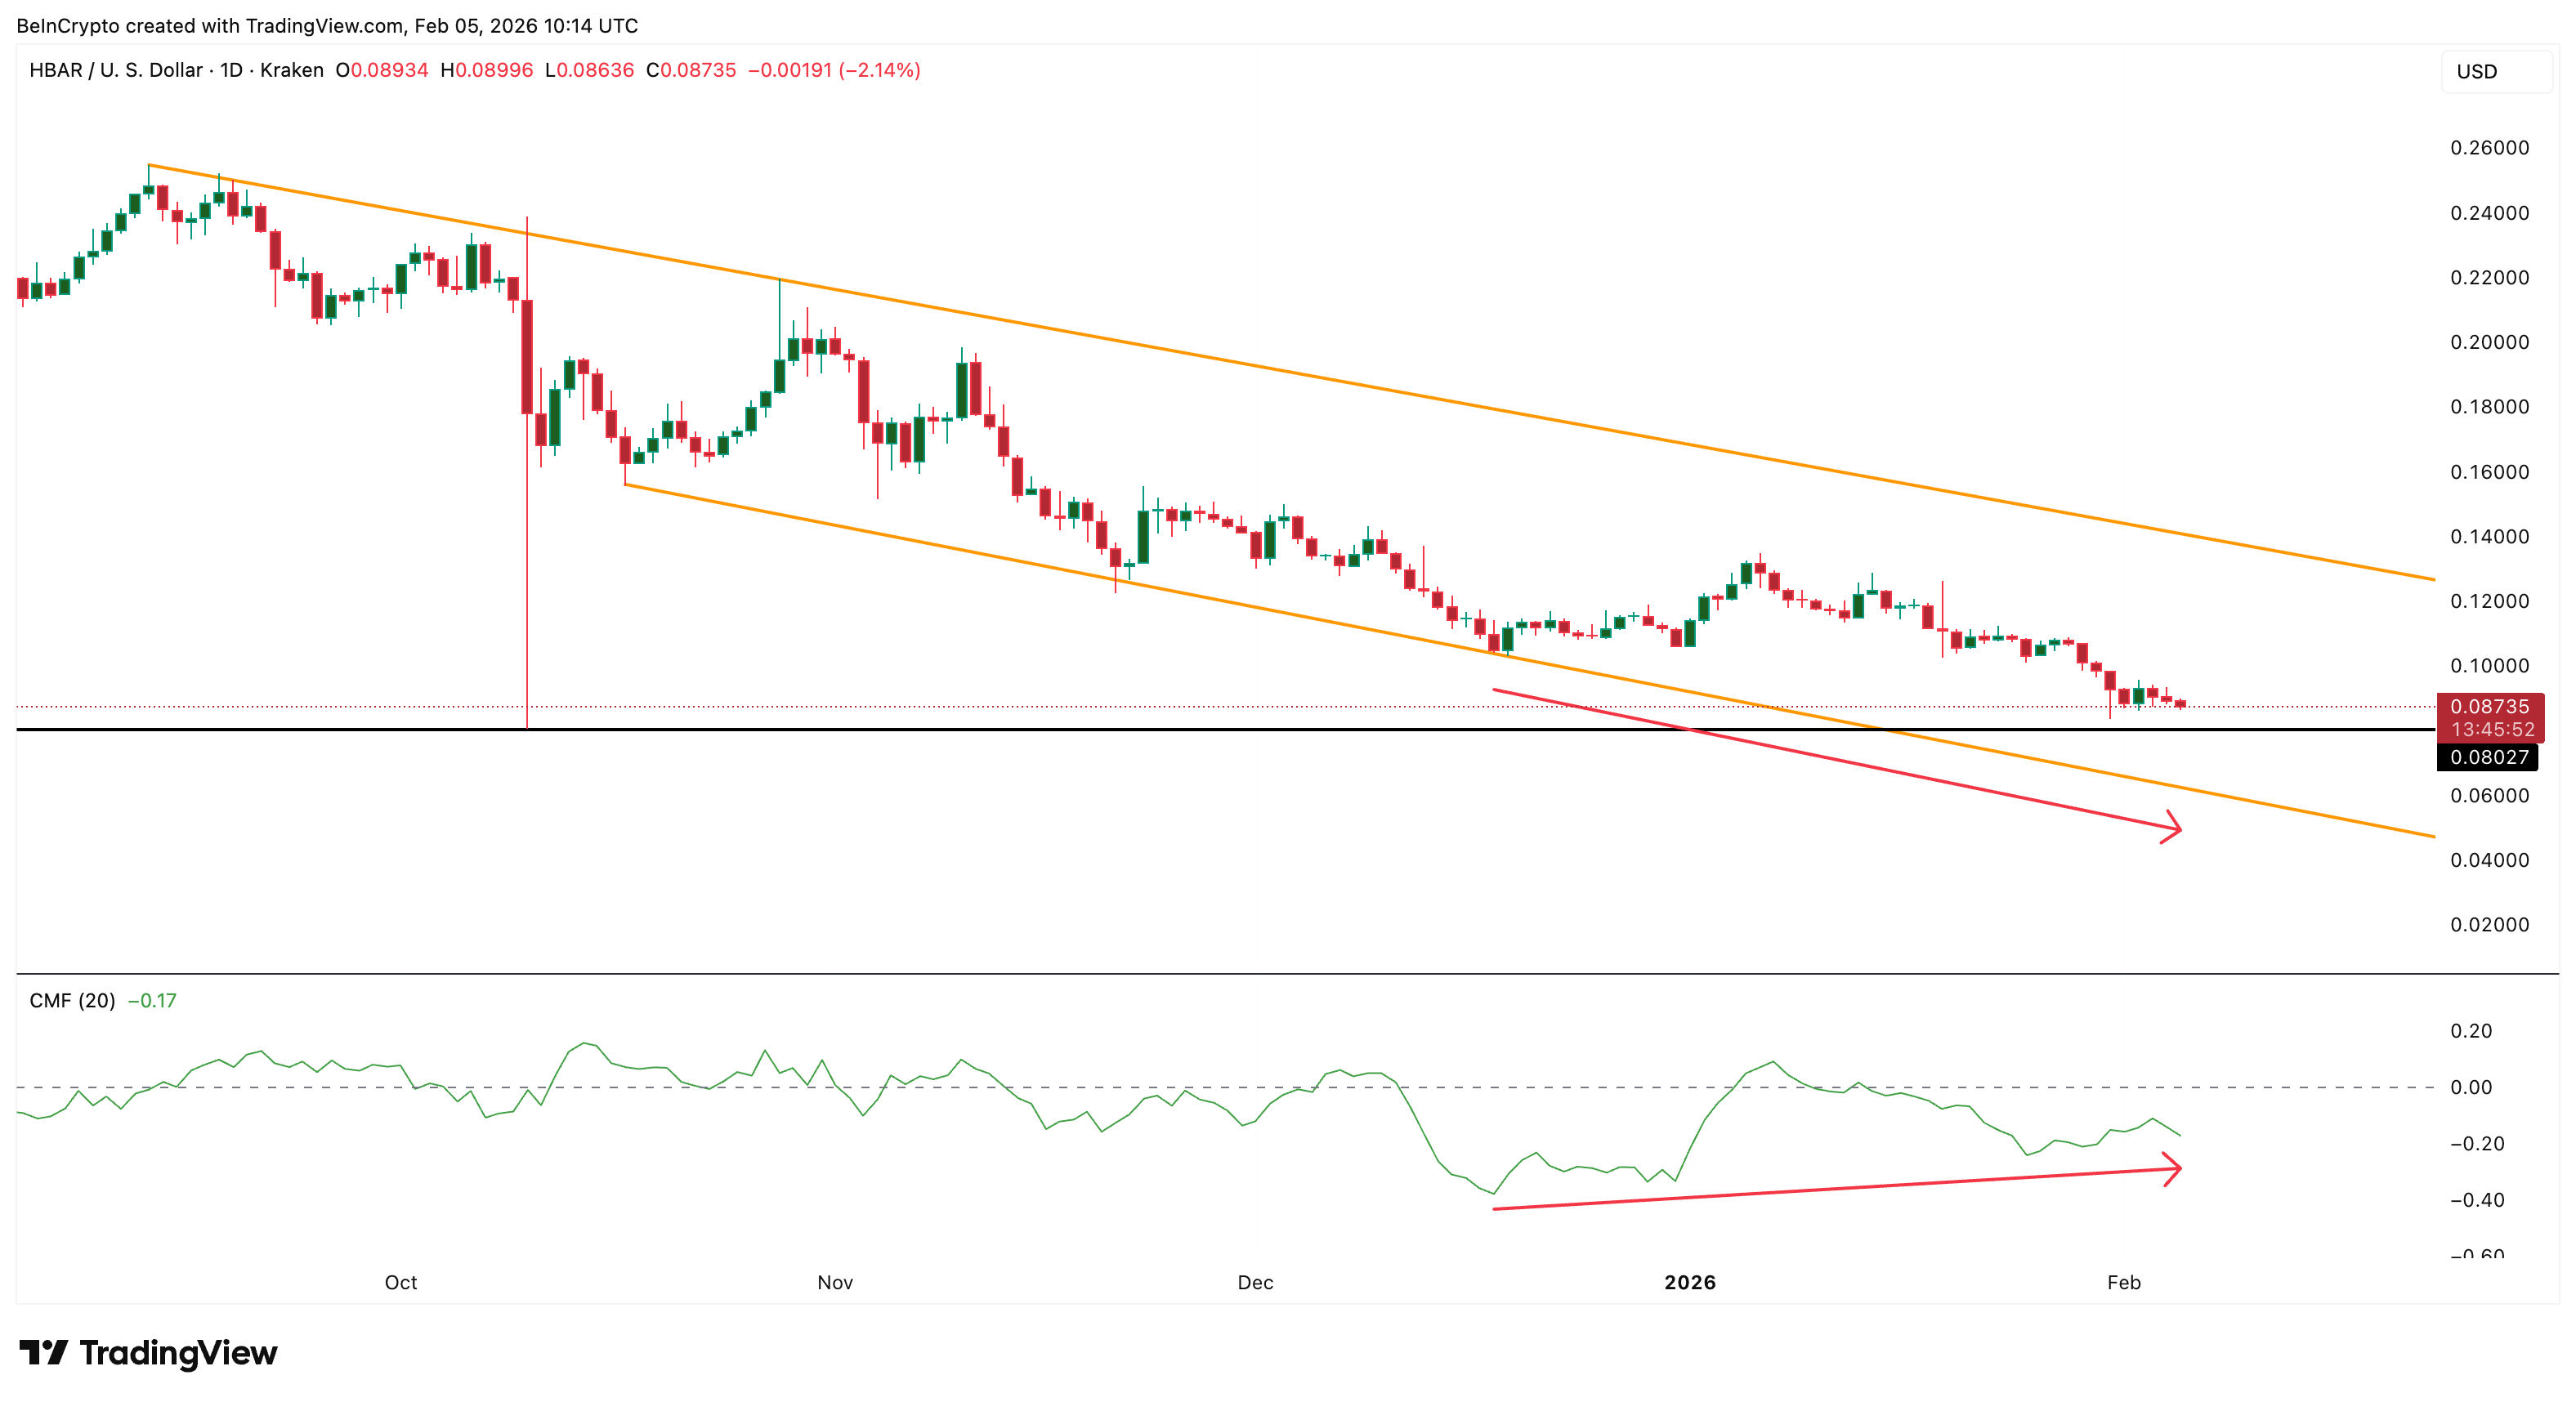
At the same time, spot HBAR ETFs have shown no recent inflows over the past two weeks. ETFs bring institutional capital and could help CMF move above the zero line. Their absence limits upside momentum.
The bigger warning comes from On-Balance Volume. OBV has been trending lower since October. This showed that participation and conviction were steadily weakening even during short-term bounces. Recently, OBV broke below this descending support line.
When OBV loses long-term support, it signals that selling pressure is accelerating and that market participation is deteriorating. It suggests that fewer buyers are stepping in, even at lower prices.
Sponsored
Sponsored
So the current setup looks like this:
- Some large buyers are accumulating slowly (CMF divergence)
- Institutional flows remain weak (ETF inactivity)
- Broader participation is shrinking (OBV breakdown)
Without strong volume support, rallies lack follow-through. This explains why HBAR continues to fail at resistance despite occasional inflow signals.
Until OBV stabilizes and ETF demand improves, upside moves are likely to remain fragile.
Sponsored
Sponsored
Falling Channel and OBV Breakdown Point to a 30% Risk Zone
The Hedera Price structure confirms this fragile setup.
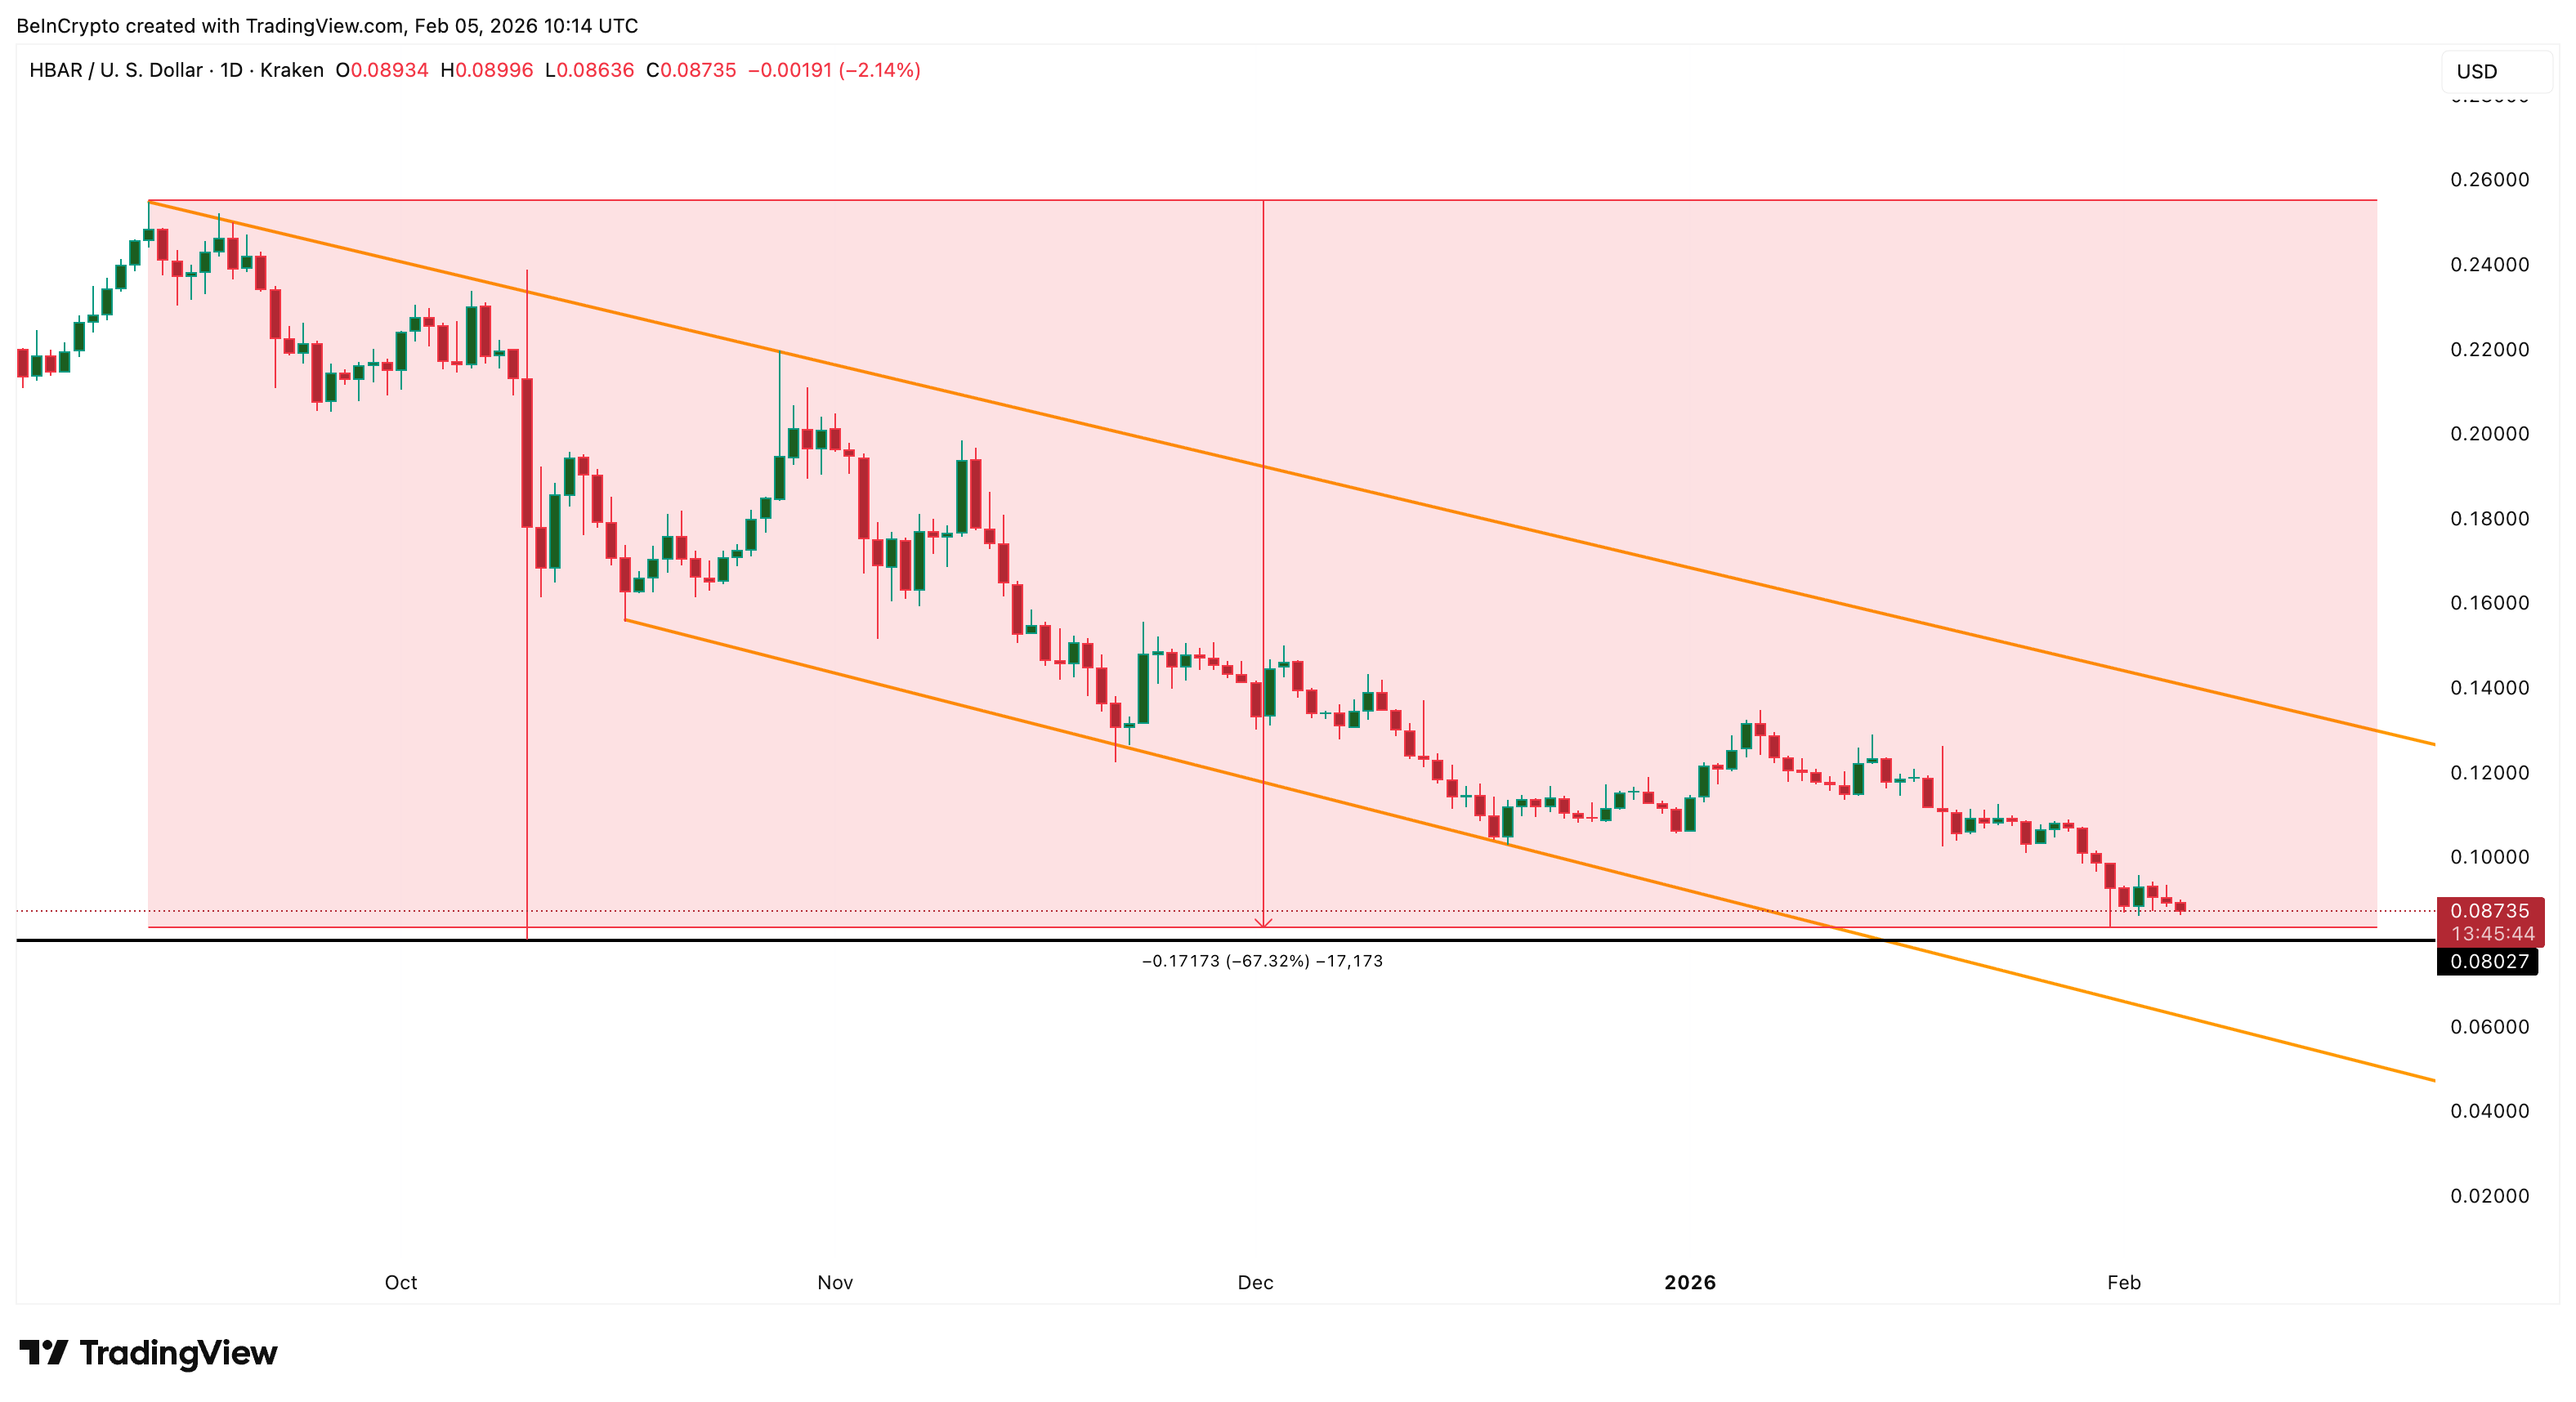
HBAR remains trapped inside a falling channel that has guided price lower since September, with a breakdown projection of around 30% if the lower trendline breaks.
The first major support sits near $0.080-$0.076. This zone has been in place since the October 10 crash. A daily close below it would weaken the structure. Below that, the next support lies near $0.062, based on Fibonacci extensions to the downside.
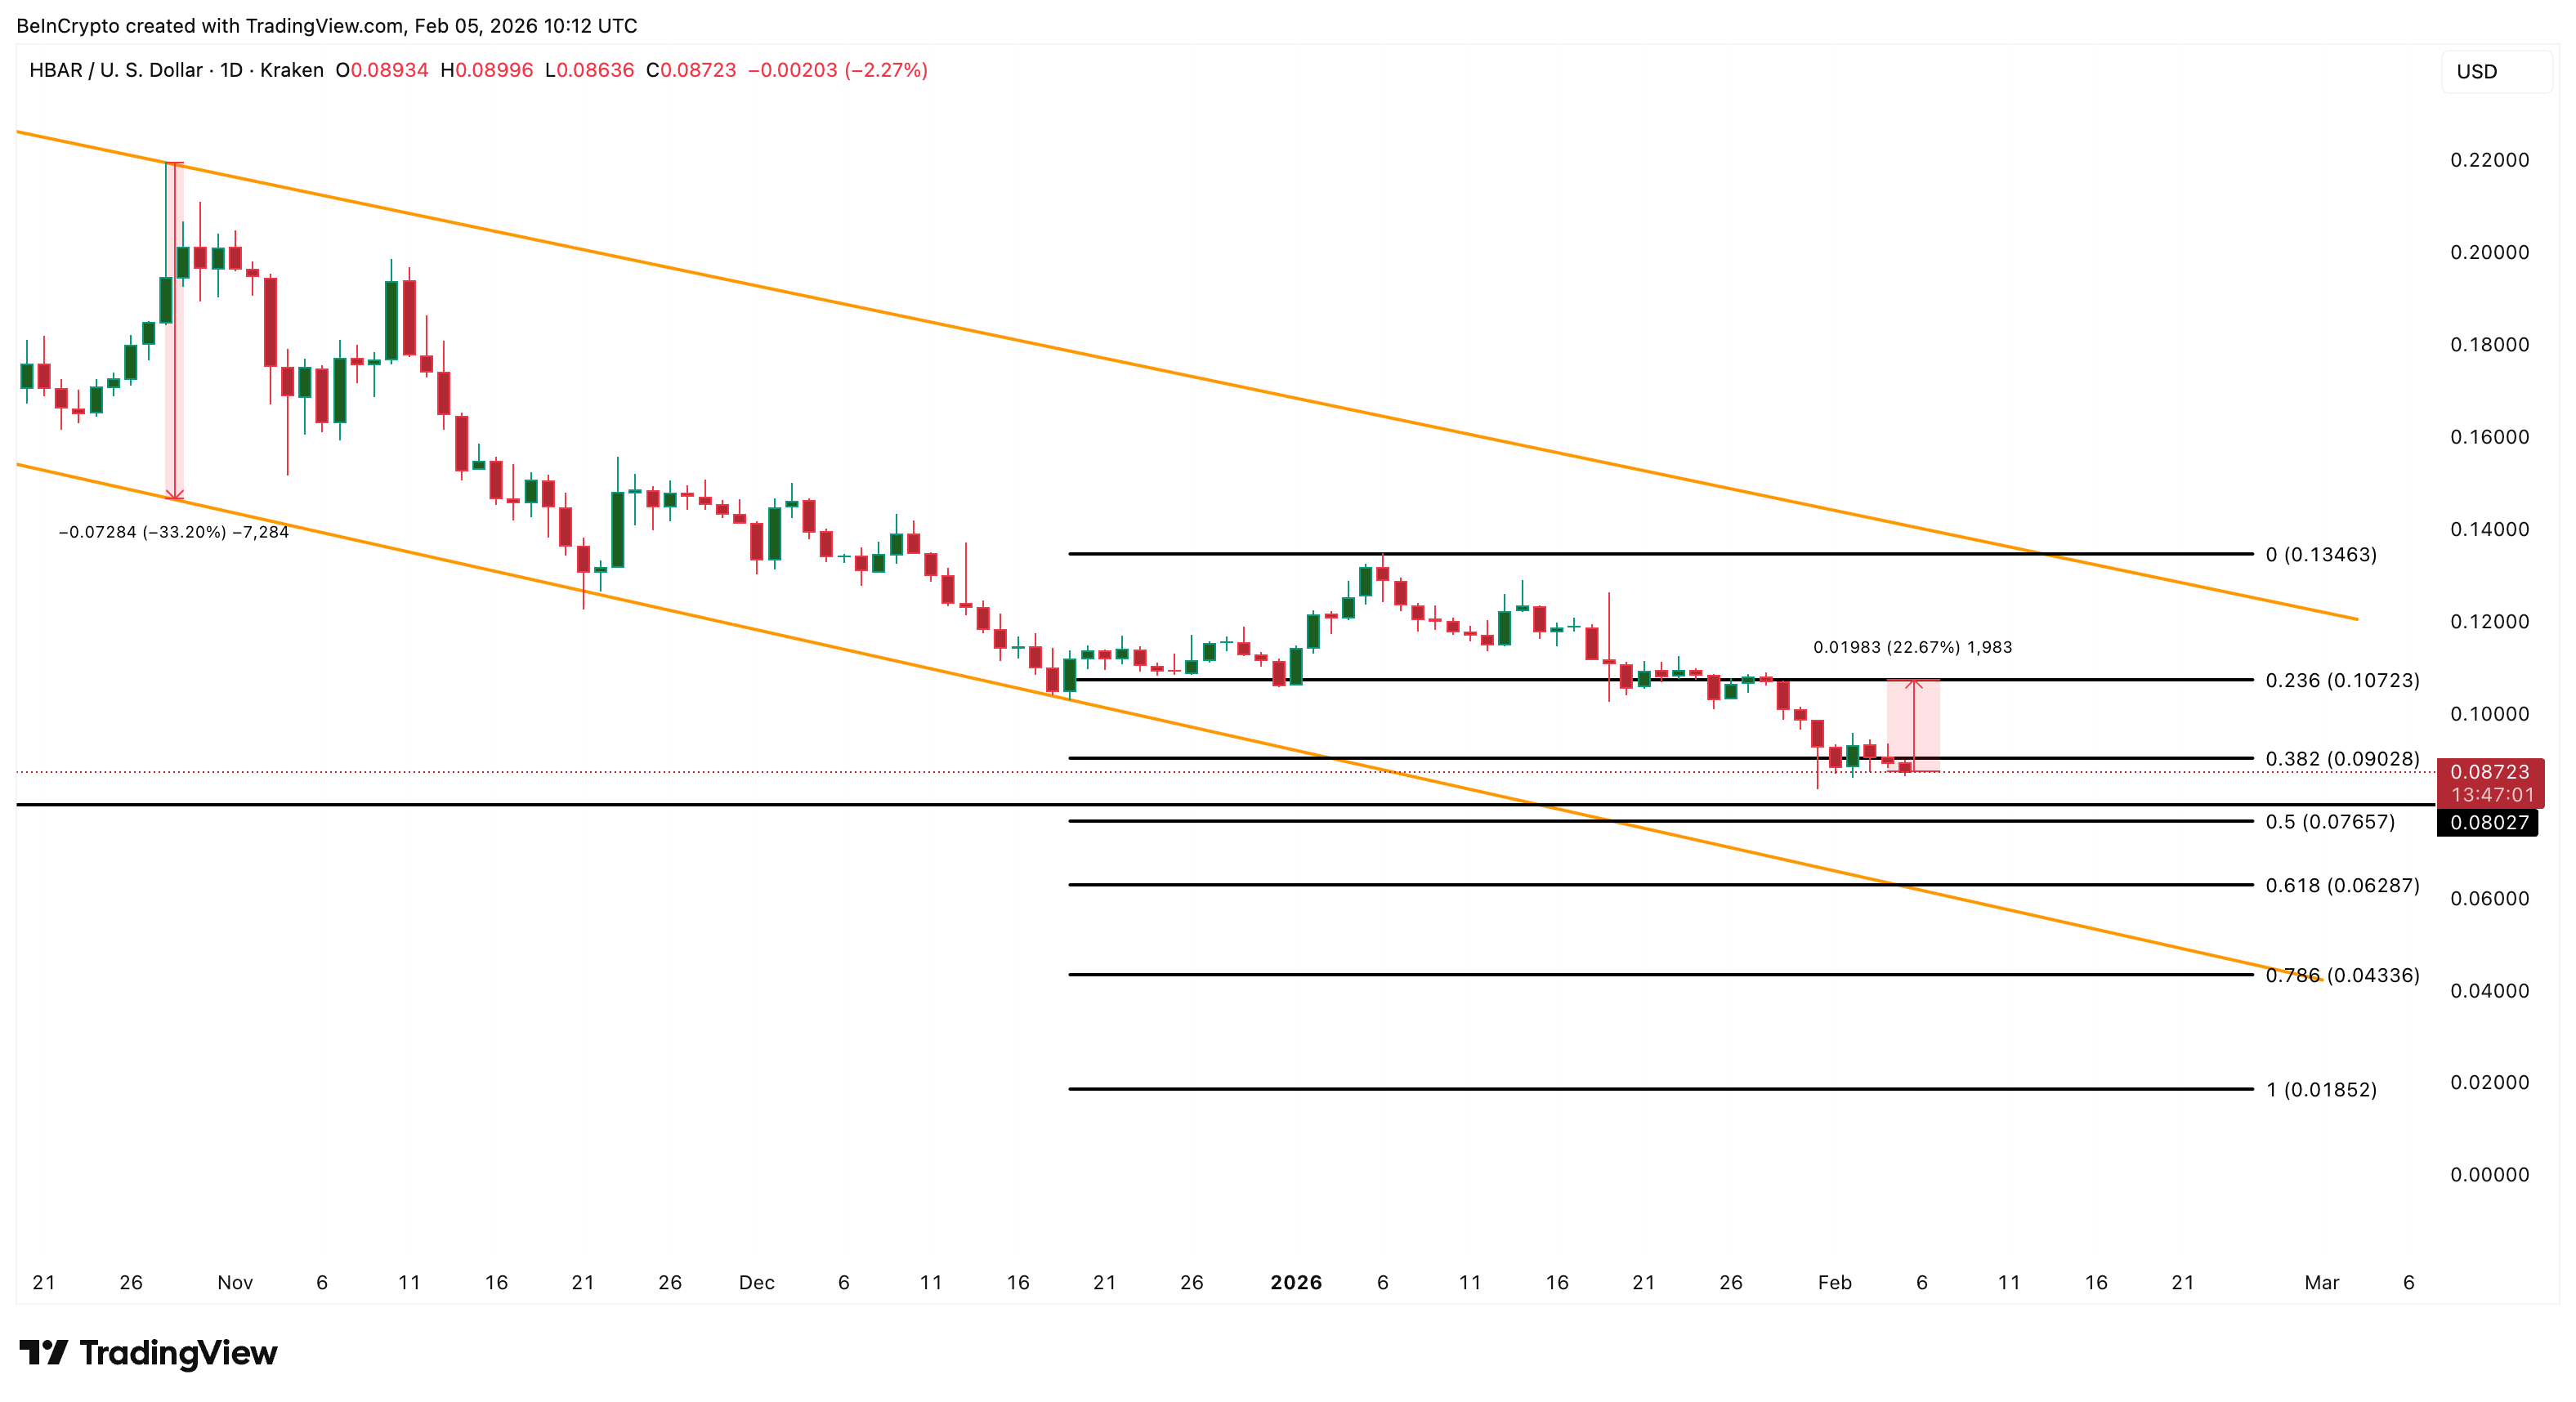
If this level breaks, the channel projection points toward $0.043, opening the 30% breakdown path. On the upside, recovery remains difficult.
HBAR must first reclaim $0.107. A move above $0.134 is needed to break the bearish channel. But that likely requires:
- A sustained TVL rebound
- Consistent ETF inflows
Without both, any HBAR price bounce attempt may fade quickly.

Crypto World
Caitlyn Jenner Wins $JENNER Memecoin Lawsuit as Federal Court Rules Token Is Not a Security

TLDR:
- A California federal court dismissed all Securities Act claims against Caitlyn Jenner over the $JENNER memecoin on April 16, 2026.
- The court ruled the $JENNER Ethereum token failed the Howey test due to lack of horizontal and vertical commonality among investors.
- Jenner’s 3% transaction tax gave her independent income regardless of investor losses, defeating vertical commonality claims in court.
- State law claims for fraud and quasi contract were dismissed without prejudice, leaving Greenfield the option to refile in California state court.
Caitlyn Jenner wins lawsuit after a California federal court dismissed all securities claims tied to the $JENNER cryptocurrency token.
Lead plaintiff Lee Greenfield had sued Jenner and her manager Sophia Hutchins, alleging the token was an unregistered security.
The U.S. District Court for the Central District of California ruled on April 16, 2026, that the Ethereum-based token did not meet the legal definition of a security. Greenfield had lost over $40,000 in the investment.
Judge Rules $JENNER Token Fails the Howey Test for Securities
The court applied the longstanding Howey test to determine whether the $JENNER token qualified as an investment contract.
That test requires proof of a common enterprise and an expectation of profits from others’ efforts. Greenfield could not satisfy either requirement, and the court dismissed the Securities Act claim with prejudice.
Greenfield argued that all token holders experienced identical percentage gains and losses, proving horizontal commonality.
The court disagreed, stating that parallel price movement does not substitute for pooling of investor funds. The SAC itself acknowledged that cryptocurrencies like the $JENNER token “lack utility other than as a store and transfer of value.”
Jenner and Hutchins made no development commitments behind the $JENNER token. Defendants described it plainly as “a memecoin on the Ethereum blockchain intended solely for entertainment purposes.” No funds were raised to build any product, software, or ecosystem connected to the token.
Jenner’s promotion included an AI-generated tweet image of her in a “JENNER ETH” T-shirt carrying an American flag.
A crowd member in the image held a sign reading, “LETS MAKE EVERYONE RICH!” Hutchins further promoted the project by touting Jenner’s ability to “bring attention and investors into the project,” citing her awards, fame, and powerful connections.
The court ruled that promotional activity alone could not replace the pooling structure that securities law requires.
Jenner’s Transaction Tax Seals Vertical Commonality Argument Against Plaintiff
Greenfield also pursued vertical commonality, pointing to Jenner’s holdings of over 20 million $JENNER tokens. He argued her financial stake linked her fortunes directly to those of investors. The court found otherwise, citing her 3% transaction tax as a decisive factor working in Jenner’s favor.
During a Twitter Spaces chat, Jenner said tax proceeds would fund Trump campaign donations, buybacks, and marketing.
When an X user pushed back, writing, “Use half of the taxes for buybacks. The community doesn’t like to just fund Trump. It would be fair to do half and half,” Jenner responded, “Not all taxes going for Trump.
The first distribution would be made when we hit 50m MC. And never said it would be ALL of them. Some have been used for buybacks, marketing, etc.” The court treated these statements as too vague to constitute meaningful managerial commitments.
Critically, the tax paid Jenner on every transaction whether investors profited or not. Under the Ninth Circuit’s ruling in Brodt v. Bache & Co., a promoter must share in investor losses for vertical commonality to exist.
The court noted that Jenner “kept hundreds of thousands of dollars in tax revenues for herself even as the investments of Greenfield and others became nearly worthless.” Because Jenner faced no downside risk tied to investor outcomes, the vertical commonality standard was not met.
With no viable federal claim remaining, the court declined jurisdiction over Greenfield’s state law claims for fraud and quasi contract. Those claims were dismissed without prejudice, allowing him to refile in California state court.
The court also denied any further attempt to amend the Securities Act claim, finding such an amendment would be futile. Jenner’s legal victory draws a clear legal boundary between celebrity-promoted memecoins and regulated securities.

Crypto World
Nomura survey shows rising institutional crypto adoption driven by regulation and diversification


Institutional investors are warming to digital assets, with improving sentiment and broader use cases emerging as key drivers of adoption, according to a new survey from Tokyo-based bank Nomura and its crypto unit Laser Digital.
The study, based on responses from more than 500 investment professionals in Japan, found that 31% of respondents now hold a positive outlook on crypto over the next year, up from 25% in 2024. Meanwhile, negative sentiment has declined, pointing to a gradual shift in perception as the asset class matures.
A central theme is diversification. Some 65% of respondents said they view crypto as a portfolio diversifier, while 79% of those considering exposure plan to invest within three years. Most expect relatively modest allocations — typically between 2% and 5% — suggesting institutions are still in the early stages of adoption.
That shift is being supported by a changing regulatory and policy backdrop. In Japan, policymakers have spent the past year refining crypto frameworks, including discussions around classification, taxation and investor protections. Globally, clearer rules in major markets — alongside the approval and expansion of crypto investment products such as exchange-traded funds (ETFs) and tokenized assets — have reduced some of the uncertainty that previously kept institutions on the sidelines.
As a result, interest is expanding beyond simple price exposure. More than 60% of respondents expressed interest in staking, lending, derivatives and tokenized assets, reflecting growing demand for yield-generating strategies and more sophisticated portfolio construction.
Stablecoins are also gaining traction, with 63% of respondents identifying potential use cases ranging from treasury management to cross-border payments and investment in tokenized securities.
Still, barriers remain. Concerns around volatility, counterparty risk and the lack of established valuation frameworks continue to weigh on adoption. Regulatory uncertainty, while improving, has not fully disappeared.
Even so, the survey suggests the conversation is shifting. Rather than debating whether to invest in crypto, institutions are increasingly focused on how to do so — a sign that digital assets are moving closer to becoming a standard component of institutional portfolios.


Peter Schiff, a well-known Bitcoin critic and gold advocate, has raised concerns about MicroStrategy’s ongoing Bitcoin acquisition strategy.
Summary
- Peter Schiff says MicroStrategy Bitcoin funding model may increase shareholder dilution through repeated share issuance.
- Company shifts toward 11.5% yield preferred shares as earlier funding methods become less effective.
- Debate continues as analysts disagree whether MicroStrategy faces risk or retains financial flexibility.
The company has continued to expand its holdings through a mix of debt and equity issuance.
Schiff stated that MicroStrategy’s approach is becoming harder to sustain under current market conditions. He said “the company is shifting toward more expensive capital” while referencing recent financing changes linked to preferred shares.
He added that earlier funding methods, which included issuing shares at higher valuations, are becoming less effective in the present environment.
MicroStrategy has recently relied more on preferred share offerings with higher yield obligations. Schiff noted that the company is now issuing instruments with yields around 11.5 percent.
He said ”these obligations cannot be covered by software earnings alone” when describing the firm’s financial position. The company’s core software business has limited profit contribution compared to its Bitcoin exposure.
Schiff stated that funding future purchases may require additional issuance of preferred shares, discounted equity, or Bitcoin sales. He argued this could increase pressure on shareholders through dilution over time.
Claims of structural risk and market reaction
Schiff described the company’s financing approach as vulnerable if market conditions weaken. He said the structure depends heavily on continued access to capital markets.
Canadian billionaire Frank Giustra also commented on the strategy, calling it ”a giant ponzi that will unravel when the next financial crisis hits” according to remarks cited in reports. He suggested that macroeconomic stress could expose weaknesses in the model.
The comments reflect ongoing debate over corporate treasury strategies that rely on digital assets as a primary reserve.
Additionally, market research group BitMEX Research provided a different view on MicroStrategy’s approach. The firm stated that MicroStrategy is not under forced liquidation pressure and still has financial flexibility.
BitMEX Research said ”nobody is forcing MSTR to do this” and described the strategy as potentially beneficial under current conditions. It noted that the company can adjust financing terms, including coupon rates, instead of selling assets.
The discussion continues as MicroStrategy maintains one of the largest corporate Bitcoin holdings while using structured financial instruments to support its accumulation strategy.
Bitcoin foreshadows fresh market mayhem as it appears that the US-Iran war has returned, including the closure of the Strait of Hormuz oil route.
Bitcoin (BTC) sought to protect $75,000 into Sunday’s weekly close as crypto surfed fresh uncertainty over the US-Iran war.
Key points:
-
Bitcoin price action sinks from ten-week highs amid fears that the US-Iran war has returned in full force.
-
Iran closes the Strait of Hormuz, bringing back the risk of an oil-price surge.
-
BTC price action faces ongoing resistance at a 21-week trend line into the weekly close.
Bitcoin abandons highs as US-Iran war fears return
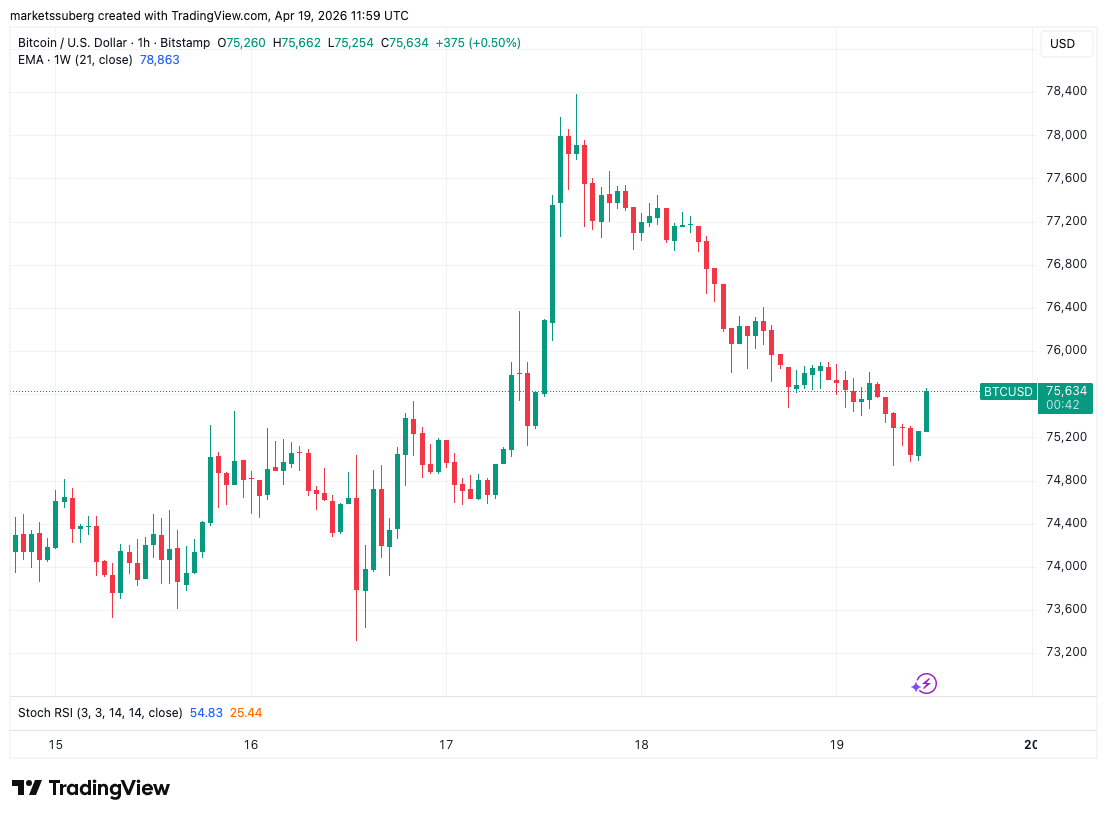
Data from TradingView showed BTC price pressure reentering after a trip to ten-week highs of $78,400 on Friday.

Mixed signals from US and Iranian sources characterized the weekend, with an assumed ceasefire and mutual agreements between the two sides now seemingly undone.
Among the latest developments was the repeat closure of the Strait of Hormuz, putting the focus on oil futures on the day. News of a ceasefire had sent WTI crude below $80 per barrel for the first time since March 10.
“We expect an eventful Sunday ahead,” trading resource The Kobeissi Letter summarized in ongoing analysis on X.

As BTC/USD circled local highs, and sentiment with it, market participants stayed cautious. Trading resource Material Indicators noted that the entire market mood could flip on relatively little input, such as a social media post.
“Sentiment is overwhelmingly bullish at the moment, but that could change with one Tweet in the coming days. Know your invalidations,” it told X followers.
Data from CoinGlass showed long positions coming under fire during the BTC price retracement, with total crypto liquidations at $260 million over the past 24 hours.

BTC price capped by resistance trend line
Continuing, trader Daan Crypto Trades eyed a potential gap in CME Group’s Bitcoin futures market opening as a result of the weekend comedown.
Related: Bitcoin can grow ‘probably a lot bigger’ than $30T+ gold market — Analysis
As Cointelegraph reported, such gaps often act as short-term price magnets when the new week begins.
“It’s going to be interesting to see the futures open today and how $OIL will react to the recent headlines regarding the strait,” he added.

Looking at the weekly close, trader and analyst Rekt Capital placed importance on Bitcoin’s 21-week exponential moving average (EMA) near $78,900.
“Bitcoin is rejecting from the 21-week EMA (green),” he observed alongside the weekly chart.
“It is this rejection that could force a post-breakout retest of the top of the Double Bottom (~$73k) next week, provided Bitcoin Weekly Closes just like this.”

This article is produced in accordance with Cointelegraph’s Editorial Policy and is intended for informational purposes only. It does not constitute investment advice or recommendations. All investments and trades carry risk; readers are encouraged to conduct independent research before making any decisions. Cointelegraph makes no guarantees regarding the accuracy or completeness of the information presented, including forward-looking statements, and will not be liable for any loss or damage arising from reliance on this content.


World has rolled out upgrades to its World ID protocol, positioning it as a wider digital identity layer for online verification.
Summary
- World ID now serves 18 million users across 160 countries with identity verification tools.
- System uses biometric scanning and cryptography to confirm humans without storing personal data.
- New features aim to block bots, deepfakes, and AI agents in digital platforms.
The system is designed to confirm whether an online user is a real person while keeping personal data private.
The network is currently used by close to 18 million people across around 160 countries. It aims to address growing issues linked to bots, automated accounts, and AI-generated identities in online environments.
World ID uses cryptographic methods to confirm uniqueness without sharing personal data. The system relies on an Orb device that scans biometric features and generates a secure anonymized identifier for each user.
The upgraded system introduces one-time-use nullifiers to prevent tracking across different services. These tools allow users to prove identity without exposing personal information or linking activity between platforms.
World ID also includes multi-key support, session control, and account recovery features. These functions are designed to improve system stability and support enterprise-level use while maintaining user control over identity data.
The company stated ”only cryptographic proofs are utilized, no personal information is stored” when describing how the system handles user data, according to project documentation.
Furthemore, World ID is being integrated into various digital services that require user verification. The system is used in areas such as ticketing platforms, gaming services, and online dating applications.
Examples include identity checks on platforms like Tinder and ticket systems designed to reduce automated resale. Tools such as Concert Kit aim to limit scalping by ensuring ticket buyers are verified individuals.
In enterprise use cases, the system has been linked to digital agreement tools and video verification services. Platforms such as DocuSign and Zoom are cited as potential integration points for human verification features.
Expansion toward AI and automated systems
The protocol also extends to AI agent environments. Developers can require human approval before automated systems complete sensitive actions or transactions.
World ID allows AI agents to be linked to verified human users. This setup is designed to support controlled automation in areas such as digital commerce and workflow systems.
The project stated ”the system enables accountability in automated environments” when describing its approach to AI integration. The focus remains on distinguishing human users from automated agents while maintaining privacy protection across digital platforms.

Former UK Prime Minister Rishi Sunak warned that the United States will recover from the 2026 Iran war far faster than the United Kingdom and Europe, calling America “the indispensable nation.”
Sunak argued that structural advantages give the US a larger buffer against geopolitical shocks. As a net energy exporter, America is shielded from the oil price spikes that have hammered import-dependent economies since the conflict began on February 28.
Why Europe Faces Greater Risk
In his column, the former prime minister pointed to a sharp asymmetry between the US and European economies.
Trade accounts for roughly 25% of US GDP, compared to 60-70% for the UK. That gap means disrupted supply chains and higher energy costs hit European economies harder.
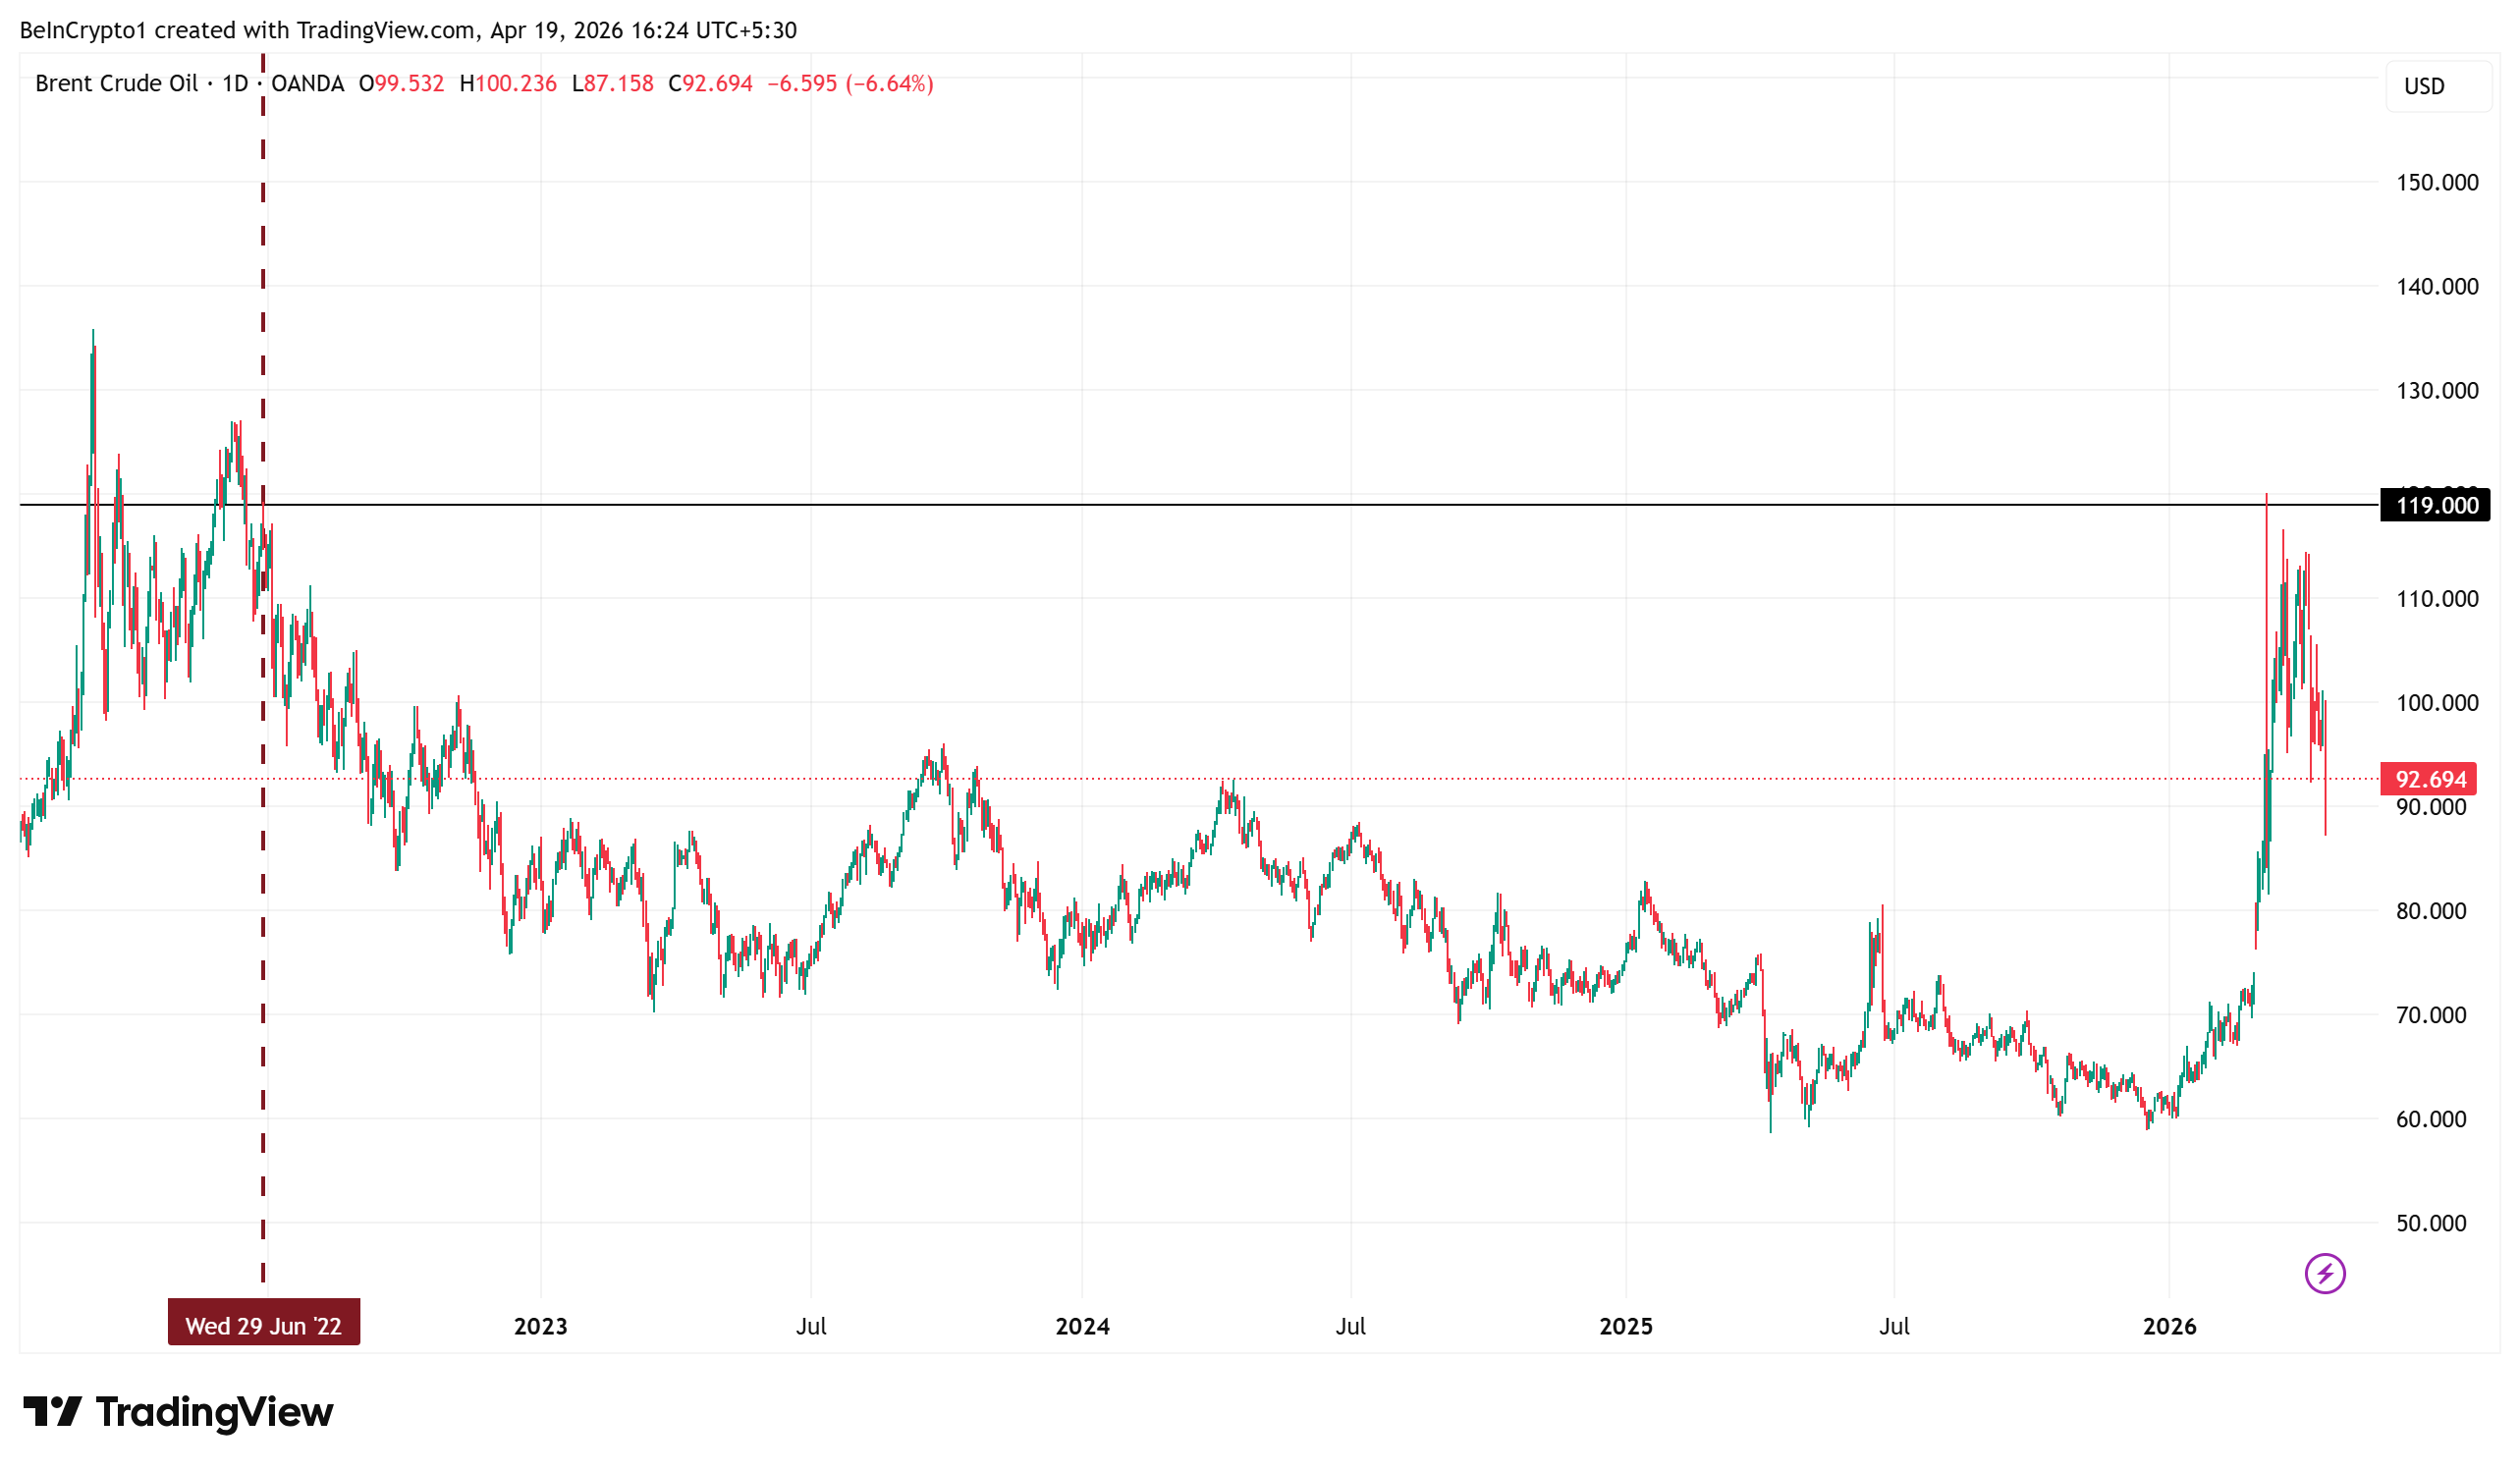
Since the Strait of Hormuz was disrupted in early March, Brent crude surged past $119 per barrel, levels last seen in June 2022. A fragile two-week ceasefire brokered in early April brought temporary relief, but oil still trades above $90.
Sunak also warned that post-WWII security arrangements are fraying. NATO allies have long underinvested in defense while relying on US commitments.
A more transactional American foreign policy, regardless of which administration holds power, accelerates that reckoning.
Sunak, who championed the UK’s ambition to become a global crypto hub during his time in office, framed his warning as a call for Europe to invest in energy independence, defense autonomy, and economic resilience rather than hoping the old transatlantic order returns intact.
The coming weeks will test whether the fragile ceasefire holds or whether a fresh escalation deepens Europe’s economic exposure.
The post Rishi Sunak Warns Europe Faces Deeper Iran War Fallout Than the US appeared first on BeInCrypto.
The BNB price prediction got a boost after BNB Chain destroyed 1.57 million tokens worth $1.02 billion in its 35th quarterly burn, dropping total supply to 134.79 million as the network pushes toward its 100 million target. That is real deflationary pressure hitting a token that already leads all Layer 1 networks with 4.5 million daily active users in Q1 2026.
But BNB gives you one way to earn: hope the price goes up. If it trades sideways for three months, your capital sat still. This breaks down where BNB heads next, why the burn matters, and how one presale pays two ways instead of one.
BNB Chain completed its 35th quarterly auto burn on April 15, removing 1,569,307 BNB from supply according to the BNB Chain Blog. The transaction is publicly verified on BSC. Blockchain.news confirmed remaining supply at 134.79 million, meaning 34.79 million more tokens still need to burn before hitting the 100 million target.
The burn follows the Fermi hard fork that cut block time to 0.45 seconds, and the network targets 20,000 TPS with sub second finality by end of 2026. Real usage drives the burns, not just price. And the presale that earns from two directions while BNB earns from one sits where utility meets the kind of entry that listings reprice overnight.
Why Holding BNB Alone Is Not Enough in 2026
BNB Gives You One Shot and Pepeto Gives You Two
You hold BNB after it dropped from $1,370 to $621, and the only way you make money is if the price climbs back, so if it trades sideways for three months your wallet shows zero gains because a single bet on direction delivers no yield and earns nothing during the wait.
Pepeto works differently by staking at 181% APY that adds tokens to your wallet daily regardless of market direction, so your holdings expand even during flat weeks as the first layer of returns, while the Binance listing eventually opens the gates and reprices the token to reflect what a working exchange handling real volume across three chains is actually worth, giving you two separate engines paying you instead of one hope and a prayer.
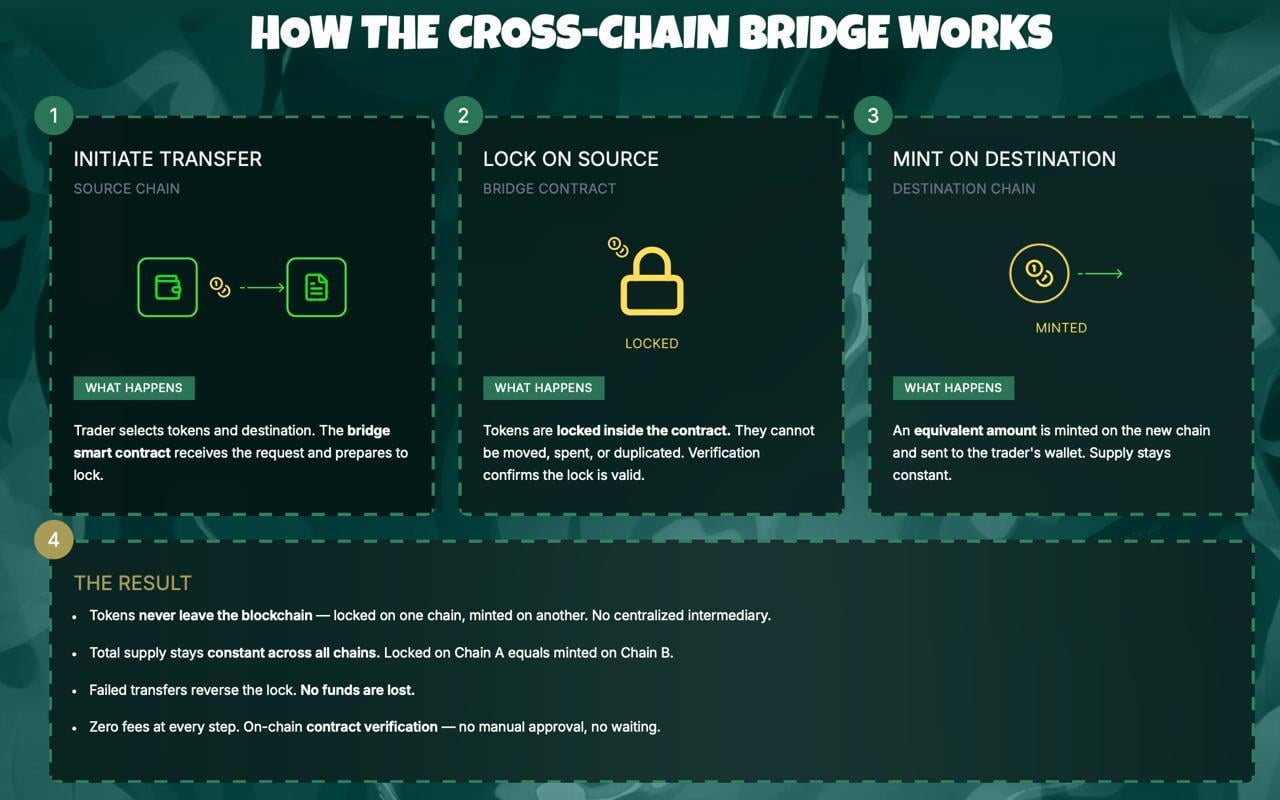
The cofounder who built Pepe to $7 billion designed it this way because one way to earn is not enough when half the market sits below all time highs, and PepetoSwap connects every blockchain with zero fee trading while the cross chain bridge handles Ethereum, BNB Chain, and Solana without gas and an AI scanner filters risky tokens before they appear, with SolidProof auditing every contract before the presale opened and $9.21 million entering during the same drawdown that took BNB from $1,370 to $621.
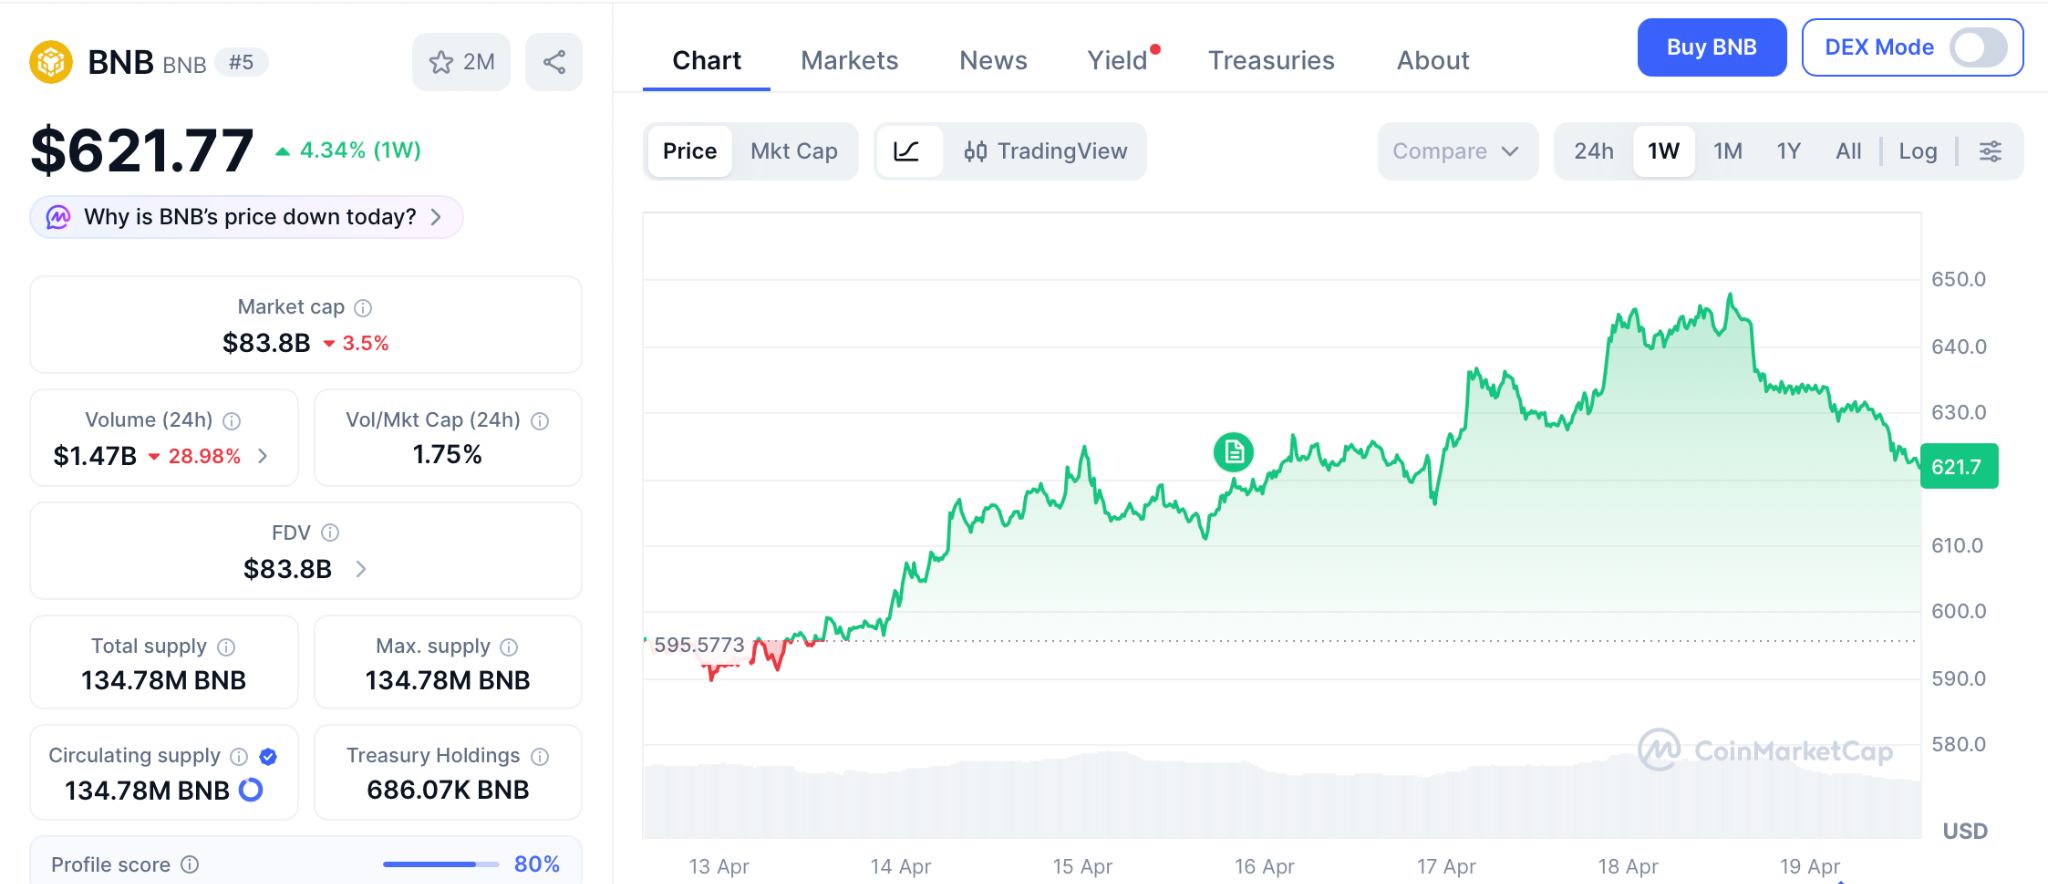
BNB (Binance Coin) Price at $621 as Quarterly Burn Shrinks Supply
BNB trades at $621 according to CoinMarketCap after rising 2% on the burn news. The token sits inside a $580 to $680 range, with the middle band acting as resistance. BNB Chain leads all Layer 1s with 4.5 million daily active users in Q1 and 322 million total holders, more than Ethereum’s 305 million.
Coinpedia targets $1,000 by Q3 if $600 holds, and Changelly projects a max of $1,121 for 2026. Even the bullish case from an $85 billion market cap cannot deliver the multiples a presale at six decimal zeros creates.
Final Takeaway
Every cycle teaches the same lesson, which is that the people who earned while they waited came out ahead no matter which way the price eventually moved, and the early BNB holders who bought at $0.15 and rode it to $700 did not just sit on price action, they earned exchange rewards along the way, and that same model is exactly what Pepeto offers right now at presale while BNB just burned a billion dollars in tokens and the chart barely flinched because burns alone do not create returns.
Pepeto pays from two directions starting today, with 181% APY compounding in every wallet that already moved and the Binance listing resetting the token permanently the moment the market gets access, and $9.21 million collected during extreme fear proves the conviction is backed by real capital from wallets that ran the math, so once this window closes the entry you see right now will only exist in the portfolios of the people who acted while the rest of the market was still deciding whether to believe it.
Click To Visit Pepeto Website To Enter The Presale

FAQs
What is the BNB price prediction after the $1 billion token burn?
BNB targets $680 to $1,000 in 2026 as quarterly burns shrink supply toward 100 million. Pepeto at presale pricing with 181% APY and a confirmed Binance listing offers higher return potential from a lower base.
What is Pepeto and why is it the best meme coin presale of 2026?
Pepeto is a meme coin presale combining viral energy with real utility through PepetoSwap zero fee exchange, a cross chain bridge, and an AI contract scanner. It has raised $9.21 million with 181% APY and a confirmed Binance listing led by the Pepe cofounder.
Disclaimer: This is a Press Release provided by a third party who is responsible for the content. Please conduct your own research before taking any action based on the content.
Crypto World
Poland’s Crypto Regulation Bill Blocked Again as Presidential Veto Stands for the Second Time
TLDR:
- Poland remains the only EU member state yet to comply with the bloc’s 2024 crypto-asset directive.
- Parliament secured 243 votes to override the veto but fell 20 votes short of the required 263 threshold.
- Finance Minister Domański warned the regulatory gap turns Poland’s crypto market into a fraud haven.
- PM Tusk alleged Zondacrypto was founded with Russian mafia funds, citing Polish intelligence agencies.
Poland’s crypto regulation bill has suffered another setback after a second failed parliamentary vote. On Friday, 243 MPs voted to override President Karol Nawrocki’s veto, short of the 263 required.
This marked the second unsuccessful attempt by Prime Minister Tusk’s government to advance the bill. The legislation seeks to align Poland with EU crypto-asset rules active since 2024. Poland remains the only EU member state yet to comply with the directive.
Parliament Falls Short of Override Threshold Again
Friday’s vote was the second parliamentary attempt to override Nawrocki’s veto on the crypto regulation bill. The first veto was issued in December last year.
In the latest count, 191 MPs supported the veto while 243 voted against it. Neither figure reached the 263-vote threshold needed to reverse the president’s decision.
Tusk’s coalition argues the bill is vital for protecting consumers and investors in Poland. The government says it would shield the crypto market from foreign exploitation and sabotage.
It would also strengthen Poland’s standing in the EU’s broader regulatory framework. The coalition views compliance with EU crypto standards as an urgent national priority.
President Nawrocki, backed by the opposition Law and Justice party, has vetoed the bill twice. His office cited overregulation, lack of transparency, and burdens on small businesses.
In December, the president’s office stated the bill “threatens the freedom of Poles, their property and the stability of the state.” Nawrocki has since returned it to parliament for amendments on both occasions.
Finance Minister Andrzej Domański was direct in his response after Friday’s vote. He warned that without regulation, Poland’s crypto market becomes an “El Dorado for fraudsters.”
Domański added that investors risk losing savings without proper legal safeguards. He also noted the veto leaves consumers and entrepreneurs exposed to unfair market practices.
Zondacrypto Allegations Deepen the Political Dispute
The debate has also centered on Zondacrypto, Poland’s largest cryptocurrency exchange. The platform lobbied against Tusk’s regulatory bill.
Citing the ABW domestic security agency, Tusk accused CEO Przemysław Kral of funding foundations linked to opposition figures. Among them is former Justice Minister Zbigniew Ziobro, who faces multiple charges in Poland.
On Friday, Tusk escalated his claims, alleging Zondacrypto was founded with Russian mafia money. He also alleged ties between the platform and Russian intelligence services.
“The problem is that this company, with such sources, has become a company that sponsors political and social events in Poland and promotes very specific political forces,” Tusk said. Polish intelligence agencies were cited as the basis for those claims.
Kral denied the allegations and rejected reports of operational issues at Zondacrypto. Those reports cited withdrawal difficulties and unpaid sponsorship partners.
He added that he does not hold the key to a $330 million crypto wallet. Former CEO Sylwester Suszek, who vanished in 2022, reportedly never transferred it to him before disappearing.
Interior Minister Marcin Kierwiński confirmed the government will press on with crypto regulation. He stated the effort will continue “until we succeed, until the awareness of the threats and these strange interests connecting certain right-wing politicians with this exchange finally reaches the president.”
Poland’s path to EU crypto compliance remains politically contested. The government remains committed to achieving full regulatory alignment with the EU.


Bitcoin developer and Hashcash creator Adam Back has responded to concerns raised by Nic Carter regarding a possible quantum computing milestone in 2029.
Summary
- Adam Back rejects claims that 2029 quantum computing threatens Bitcoin’s cryptographic security.
- Google quantum timeline seen as research milestone, not practical tool for breaking Bitcoin encryption.
- Bitcoin developers work on post-quantum upgrades including new secure address and signature systems.
Carter had suggested that advances in quantum systems could challenge Bitcoin’s cryptographic security.
Back dismissed the concerns during recent comments, stating that software protection continues to improve alongside hardware developments. He also responded to claims that Bitcoin could become exposed to quantum attacks, noting that current fears are based on future assumptions rather than present capability.
Back said ”2029 is a milestone in cloud quantum systems, not a tool for breaking cryptography” when referring to Google’s research direction, according to the discussion referenced in reports.
The discussion centers on whether quantum computing could generate enough processing power to break Bitcoin private keys. Experts cited in the debate note that this would require millions of stable logical qubits with full error correction.
Current quantum systems remain in early development stages and operate under controlled laboratory conditions. These systems are not yet capable of performing cryptographic attacks at scale.
Back stated that most projections place such capability beyond the current decade, based on limitations in hardware stability and error correction progress.
Moreover, work on post-quantum cryptography within the Bitcoin ecosystem is already ongoing. Developers are testing upgrade paths that could introduce quantum-resistant address types.
These proposals include research linked to upgrade paths such as BIP-361 and similar signature schemes. The aim is to allow users to move funds to new address formats if needed through network upgrades.
Back noted that “”software protection evolves faster than hardware threats”” when describing the pace of development in Bitcoin security measures compared to quantum computing progress.
Network upgrade path and long-term planning
Bitcoin’s structure allows for protocol changes through coordinated upgrades known as soft forks. Developers have indicated that quantum-resistant features could be introduced if required without immediate disruption to the network.
Quantum computers remain in experimental stages and are not widely deployed for commercial use. Current systems do not yet present direct risk to blockchain cryptography based on existing technical standards.
The debate continues within the crypto and academic community as research into quantum computing advances and Bitcoin developers maintain focus on long-term security planning.

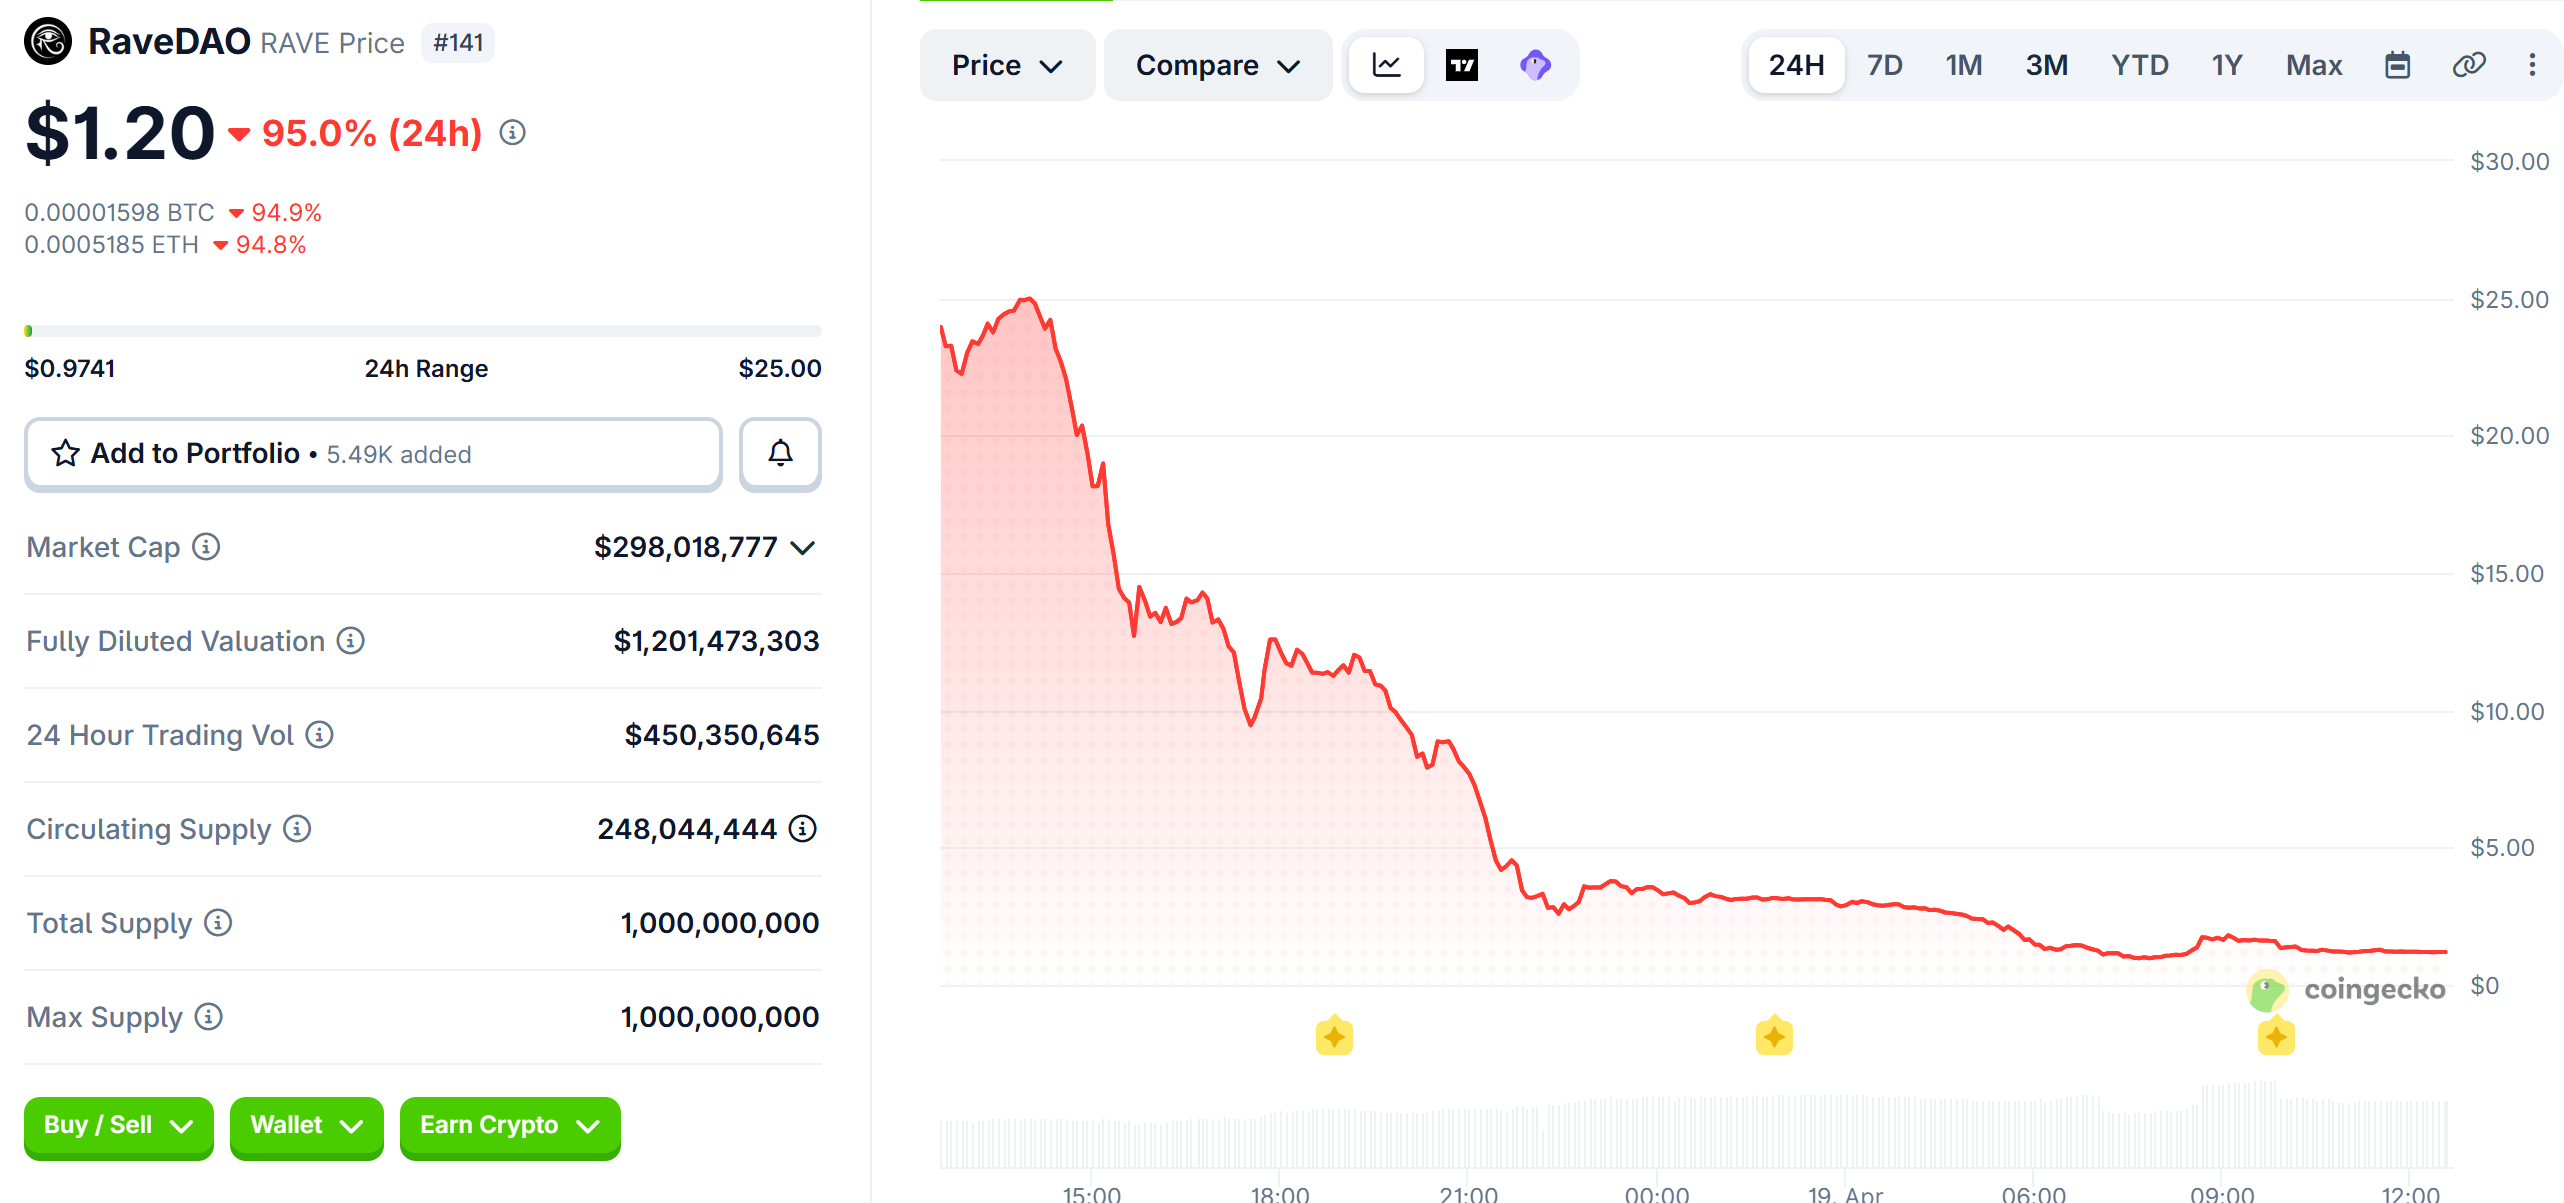
RaveDAO (RAVE) lost over 95% of its value in a single day, erasing $6.3 billion from its market cap after allegations of insider manipulation sent the token into freefall.
The collapse followed a parabolic rally that saw RAVE gain over 10,000% in two weeks, briefly pushing it into the top 20 cryptocurrencies by market capitalization.
Bitget CEO Gracy Chen Compares RAVE Crash to 2021 GameStop Frenzy
As of this writing, RaveDAO’s powering token, RAVE, is down 95% over the last 24 hours, almost reaching its floor price after topping out at $28.89 on Saturday.
Bitget CEO Gracy Chen compared the RAVE collapse to the 2021 GameStop (GME) short squeeze. She noted that GME, a struggling retailer with a fair value of $10 to $20, reached $483 on collective action alone.
Chen identified FOMO, tribal identity, and self-fulfilling prophecy as the psychological forces behind both events. She argued RAVE followed the same playbook, with X (Twitter) replacing Reddit and a meme coin replacing a physical stock.
On-chain analyst ZachXBT had previously flagged suspicious wallet movements, alleging that insiders held roughly 90% of RAVE’s circulating supply across three wallets.
Two wallets reportedly moved millions of tokens into Bitget during the token’s peak.
RaveDAO Responds to Allegations
RaveDAO denied responsibility for the price action. The team said it was exploring performance-triggered token locks and pledged to donate 20% of event profits to philanthropic causes.
Meanwhile, analyst Kyle Doops noted RAVE moved from euphoria to wipeout in days. Some traders also reported being unable to close positions on exchanges, raising further concerns about how platforms handled the volatility.
Still, some users have called out Bitget for its handling of the RAVE incident, describing the exchange’s response as immature and unprofessional.
Critics argued that liquidating user positions on both sides of the trade set a dangerous precedent. Several compared Bitget to FTX, warning that trust, not capital, is the foundation of any exchange, and once lost, it may be impossible to recover.
Both Bitget and Binance have confirmed internal reviews of trading activity surrounding RAVE.
The post Bitget CEO Draws GameStop Parallel As RaveDAO (RAVE) Falls Nearly 100% appeared first on BeInCrypto.

Emma Raducanu withdraws from Madrid Open

Iran says no date set for next round of negotiations with US
Caitlyn Jenner Wins $JENNER Memecoin Lawsuit as Federal Court Rules Token Is Not a Security

Why Israel is blocking foreign journalists from entering

Bitcoin: We’re Entering The Most Dangerous Phase

Alan Cumming Brands Baftas Ceremony A ‘Triggering S**tshow’

When Life Gets Hard, Choose Financial Stability | April 16, 2026

Wallet with no money. #viral #funny #comedy #shortvideos #reaction #viralvideo #viralshorts #prank

Ben McKenzie discusses his distrust of Bitcoin and cryptocurrency
-
 NewsBeat7 days ago
Pep Guardiola and Gary Neville agree over Arsenal title problem that benefits Man City
-

 Crypto World6 days ago
The SEC Conditionalises DeFi Platforms to Be Avoided for Broker Registration
-

 Fashion2 days ago
Weekend Open Thread: Theodora Dress
-

 Politics7 days ago
World Cup exit makes Italy enter crisis mode
-

 Crypto World6 days ago
SEC Signals Exemption for Crypto Interfaces From Broker Registration
-

 News Videos4 days ago
Secure crypto trading starts with an FIU-registered
-

 Sports2 days ago
NWFL Suspends Two Players Over Post-Match Clash in Ado-Ekiti
-

 Crypto World5 days ago
SEC Proposes Certain Crypto Interfaces Don’t Need to Register as Brokers
-

 NewsBeat5 days ago
Trump and Pope Leo: Behind their disagreement over Iran war
-

 Politics2 days ago
Palestine barred from entering Canada for FIFA Congress
-

 Crypto World2 days ago
Russia Pushes Bill to Criminalize Unregistered Crypto Services
-

 Sports6 days ago
NWFL opens Pathway for new Clubs ahead of 2026 Season
-

 Crypto World6 days ago
Trump whales load up ahead of Mar-a-Lago luncheon.
-
 Business3 days ago
Creo Medical agree sale of its manufacturing operation
-
Business6 days ago
Kering slides after Morgan Stanley downgrade, Gucci woes loom
-
 Entertainment5 days ago
Brand New Day’ Footage Reveals the Devastating Impact of ‘Now Way Home’
-

 Politics3 hours ago
Zack Polanski demands ‘council homes not luxury flats for foreign investors’
-
Crypto World7 days ago
Sei Network Enters Quiet Reset Phase as On-Chain Metrics Signal a Slowdown in 2026
-

 Tech6 days ago
Google adds E2E encryption to Gmail for iOS and Android enterprise users
-

 Tech6 days ago
Apple glasses won’t go brand shopping like Meta did with Ray-Ban and Oakley
You must be logged in to post a comment Login