
Crypto World
Can 1 Million New BNB Holders Undo Price Crash to 7-Month Low?
BNB has experienced a sharp correction, with the price falling from $900 to near $700 in recent sessions. The decline erased months of gains and pushed the asset to a seven-month low.
While selling pressure has dominated, the downturn may not be finished unless holder behavior shifts. Emerging on-chain trends suggest conditions could still change.
BNB Is Observing A Flood Of New Holders
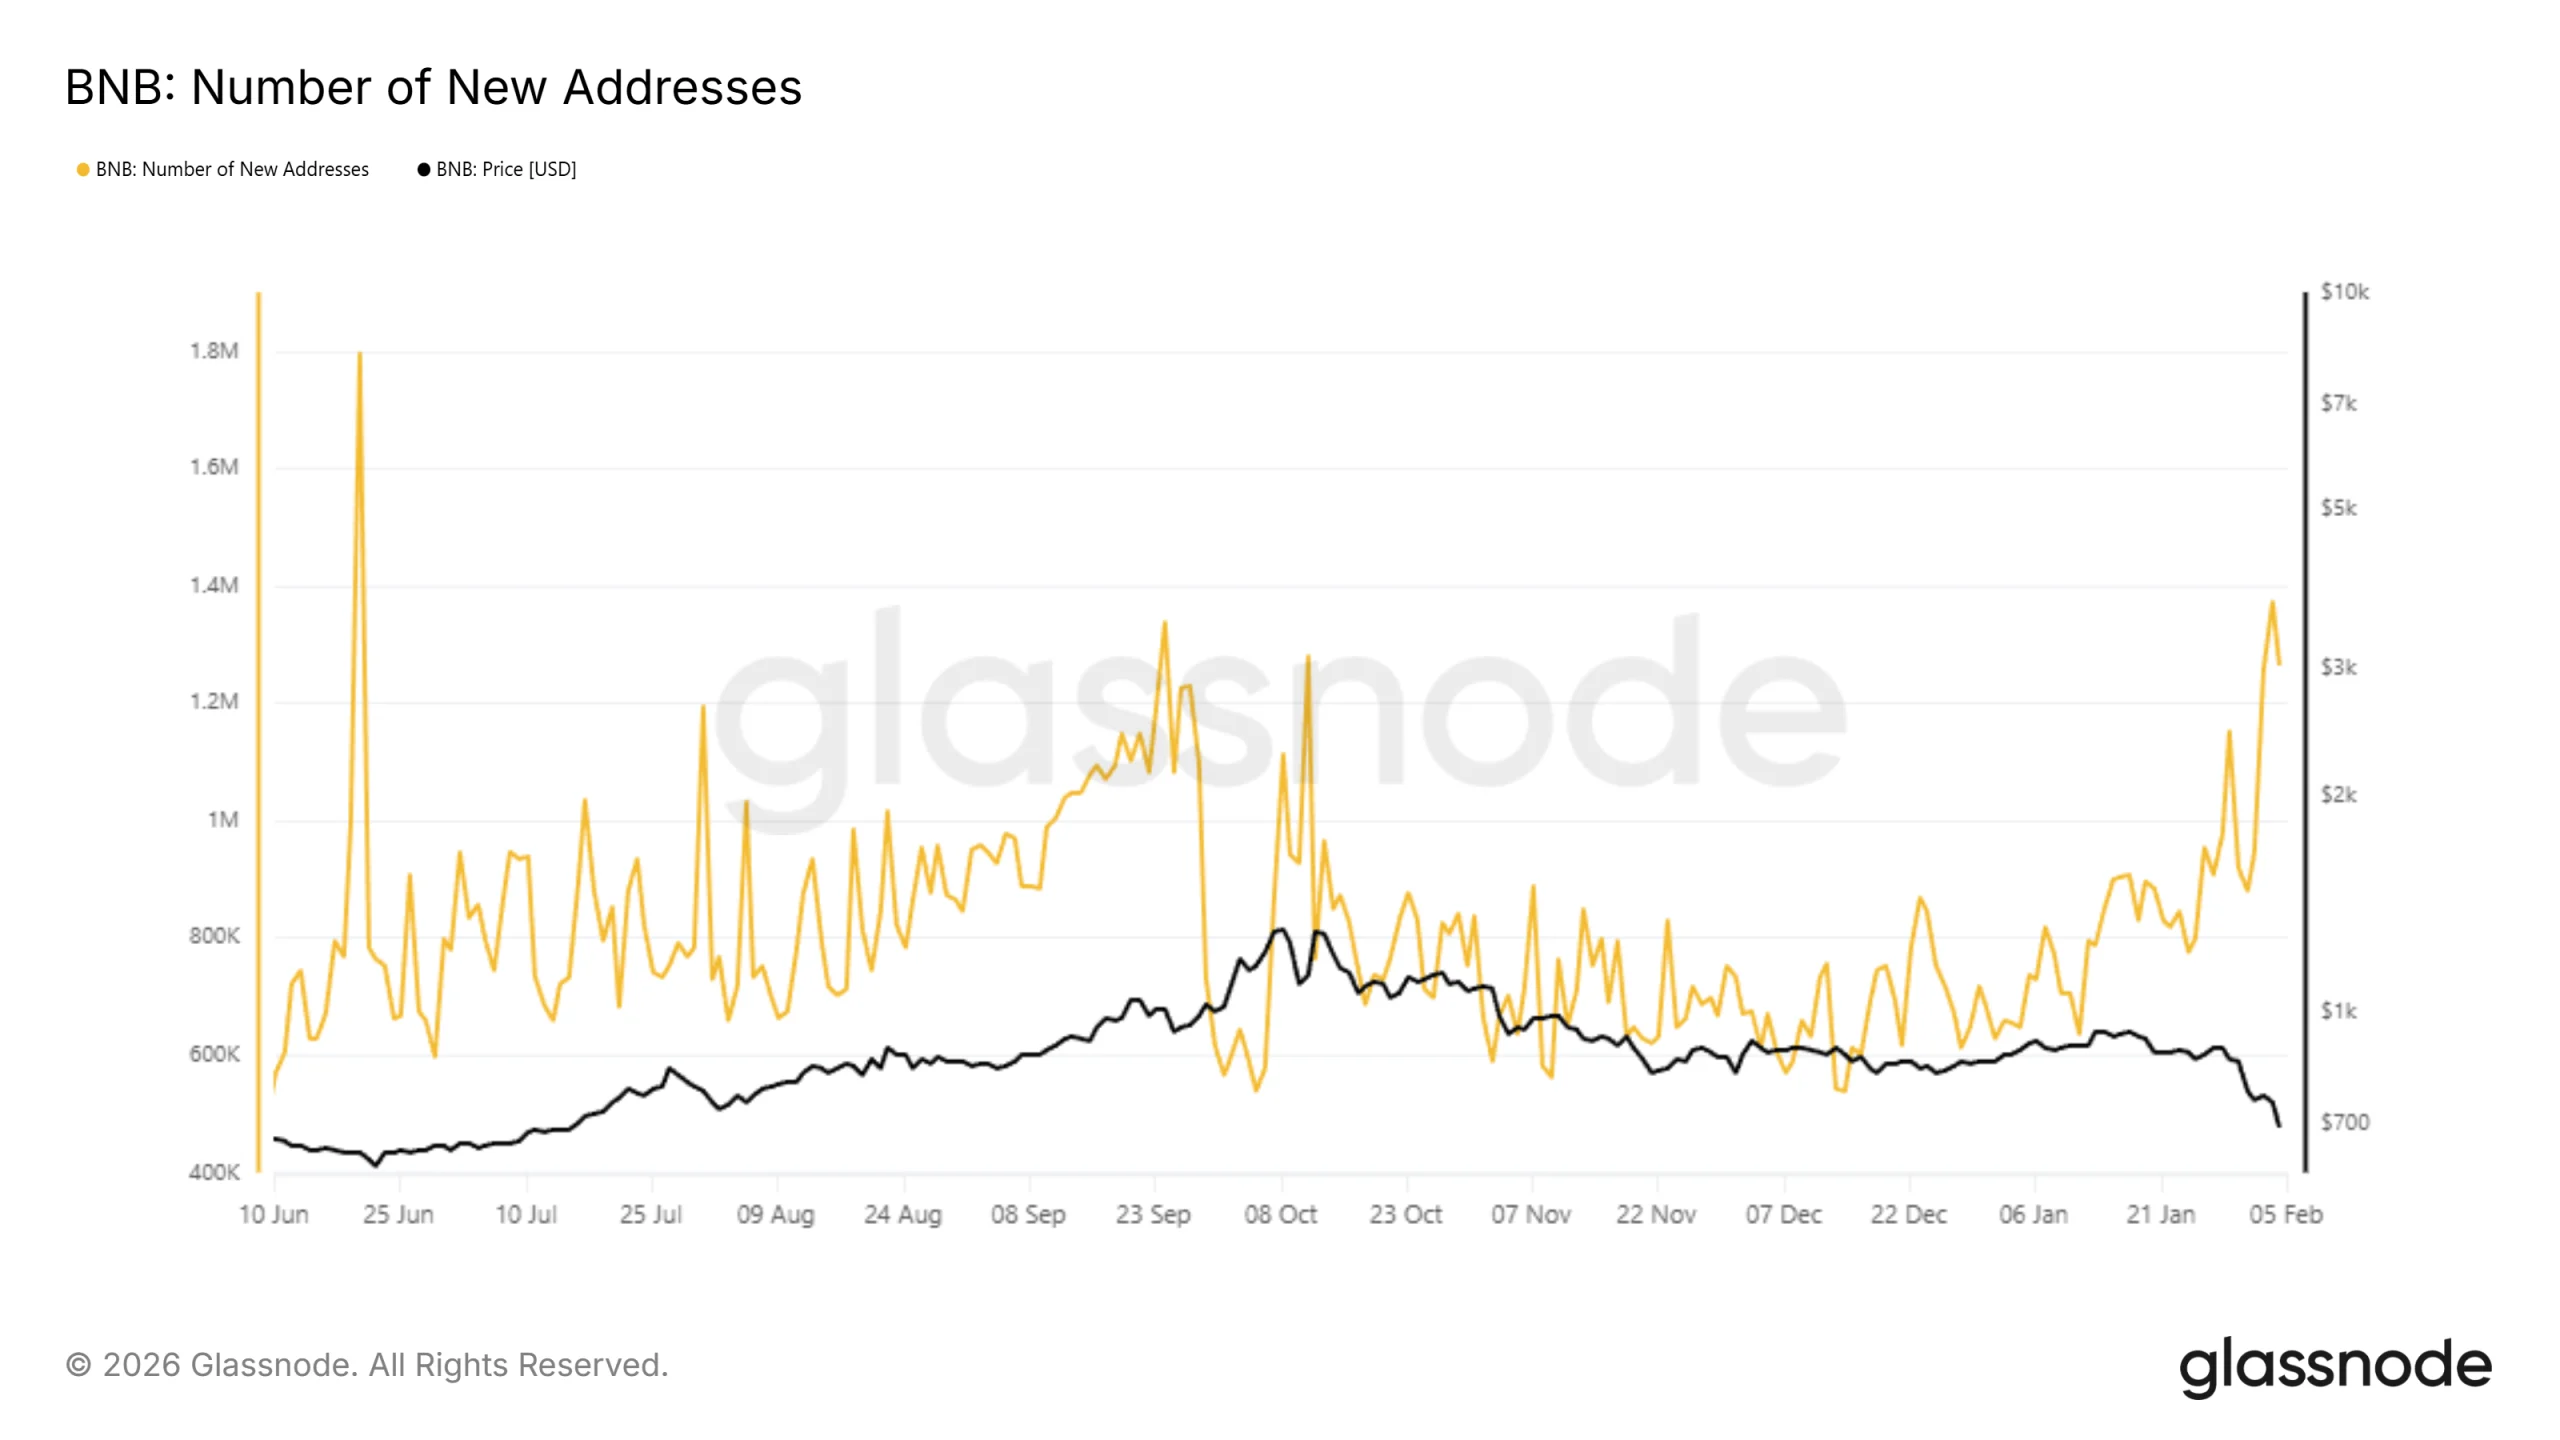
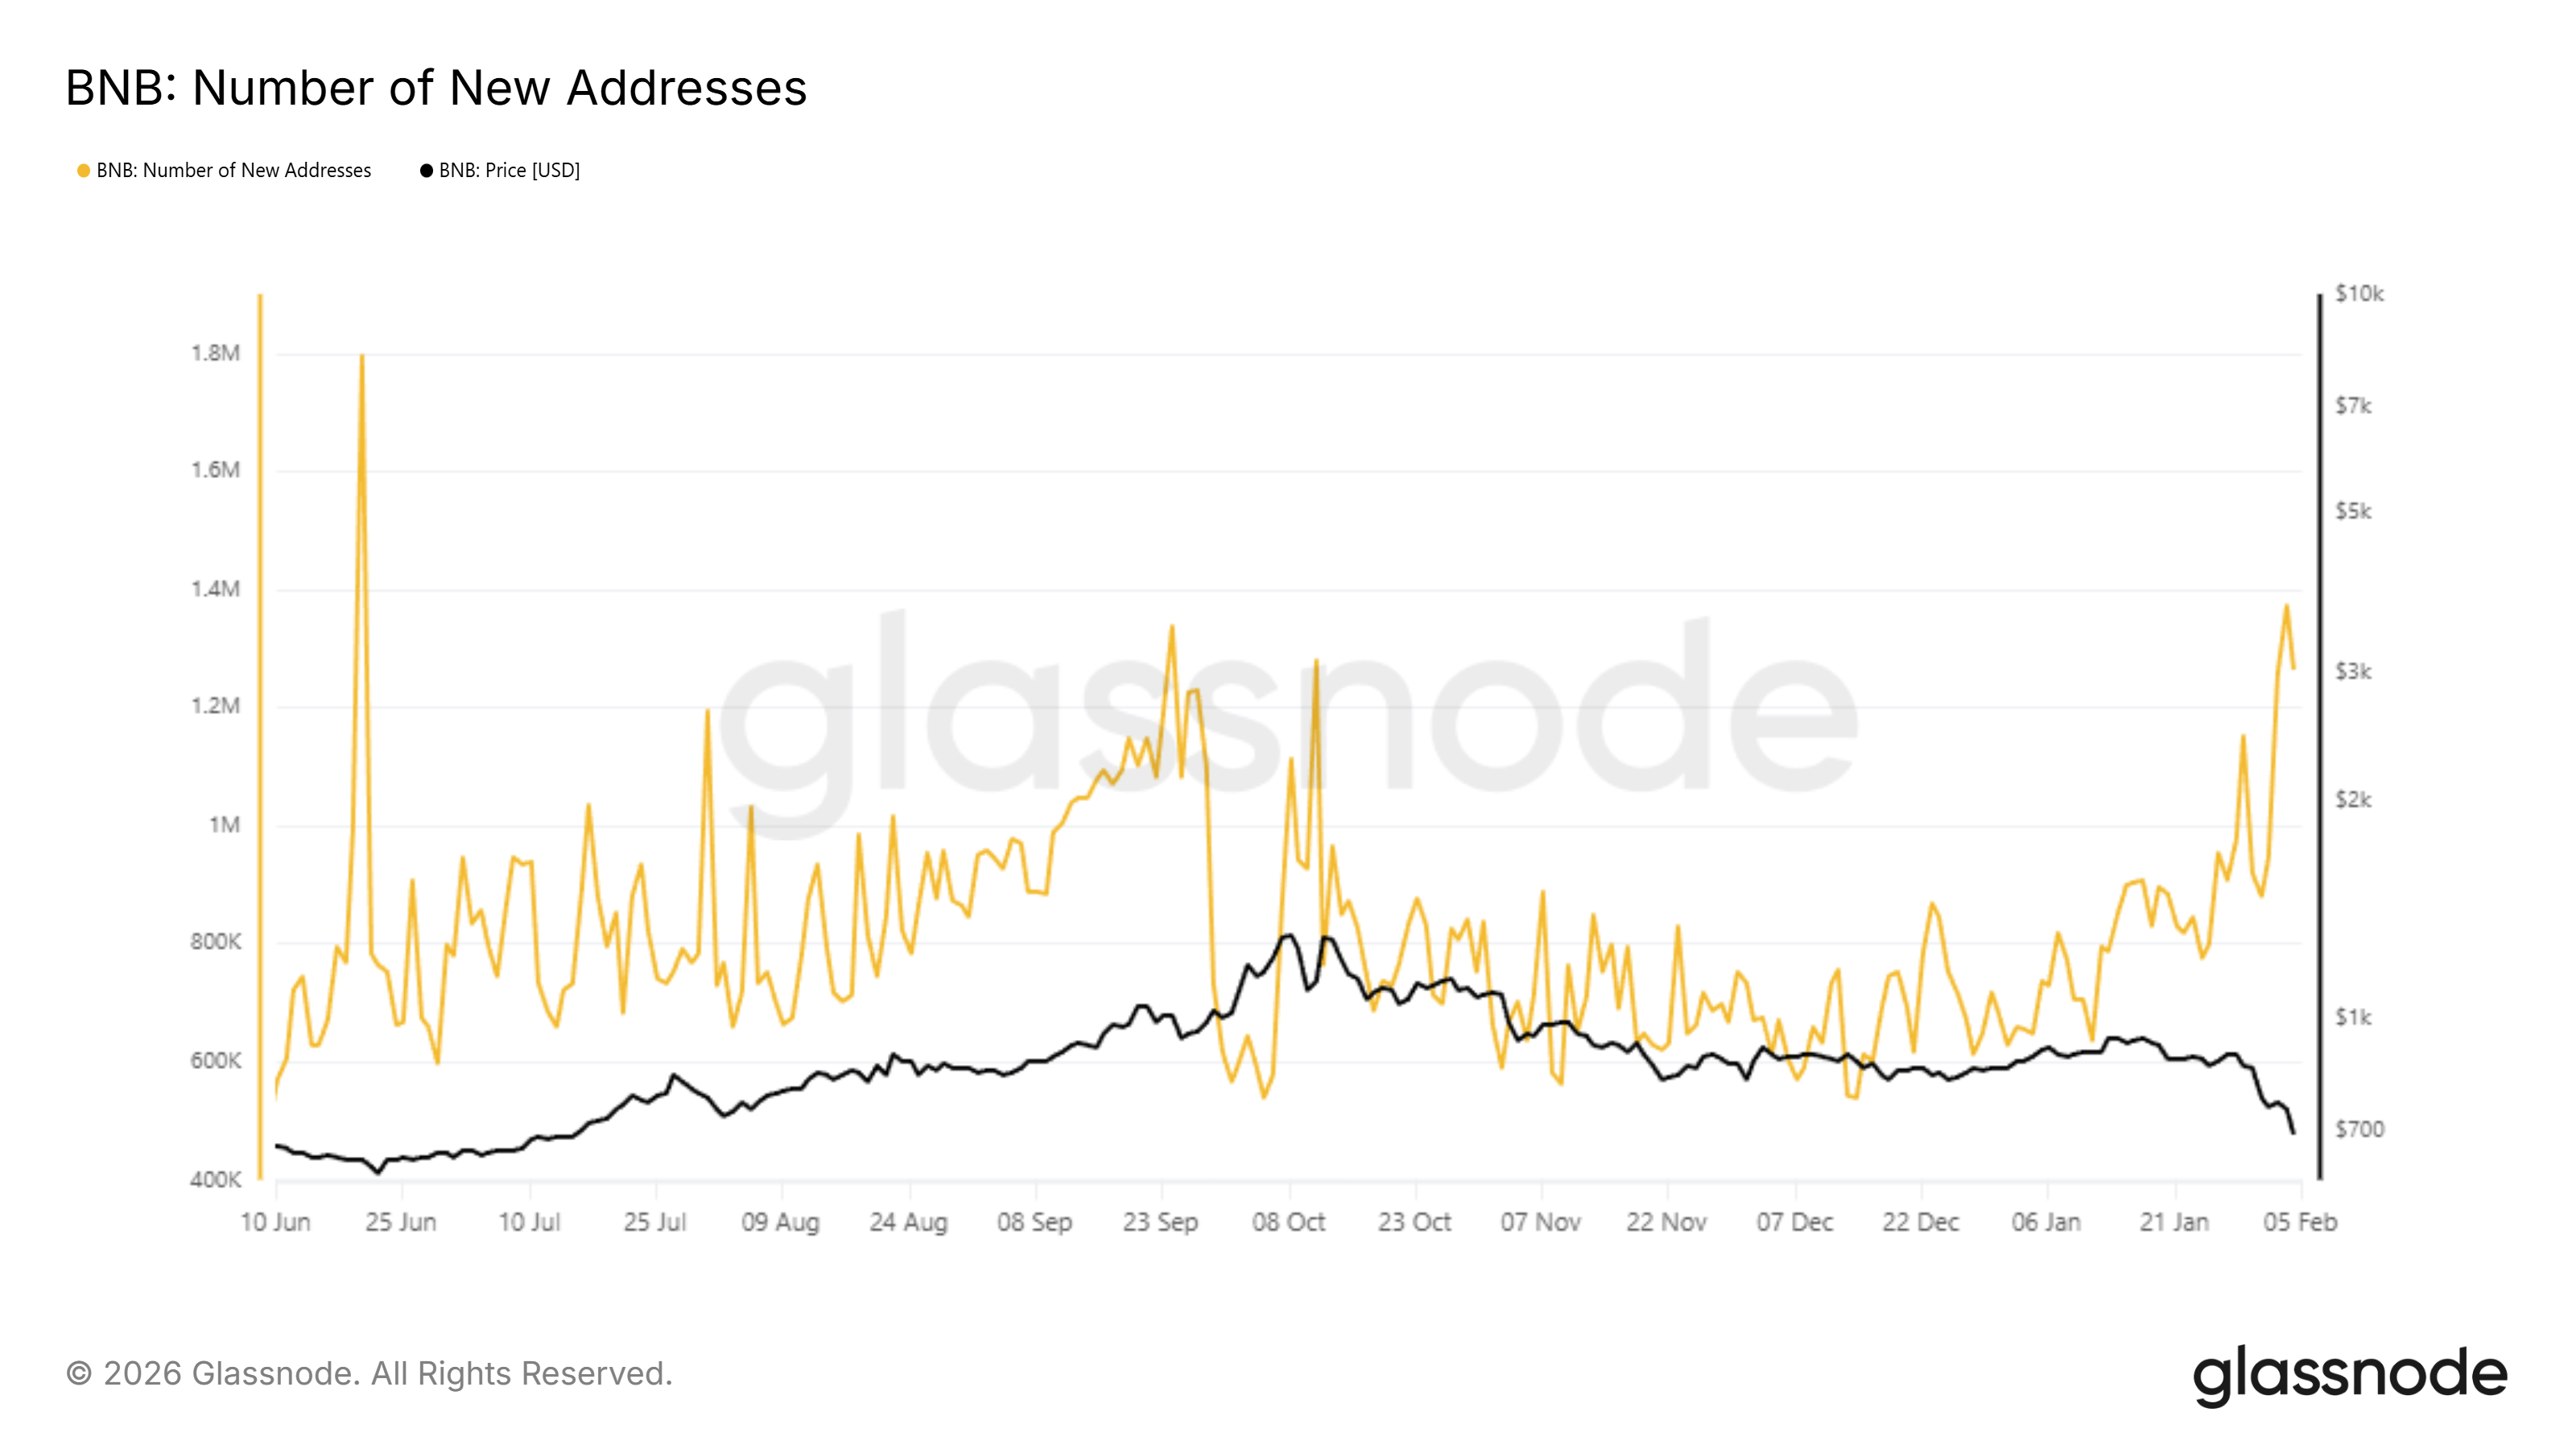
BNB’s network activity has shown notable strength despite the price crash. New address creation has risen consistently over recent days, peaking near 1.3 million additions. Even now, the network continues to add more than 1 million new addresses daily. This growth signals sustained interest during a volatile period.
Sponsored
Sponsored
New addresses are significant because they often represent fresh capital entering the ecosystem. While existing holders are facing selling pressure, new participants can help absorb supply. Historically, strong network growth during corrections has supported stabilization. For BNB, this influx may counterbalance distribution if buying interest persists.
Want more token insights like this? Sign up for Editor Harsh Notariya’s Daily Crypto Newsletter here.
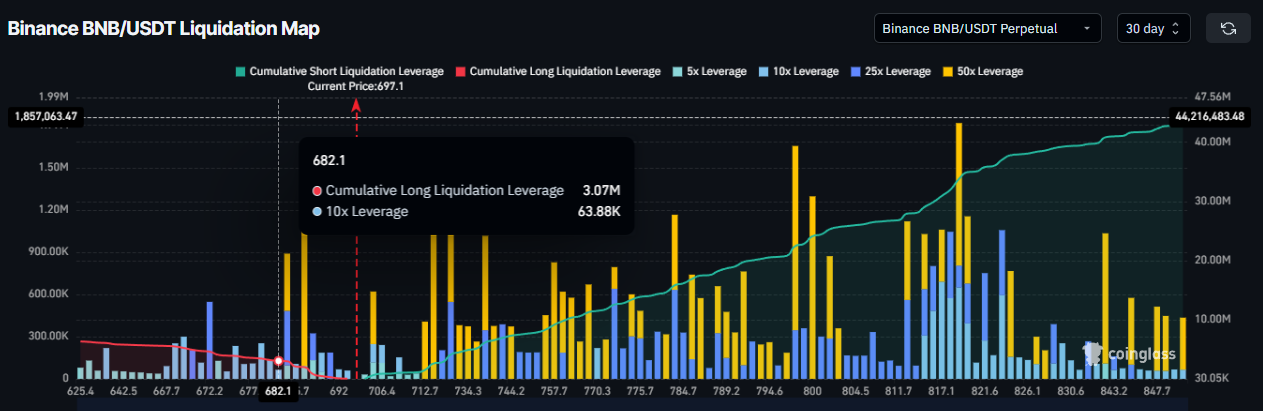
Despite improving on-chain participation, derivatives data remains bearish. Futures market positioning shows a clear skew toward downside risk. Liquidation maps highlight approximately $43 million in short liquidation leverage compared with just $6 million on the long side. This imbalance reflects strong bearish conviction among leveraged traders.
Such positioning often amplifies volatility. If price continues to decline, long liquidations could accelerate losses. The map shows the largest cluster of long contracts sitting at $682, BNB’s next support. Losing this support would also trigger $3.07 million in long liquidations. For now, the dominance of bearish exposure suggests caution.
BNB Price Correction Could Continue
BNB price has declined 22.5% over the past seven days and is trading near $698 at the time of writing. Technical indicators point to continued weakness. The Fibonacci Extension tool identifies $682 as the next major support level, making it a critical zone for near-term price stability.
If broader market conditions remain bearish, downside risks increase. Continued liquidations or heightened volatility could push BNB below $682. A breakdown there would likely send the price toward $650 or lower. Such a move would deepen losses and reinforce bearish sentiment among short-term investors.
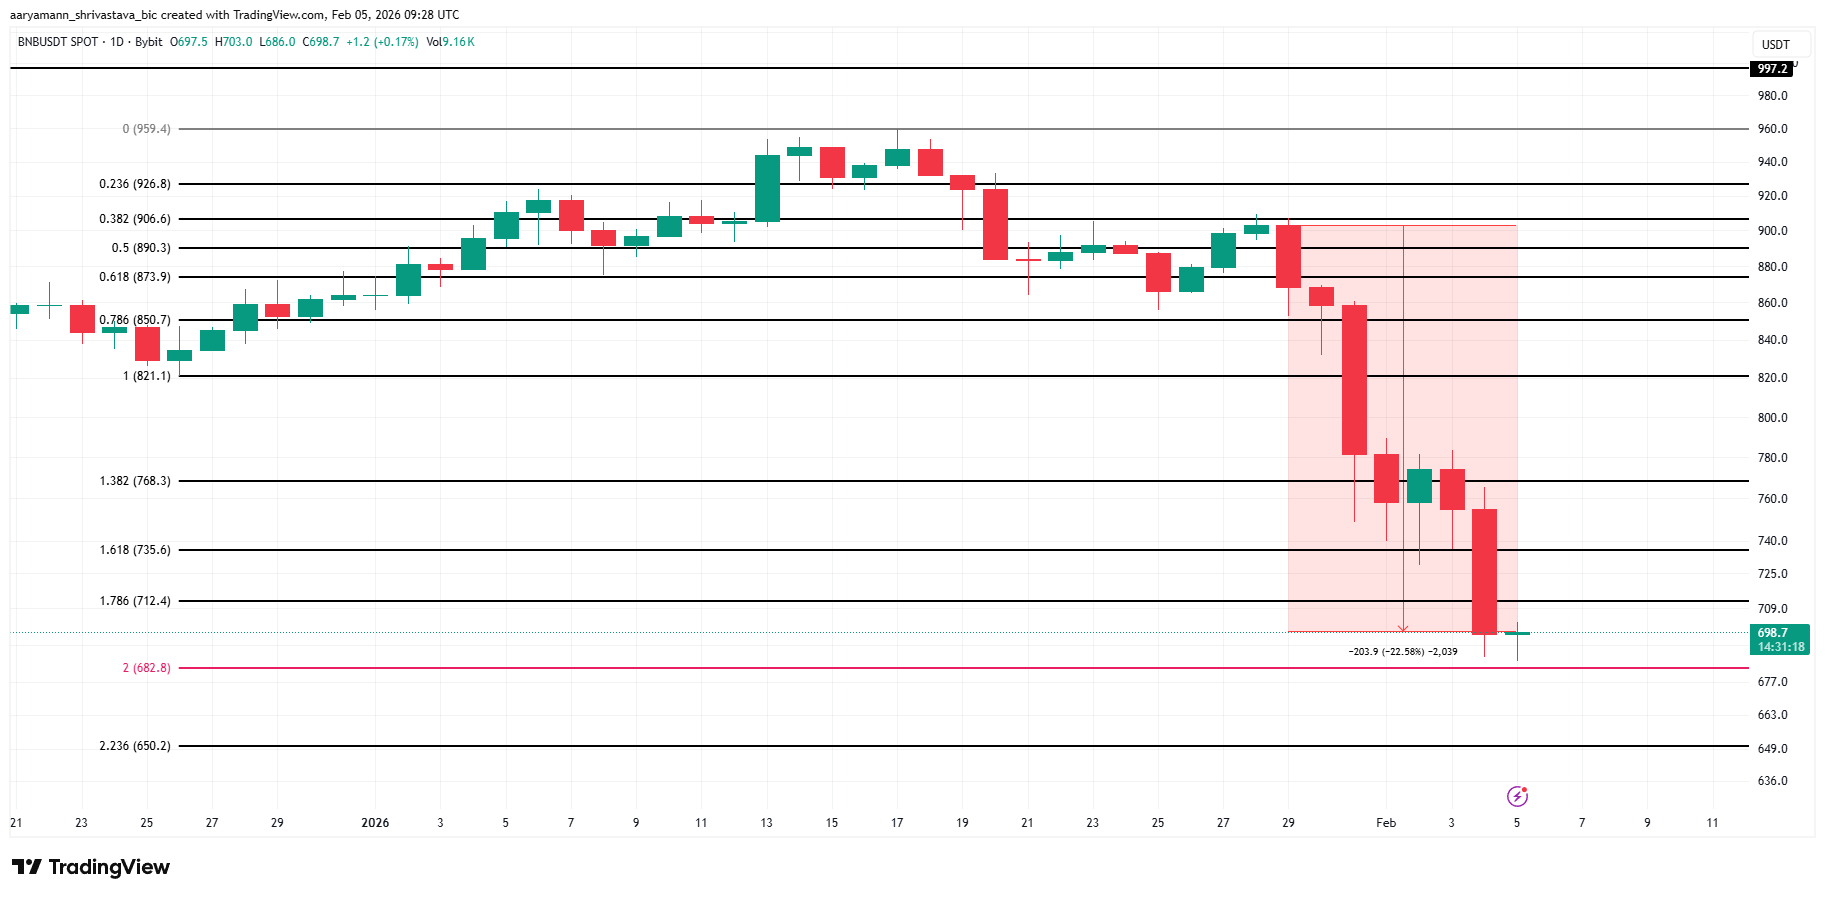
A recovery scenario depends on capital inflows offsetting bearish pressure. If demand strengthens, BNB could reclaim $735 and advance toward $768. Flipping the latter into support would invalidate the bearish thesis. Under that outcome, BNB price may recover toward $821, signaling renewed confidence.

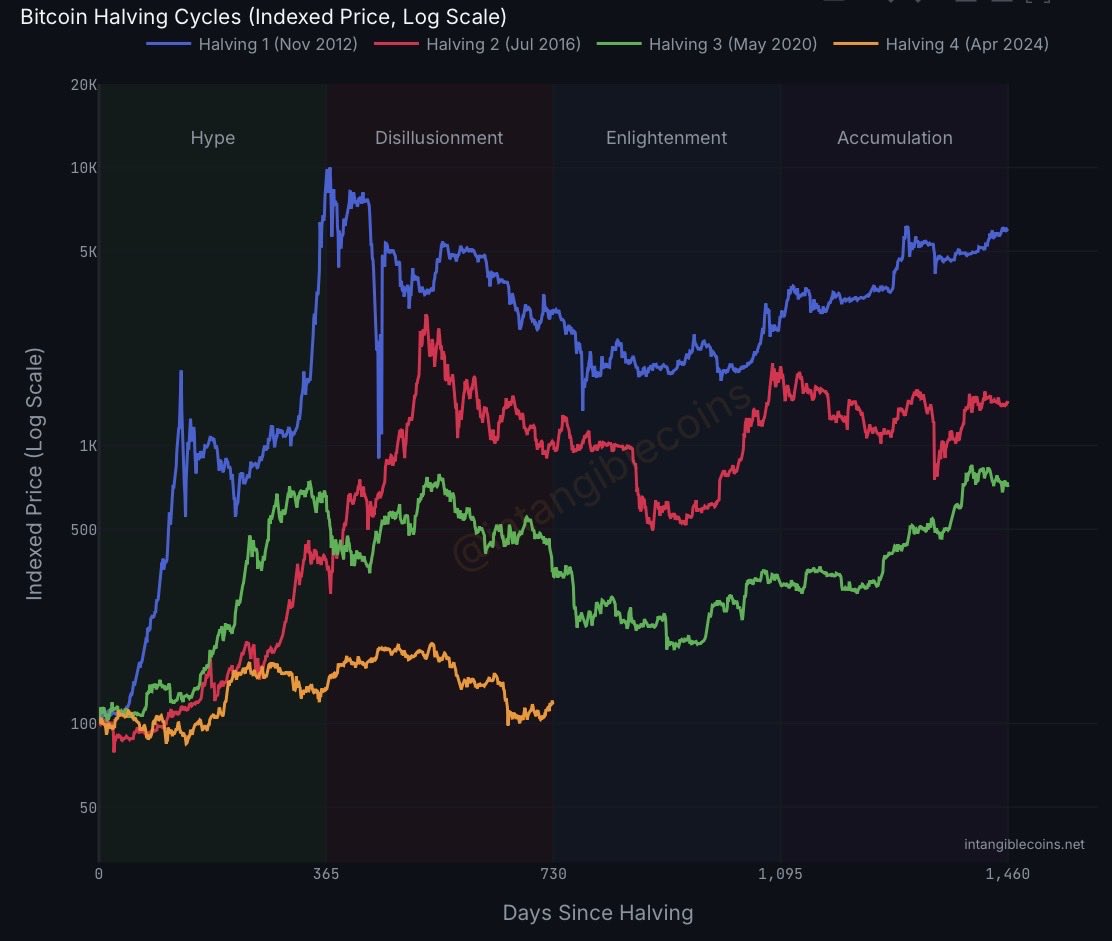
The current Bitcoin (BTC) market cycle is “dramatically” weaker than the three previous cycles, according to Alex Thorn, the head of firmwide research at investment firm Galaxy.
Thorn compared price action since the April 2024 Bitcoin halving to cycles triggered in 2012, 2016 and 2020; the current cycle shows significantly dampened volatility and lower upside. The all-time high above $125,000 on Oct. 5, 2025 was only 97% above the 2024 halving price around $63,000.
BTC’s price increased by about 9,294% during the 2012 halving cycle, reaching a high of about $1,163, and climbed by about 2,950% during the 2016 halving cycle, reaching a high of about $19,891. The 2020 halving saw a price increase of about 761%.

“Cycle four is dramatically underperforming prior cycles,” Thorn said in an X post, asking, “Is this the new normal, or is it the new normal until it isn’t?”
The decreasing volatility in each successive BTC halving cycle suggests that traditional market dynamics are changing and that BTC’s price may start to be influenced more by other factors, rather than the halving or the four-year cycle market theory.
The 30-day Bitcoin Volatility Index, which spiked to 9.64% on April 2, 2020, has not been above 3.11% in the current cycle, a reading last tipped on Aug. 24, 2024. At last look, the latest 30-day estimate for that volatility gauge is 1.75%, according to Bitbo data.
Related: Bitcoin bull run ‘still too early’ to call as demand lags exiting capital: Analyst
Critics say current cycle performance ignores the premature all-time high before 2024’s halving
BTC reached what was then the all-time high above the $70,000 level in March 2024 — one month before the April 2024 halving.
The approval of spot Bitcoin exchange-traded funds (ETFs) in the United States in January 2024 was the primary catalyst for the price pump.

This historic anomaly of BTC hitting a new all-time high before the halving skewed the current cycle’s price performance, critics of Thorn’s analysis said.
Bitcoin drawdowns have also become less severe, as volatility has declined, according to Fidelity Digital Assets.
Previous Bitcoin bear markets have seen declines between 80% and 90%, according to Zack Wainwright, a Fidelity Digital Assets research analyst.
However, Bitcoin’s crash to $60,000 from the all-time high above $125,000 represents a decline just north of 50%, Fidelity’s analysis noted.
In March, Jan van Eck, CEO of asset management company VanEck, said that BTC is close to bottoming out and that he expects the price to begin gradually rising again in 2026.
At last look, the biggest crypto was trading at about $74,703, up almost 5% in the last seven days, according to TradingView data.
Magazine: Bitcoin will not hit $1M by 2030, says veteran trader Peter Brandt


Attacker minted unbacked rsETH through Kelp’s LayerZero bridge, then borrowed WETH on Aave V3 and V4 before markets could freeze.
In 46 minutes on Saturday evening, DeFi lost more money than it had in any single event this year, and left Aave to face its biggest challenge yet. The mechanics took roughly one transaction.
At 17:35 UTC on April 18, an attacker sent a crafted message to Kelp DAO’s LayerZero-powered cross-chain bridge. The bridge accepted it as legitimate and released 116,500 rsETH, worth about $293 million and roughly 18% of the token’s entire circulating supply, to a wallet that had been funded through Tornado Cash ten hours earlier. No ETH ever changed hands on the other side, which means rsETH was effectively spun out of thin air.
The attacker did not try to sell it. They deposited it into Aave V3 as collateral and borrowed real wrapped ether against it, then repeated the trick on Aave V4. By the time Kelp’s emergency multisig froze the protocol’s core contracts 46 minutes later, the WETH was gone.
Two follow-up attempts at 18:26 and 18:28 UTC, each trying to drain another 40,000 rsETH, reverted into the pause, but the first hit was already reverberating across DeFi.
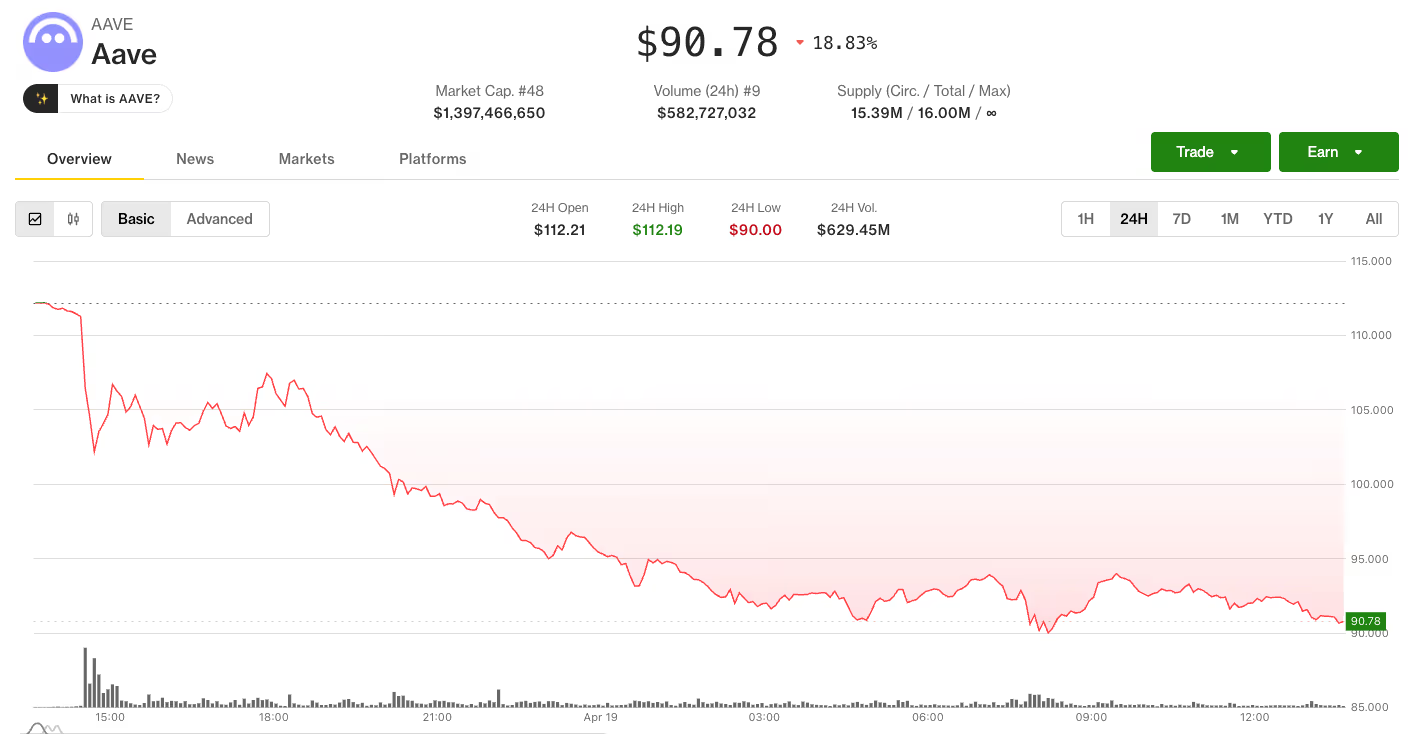
Twenty-four hours later, Aave is carrying between $177 million and $236 million in bad debt, its TVL has dropped by roughly $6 billion, according to DeFiLlama, its WETH market is pinned at 100% utilization, and the AAVE token is down more than 18%.
SparkLend, Fluid, and Upshift have all paused or frozen rsETH. rsETH on more than 20 chains is of uncertain backing. Ethereum itself has barely moved.
It is now, by size, the largest DeFi exploit of 2026.
How it happened
rsETH is Kelp’s liquid restaking token. Every rsETH is supposed to represent a real claim on ETH deposited into Kelp and restaked across EigenLayer operators. That one-to-roughly-one relationship is why some money markets have been willing to treat rsETH as ETH-correlated collateral.
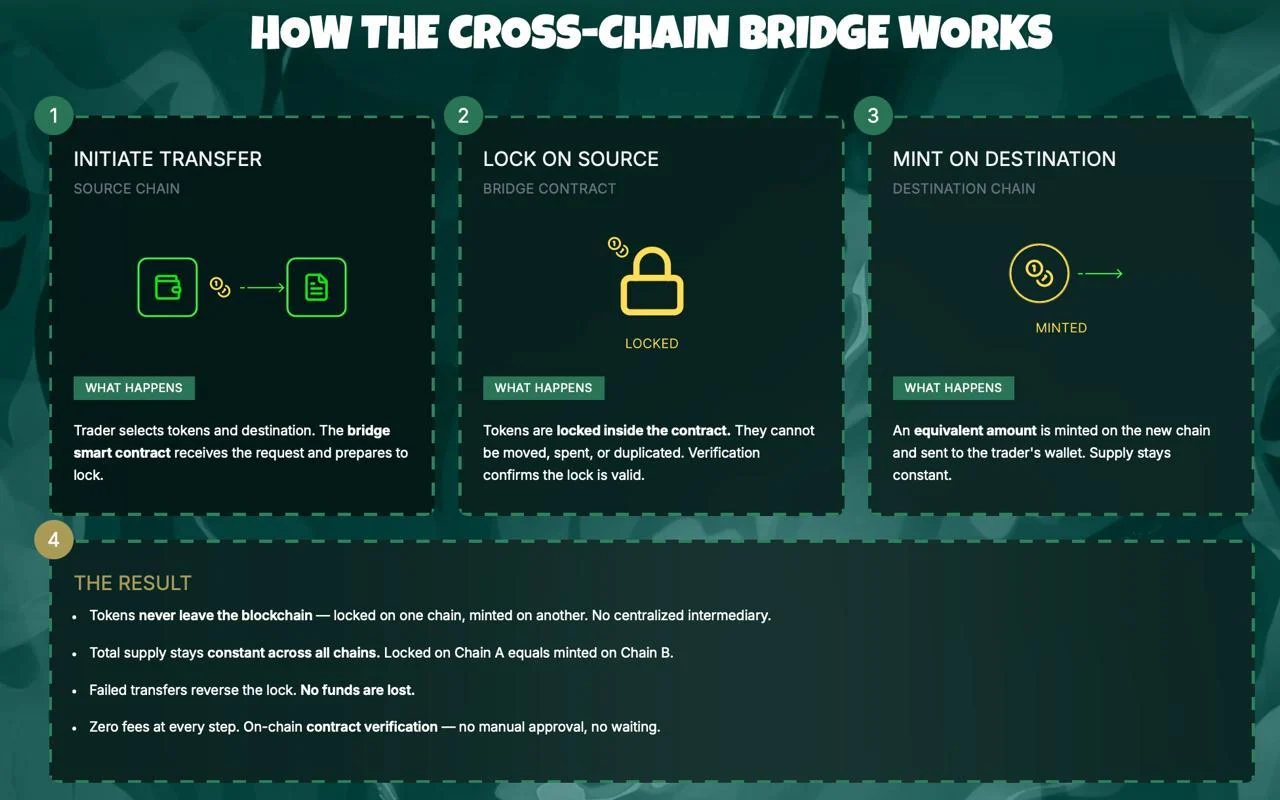
rsETH lives on more than 20 networks and moves between them through a LayerZero messaging layer. When a user locks rsETH on one chain, the bridge on the destination chain is supposed to mint or release an equivalent amount only after it verifies a valid message from the source.
The attacker found a way to make that verification accept a message that corresponded to no real deposit, so that 116,500 rsETH were released without the corresponding ETH being locked anywhere. Kelp’s vault reserves did not move, but its liability, denominated in rsETH, grew by 18%.
How Aave became the exit door
This is where the story gets uncomfortable for Aave.
Kelp’s bridge is the proximate cause of the mint. But the reason this turned into $200 million of hard damage rather than a localized, recoverable incident is that Aave had, by design, made rsETH one of the most capital-efficient collateral types in DeFi.
Supply caps were large enough to accommodate an entire $292M deposit. Borrow caps on WETH were sized such that a single attacker could withdraw well over $200M of real ether in a handful of transactions. Liquidation thresholds assumed rsETH would trade at or near peg.
The listing reviews and parameter tuning by Chaos Labs, Block Analitica, and LlamaRisk treated rsETH as what it had been in practice: a conservatively collateralized liquid re-staking token (LRT) with a boring price history.
That’s why the attacker was able to use a single forged message on a bridge to drain real assets out of the largest lender in DeFi.
Billions of WETH left Aave
After the attacker borrowed WETH against unbacked rsETH, WETH suppliers started to withdraw their own funds, likely on speculation that first-movers would be made whole while last-movers would eat the residual loss. By Sunday morning, $5.4 billion of ETH and WETH had left Aave.
WETH pool utilization hit 100%, which means WETH depositors can no longer withdraw.
The borrow positions are effectively unliquidatable. The collateral cannot be redeemed at Kelp and will not trade near peg once the scale of unbacked supply is fully digested. No profitable liquidation path exists.
Aave Labs said on X that Aave’s contracts were not compromised. But “no bug” doesn’t necessarily mean “no problem.”
Aave’s Umbrella insurance fund holds about $50 million. Aave-specific bad debt is roughly $196 million concentrated in the rsETH / WETH pair on Ethereum. The gap is where the next few weeks of governance will happen.
The waterfall, in order: aWETH Umbrella stakers absorb the first slice via automatic slashing; WETH suppliers take a pro-rata haircut on their deposits; stkAAVE holders are next if governance activates a deeper slash; and the DAO treasury could fund a repayment proposal.
Aave’s Guardian froze rsETH and wrsETH across every deployment. Aave V4’s Security Council disabled supply and borrow on both the Core Hub and the Kelp E-Spoke. A Risk Stewards proposal to reduce the WETH Slope1 is already live, aimed at pulling new supply back in.
Contagion spreads
SparkLend, Fluid, and Upshift froze rsETH within hours. The exception is Morpho: CEO Paul Frambot said exposure is about $1 million across two isolated markets, with other vaults entirely unaffected. Morpho’s architecture isolates each market so bad debt in one pair cannot propagate.
rsETH itself now has a backing problem across 20-plus chains until Kelp publishes a clean reconciliation of reserves against outstanding supply. Any protocol that accepts wrsETH as collateral is exposed until that accounting is public.
LayerZero’s messaging layer will also take scrutiny as the path manipulated in Kelp’s bridge is not unique to Kelp.
Kelp follows the $285 million Drift hack on April 1, the $80M Resolv Labs exploit in March, and a string of infrastructure-level compromises. Cumulative DeFi losses for 2026 are between $450 and $482 million across roughly 45 protocols.

As readers of this newsletter may be aware, Congress has spent the past few months debating market structure legislation, but crypto policy discussions encompass so many more issues than just the one: taxes, decentralized finance regulations, the midterm election, states and so much more. CoinDesk’s Consensus Miami conference next month is going to examine each of these issues in depth.
You’re reading State of Crypto, a CoinDesk newsletter looking at the intersection of cryptocurrency and government. Click here to sign up for future editions.
This newsletter has noted in the past how significant policy changes around digital assets have become. Last year saw U.S. President Donald Trump sign the first significant crypto-specific piece of legislation. Regulators have completely changed their approach to enforcement actions. Congress has spent the past few months debating not the broad contours of what a market structure bill could look like nor whether we’ll even have a bill, but the finer details of issues like the treatment of stablecoin yield.
In other words: Crypto’s made it.
This was true last year, to be fair. The crypto industry, fresh off of its electoral wins in 2024, took a victory lap as bitcoin’s price soared to over $120,000 and legislation seemed imminent. Things have soured a little bit this year; crypto prices have been largely stagnant amid broader economic stresses and time is running out for Congress to pass market structure legislation in its current form. It’s not all bad news: regulators have begun proposing rules for stablecoin companies based on last year’s GENIUS Act, lawmakers are seriously considering reforms to U.S. crypto tax policy and it really does seem that this industry has cemented itself to the point where it cannot be dismissed.
So what’s next? The industry’s still seeking tax reform, with a de minimis exemption for crypto transactions, hoping the market structure bill will become law without overly burdening the industry and — of course — looking ahead to November, when the U.S. will pick the next Congress.
We’ll be picking up these threads next month at Consensus Miami, our annual shindig bringing together basically everyone.
You’ll hear from leading lawmakers like Senators Kirsten Gillibrand and Ashley Moody, regulators like CFTC Chairman Mike Selig and the White House point man on crypto Patrick Witt, and Congressional staffers across the three-day conference. Congressman Steven Horsford (D-Nev.), who recently introduced a new version of the Parity Act to address crypto taxations, will participate in a discussion about the bill. We’ll also host a meetup for folks interested in chatting about the election or just generally about the policy landscape.
And we are bringing back the Policy & Regulation Summit: an entire day, and an entire stage, dedicated to exploring key policy and regulatory issues in-depth.
The policy summit is designed to explore some of the biggest questions lawmakers, regulators, compliance officers and/or builders have to answer right now, including whether or how decentralized finance can comply with anti-money laundering rules, how to deal with taxes in the new 1099-DA era, what the deal is with the Clarity Act and how states are approaching this sector.
We’ll have an entire series of sessions focused on the 2026 midterm election, including how the crypto industry is engaging with the election and what we can expect next year when the new Congress takes over.
Along the way, we’ll hear from folks deeply embedded in the policymaking process, such as SEC Crypto Task Force chief Taylor Lindman, former IRS officials Seth Wilks and Raj Mukherjee and the National Futures Association’s Lucy Hynes, among so many others.
We’re going to close the Policy Summit — and all of Consensus really — with a debate on one of the biggest topics in the country right now: prediction markets. Are they just gambling? Or are prediction markets a novel financial instrument? And who should regulate these products?
These questions are likely to wind up before the U.S. Supreme Court, but we’re going to preview the arguments for you on May 7. Come on through (discount code in the link) and say hi.
Tuesday
- 14:00 UTC (10:00 a.m. ET) The Senate Banking Committee will hold the nomination hearing for Kevin Warsh, Donald Trump’s pick to helm the Federal Reserve.
If you’ve got thoughts or questions on what I should discuss next week or any other feedback you’d like to share, feel free to email me at nik@coindesk.com or find me on Bluesky @nikhileshde.bsky.social.
You can also join the group conversation on Telegram.
See ya’ll next week!

TLDR:
- XRP ETFs saw $55.39M inflows, reflecting steady demand but not strong institutional conviction yet.
- Price action shows rejection near $1.445, reinforcing a strong resistance zone in the short term.
- Long liquidations dominate recent data, signaling pressure on bullish traders and weak momentum.
- Sustained ETF inflows and a breakout above resistance are needed to confirm a stronger trend.
XRP exchange-traded funds recorded $55.39 million in net inflows last week, marking their strongest weekly performance this year.
The figure signals improving investor interest, although broader data shows a measured pace rather than an aggressive shift in institutional positioning.
ETF Inflows Show Measured Demand Growth
Sosovalue data points to a steady but controlled rise in capital entering XRP-linked investment products. Weekly inflows of $55.39 million represent roughly five percent of the estimated $1 billion in total assets under management across these funds. This level reflects moderate participation rather than rapid accumulation.
A tweet from Whale Insider reported the weekly inflow figure while framing it as the strongest performance of 2026. The post drew attention to XRP ETFs offered by firms such as Bitwise and Grayscale, alongside futures-based products from ProShares and Teucrium.
The composition of these inflows remains a key factor in assessing market direction. Spot-based ETFs often indicate longer-term positioning, while futures-based funds can reflect short-term strategies or hedging activity. Therefore, without a clear breakdown, the inflow figure alone does not define investor intent.
Consistency in fund flows remains an important measure. A single week of stronger inflows does not establish a sustained trend. Market participants continue to watch whether similar levels persist across multiple weeks, especially in spot-focused products.
XRP Price Action Reflects Short-Term Pressure
At the time of observation, XRP traded at $1.4238, posting a daily decline of 0.81 percent. Intraday movement ranged between $1.415 and $1.445, showing a narrow but active trading band. The session opened with sideways movement, indicating limited conviction among traders.
Midday trading introduced sharper selling pressure, pushing the price toward the $1.415 level. This zone marked the lowest point of the day and attracted renewed attention as a short-term support area. The move suggested liquidation activity or a shift in short-term sentiment.
Later in the session, XRP rebounded toward $1.445 but failed to maintain upward momentum. The rejection near this level reinforced it as a resistance zone. Price action then returned closer to $1.42, reflecting continued hesitation among buyers.
Short-term performance metrics remain slightly negative, with losses across both four-hour and daily timeframes. Meanwhile, the seven-day performance shows a gain of nearly five percent, indicating a partial recovery phase. However, longer-term data continues to reflect a broader downward trend.
Liquidation data adds further context to recent movements. Over the past 24 hours, long positions accounted for the majority of liquidations, exceeding short liquidations by a wide margin. This pattern suggests that leveraged bullish trades faced sustained pressure during recent price swings.
Repeated tests of the $1.42 support level may weaken its strength over time. Meanwhile, resistance between $1.435 and $1.445 continues to limit upward movement. Traders are monitoring whether price consolidates within this range or breaks toward new levels.
Market activity remains closely tied to liquidity flows and broader sentiment. While ETF inflows provide one layer of insight, price structure and liquidation trends continue to shape near-term direction.


The average Web3 VC pitch sounds like ours did three years ago. “We have deep relationships across the ecosystem.” “We add value beyond capital.” “Our network is our edge.” It’s not that any of these statements is a lie; it’s that everyone says them, which makes them effectively meaningless.
Liquidity providers (LPs) have heard this pitch so many times that the words have lost all shape. And yet somehow, the industry just keeps photocopying the same deck. Impressive logo slide. Vague thesis. Three bullet points about “value add.” A track record that, for most emerging managers, doesn’t yet exist. Repeat until funded, or not.
My colleagues and I at TBV spent a lot of time asking ourselves what we actually had that no one else did. The answer, eventually, was humbling: not much. So we built something different.
Here’s the thing that the data keeps trying to tell the industry and the industry keeps ignoring: emerging managers actually outperform. Studies consistently show they reach top-quartile performance more often than established funds and deliver materially higher returns on average. The upside is real. The problem is entirely structural — emerging managers can’t communicate a clear reason to clients to back them over others, so capital flows to brands rather than potential.
When we built TBV, we decided the pitch had to be a product, not a promise. The question we kept returning to was: what does a fund actually own? Not who it knows. Connections are not defensible. What has it built, what data has it generated, and what platform value does it create for founders? That’s defensible.
The answer we landed on was events. We weren’t looking for just a networking play or branding exercise. We wanted to develop a people-centric deal engine. Web3 runs on conferences. Everyone already knows this. Founders travel thousands of miles to shake hands at side events. VCs pay enormous sponsorship fees for access to people they could probably have reached by email. The ROI calculus has always been fuzzy at best. What we wanted to do was flip the model: instead of paying for access, build the environment. Own the data. Create the relationships at scale and feed them directly back into sourcing, diligence and value for everyone involved.
In 2025, our event series drew over 43,000 attendees and more than 100 partners. That didn’t happen by accident, and it wasn’t just a marketing stunt. It was deliberate infrastructure. Every interaction, every connection, every emerging trend spotted in those rooms feeds into TBX, our AI-driven deal engine. The events and the fund are the same flywheel.
“We’re not the only ones rethinking this. What’s interesting is how different the approaches are and how few of them look anything like a traditional fund.”
Another VC firm, Outlier Ventures, figured this out from a different angle. They leaned into the accelerator model — building a genuine platform of support around early-stage founders rather than just writing checks and showing up for board meetings. The result is a fund with over 300 portfolio companies and a real reason for founders to choose them over others with just more AUM. Paradigm went in a completely different direction: they got technical. They don’t just invest in protocols; they contribute to them. That kind of depth is genuinely hard to replicate, and LPs can see it.
What these models share, and what the next generation of interesting managers will share, is that the fund itself is a product with utility beyond capital. The question isn’t “how do we tell a better story?” It’s “how do we build something that makes the story self-evident?”
The good news is there isn’t just one answer. The events model works for us. The accelerator model works for Outlier. Deep technical contribution works for Paradigm. What doesn’t work, what has never really worked, and what LPs are increasingly unwilling to pretend works, is a pitch built entirely on relationships you can’t show and value you can’t measure.
Web3 moves fast enough that the managers who build real infrastructure now will be very hard to displace later. The ones still writing decks about their networks in three years will find the room has quietly emptied out around them. I’m genuinely curious to see what other models emerge. Competition in this space, when it’s actually focused on doing something different, is the best thing that could happen to it.
TLDR:
- Heavily shorted US stocks surged 13%, outperforming the S&P 500 by nine percentage points
- Short sellers covered $93 billion in positions, marking one of the fastest unwinds in years
- Unprofitable tech stocks rallied strongly, with gains reaching up to 14% during the week
- Institutional buying and algorithmic funds added momentum to an already accelerating market rally
A rapid unwind of short positions has driven a sharp rally across US equities this week. Heavily shorted stocks surged well above broader indices, as large-scale covering activity and renewed institutional flows accelerated upward market momentum.
Short Covering Drives Sharp Market Rally
Market data shows that short sellers exited positions at the fastest pace seen in recent years. The move triggered strong upward pressure, especially in heavily shorted stocks. These names outperformed the broader market by a wide margin.
A tweet from Global Markets Investor detailed the scale of the move, citing data from Goldman Sachs. It reported that the most-shorted US stocks gained 13% during the week. This performance exceeded the S&P 500 by nine percentage points.
At the same time, short sellers covered about $93 billion in positions across US equities. Data from S3 Partners shows this activity occurred within the same month. This level of covering indicates strong pressure on bearish positions.
As short sellers closed positions, buying demand increased sharply. This forced prices higher, creating a feedback loop across multiple sectors. The process pushed already rising stocks even further.
The trend also extended beyond heavily shorted names. A basket of unprofitable technology stocks recorded strong gains during the same period. These stocks often react quickly to shifts in market positioning.
Data referenced from UBS shows that financially weak stocks rose by about nine percent. At the same time, broader unprofitable tech names advanced by roughly fourteen percent.
Institutional Flows and Momentum Amplify Gains
The rally did not occur in isolation, as broader market factors also supported price action. Institutional investors and algorithmic funds contributed to the upward movement. These participants had previously reduced equity exposure to lower levels.
As market conditions shifted, these groups began increasing their positions again. This added fresh demand on top of short-covering activity. Together, both forces accelerated the rally across equities.
Algorithmic strategies likely responded to price trends and volatility signals. As momentum built, these systems increased buying activity. This behavior reinforced the upward direction of the market.
At the same time, institutional purchases provided additional support. Large investors often move capital in response to changing macro and market signals. Their re-entry added stability to the ongoing rally.
However, the pace of the move suggests it may not continue at the same speed. Rapid short squeezes tend to occur over short periods. Once positions are covered, buying pressure can begin to slow.
Even so, the recent activity reflects how positioning can influence market direction. When large short positions unwind quickly, price movements can accelerate across sectors. This dynamic remains a key feature of modern equity markets.
The big Ethereum price news this week is Schwab opening spot ETH trading for retail clients, putting ETH directly inside one of the largest traditional brokerage platforms in the United States, per Blockonomi. The launch dropped on April 17 while the token pushed past $2,308, up 1% on the session and up over 4.15% on the week after Ethereum ETFs pulled in $127.4 million of net inflows in a single trading day.
While Ethereum keeps adding institutional wins, the presale entry at Pepeto is the position that turns into the return everyone talks about when this cycle gets written into the record books. The round keeps filling fast, more than $9.23 million has flowed in, and every signal points to why below.
Schwab activated spot ETH trading for retail clients on April 17, widening brokerage access to Ethereum beyond institutional ETF channels for the first time, per Blockonomi. The move follows a six-day ETF inflow streak that pulled nearly $300 million into U.S. Ethereum funds.
Ethereum ETFs posted $127.4 million in net inflows on April 17 alone, led by Fidelity’s FETH at $84.1 million and BlackRock’s ETHA at $30.8 million, per Blockchain.News. This Ethereum price news matters because Schwab puts ETH inside tens of millions of new retail accounts while ETF demand confirms the setup from above. Two fresh buyer channels in one week usually marks the start of a longer run.
Strongest Entries Drawing April Capital as Ethereum Catalysts Build
Pepeto: The Round That Fills While Others Wait for Proof
Pepeto comes out of the team behind one of the biggest Pepe chapters in crypto, paired with a build lead who spent years inside Binance designing exchange rails for millions of daily traders. Every contract passed a full SolidProof review before public capital moved in, and that team is why over $9.23 million flowed in across one of the tighter quarters the market has seen.
PepetoSwap ties Ethereum, BNB Chain, and Solana into one zero-fee bridge so assets move between networks at no cost. A live AI contract checker scans anything a wallet is about to touch and flags risk before capital moves. Both tools run on the Pepeto token at the protocol layer, so each swap pulls direct demand the same way every base-fee block on Ethereum burns ETH and cuts supply.
The previous round closed ahead of schedule, and this one runs at the same pace. Wallets entering at $0.0000001865 lock the floor before the Binance listing sets a higher one, and staking at 181% APY adds tokens to every position that holds through launch.
Buyers loading this round understand entering now puts them on the side that collects the gains instead of watching them play out on a chart. Every fresh Ethereum price news update pulls more attention into crypto, and that attention finds presale entries where entry-to-listing math still makes sense. Entering Pepeto at this price and staking through the listing is how presale math turns into real returns.
Ethereum (ETH) Price News: $2,308 With $2,600 Target as ETF Streak Extends
Ethereum (ETH) trades at $2,308 on April 17 per CoinMarketCap, up 1% on the day and up 4.15% on the week after six straight days of spot ETF inflows. The 50-day SMA is closing in on a bullish cross with the 100-day, MACD lines have turned up, and analysts target $2,600 next if the $2,400 breakout confirms, with $2,200 as the downside pivot.
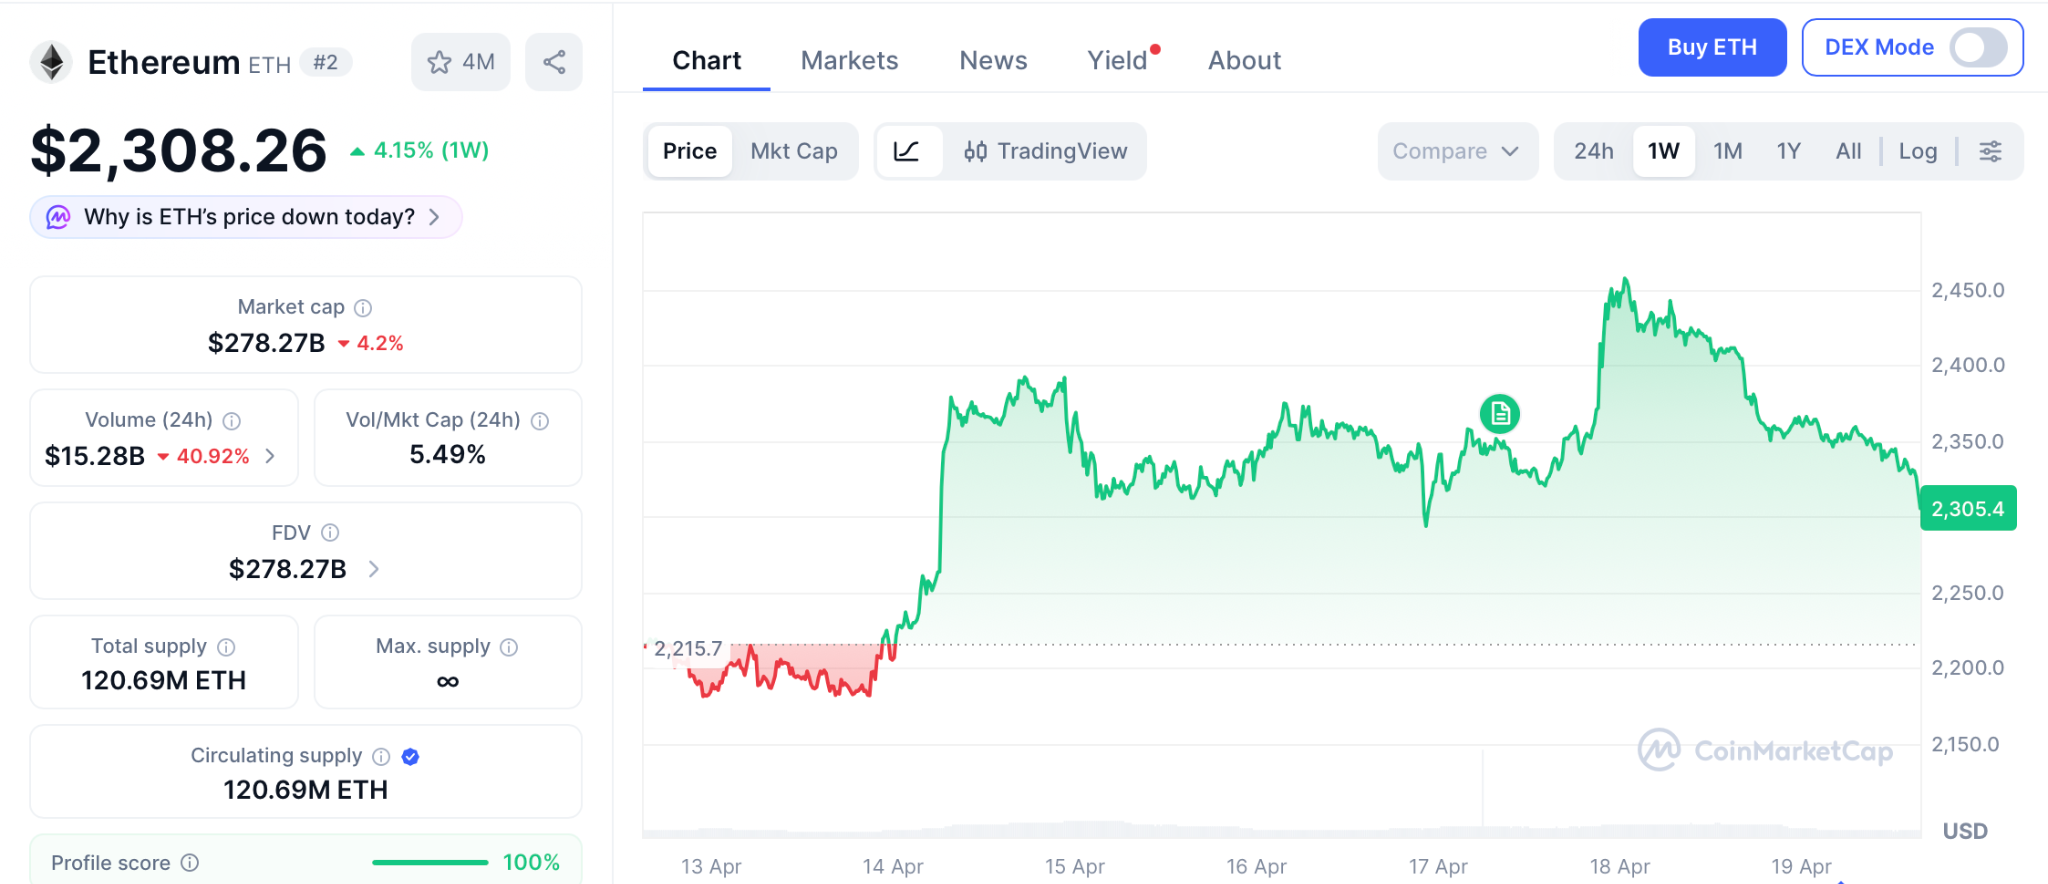
Whale accumulation is steady, Schwab widens the buyer base, and ETF flows are clean positive. A move from $2,308 into $2,600 prints roughly 9%, and that gap versus a presale entry at a fraction of a cent is why capital keeps rotating into earlier tokens every time fresh Ethereum price news hits.
Conclusion:
Schwab just opened spot ETH trading for retail, ETFs pulled $127 million in a single day, and Ethereum price news in April 2026 carries more weight than any month this year. Yet the token still sits at $2,308, because even the strongest headlines need time to work their way into the chart.
The wallets buying Pepeto at presale pricing picked the entry that still has real distance left to run, and 181% APY staking keeps compounding quietly while the listing draws closer every day. This round is filling right now, and the second it closes the floor jumps higher for good. Locking in the presale price today is exactly how wallets end up holding the kind of returns everyone else spends the next year wishing they had grabbed.
Click To Visit Pepeto Website To Enter The Presale

FAQs
What is the latest Ethereum price news for April 2026?
Schwab launched spot Ethereum (ETH) trading for retail clients on April 17, and U.S. spot Ethereum ETFs pulled $127.4 million in net inflows the same day, extending a six-day streak that lifted ETH above $2,308.
Is Pepeto worth buying before the Binance listing?
Pepeto offers presale entry at $0.0000001865 with $9.23 million raised and 181% APY staking compounding daily before the confirmed Binance listing, giving buyers 100x potential from the current floor.
Disclaimer: This is a Press Release provided by a third party who is responsible for the content. Please conduct your own research before taking any action based on the content.
TLDR:
- Total 3 has recovered approximately $90B since February despite tight liquidity and geopolitical pressure.
- The share of Binance altcoins below the weekly 50 MA dropped from 89% in February to 67% recently.
- Since October 2025, Total 3 lost nearly $460B, representing around 38% of its total market value.
- With 49 million cryptocurrencies now in existence, asset selection has become far more complex for investors.
The altcoin market has regained approximately $90 billion since February, offering early signs of recovery. This comes after a prolonged correction that began following the October 2025 market peak.
Total 3, the metric tracking altcoin market capitalization excluding Bitcoin, Ethereum, and stablecoins, remains well below prior highs.
Meanwhile, a key technical indicator on Binance shows measurable improvement in market breadth across the altcoin sector.
Total 3 Claws Back Ground After a $460B Decline
Since the October 2025 top, the altcoin sector has endured a sharp and sustained downturn. Total 3 shed close to $460 billion in value over that stretch, representing roughly 38% of its market cap. That kind of drawdown reflects broad-based selling pressure rather than isolated weakness in a few assets.
However, conditions began shifting in February. Despite a challenging geopolitical climate and restricted liquidity, Total 3 has recovered around $90 billion from its lows. The recovery is measured, but it points to a gradual return of buying interest across smaller digital assets.
One useful way to track this shift is through the percentage of altcoins on Binance trading below their weekly 50-period moving average.
This moving average is a widely followed level in technical analysis. Traders often use it to gauge whether a market is in a healthy or weakened state.
As noted by analyst Darkfost, that figure peaked at 89% of Binance-listed altcoins trading below this level in early February.
It has since dropped to 67%, suggesting that more coins are beginning to stabilize or recover toward this technical threshold.
Caution Remains Despite the Improving Numbers
While the data points in a more positive direction, the broader environment still calls for careful positioning. Liquidity conditions remain tight, and macroeconomic factors have not meaningfully eased. Those constraints limit how far and how fast capital can rotate back into higher-risk assets like altcoins.
Asset selection has also grown considerably harder. The total number of cryptocurrencies now stands at around 49 million. Of those, approximately 19 million are on Base, more than 22 million on Solana, and 4.78 million on BNB Smart Chain.
That level of supply fragmentation makes it far more difficult to identify assets with genuine momentum. With so many tokens competing for attention and capital, investors face a much more complex filtering process than in prior cycles.
The weekly 50 moving average still acts as resistance for a large share of altcoins. Until more assets reclaim that level, the recovery remains in its early stages.
Sustained improvement will require both broader participation and a more accommodating liquidity environment to take hold.
The $292 million exploit of Kelp DAO has set off a wave of reactions across the crypto industry, with developers and traders warning that the incident exposed deeper flaws in how decentralized finance (DeFi) is built.
Data shared by market participants shows the immediate fallout spread far beyond the hacked protocol.
“The rsETH hack is leading to withdrawals across all lending protocols, even on solana and unaffected protocols,” 0xngmi said in one post on Sunday, pointing to steep outflows including “Aave: -6,200m (-23%) net inflows” and smaller but notable declines across Morpho, Sky and JupLend. rsETH is liquid restaking protocol Kelp DAO’s restaked ether and is a Liquid Restaking Token (LRT) that allows users to earn ether staking and restaking rewards while keeping their assets liquid, even when they are locked in staking.
That pressure quickly turned into something more severe. One widely circulated post by Josu San Martin described cascading liquidity stress inside lending markets: “ETH depositors cannot withdraw the ETH so they are borrowing stables to ‘withdraw’ funds… This is a full on run on AAVE.”
While Stani Kulechov, Aave’s founder, said the exploit was external and that the protocol’s contracts were not compromised, the depositors panicked. The total value locked (or deposits) dropped from $26.4 billion on April 18 to nearly $20 billion in U.S. morning hours on Sunday, per DefiLlama. The AAVE token also fell more than 18% as depositors scrambled to withdraw their money through the weekend.

A ‘case study’
The exploit itself has become a focal point for engineers and developers.
Several developers pushed back on early assumptions that the issue stemmed from core infrastructure. “The KelpDAO exploit (~$290M, is NOT a LayerZero protocol bug. It’s a configuration issue and a case study every project with a cross-chain token needs to look at today,” one technical breakdown by cryptogoblin read.
The thread detailed how a single verification point enabled the attack. “One signature and 116,500 rsETH materialized out of thin air on Ethereum,” the post said, describing a system where “the [smart] contracts weren’t broken. The verification layer was,” the post claimed.
Others argued the problem runs deeper than a single setup choice.
One critique, who goes by Fishy Catfish on X, framed it as a design flaw, alleging that: “there is no security floor… A configuration can be a 1/1 DVN and the DVN you chose can be a single node ran by a single entity.” A DVN (Decentralized Verifier Network) in DeFi, specifically within LayerZero V2, is an independent entity responsible for validating and attesting to the authenticity of messages sent across different blockchain networks. Essentially, DVNs verify message hashes between a source chain and a destination chain.
To make the point clearer, the author drew a real-world comparison: “imagine if a roller coaster manufacturer allowed amusement parks to individually decide what the minimum safety specs were.” Essentially, the author is simply saying that flexibility without guardrails can create hidden risks.
The post went so far as to claim that the setup was the problem within the design. “I personally think this is a flawed design. Modular security is a worthwhile design space, however, the range of security should have a native security floor that is quite strong, and then allow *additional* layering of security on top of that for more high-value use-cases.”
‘DeFi is dead’
It’s not just the amount and complexity of the exploit that drew the harsh, panicked criticism. The scale of the exploit has heightened concerns.
Roughly 116,500 rsETH, about 18% of supply, was affected. The attacker tricked LayerZero’s cross-chain messaging layer into believing a valid instruction had arrived from another network, which triggered Kelp’s bridge to release 116,500 rsETH to an attacker-controlled address.
Protocols responded by freezing markets and pausing features. Aave halted rsETH activity. Lido paused deposits tied to the asset. Other projects took similar steps to limit exposure as the situation unfolded.
Beyond the technical debate, sentiment across crypto turned sharply negative. One post perhaps captured the mood shift in blunt terms: “DeFi is dead… ‘just use aave’ is dead,” while adding that “The age of crypto is over” and asking, “If you’re reading this – why are you still in crypto?”
While the response may sound like an overreaction, that kind of ‘knee-jerk’ reaction is not unusual after large exploits, but the breadth of this event stands out.
The attack affected cross-chain infrastructure, restaking models and lending markets simultaneously. It also follows a string of recent incidents. The hack lands in an unusually hostile stretch for DeFi, particularly this month. Solana-based perpetuals protocol Drift was drained of about $285 million on April 1 in an attack later linked to North Korea-affiliated actors, and at least a dozen smaller protocols have been exploited in the weeks since, including CoW Swap, Zerion, Rhea Finance and Silo Finance.
‘Check your configs’
Despite all the explanations, there are still more questions than answers.
Even LayerZero is still trying to figure out the full details of the exploit. “We’re fully aware of the rsETH exploit and have been in active remediation with the @KelpDAO team since the incident and continue to monitor. All other applications remain safe,” it said in a post on X. “We are still identifying the root cause alongside @_SEAL_Org and others. We will publish a complete post-mortem with @KelpDAO as soon as we have all information.”
KelpDAO echoed this sentiment. “Earlier today we identified suspicious cross-chain activity involving rsETH. We have paused rsETH contracts across mainnet and several L2s while we investigate. We are working with @LayerZero_Core, @unichain, our auditors and top security experts on RCA. We will keep you posted as we learn more about this situation.”
Still, some developers see a clearer lesson in the chaos.
The exploit did not rely on breaking encryption or bypassing smart contracts. Instead, it exposed how fragile systems can become when they depend on layered assumptions.
In simple terms, the tools worked as designed. The way they were configured did not.
That distinction may shape what comes next. Builders are now urging projects to review their setups, especially those relying on cross-chain messaging.
As cryptogoblin put it bluntly: “Check your configs. Stay safe out there.”
Read more: DeFi yields are crashing so hard that they can’t compete with a traditional savings account
Crypto World
XRP Struggles for Bullish Momentum as Negative CVD Signals Weak Buyer Demand on Binance
TLDR:
- XRP is trading near $1.44 on Binance, recovering modestly but still lacking a confirmed upward trend direction.
- The CVD indicator reads -7.18 million, showing that sell orders continue to outpace buy orders in the market.
- XRP’s price recovery appears driven by reduced selling pressure rather than strong and genuine buyer demand.
- A 30-day price-CVD correlation of 0.61 points to gradual realignment between price action and liquidity flows.
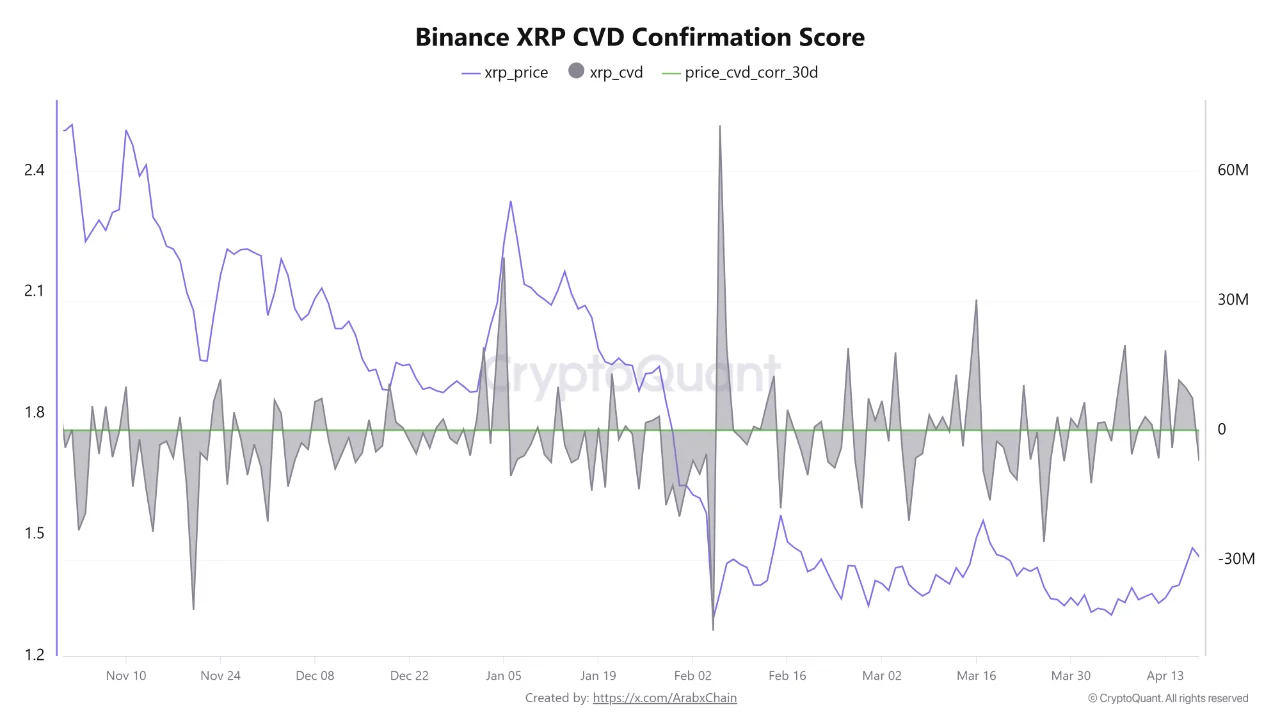
XRP is trading at approximately $1.44 on Binance, showing a modest recovery from recent lows. However, the Cumulative Volume Delta (CVD) indicator remains negative at around -7.18 million.
This signals that sell orders continue to outpace buy orders in the market. Meanwhile, the 30-day price-CVD correlation stands at 0.61, pointing to a gradual realignment between price action and underlying liquidity flows.
XRP Price Holds Steady Amid Persistent Selling Activity
XRP has recorded a relative recovery after going through a notable period of price decline. The token is currently holding around the $1.44 level on Binance, yet it has not confirmed a fresh upward trend.
Market participants are closely watching whether XRP can sustain this recovery or face renewed selling pressure. The asset has not broken out of its consolidation range, keeping the trend direction unclear.
Despite the price uptick, the CVD reading of approximately -7.18 million paints a different picture for the asset. Sell orders continue to dominate market activity, based on the latest Binance data available.
This divergence between price movement and liquidity flow raises valid questions about the strength of the current recovery.

Source: Cryptoquant
The price increase may be the result of reduced selling activity rather than genuine buying demand. Without a corresponding rise in buy-side volume, the rally lacks the foundation for a sustained move. Traders are, therefore, cautious about reading too much into the current price behavior.
CVD Correlation Data Points to a Shifting Market Structure
The 30-day price-CVD correlation index sitting at 0.61 reflects a more stable relationship between price and liquidity. Compared to earlier periods of wider divergence, this reading shows a clear improvement in market conditions.
It suggests that price movements are beginning to align more closely with the actual flow of capital. A correlation of 0.61 is considered moderately positive in the context of crypto market analysis.
Historically, wider gaps between price action and CVD have often preceded sharp corrections or unsustainable rallies.
The narrowing of this gap now indicates that the market may be transitioning toward a more balanced state. This is a cautiously constructive reading for those monitoring XRP’s medium-term direction.
Even so, the market has not yet confirmed a clear bullish momentum shift for XRP. Selling pressure remains the dominant force and continues to cap the upside for the token.
A consistent move of CVD from negative to positive territory would serve as the clearest confirmation of improved buyer participation. Analysts note that without this shift, any price recovery will likely remain limited in scope.
Blackley incident LIVE: Armed police barricade tower block in city street with forensics on scene

Manchester City beats Arsenal 2-1, reignites Premier League title race

Palantir posted a manifesto that reads like the ramblings of a comic book villain


-
 NewsBeat7 days ago
Pep Guardiola and Gary Neville agree over Arsenal title problem that benefits Man City
-

 Crypto World6 days ago
The SEC Conditionalises DeFi Platforms to Be Avoided for Broker Registration
-

 Fashion2 days ago
Weekend Open Thread: Theodora Dress
-

 Crypto World6 days ago
SEC Signals Exemption for Crypto Interfaces From Broker Registration
-

 News Videos4 days ago
Secure crypto trading starts with an FIU-registered
-

 Sports2 days ago
NWFL Suspends Two Players Over Post-Match Clash in Ado-Ekiti
-

 Crypto World6 days ago
SEC Proposes Certain Crypto Interfaces Don’t Need to Register as Brokers
-

 NewsBeat5 days ago
Trump and Pope Leo: Behind their disagreement over Iran war
-

 Business4 hours ago
Powerball Result April 18, 2026: No Jackpot Winner in Powerball Draw: $75 Million Rolls Over
-

 Politics2 days ago
Palestine barred from entering Canada for FIFA Congress
-

 Crypto World2 days ago
Russia Pushes Bill to Criminalize Unregistered Crypto Services
-

 Sports6 days ago
NWFL opens Pathway for new Clubs ahead of 2026 Season
-
 Entertainment6 days ago
Brand New Day’ Footage Reveals the Devastating Impact of ‘Now Way Home’
-
 Business3 days ago
Creo Medical agree sale of its manufacturing operation
-

 Politics9 hours ago
Zack Polanski demands ‘council homes not luxury flats for foreign investors’
-

 Crypto World6 days ago
Trump whales load up ahead of Mar-a-Lago luncheon.
-
Crypto World7 days ago
Sei Network Enters Quiet Reset Phase as On-Chain Metrics Signal a Slowdown in 2026
-
Business6 days ago
Kering slides after Morgan Stanley downgrade, Gucci woes loom
-

 Tech6 days ago
Google adds E2E encryption to Gmail for iOS and Android enterprise users
-

 Tech6 days ago
Apple glasses won’t go brand shopping like Meta did with Ray-Ban and Oakley
You must be logged in to post a comment Login