
Crypto World
Binance.US drops spot trading fees in challenge to rivals
![]()
Binance.US has reduced its spot trading fees to 0% for makers and 0.02% for takers across all trading pairs.
Summary
- Binance.US now charges 0% maker fees and 0.02% taker fees across all spot trading pairs.
- The exchange removed volume tiers and subscription rules, making near-zero spot fees available to every user.
- The move increases pressure on Coinbase, Kraken, and Schwab as crypto trading competition grows faster.
The exchange said the new pricing applies to every user and does not depend on trading volume, account size, or subscription plans.
The move replaces the platform’s earlier tiered structure and expands zero-fee access beyond a limited number of Bitcoin pairs. Binance.US said the change takes effect immediately and is designed to lower costs for retail traders using the platform.
New pricing targets pressure from rivals
The updated fee model puts Binance.US below many major rivals in the US market. The company said the new structure could cut trading costs by as much as 98% compared with some competing platforms, where lower-volume users often face higher charges.
Coinbase’s public pricing shows spot fees for lower-volume traders can range from about 0.40% to 0.60%. Kraken also uses a volume-based model, with entry-level fees starting near 0.25% for makers and 0.40% for takers.
Charles Schwab also said last week that it plans to launch spot crypto trading for retail clients, starting with Bitcoin and Ether at a fee of 75 basis points per transaction.
Moreover, Binance.US said the reduced fees are backed by its trading infrastructure and recent internal controls work. The company stated that it completed a SOC 2 Type II audit covering its systems and controls before rolling out the new pricing model.
The change also follows the appointment of Stephen Gregory as chief executive. Binance.US said the broader fee cut builds on its earlier strategy of offering zero-fee trading on selected pairs, but now extends that approach to all spot markets on the platform.
Exchange remains under US scrutiny
The fee cut comes as Binance-related operations continue to face political and regulatory attention in the United States. Binance reached a $4.3 billion settlement with US authorities in 2023 over anti-money laundering and sanctions violations. Former chief executive Changpeng “CZ” Zhao also pleaded guilty to a felony charge as part of that case.
Binance.US has said it operates as a separate legal entity from Binance. A company spokesperson said Binance.US “operates independently from Binance.” Even so, pressure on the broader Binance brand has continued.
In 2026, lawmakers asked federal agencies to review whether Binance is meeting its obligations under a court-ordered monitoring program. Binance denied claims tied to Iran-linked transactions and called the reports “false” and unsupported by evidence.
Fee cut comes as US crypto market gets more competitive
The new pricing shows Binance.US is trying to compete more directly for spot market share at a time when more firms are entering or expanding in the US crypto sector. Lower fees may help the platform appeal to cost-conscious users who trade often and want simpler pricing.
At the same time, the exchange is making that move while the wider Binance group remains under close watch in Washington. That leaves Binance.US trying to balance aggressive pricing with the need to reassure users and regulators about its operating standards.

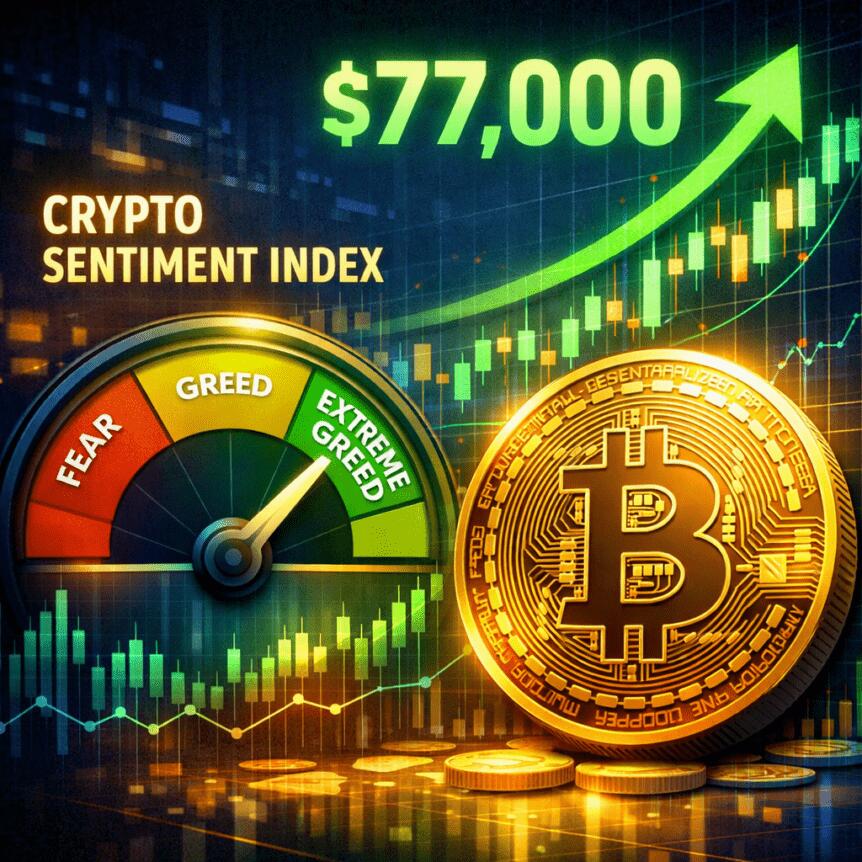
The crypto market mood has shifted from caution to cautious optimism as Bitcoin extended a rally that pushed it to the cusp of $80,000. A broad gauge of market sentiment — the Alternative.me Crypto Fear & Greed Index — climbed 14 points to 46, its highest reading in more than three months, signaling a shift away from deep fear even as traders breathe a sigh of relief after a turbulent period.
Bitcoin’s price action helped anchor the move. The leading token surged about 5.9% over roughly a 20-hour window to approach $79,400, before easing back to around $77,900. The bounce arrives amid a backdrop of mixed signals: on one hand, regulatory clarity and institutional participation have gained traction, while on the other, retail engagement remains uneven compared with prior cycles.
Key takeaways
- Crypto Fear & Greed Index rebounds to 46, the highest since January 18 and the strongest one-day rise in over three months, suggesting a shift from fear to guarded optimism.
- Bitcoin briefly neared $80,000 on a sustained intraday rally, then cooled, trading around the high-$70,000s range as of the latest data.
- The rally appears to be driven by derivatives demand, with analysts noting perpetual futures momentum outpacing spot buying in the near term.
- On-chain behavior shows a continued shift toward longer-holdings, with more than 300,000 BTC moving into long-term wallets in the past month, while shorter-term holders have been trimming positions.
- Market fundamentals show ongoing institutional interest amid a crypto-friendly regulatory backdrop, but retail participation remains a partial, slower-moving factor this cycle.
Perps-led momentum and the question of what comes next
One of the standout observations during the latest price move comes from CryptoQuant, which attributed the strength in Bitcoin’s rally to demand within the perpetual futures market. In a post on X, CryptoQuant’s head of research noted that the rally was “completely driven by demand” in perpetuals, rather than spot accumulation. The caveat, however, is that spot demand—though not collapsing—has been contracting gradually, raising the specter of a pullback if traders start taking profits or if the demand impulse from the futures market wanes.
The dynamic underscores a broader theme of the current cycle: risk managers and traders need to monitor whether the perps-led rally can sustain itself in the absence of robust spot buying. If the forward-looking appetite slows, a revert to more traditional price discovery could emerge, particularly as macro and regulatory cues continue to imprint price behavior on crypto markets.
On-chain shifts: liquidity flows and holders
On-chain activity added another layer to the narrative. CryptoQuant highlighted a notable shift in Bitcoin ownership: over 300,000 BTC have moved into long-term holder wallets over the last 30 days, while shorter-term holders have been trimming. The report framed the flow as a sign that “Bitcoin supply is moving into stronger hands.” One notable detail cited was that a single strategy—referred to in the note as Strategy—has accumulated about 53,000 BTC in the same period, contributing to the long-hold trend.
These moves align with a converging narrative of accumulation from entities perceived as patient capital. The implication for investors is nuanced: while short-term volatility may persist, the flow into longer-duration wallets can signal a stabilization of supply dynamics, potentially supporting more durable price levels if the trend continues alongside steady demand from institutions and prudent holders.
What the macro backdrop suggests for traders and builders
The mood shift comes even as geopolitical and regulatory tensions linger in the background. The price rally has occurred despite ongoing uncertainties in the Middle East and broader geopolitical frictions that can influence risk appetite. In parallel, the policy and regulatory environment in the United States continues to evolve, with a construct that remains crypto-friendly relative to the past several years. Coverage of ongoing regulatory developments, including institutional products and market infrastructure, has framed a foundation for continued institutional interest while testing the appetite of retail participants.
In this context, market watchers have noted a divergence: institutional adoption on Wall Street has progressed, with products such as regulated crypto derivatives and ETFs attracting capital. Morgan Stanley’s Bitcoin ETF inflows, reported in coverage surrounding institutional streams, point to a persistent, if measured, engagement layer. Yet retail demand, a traditional engine of multi-year cycles, has yet to reassert itself with the same velocity seen in prior upswings. This dichotomy invites a closer look at how much momentum the market can sustain without a broader retail revival.
What to watch next
Looking ahead, traders will be watching the balance between futures-driven momentum and spot demand more than any single price level. If spot buying accelerates and long-term holders continue to accumulate, it could reinforce a constructive backdrop for Bitcoin and the broader market. Conversely, a decline in futures momentum or a return of profit-taking could trigger a pullback, particularly if macro risk sentiment worsens or if regulatory signals shift toward a more cautious stance.
Meanwhile, the interaction between on-chain behavior and derivatives activity will remain a key lens for assessing the sustainability of the current rally. Investors and builders should monitor long-term holder accumulation trends, the pace of spot inflows, and the evolving regulatory narrative in the coming weeks to gauge whether this rally represents a temporary lift or a structural shift in Bitcoin’s market structure.
As the market digests this latest swing in sentiment, readers should stay tuned to updates on institutional product flows, central-bank signals, and any shifts in retail participation that could illuminate the next leg of Bitcoin’s price journey.
Key Takeaways
- Aave witnessed a TVL collapse from approximately $48.5B to $30.7B after the April 18 KelpDAO rsETH bridge security breach
- Bad debt accumulated on the platform ranges between $196M and $280M due to the exploit
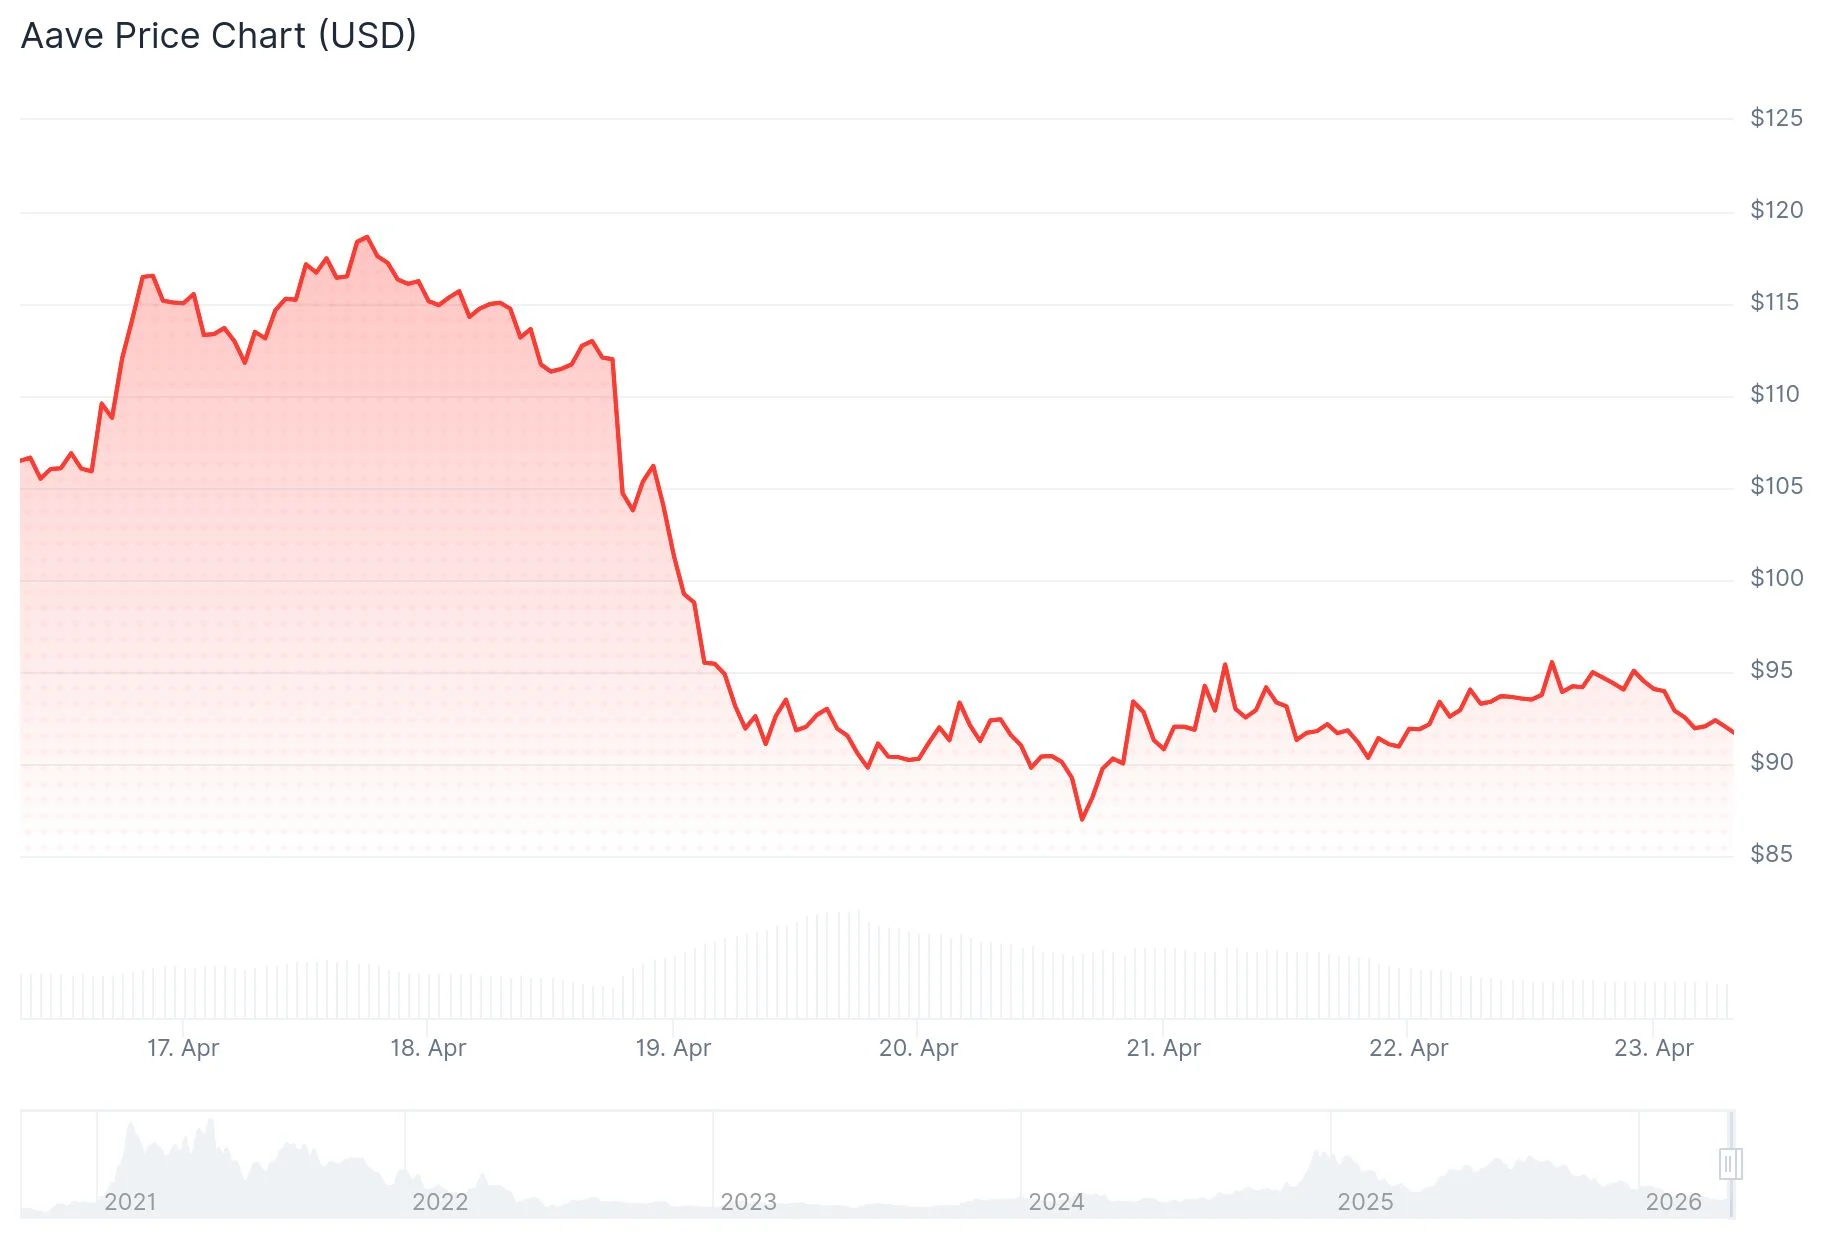
- AAVE token trades near $93, reflecting a 7% weekly decline
- Exchange token reserves jumped to 2.39M, indicating potential selling momentum
- Competitor SparkLend absorbed approximately $1.3B in capital as users fled Aave
The leading DeFi lending protocol Aave experienced a staggering $15 billion reduction in total value locked within just four days following a critical security incident tied to KelpDAO that undermined user confidence throughout the decentralized finance ecosystem.

The security breach exploited a vulnerability within KelpDAO’s rsETH bridging infrastructure. The malicious actor leveraged this weakness to create fraudulent collateral tokens, subsequently borrowing legitimate ETH from Aave’s liquidity pools before withdrawing the funds. The resulting bad debt burden facing the protocol is currently estimated at $196 million to $280 million.
Prior to the April 18 security incident, Aave maintained approximately $48.5 billion in aggregate deposits. Within four days, by April 22, that amount had contracted sharply to roughly $30.7 billion. Prominent crypto intelligence account Wu Blockchain highlighted on X that total outflows exceeded $16.2 billion, erasing more than a third of the platform’s deposit base.
Morpho protocol similarly experienced capital flight, with TVL declining from $11.7 billion down to $10.2 billion during the identical timeframe.
SparkLend Emerges as Capital Destination
The exodus from Aave didn’t entirely exit the DeFi sector. SparkLend’s total value locked climbed to $3.2 billion, absorbing roughly $1.3 billion in fresh deposits over the same period. Blockchain analytics indicate users repositioned funds toward platforms perceived as carrying reduced risk exposure.
The AAVE token was changing hands around $93.45 during the analysis period, showing a modest 1.06% gain over 24 hours. Nevertheless, the asset remains down 7.09% across the previous week and approximately 11% throughout the past month.
Technical indicators on the four-hour chart show the MACD histogram turning positive with signs of a potential bullish crossover forming. However, the RSI indicator hovers around 46, positioned just beneath the neutral 50 threshold.
Blockchain Metrics Indicate Distribution Activity
Exchange-held reserves of AAVE tokens surged to nearly 2.39 million units. Historical patterns show that substantial token transfers to centralized exchanges typically precede selling activity.
Active borrowing positions on Aave are stagnating, demand for new loans has weakened, and incoming capital flows have diminished considerably. The divergence between falling TVL and rising exchange inflows creates a pattern that market analysts typically interpret as distribution behavior rather than accumulation.
The token has faced repeated rejections approaching the $100–$105 price zone, establishing this range as immediate overhead resistance. Meanwhile, the $85–$90 corridor represents critical support territory worth monitoring.
Notably, large-wallet addresses have continued accumulating AAVE tokens despite the broader outflow trend. At reporting time, Bitcoin maintained levels above $78,000 while Ethereum held above $2,300, offering a generally supportive macroeconomic environment for crypto assets.
Should buyers successfully breach the $96 level, the subsequent price target becomes $100. A decisive break above $100 would clear the path toward $108. Conversely, failure to maintain $90 support could expose the $88 level, with $84 representing the next significant support zone beneath that.


Key takeaways
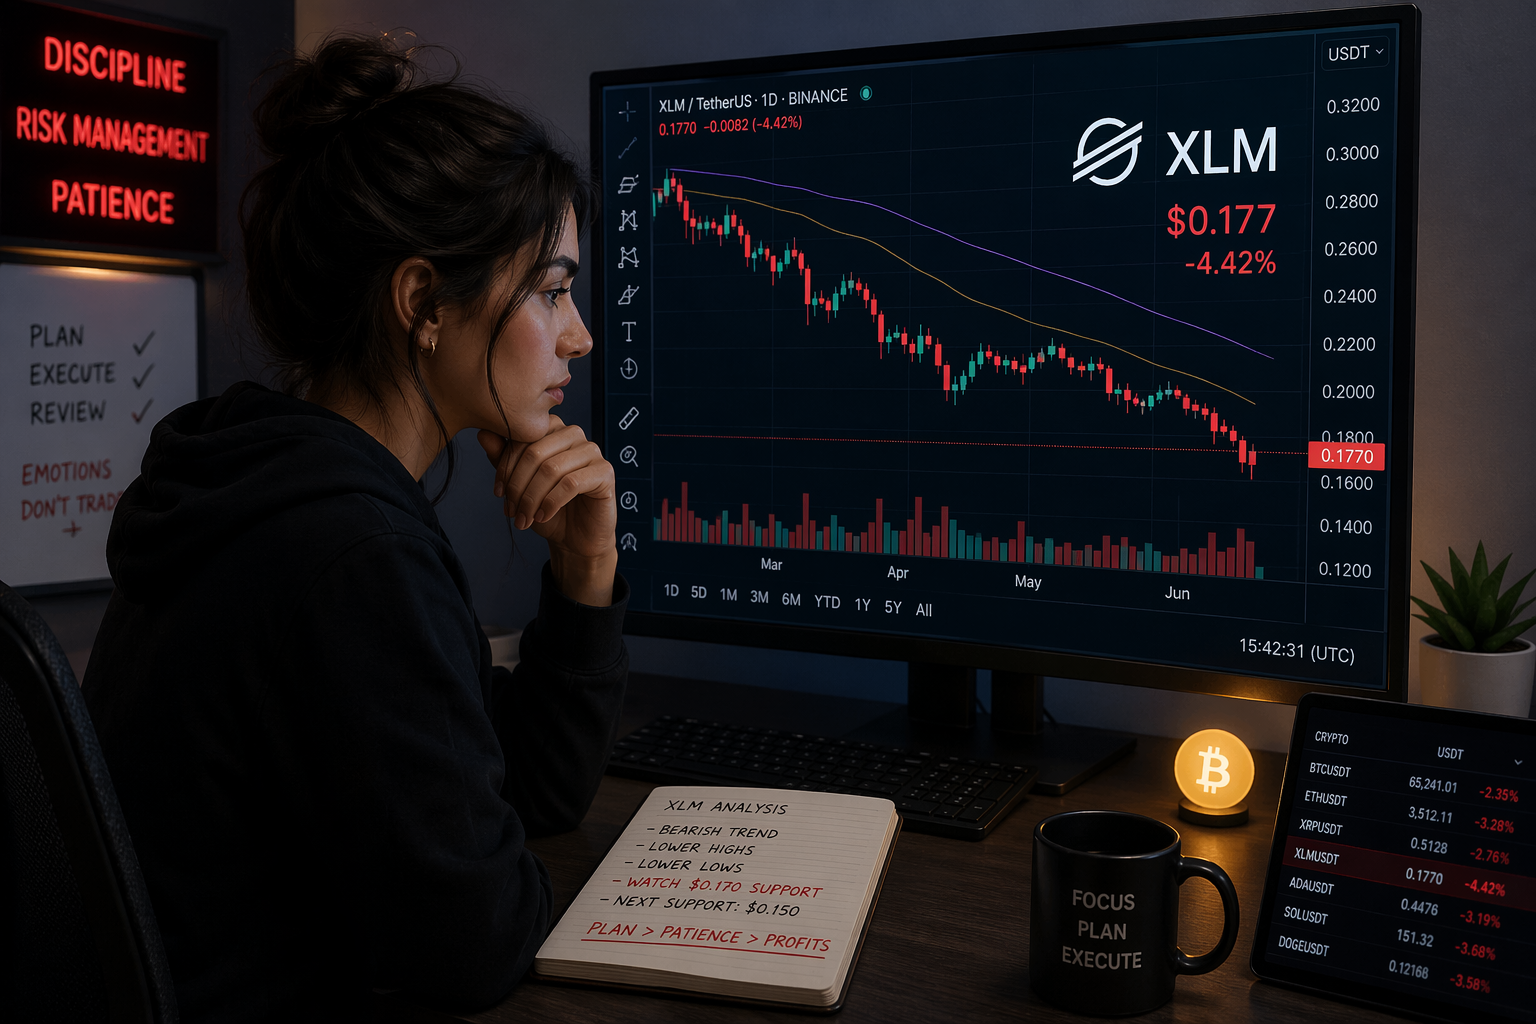
- XLM is down 2% on Thursday after the 100-day EMA capped its short-term recovery run.
- XLM futures Open Interest stabilizes, but the declining long-to-short ratio signals a bearish bias.
XLM flips bearish as the leverage market loses confidence
Stellar (XLM) extended its losses on Thursday, with the token struggling to regain momentum as the 100-day Exponential Moving Average (EMA) near $0.1798 continues to cap upside attempts, reinforcing a bearish short-term outlook.
Sentiment in the derivatives market also points to growing downside expectations. Data from Coinglass shows that XLM futures Open Interest (OI) remains elevated at $114.70 million after climbing sharply from $99.45 million earlier this week, signaling sustained trader activity despite weak price action.
However, bearish positioning continues to dominate. The long-to-short ratio currently sits at 0.7632 — a level that has remained below 1 since mid-January — indicating that traders are increasingly favoring short positions and anticipating further downside for XLM.
Technical forecast: XLM could drop below $0.1700
The XLM/USD 4-hour chart remains bearish and efficient, indicating that the bears have regained control in the near term.
XLM is trading below the key 100-day EMA while still holding above the 50-day EMA at $0.1669.
Momentum indicators still show some signs of resilience. The Relative Strength Index (RSI) is hovering around 62 on the 4-hour timeframe, remaining above the neutral midpoint, while the Moving Average Convergence Divergence (MACD) indicator continues to trade above its signal line, suggesting buyers have not fully lost control.
Still, downside risks remain elevated. If XLM falls below the 50-day EMA support at $0.1669, the token could slide toward the key consolidation support zone at $0.1471 — a level that has held since early February.

On the upside, bulls would need to push XLM above the 100-day EMA at $0.1798 to uphold a bullish sentiment.
A daily candle close above that resistance could pave the way for a move toward the 200-day EMA near $0.2101.

Wenn Sie auf der Suche nach den besten Online-Casinos in Deutschland sind, sind Sie bei uns genau richtig. Wir haben uns die Mühe gemacht, die beliebtesten und zuverlässigsten Online-Casino-Plattformen in Deutschland zu sammeln und Ihnen eine ausführliche Bewertung zu bieten.
Unser Team von Experten hat sich intensiv mit den verschiedenen Online-Casinos auseinandergesetzt und hat eine Liste der besten Online-Casinos in Deutschland erstellt. Wir haben uns auf die Suche nach den besten mobile online casinos, den besten online casino testbericht und die besten online casinos deutschland gemacht.
Wir haben uns auf die Suche nach den besten Online-Casinos in Deutschland gemacht, um Ihnen eine ausführliche Bewertung zu bieten. Wir haben uns auf die Suche nach den besten mobile online casinos, den besten online casino testbericht und die besten online casinos deutschland gemacht.
Wir haben uns auf die Suche nach den besten Online-Casinos in Deutschland gemacht, um Ihnen eine ausführliche Bewertung zu bieten. Wir haben uns auf die Suche nach den besten mobile online casinos, den besten online casino testbericht und die besten online casinos deutschland gemacht.
Wir empfehlen Ihnen, sich auf unsere Liste der besten Online-Casinos in Deutschland zu konzentrieren, um sicherzustellen, dass Sie die beste Erfahrung haben. Wir sind sicher, dass Sie die beste Wahl treffen werden.
Wir wünschen Ihnen viel Glück bei Ihrer Suche nach den besten Online-Casinos in Deutschland!
Die Top-5 Online-Casinos in Deutschland
Wenn Sie auf der Suche nach den besten Online-Casinos in Deutschland sind, sind Sie hier genau richtig. Wir haben für Sie die Top-5 Online-Casinos in Deutschland ausgewählt, die Ihnen eine unvergessliche Spiel-Erfahrung bieten.
1. CasinoEuro
CasinoEuro ist eines der bekanntesten und beliebtesten Online-Casinos in Deutschland. Mit über 2.000 verschiedenen Spielen und einer Vielzahl an Zahlungsmethoden bietet es Ihnen eine Vielzahl an Möglichkeiten, Ihre Lieblings-Spiele zu spielen.
| €10 | €10 | Visa, Mastercard, Skrill, Neteller, PayPal |
2. Mr. Green Casino
Mr. Green Casino ist ein weiteres Top-Online-Casino in Deutschland, das Ihnen eine Vielzahl an Spielen und Zahlungsmethoden bietet. Mit einer Mindesteinzahlung von €10 und einer Vielzahl an Zahlungsmethoden ist es für jeden Spieler geeignet.
| Over 600 | Visa, Mastercard, Skrill, Neteller, PayPal |
3. Betsson Casino
Betsson Casino ist ein weiteres Top-Online-Casino in Deutschland, das Ihnen eine Vielzahl an Spielen und Zahlungsmethoden bietet. Mit einer Mindesteinzahlung von €10 und einer Vielzahl an Zahlungsmethoden ist es für jeden Spieler geeignet.
| Over 500 | Visa, Mastercard, Skrill, Neteller, PayPal |
4. Unibet Casino
Unibet Casino ist online casinos österreich ein weiteres Top-Online-Casino in Deutschland, das Ihnen eine Vielzahl an Spielen und Zahlungsmethoden bietet. Mit einer Mindesteinzahlung von €10 und einer Vielzahl an Zahlungsmethoden ist es für jeden Spieler geeignet.
| Over 400 | Visa, Mastercard, Skrill, Neteller, PayPal |
5. 888 Casino
888 Casino ist ein weiteres Top-Online-Casino in Deutschland, das Ihnen eine Vielzahl an Spielen und Zahlungsmethoden bietet. Mit einer Mindesteinzahlung von €10 und einer Vielzahl an Zahlungsmethoden ist es für jeden Spieler geeignet.
| Over 300 | Visa, Mastercard, Skrill, Neteller, PayPal |
Wenn Sie auf der Suche nach den besten Online-Casinos in Deutschland sind, sind Sie hier genau richtig. Wir haben für Sie die Top-5 Online-Casinos in Deutschland ausgewählt, die Ihnen eine unvergessliche Spiel-Erfahrung bieten.
Wie wählen Sie das beste Online-Casino aus?
Wenn Sie sich für ein Online-Casino entscheiden, ist es wichtig, dass Sie sich gut informieren und die richtigen Kriterien berücksichtigen. Einige der wichtigsten Faktoren sind die Lizenz, die Software, die Spieleauswahl und die Boni. Einige Online-Casinos bieten auch mobile Versionen an, die Sie auf Ihrem Smartphone oder Tablet spielen können.
Bevor Sie sich für ein bestimmtes Online-Casino entscheiden, sollten Sie sich einen Überblick über die Top Online-Casinos in Deutschland machen. Einige der beliebtesten Online-Casinos in Deutschland sind zum Beispiel https://tirolschiffahrt.com/ , https://tirolschiffahrt.com/ und https://tirolschiffahrt.com/ . Sie sollten auch einen Blick auf die Online-Casino-Testberichte werfen, um sich ein realistisches Bild von den verschiedenen Anbietern zu machen.
Wenn Sie sich für ein bestimmtes Online-Casino entschieden haben, sollten Sie sich auch um die Sicherheit und Zuverlässigkeit des Anbieters kümmern. Einige Online-Casinos bieten auch eine mobile Version an, die Sie auf Ihrem Smartphone oder Tablet spielen können. Es ist auch wichtig, dass Sie sich über die verschiedenen Spiele und Boni informieren, um sicherzustellen, dass Sie das beste Online-Casino für Ihre Bedürfnisse auswählen.

Bitcoin price has just breached $78,000 as a corporate arms race for BTC supremacy reaches a flashpoint, in a single bullish prediction. Strategy has officially surpassed BlackRock as the world’s largest Bitcoin holder, noting a huge $2.8 billion unrealized profit with its aggressive buying. They don’t care if they get the bottom or the top.
Just recently, Strategy disclosed the purchase of 34,164 BTC at an average of $74,395, funded via $2.18 billion in STRC preferred securities, bringing its total to 815,061 BTC. BlackRock’s iShares Bitcoin Trust (IBIT) trails at 802,523 BTC, despite absorbing $900 million in fresh ETF inflows in 7 days.
Polymarket odds for Bitcoin hitting $80,000 by month-end jumped to 50.5% YES, up sharply from 30% just 24 hours prior. Now, does institutional accumulation at this scale actually move price, or has the market already priced it in?
Bitwise Europe’s analysis of 100 Strategy buying events since 2020 suggests traders consistently “sell the news.”
Discover: The best pre-launch token sales
Bitcoin Price Prediction: $80,000 Easy?
Bitcoin’s 10% rally over two weeks has been confirmed by Strategy’s average buy price of $74,395. The convergence of corporate cost basis and current spot price creates a de facto support floor. Recent bullish price action has been driven by a combination of macro relief and spot ETF inflows.
The technical setup is consolidating after a sharp impulse move to $79,300, with a pause at the current $78,000 level. Although Strategy’s unrealized position sits at a big profit, the company has a vested interest in defending current levels through continued buys. That adds asymmetric buy-side pressure.
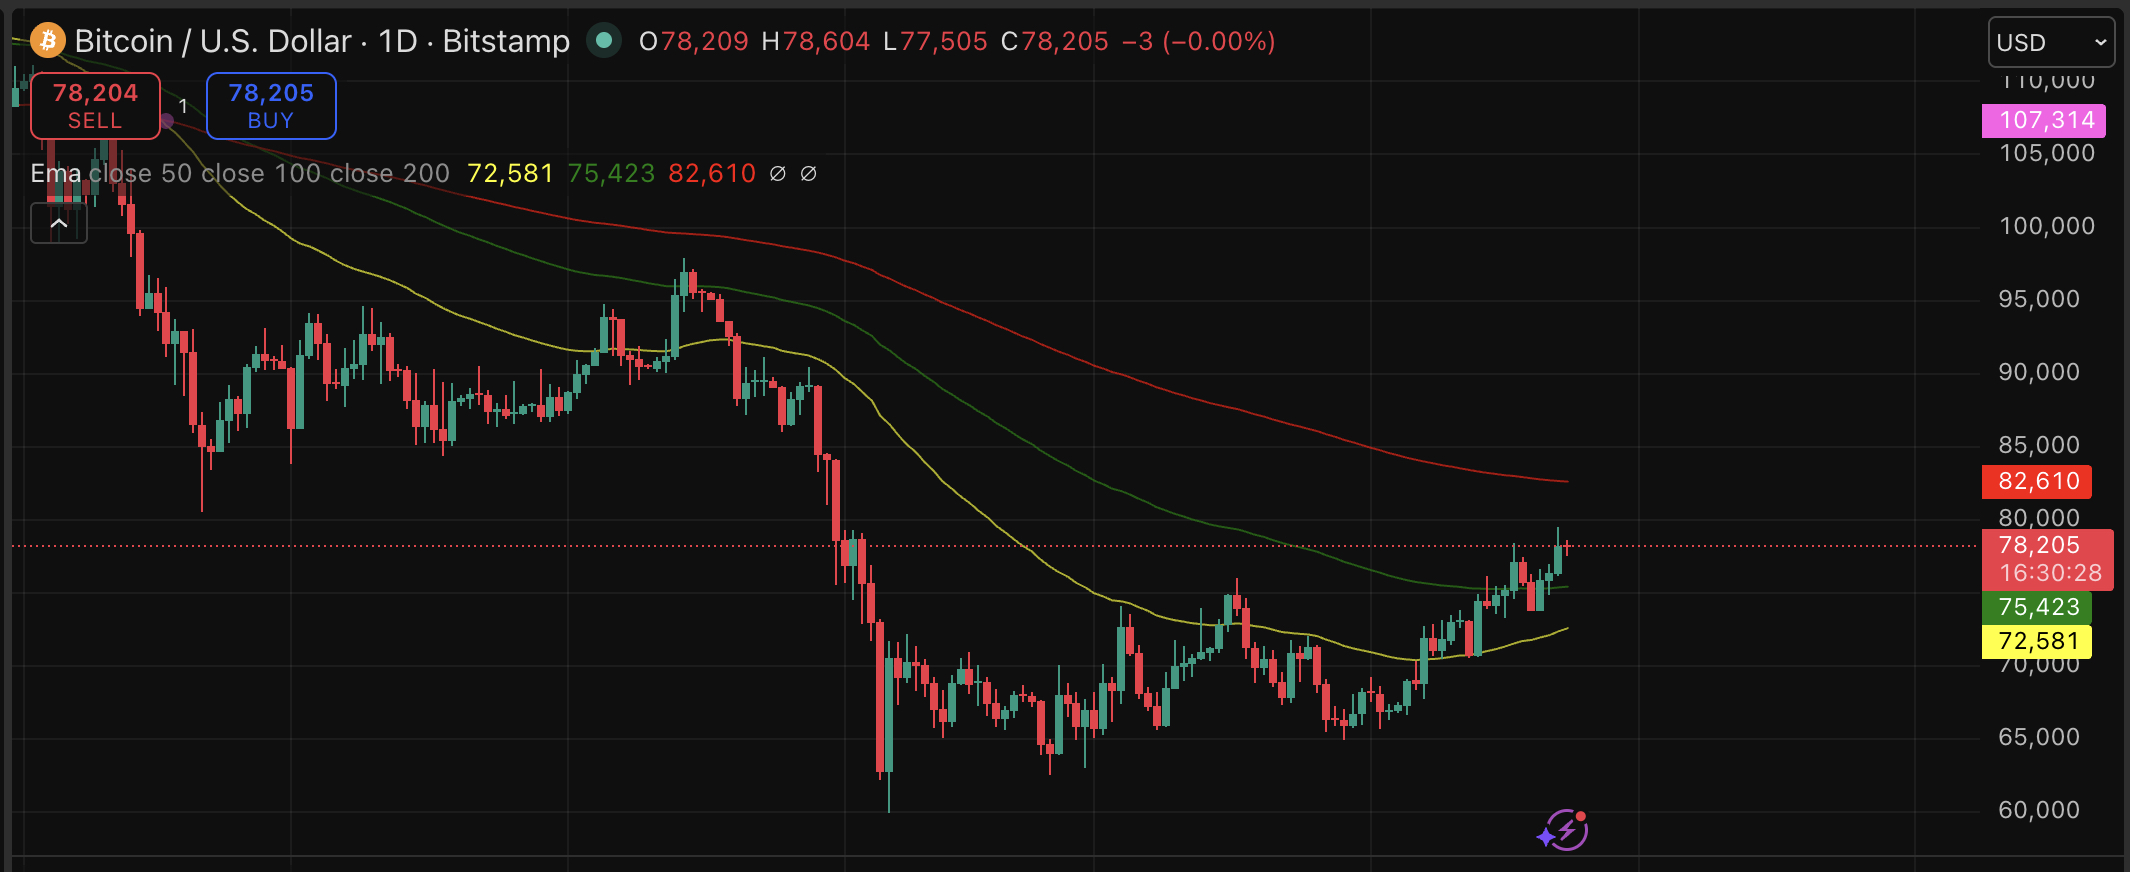
If BTC can clear the $79,000 resistance again and target $80,000, the next move would be rocketing. But a break below $75,000 would invalidate the bullish structure again and likely trigger ETF outflows.
The institutional BTC infrastructure buildout by both BlackRock and Strategy points to sustained long-term demand. Patience is the word.
Discover: The best crypto to diversify your portfolio with
Bitcoin Hyper Targets Early Mover Upside as Bitcoin Tests Key Levels
Bitcoin is constructive but a 2x return requires hundreds of billions in new capital. Early-stage infrastructure plays offer a different risk-reward profile entirely. That’s the window Bitcoin Hyper ($HYPER) is positioning itself to capture.
Bitcoin Hyper is building what it claims is the first-ever Bitcoin Layer 2 with Solana Virtual Machine (SVM) integration, delivering sub-second finality and low-cost transactions on top of Bitcoin’s security layer.
The pitch: everything Bitcoin promised for payments and programmability is finally functional. The presale has raised beyond $32 million at a current token price of $0.013679, with 36% APY staking available at launch via a Buy and Stake option.
Features include a Decentralized Canonical Bridge for BTC transfers, high-speed smart contract execution, and support for payments, meme coins, and dApp, and the full programmability stack Bitcoin itself never natively supported.
Research Bitcoin Hyper at the official presale page before the current price stage closes.
The post Bitcoin Price Prediction: BlackRock vs Strategy BTC Accumulation Battle appeared first on Cryptonews.


Key takeaways
- Hyperliquid holds steady around $40 on Thursday, up 1.1% in the last 24 hours.
- The negative funding rate gives HYPE a mixed signal in the market.
Hyperliquid (HYPE) is trading around $40.95 at press time on Thursday, stabilizing after a 3%+ gain in the previous session.
While the decentralized exchange (DEX) token has managed to hold recent levels, weakening retail demand in the leverage market and a developing rising wedge pattern on the chart are keeping the broader outlook neutral-to-bearish.
HYPE’s futures market suggests a cooling demand
HYPE initially attracted strong retail interest during heightened geopolitical tensions around the US–Iran situation and the Strait of Hormuz, as its platform enabled 24/7 trading of commodities such as oil and precious metals.
However, as geopolitical pressure eased following signals of extended diplomatic timelines, speculative interest in the token has started to fade.
Data from CoinGlass shows HYPE futures open interest at about $1.63 billion, moving mostly sideways—an indication that trader participation has plateaued.
Meanwhile, the funding rate sits at -0.0061%, suggesting a growing tilt toward short positioning as traders increasingly bet on downside risk.
Technical outlook: Bears could push the price lower
The HYPE/USD 4-hour chart is bearish and efficient as HYPE remains supported above both the 50-day Exponential Moving Average (EMA) near $38.46 and the 200-day EMA around $34.51.
The 4-hour structure is forming a rising wedge pattern, typically considered a bearish setup when momentum weakens. The momentum indicators also paint a bearish picture.
The MACD remains in negative territory, signaling fading bullish strength, while the RSI at 47 reflects a growing bearish condition.

If the sellers remain in control, they would encounter immediate support at the trendline near $40.33. A break below this level could open a path toward the 50-day EMA at $38.46, followed by stronger support near the 200-day EMA at $34.51.
However, if the bulls push higher, resistance is first seen at $43.71, with further upside capped near $45.77 at the upper trendline boundary.
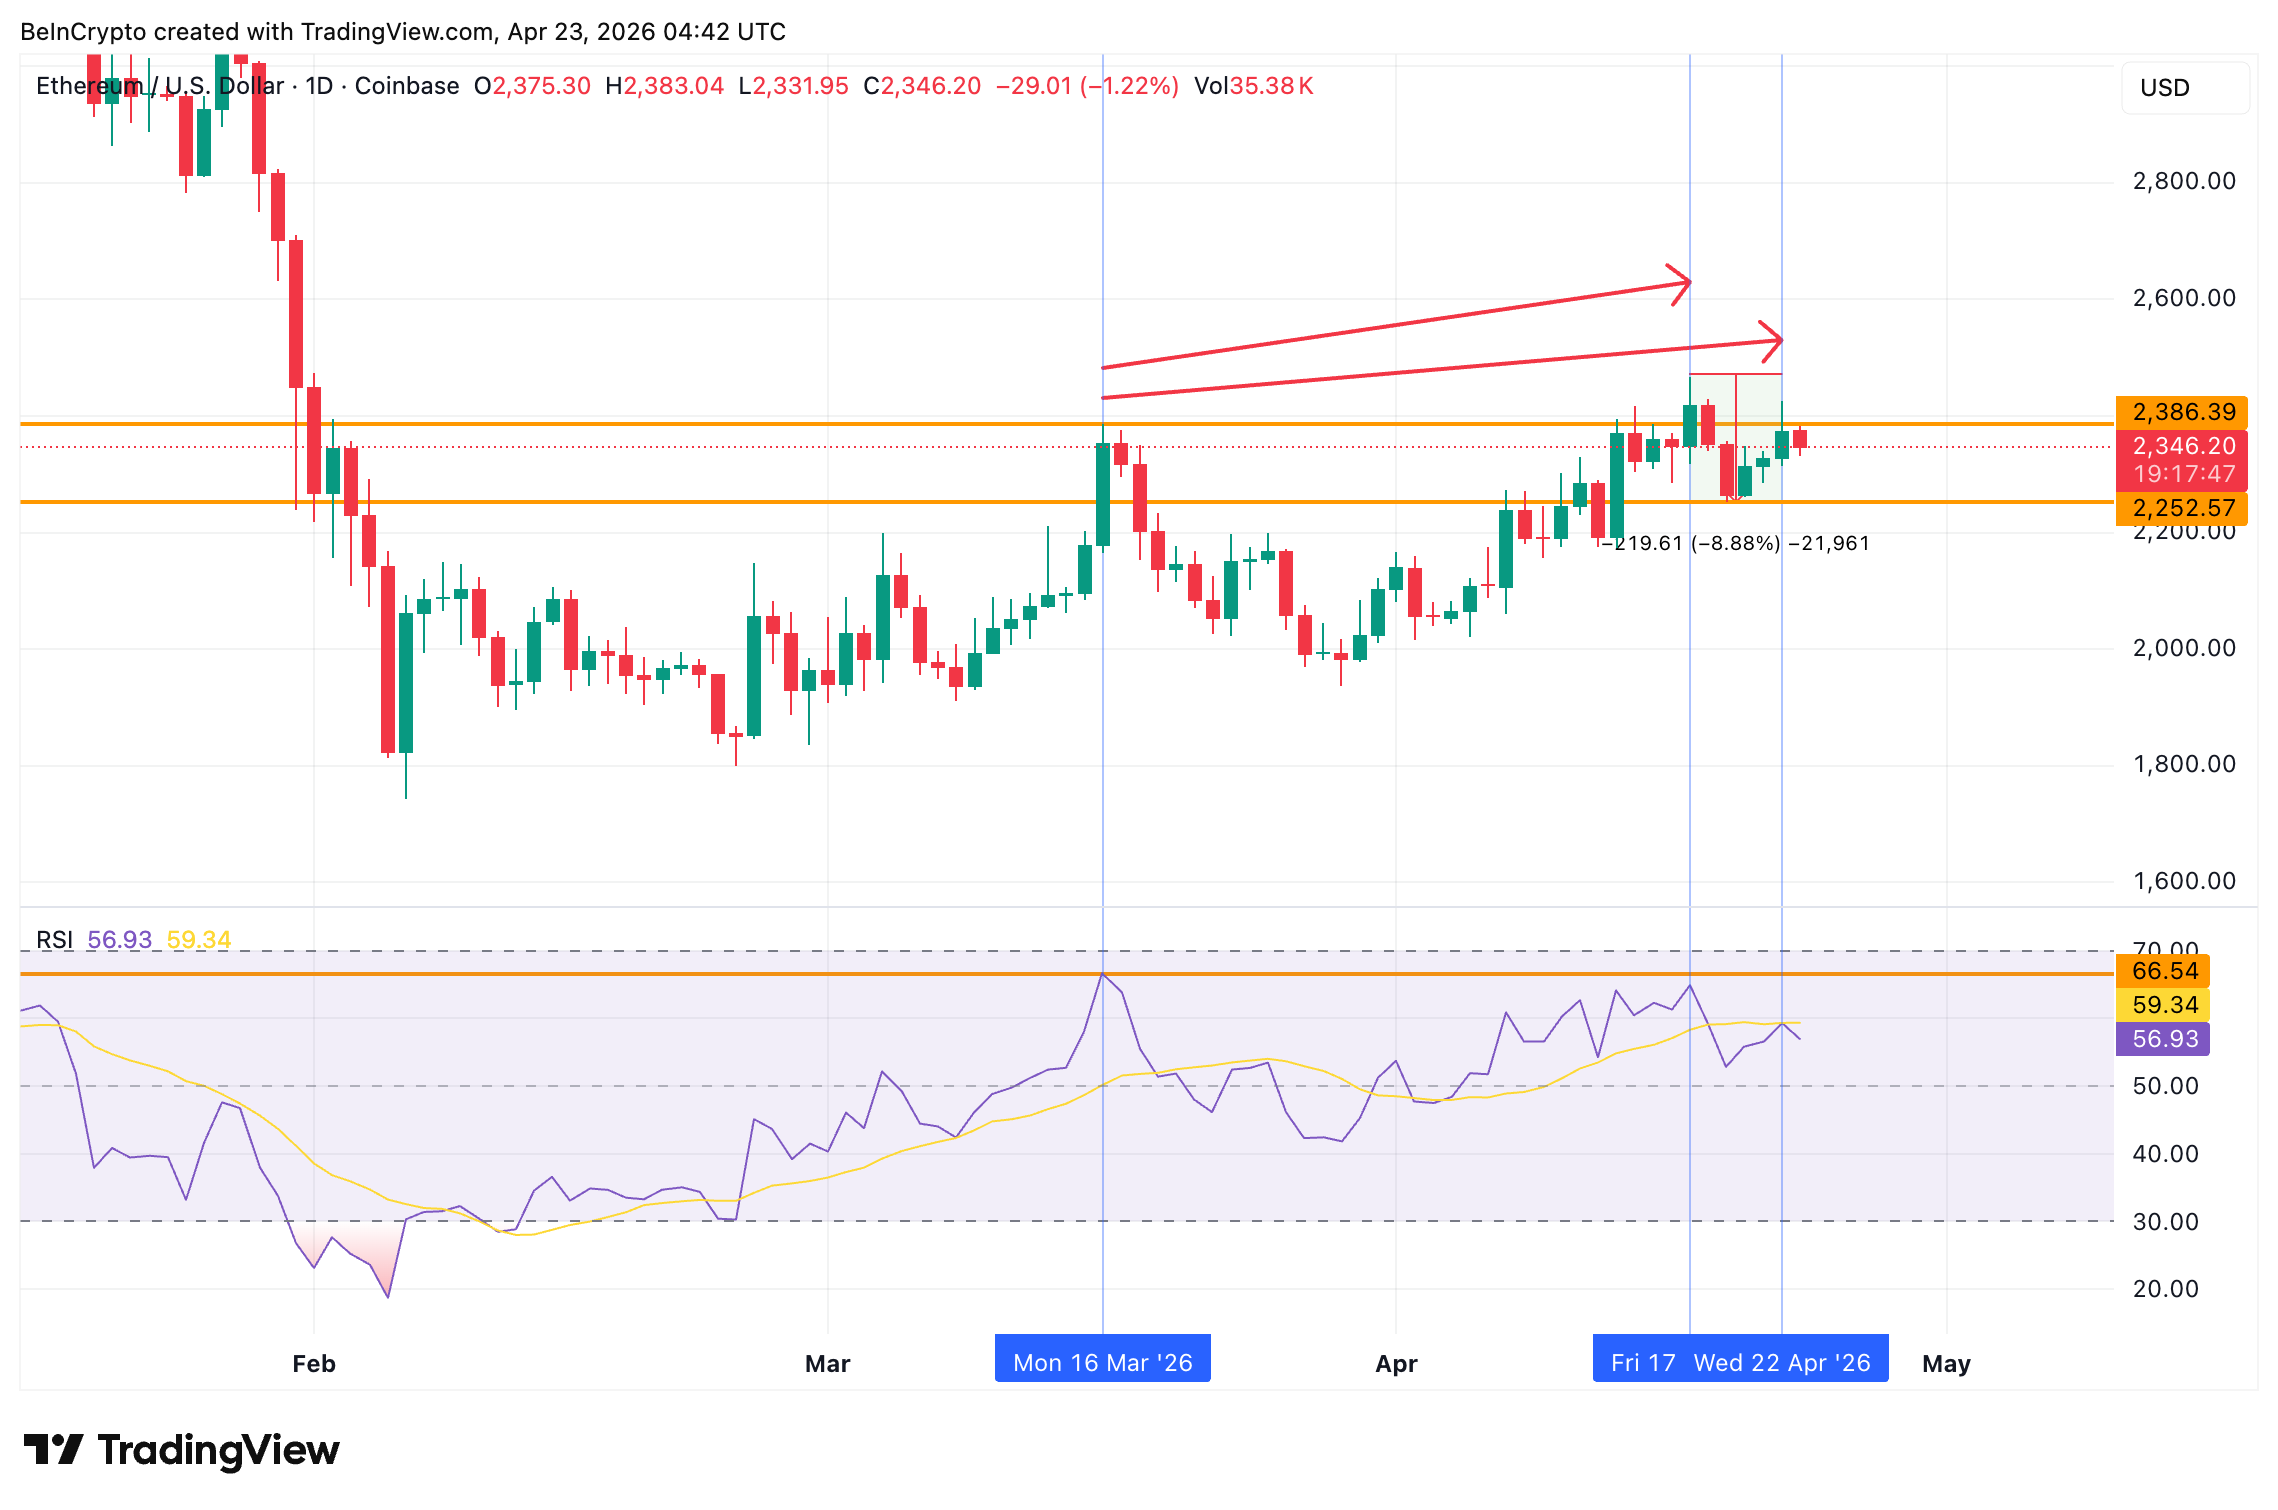
Ethereum (ETH) price is flashing the same bearish warning that preceded a near 9% correction last week, with the signal reappearing on April 22.
However, underlying positioning has shifted. Whale accumulation and a flip in funding rate suggest the path this time could differ from the April 17 unwind, even though the core divergence remains intact.
RSI Divergence Flashes a Second Time as Whales Shift Stance
Ethereum (ETH) price is flashing a regular bearish divergence for the second time in five weeks. The Relative Strength Index (RSI), a momentum indicator, peaked at 66.54 on March 16. When price pushed to a higher high on April 22, RSI failed to match that peak, leaving a lower high on the oscillator. The reading signals weakening momentum.
The same pattern appeared between March 16 and April 17. Back then, it triggered an 8.88% correction before ETH found its footing at $2,252.
Want more token insights like this? Sign up for Editor Harsh Notariya’s Daily Crypto Newsletter here.

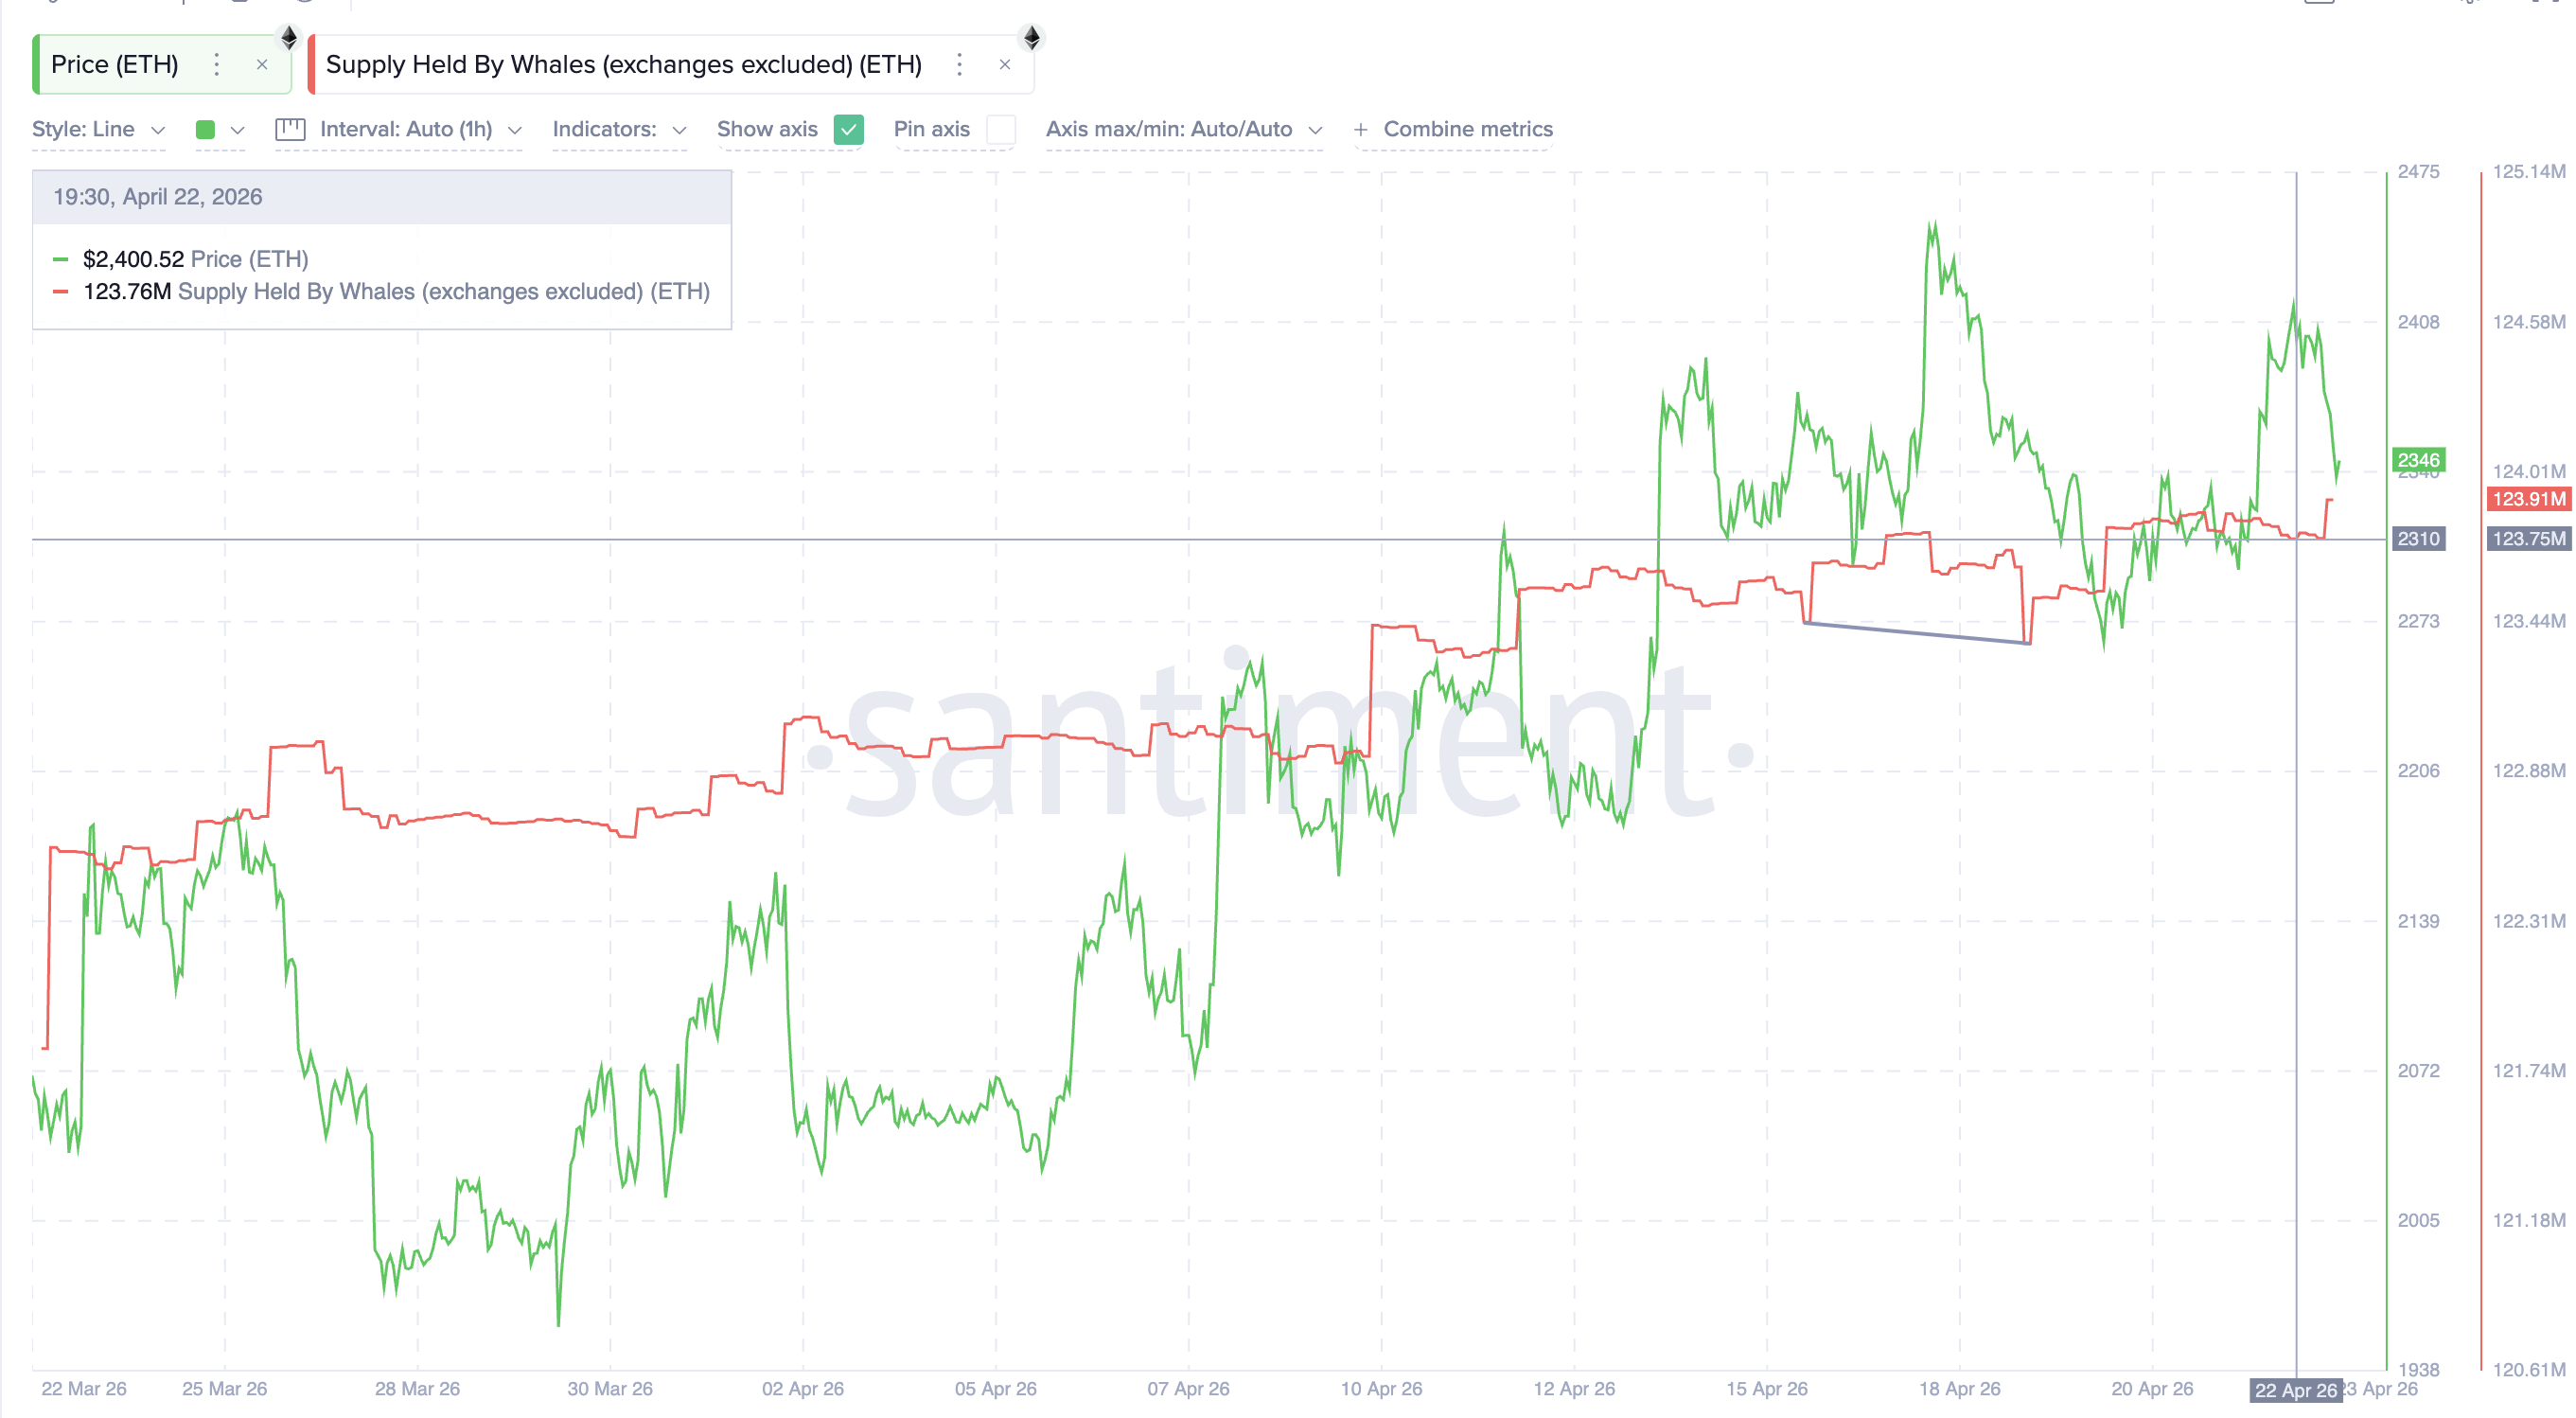
However, whale behavior looks different this time. The data suggests Ethereum whales may have begun adding supply again. Their holdings rose from 123.75 million on April 19 to 123.91 million by April 22.
In contrast, during the April 16-19 unwind, whales dumped reserves as price corrected. The shift in positioning suggests a different backdrop, though the divergence itself remains active. However, traders must keep an eye on whale positioning going ahead as this cohort as a tendency to drop reserves suddenly.
Whether funding rate and open interest confirm this shift determines whether the divergence produces another deep pullback.
Funding Rate Flip Contrasts With Last Week’s Setup
The derivatives market shows a different positioning setup versus mid-April. ETH open interest sits near $12.3 billion, comparable to the reading when the April 17 divergence fired. However, Ethereum funding rate has flipped.
On April 17, funding sat at -0.003%, pointing to a short-biased market. That short-biased skew set up a squeeze dynamic. Once price reversed off the April 19 low (after the divergence played out), the trapped shorts had to cover, which helped fuel the rebound. In contrast, funding rate now sits slightly positive, implying traders are leaning long.
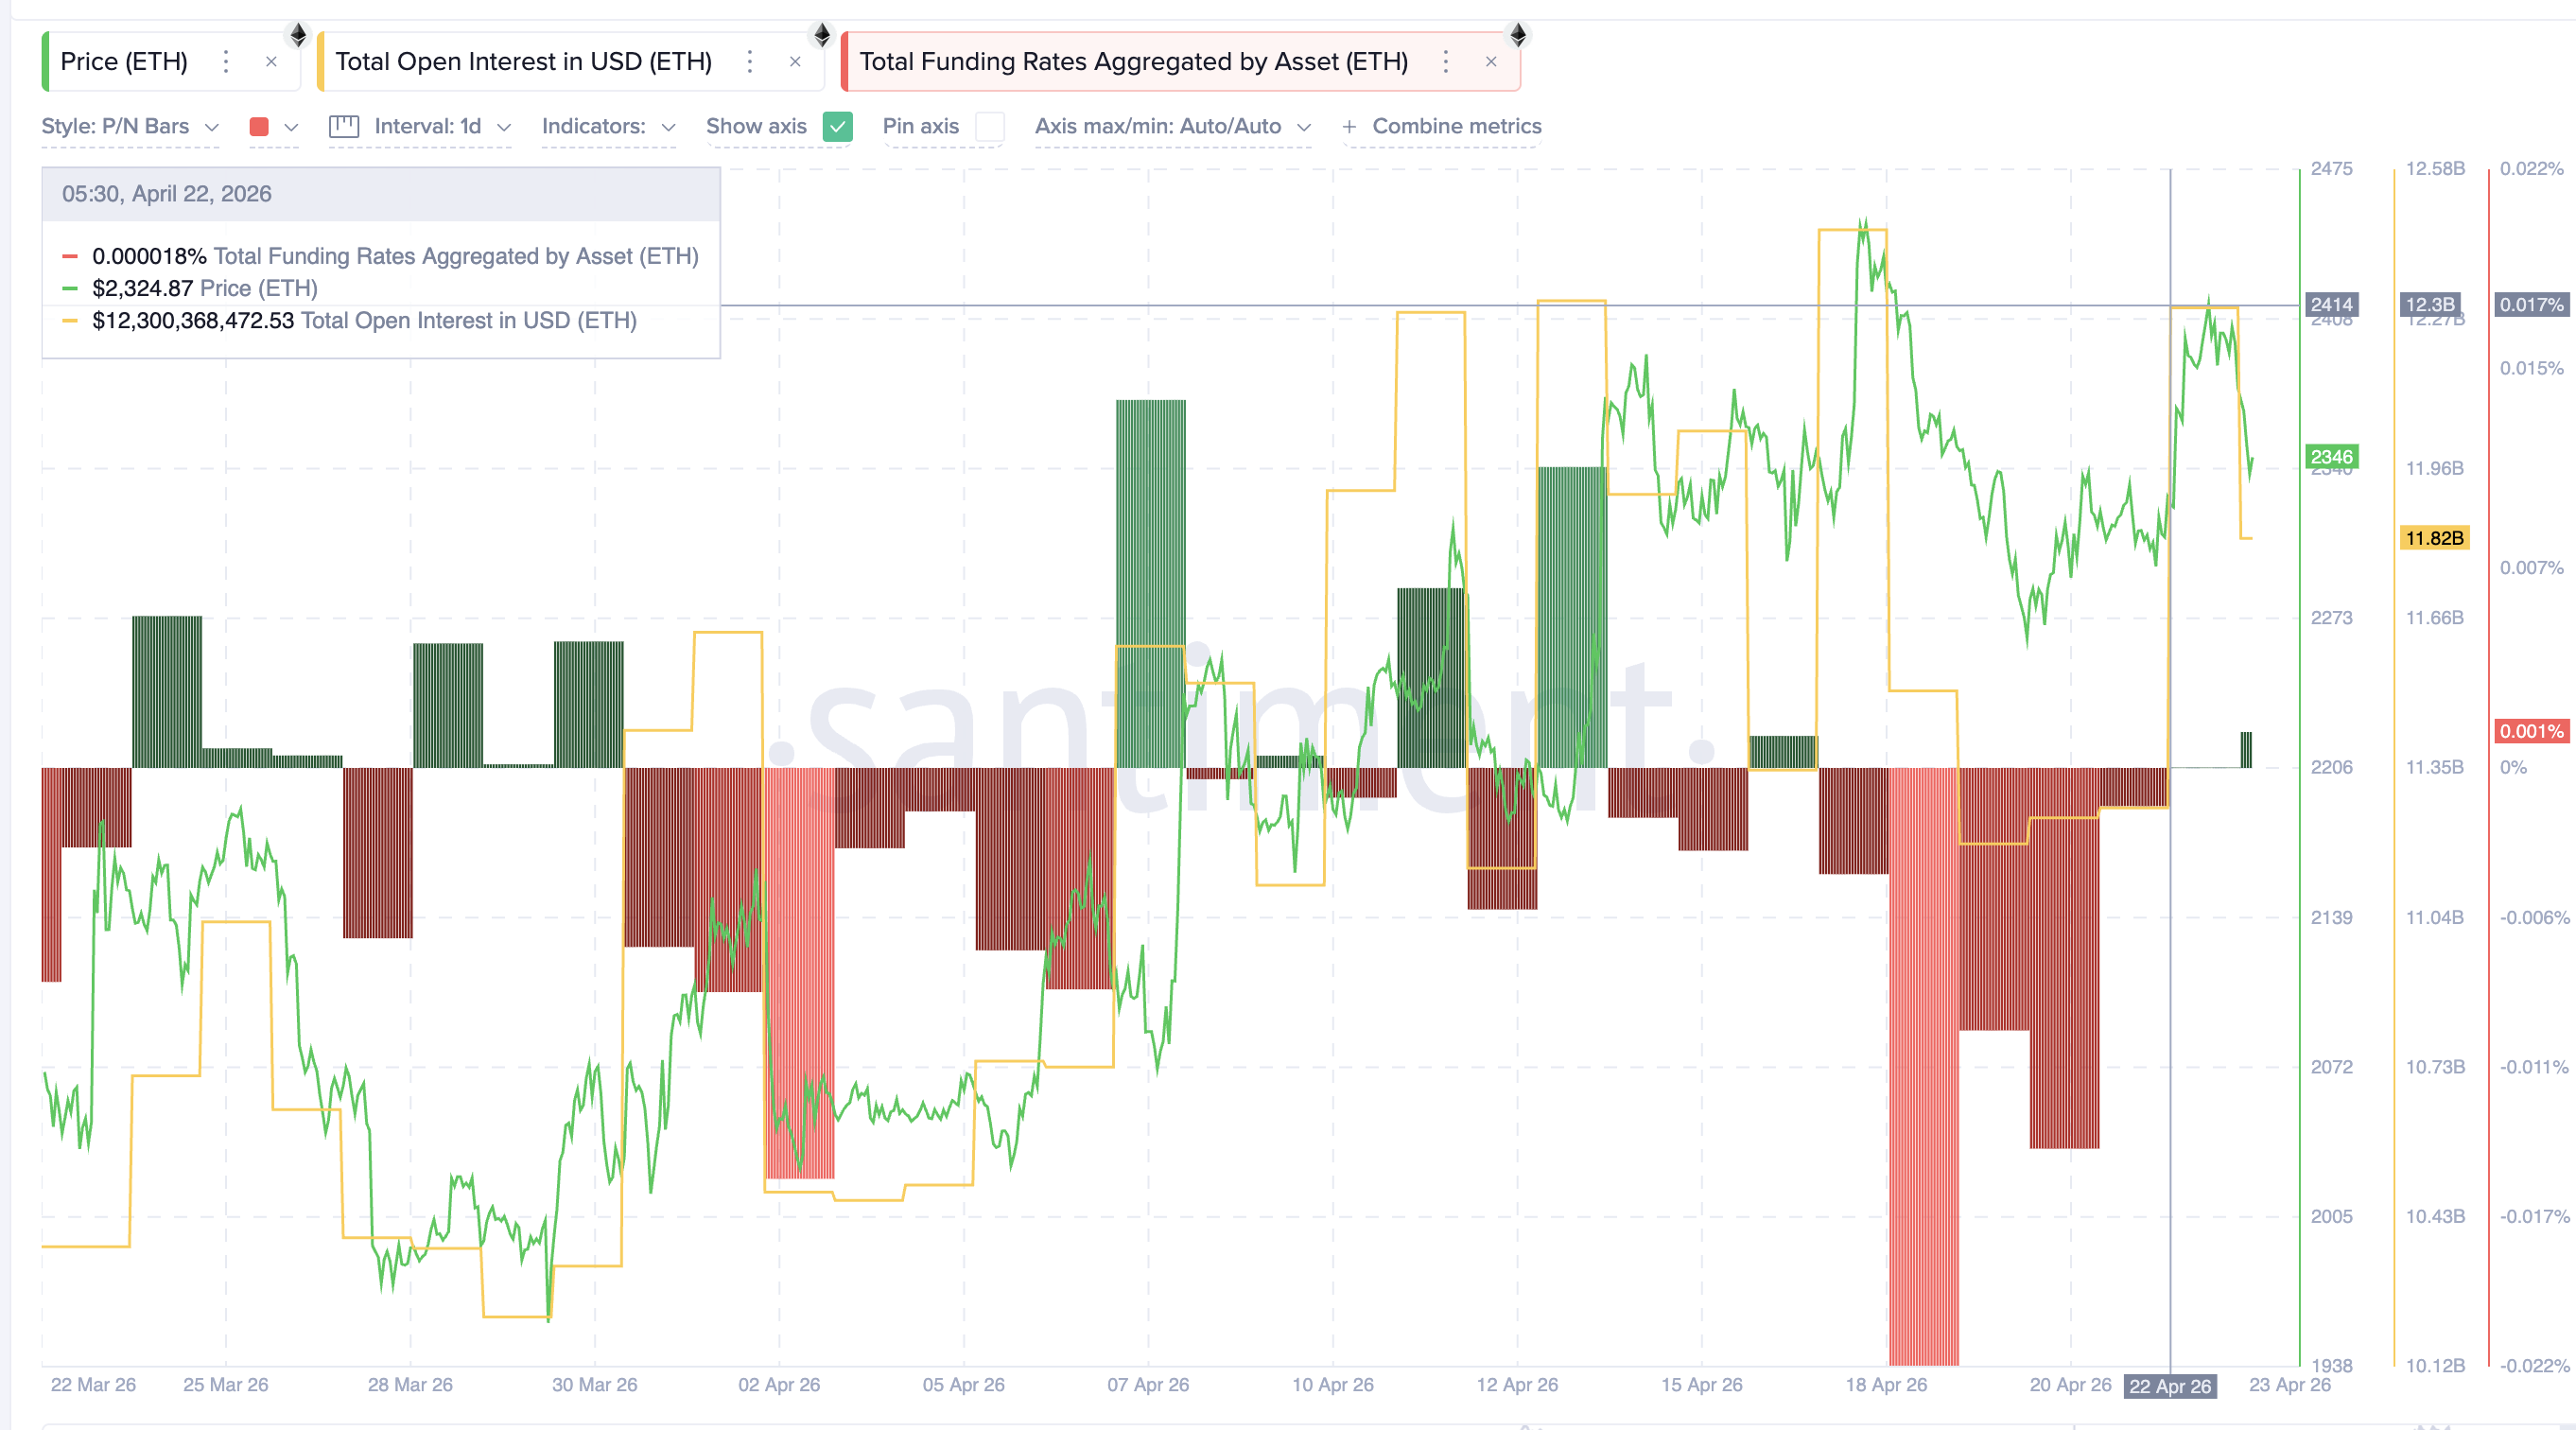
The shift matters. Long-biased positioning, albeit mild, facing a bearish divergence creates the opposite setup from last week. If a pullback does start, long liquidations would amplify the downside rather than squeeze shorts into a rebound. Yet funding rates remain far from the extremes needed to force an immediate squeeze in either direction.
With whale flow supporting the upside but positioning leaning long, the Ethereum price chart becomes the decider.
Key Ethereum Price Levels Define the Next Move
The ETH price chart lays out the decision zones. For invalidation of the bearish setup, ETH needs to close above $2,377, the 0.236 Fibonacci level, which currently caps the bounce.
The downside case hinges on whales holding their current stance. If ETH cannot reclaim $2,377 and whale reserves drop, the $2,252 level becomes the first test, mentioned earlier. That level aligns with a concentrated ETH cost basis cluster.
Glassnode data shows 716,028 ETH sitting between $2,231 and $2,250 in cost basis terms. Holders at this cost basis did not sell during the April 17-19 correction. That is likely why $2,252 held as support last time.
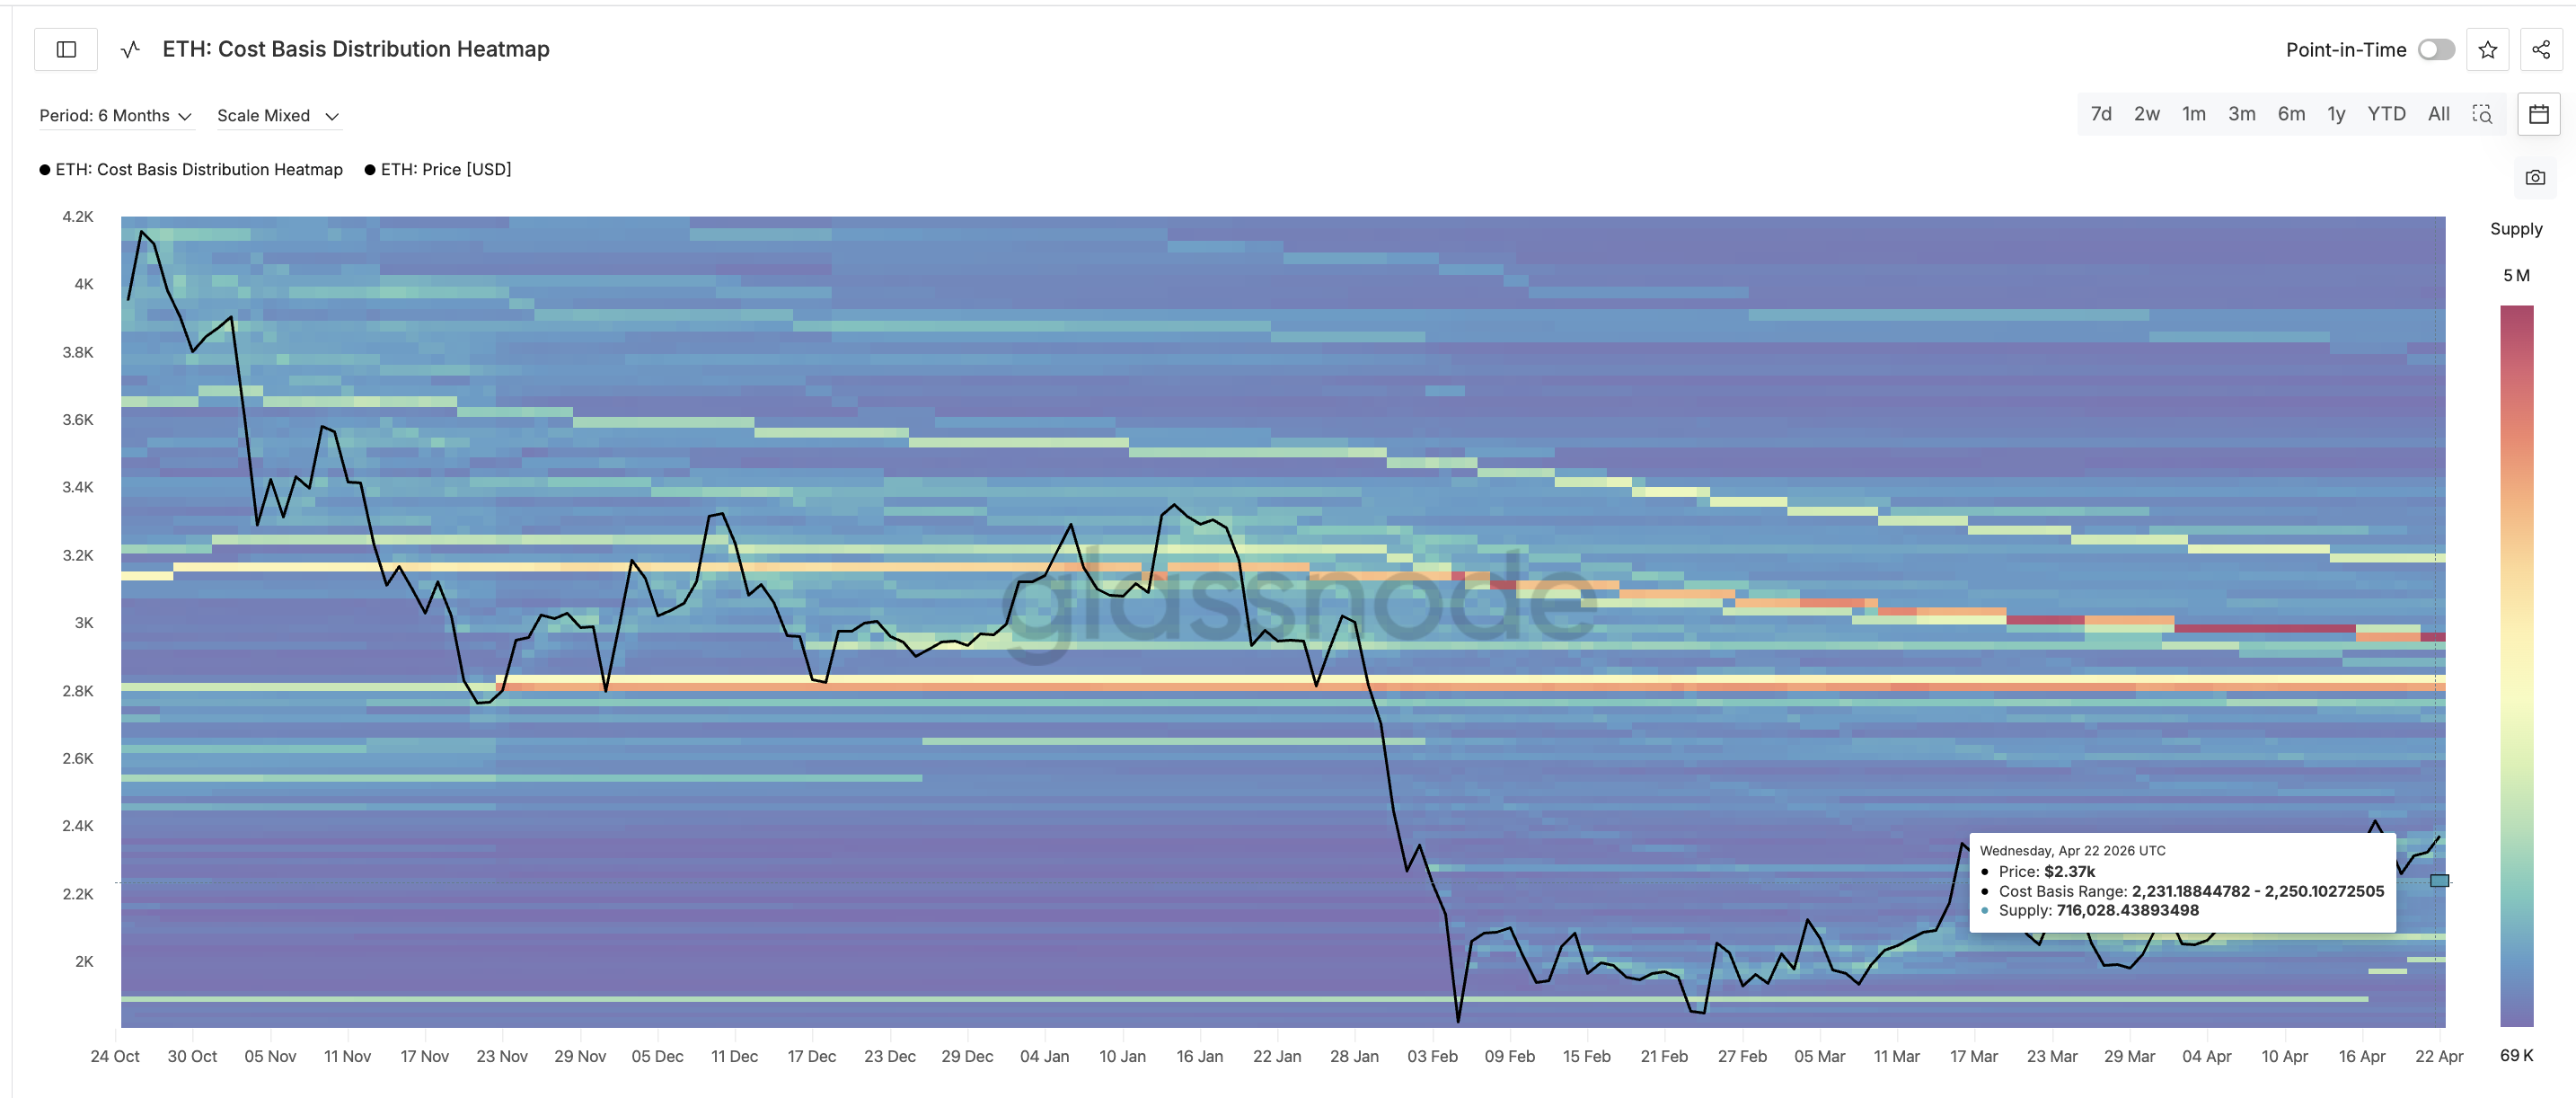
If $2,252 fails, the next key demand zone sits between $2,067 and $2,085. That cluster holds 1,417,672 ETH at cost basis, nearly double the supply anchored at the $2,252 level.
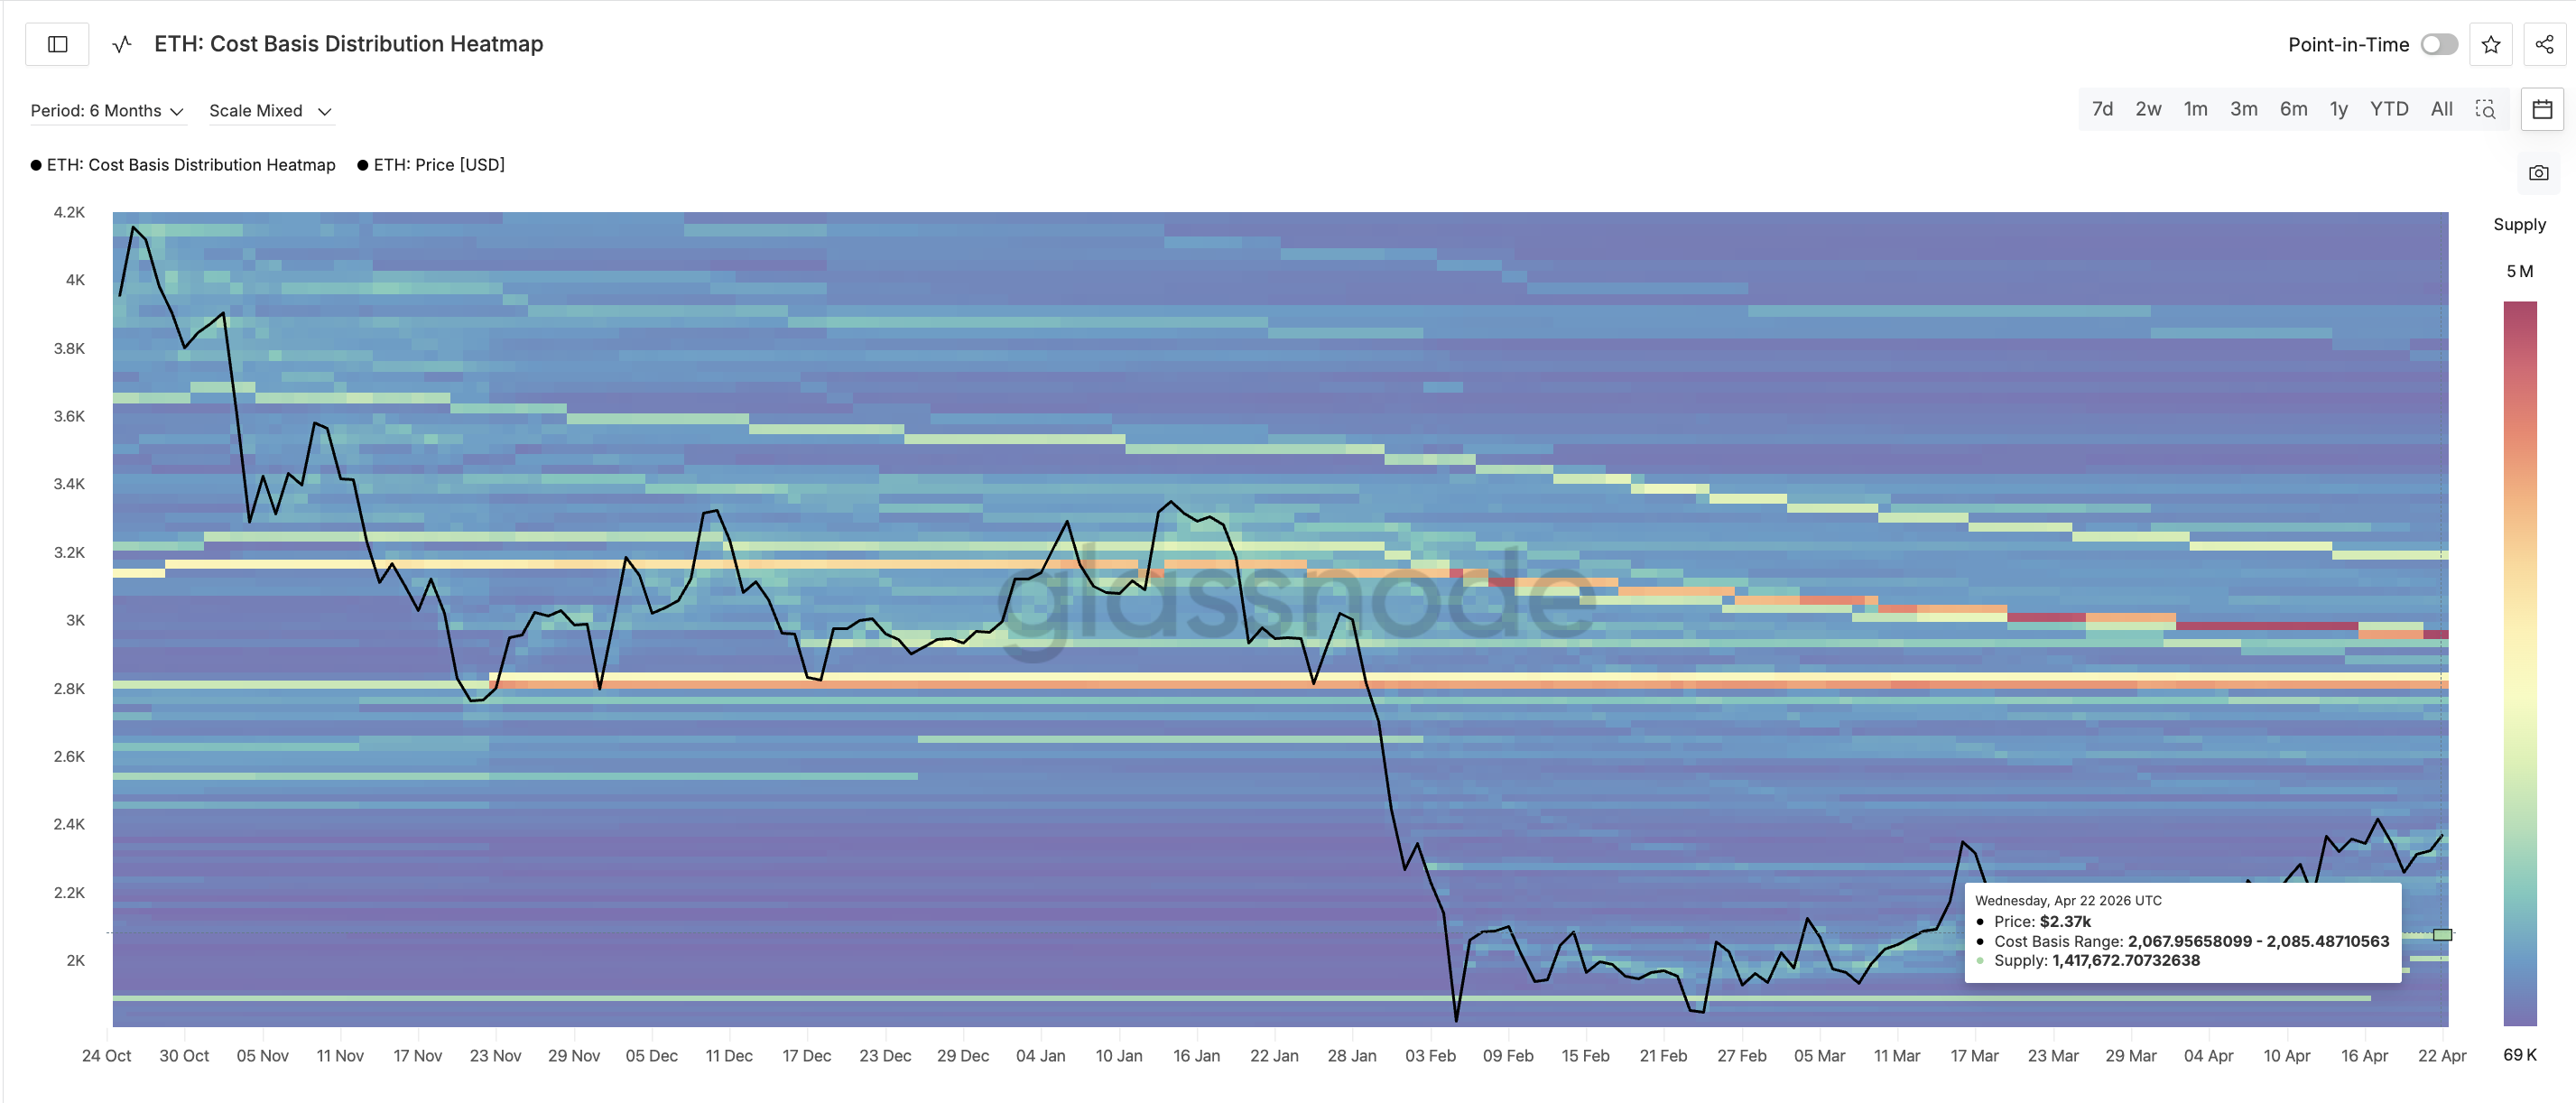
A break below that exposes lower levels on the ETH price chart, something around $1,935.
One nuance matters. The divergence is active, but whale flow has shifted since April 17. A correction may not play out as deeply this time. However, a sustained whale distribution would strip away the primary difference between last week’s setup and today’s.
A daily close above $2,455, the 0.382 Fib, opens a path toward $2,517. Extended targets sit at $2,580, $2,783, and $3,112.
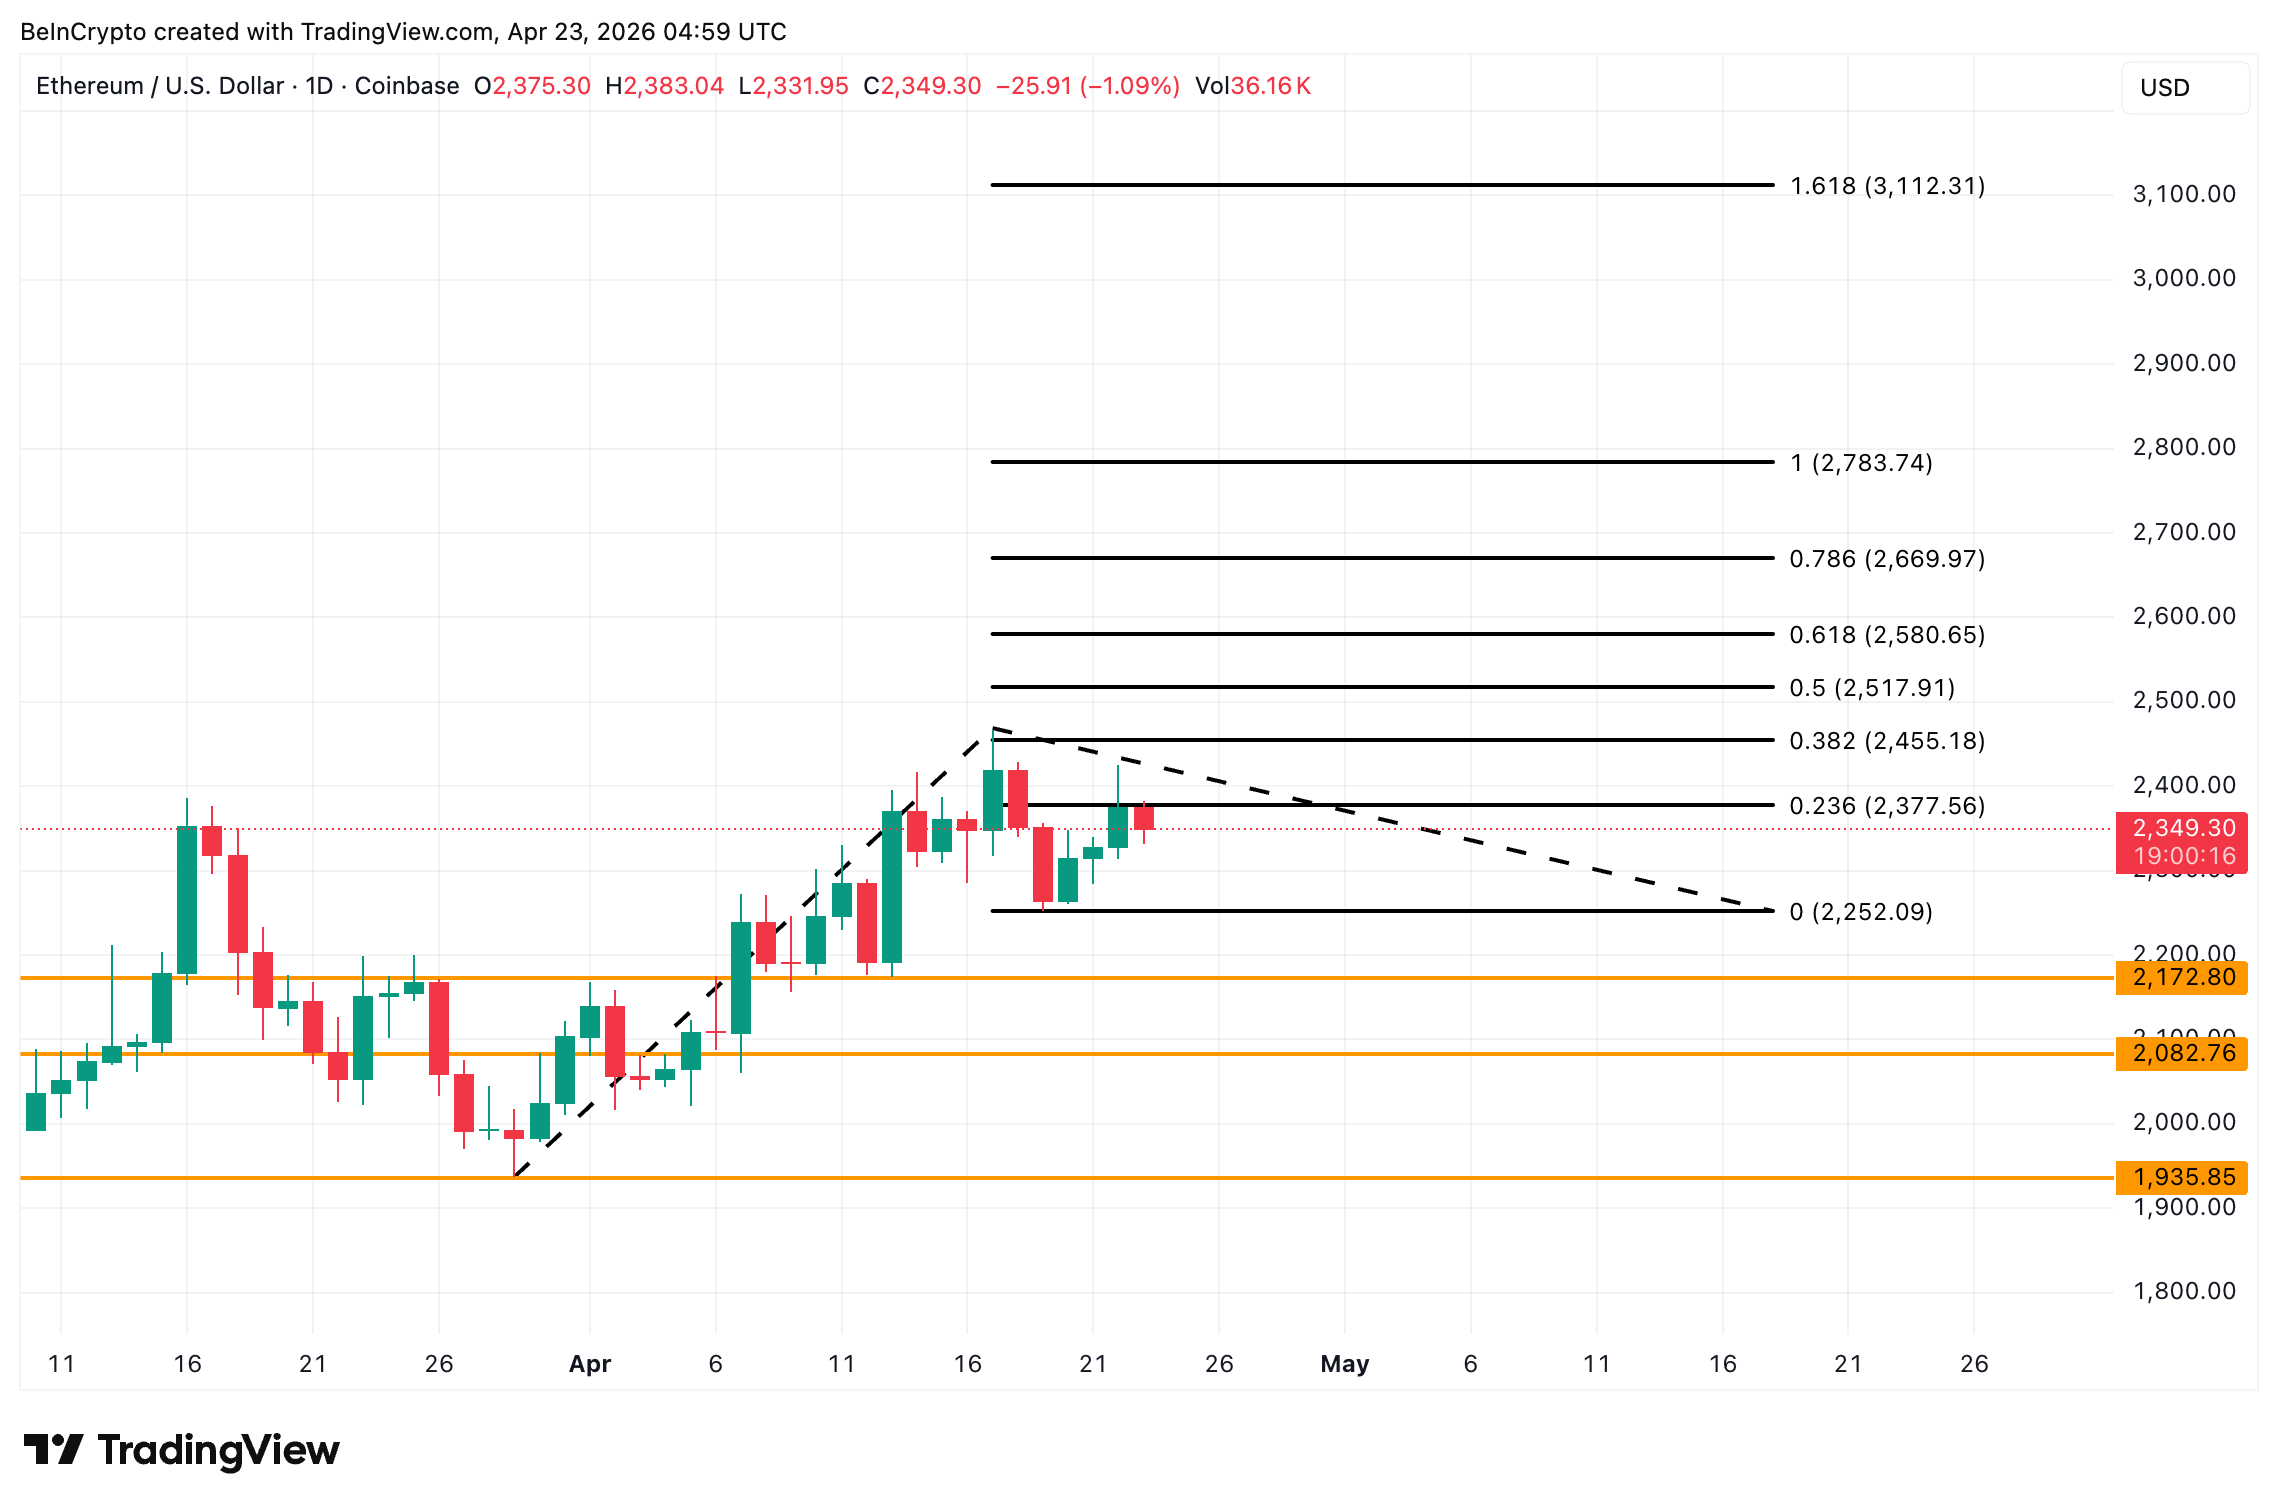
However, if $2,252 breaks, the chart has a key level at $2,082, which aligns with the biggest demand zone above $2,000. This means that the $2,252 level separates a shallow pullback from a deeper flush into the 1.4-million-ETH cost basis zone.
The post Ethereum Price Warning Fires Again After a 9% Drop Last Week appeared first on BeInCrypto.
Crypto World
Bankman-Fried’s FTX sold its Cursor stake for $200,000 in 2023. It would be worth $3 billion today


A 5% stake in AI coding startup Cursor that FTX’s bankruptcy estate sold for $200,000 in April 2023 would be worth about $3 billion today, following SpaceX’s agreement this week to acquire the company at a $60 billion valuation.
SpaceX said Monday it has the right to buy Cursor later this year for $60 billion or to pay $10 billion if the full acquisition does not proceed. The deal is founder Elon Musk’s move to close the gap with OpenAI and Anthropic on AI coding tools, an area where he recently said xAI, the Musk-run AI company that merged with SpaceX, is behind competitors.
SpaceX is holding off on immediate acquisition because of its planned initial public offering targeting a $2 trillion valuation, with the $10 billion serving as a breakup fee.
The crypto angle sits in the cap table. In April 2022, Alameda Research, the trading firm founded by Sam Bankman-Fried and run alongside FTX, invested $200,000 in Anysphere, the company that builds Cursor.
That investment bought roughly 5% of the company at a $4 million valuation. One year later FTX had collapsed, Alameda and FTX were in bankruptcy, and the court-appointed estate sold the Cursor stake for the same $200,000 Alameda had paid.
The stake is worth $3 billion at SpaceX’s $60 billion price tag, meaning the gap between what the FTX estate received and what the position would fetch today is roughly a 15,000x return. It was instead realized by whoever bought it from the bankruptcy rather than the creditors the estate was supposed to be maximizing recovery for.
The timing cuts awkwardly for FTX’s bankruptcy administration.
Bankman-Fried, currently serving a 25-year federal sentence, has spent the past year arguing from prison that FTX’s estate destroyed billions in value by liquidating assets too quickly during the bankruptcy, and that customers could have been made more than whole if the process had held positions instead of selling them into what turned out to be the bottom of crypto prices.
In February, he shared a projection suggesting FTX’s net asset value would have reached $78 billion if the estate had held assets through the subsequent recovery rather than selling in 2023 and 2024.
Cursor launched its AI coding product in early 2023, the same year the estate sold the stake, and the company’s trajectory from that launch to its current valuation three years later is among the steepest in software startup history.
FTX customers have since been made whole in dollar terms under the bankruptcy’s distribution plan, receiving back their claim values plus interest. What they did not receive is the upside from what those assets became between the bankruptcy filing and now, which in the case of the Cursor stake alone represents about $3 billion of forgone recovery against $200,000 realized.
Bankman-Fried’s parents have publicly advocated for a pardon, appearing on CNN in March arguing that FTX customers were ultimately repaid and that the case against their son should be revisited. The Cursor number is likely to feature prominently in the family’s continued campaign, and in Bankman-Fried’s own letters from prison, as the single clearest example of the kind of value he claims the estate destroyed through forced selling.
Ether futures on Binance have surged to a near two-month high as aggressive buyers stepped into the market over the past week. The 24-hour cumulative net taker volume climbed to about $5.5 billion, rising roughly 72% from about $3.2 billion earlier in the month, according to data tracked by CryptoQuant. The move aligns with a broader technical setup that keeps a critical liquidity zone in focus for ETH, with traders watching a potential breakout beyond the mid-$2,400s toward a $2,475–$2,634 corridor if buy-side pressure remains sustained and supply-side resistance eases.
CryptoQuant data show the 30-day average of net taker volume has remained positive since March 1, a pattern last seen in July 2022. That sustained buying cadence, alongside the growing futures activity, paints a picture of continued demand from participants rather than a fleeting bounce. Amr Taha, a market analyst cited in CryptoQuant’s quicktake, noted that spikes in buying near local highs often signal stronger conviction, suggesting buyers may be in control of the near-term price direction as momentum builds.
Key takeaways
- Binance ETH futures net taker volume hits about $5.5 billion in 24 hours, up 72% from earlier this month, indicating sustained buyer dominance.
- The 30-day net taker-volume average has been positive since March 1, reaching levels not seen since July 2022.
- ETH faces a key resistance around $2,400; a clean break could unlock the $2,475–$2,634 zone where a daily fair-value gap sits, created during February’s sell-off.
- The price is attempting to reclaim the 100-day EMA, a sign that the uptrend could gain traction; the 200-day EMA sits near the upper end of the imbalance zone around $2,634, aligning with liquidity considerations.
- Derivatives signals show futures cumulative volume delta (CVD) approaching $12.6 billion, with funding rates near neutral, suggesting leverage has not expanded aggressively alongside price.
Buy-side momentum and the path through the liquidity cloud
The immediate narrative around Ether’s price action is closely tied to the strength of daily demand captured in the futures market. The $5.5 billion 24-hour net taker volume on Binance represents a significant tilt toward buyers rather than sellers, reinforcing the sense that market participants are willing to chase higher prices rather than step back at the first sign of supply. This level of activity, when viewed against the 30-day positive readings, points to a broader conviction among traders that ETH can sustain upside momentum beyond the current consolidation range.
From a market structure standpoint, the $2,400 barrier has proved a stubborn but not unbreakable ceiling. The price has tested this level three times since early February, with each rejection thinning the density of overhead sell orders. A decisive move above $2,400 would shift attention to the next liquidity-rich zone between roughly $2,475 and $2,634. That corridor hosts a daily fair-value gap left behind by a February sell-off, an area where price can snap back quickly if bid-side liquidity improves and sell orders are absorbed efficiently.
Technical watchers are keeping an eye on trend-following indicators as well. Ether’s attempt to reclaim the 100-day exponential moving average (EMA) is viewed as a potential sign of trend continuation, provided the rally can sustain above this benchmark. Conversely, the 200-day EMA sits near the upper boundary of the current imbalance zone, implying that any sustained move into the higher end of the range would converge with overs supply and liquidity considerations. The interplay between EMA dynamics and the liquidity gap helps explain why even a modest breakout could accelerate through the $2,400 hurdle if buyers remain persistent.
Derivatives signals: cautious optimism amid balanced leverage
Beyond spot and futures price activity, the derivatives landscape paints a nuanced picture of risk and reward. The futures cumulative volume delta (CVD) has been climbing toward $12.6 billion, signaling ongoing buying pressure in the disciplined posture of the market. Yet funding rates have remained near neutral, suggesting that while demand exists, leverage has not surged in lockstep with price gains. In practical terms, this balance means the near-term upside might hinge on continued bid activity rather than an aggressive expansion of borrowed exposure.
Taken together, the data imply a near-term liquidity cluster around the $2,475–$2,634 zone remains the critical hurdle for ETH. Clearing this band would not only reflect a shift in market sentiment but also provide a clearer pathway for a more durable rally, as new orders fill on the back of rising conviction and improved liquidity depth. For traders, the key question is whether current buyers can sustain enough pressure to overwhelm fresh supply that tends to cluster near resistance zones, especially given the neutral stand of funding costs.
Overall, the current setup suggests a moment of thoughtful optimism rather than exuberant hype. The confluence of rising taker-volume, persistent positive net inflows in the 30-day window, and a technical chart that hints at a liquidity-driven breakout offers a plausible path for ETH in the near term. Investors will want to monitor whether the $2,400 barrier is decisively crossed and whether the liquidity gap in the $2,475–$2,634 range can be absorbed with limited downside risk.
Readers should watch how the price actions unfold around the key resistance zone and the related liquidity clusters in the coming sessions, as a sustained move beyond $2,400 would set the stage for a more pronounced leg higher—provided market participants sustain the current level of demand without a sharp pullback in leverage or a shift in macro risk sentiment.

TLDR:
- Pornhub replaced USDT with USDC for creator payouts, citing better reliability and MiCA regulatory compliance.
- The switch ends Pornhub’s infrastructure partnership with Justin Sun’s TronLink wallet established back in 2020.
- Drift Protocol took the opposite route, moving from USDC to USDT following a $127.5M Tether-backed bailout.
- USDC’s MiCA-compliant status is driving adoption on platforms operating within regulated financial environments.
USDC has officially replaced USDT as the preferred stablecoin for creator payouts on Pornhub. The world’s largest adult website confirmed the change through an email sent to its content creators.
The switch follows years of relying on Tether after PayPal exited the platform in 2020. Pornhub cited payment reliability and regulatory compliance as its primary reasons for adopting Circle’s stablecoin.
The move also ends the platform’s infrastructure partnership with Justin Sun’s TronLink wallet.
Pornhub Cites MiCA Compliance in the USDC Transition
The email sent to creators described USDC as a “fully-backed, MiCA-compliant and regulated stablecoin.” Pornhub added that it provides “a more secure option for your earnings” compared to USDT.
The platform also stated that USDC “is pegged 1:1 to the US dollar.” It further noted that it “works just like USDT on the ERC-20 network.”
OnlyFans content creator Gracie Hartie shared a screenshot of the email on social media. A Japanese trader also confirmed receiving the same communication from Pornhub.
The email specifically stated the change was aimed at making payouts “more reliable” for creators. The broad circulation of the message confirmed the policy shift applied across multiple regions.
Pornhub’s model program page no longer lists USDT as an available payout method. In its place, the page now shows USDC alongside Paxum, Verge, and Cosmo.
The removal of USDT from the payout list marks a complete and deliberate transition. Creators are expected to update their wallet information to reflect the change.
Pornhub adopted USDT back in 2020 after PayPal severed ties with the platform. The company stated at the time, “Since PayPal’s decision to stop payouts to thousands of Models two months ago, we’ve been hustling to…offer you more options.”
That USDT infrastructure was supported through a partnership with Justin Sun’s TronLink wallet. That partnership no longer appears anywhere on Pornhub’s model program page.
USDT and USDC Continue to Compete Across Different Platforms
While Pornhub moved to USDC, a separate development saw USDT gaining ground in another ecosystem. Earlier this month, Tether stepped in to support the hacked Drift Protocol with a $127.5 million bailout.
The Solana-based platform had been drained of approximately $285 million by attackers. North Korean-linked hackers were suspected of compromising a multisig wallet to execute the breach.
As part of the bailout deal, Drift Protocol agreed to transition its settlement asset from USDC to USDT. This effectively reversed the stablecoin preference within that ecosystem.
The back-and-forth between the two stablecoins reflects an ongoing rivalry in the crypto market. Each major platform event appears to shift institutional preference in a new direction.
These moves by both Pornhub and Drift show how stablecoin adoption continues to shift across platforms. USDC’s standing under MiCA gives it an advantage in compliance-focused environments.
USDT, however, retains dominance in markets where liquidity and speed take priority. The broader competition between the two stablecoins remains very much active.
Fiskars stock jumps after first-quarter profit beats views

Crypto Sentiment Index Hits 3-Month High as Bitcoin Maintains $77K
The Future of This Gritty 7-Part British Detective Series Has Been Decided
Manchester United reach agreement with Casemiro over contract clause amid transfer speculation

Steven Gerrard disagrees with Gary Neville over ‘shock’ Chelsea and Arsenal claim | Football

US brings back mandatory military draft registration

EXCLUSIVE|Maal Gashiga Lacagaha Cryptocurrency |Qaabkeen U Bilaabi Kara?How To Invest Cryptocurrency

Financer – Bintu Pabra | Pranjal Dahiya | Shiva Choudhary | Gunde Bhi Financer Bhi

BLACKROCK IS ABOUT TO UNLEASH A TSUNAMI ON XRP!!! ($14 Trillion On-Chain)
-

 Sports6 days ago
NWFL Suspends Two Players Over Post-Match Clash in Ado-Ekiti
-

 Fashion6 days ago
Weekend Open Thread: Theodora Dress
-

 Politics5 days ago
Palestine barred from entering Canada for FIFA Congress
-
Entertainment3 days ago
NBA Analyst Charles Barkley Chimes in on Ice Spice McDonald’s Fiasco
-

 Business4 days ago
Powerball Result April 18, 2026: No Jackpot Winner in Powerball Draw: $75 Million Rolls Over
-

 Tech4 days ago
Auto Enthusiast Scores Running Tesla Model 3 for Two Grand and Turns It Into Bare-Bones Go-Kart
-

 Politics4 days ago
Zack Polanski demands ‘council homes not luxury flats for foreign investors’
-

 Crypto World5 days ago
Russia Pushes Bill to Criminalize Unregistered Crypto Services
-

 Politics2 days ago
Gary Stevenson delivers timely reminder to register to vote as deadline TODAY
-

 Politics14 hours ago
Disabled people challenge government SEND proposals over segregation concerns
-

 Politics14 hours ago
Making troops accountable for war crimes threatens US alliance, ex-SAS colonel warns
-

 Business22 hours ago
Rolls-Royce Voted UK’s Most Iconic Trade Mark as IPO Register Hits 150
-
 Business6 days ago
Creo Medical agree sale of its manufacturing operation
-

 Crypto World5 days ago
Russia Introduces Bill To Criminalize Unregistered Crypto Services
-

 Politics15 hours ago
Starmer handler McSweeney to be dragged from shadows by Foreign Affairs Committee
-

 Politics15 hours ago
Zack Polanski responds to home secretary’s taser threat
-
Politics15 hours ago
Wings Over Scotland | How To Get Away With Crimes
-
Crypto World4 days ago
Kelp DAO rsETH Bridge Hack Drains $292M as DeFi Losses Top $600M in Two Weeks
-

 Politics12 hours ago
‘Iran is still a nuclear threat’
-

 Business7 days ago
Cheaper Doritos and Lays helps PepsiCo win back struggling snackers
You must be logged in to post a comment Login