
Crypto World
Candlestick Reversal Patterns in Forex Trading
Candlestick reversal patterns are formations that signal a potential shift in price direction as an existing trend begins to lose momentum. They typically appear at the end of trends, where buying or selling pressure starts to weaken, offering traders an early indication of a possible turning point.
There are many ways to spot a trend reversal, including momentum indicators, trend-following tools, and chart and candlestick patterns. Candle patterns, in particular, have been widely used by traders for decades due to their clear structure and well-defined signals, which have been tested and applied across various financial markets.
Depending on the data source, the total number of candlestick patterns ranges from 30 to more than 100, when niche formations are included. Since it may be challenging to remember and recognise all of them, we have selected 10 of the most popular reversal candlestick patterns that traders with any level of experience can implement in their trading strategies.
Definition and Market Function
Candlestick reversal patterns are formations on a price chart that signal a potential trend change after an extended move. Each candle captures the open, high, low, and close for a set period. The shape of the formation reflects the balance between buyers and sellers at that moment.
Reversal differs from retracement. A reversal points to a change in the dominant trend. A retracement is a counter-move within a trend that quickly resumes. Context matters. A pattern carries weight when it forms at a tested support or resistance level and aligns with recent market structure. In the middle of a range, the same shape means little.
This article covers 10 reversal candlestick patterns:
Market Interpretation of Reversals
Market structure shifts when sustained move exhausts and the opposing side quietly builds conviction. The turn often shows in price action before lagging indicators like moving averages or oscillators react.
Three forces cluster around a change in market structure:
- Liquidity pools build near trend extremes, where stop orders sit above swing highs or below swing lows.
- Positioning becomes one-sided, exposing the weaker side to a squeeze.
- Volatility often expands at the turn, producing wide-range candles with long wicks.
Reading the signal requires trend context and level alignment, not shape alone.
Classification of Reversal Patterns
Candlestick reversal patterns in forex fall into three groups by candle count. Single-candle patterns form in one candle. The hammer, hanging man, inverted hammer, and shooting star belong here. Their signal rests on wick-to-body ratio and trend position.
Double-candle patterns involve two consecutive candles. Bullish engulfing, bearish engulfing, piercing line, and dark cloud cover sit in this group. The second candle is opposite and usually overwhelms the first.
Triple-candle patterns need three candles to complete. Three white soldiers and three black crows form this category. They develop slowly but show directional pressure.
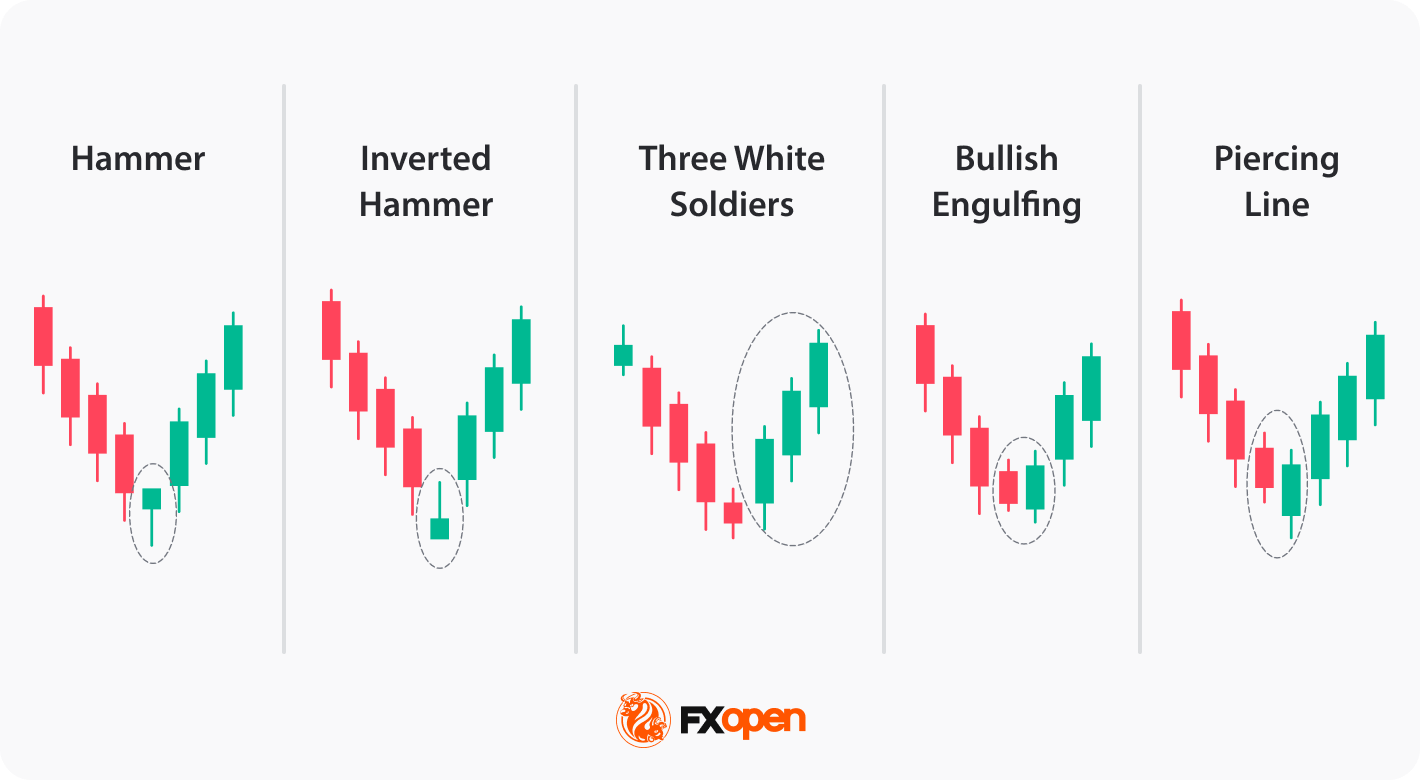
Bullish Reversal Patterns
Bullish reversal patterns form at the end of downtrends. Selling momentum fades as buyers regain control.

Hammer
The hammer candlestick pattern has a small body, a lower wick at least twice the body length, and little to no upper wick. It appears at the end of a downtrend after sustained selling pressure. A close above the hammer’s high on the following candle supports the signal.
Inverted Hammer
The inverted hammer has a small body, an upper wick at least twice the body length, and little to no lower wick. It forms after a prolonged downtrend, often near a tested support zone. Traders often look for the next session to close above the candle’s body before acting.
Three White Soldiers
The three white soldiers pattern consists of three consecutive bullish candles, each opening within the prior body and closing at a new high with short upper wicks. It develops after a downtrend, typically following a stall near the low. The third candle closing above a recent resistance level adds weight to the pattern.
Bullish Engulfing
The bullish engulfing forms when a bullish candle’s body fully covers the prior bearish candle’s body. It appears at the end of a downtrend, with the bearish candle often marking the final push lower. Confirmation is found when a close is seen above the engulfing pattern, meaning the reversal likely has more weight.
Piercing Line
The piercing line pairs a long bearish candle with a bullish candle that opens below the prior low and closes above the bearish body’s midpoint. It forms at the end of a downtrend, often at a tested support zone. Another bullish candle forming after the pattern reinforces the signal.
Bearish Reversal Patterns
These bearish reversal patterns form at the end of uptrends. Buying momentum fades as sellers regain control.
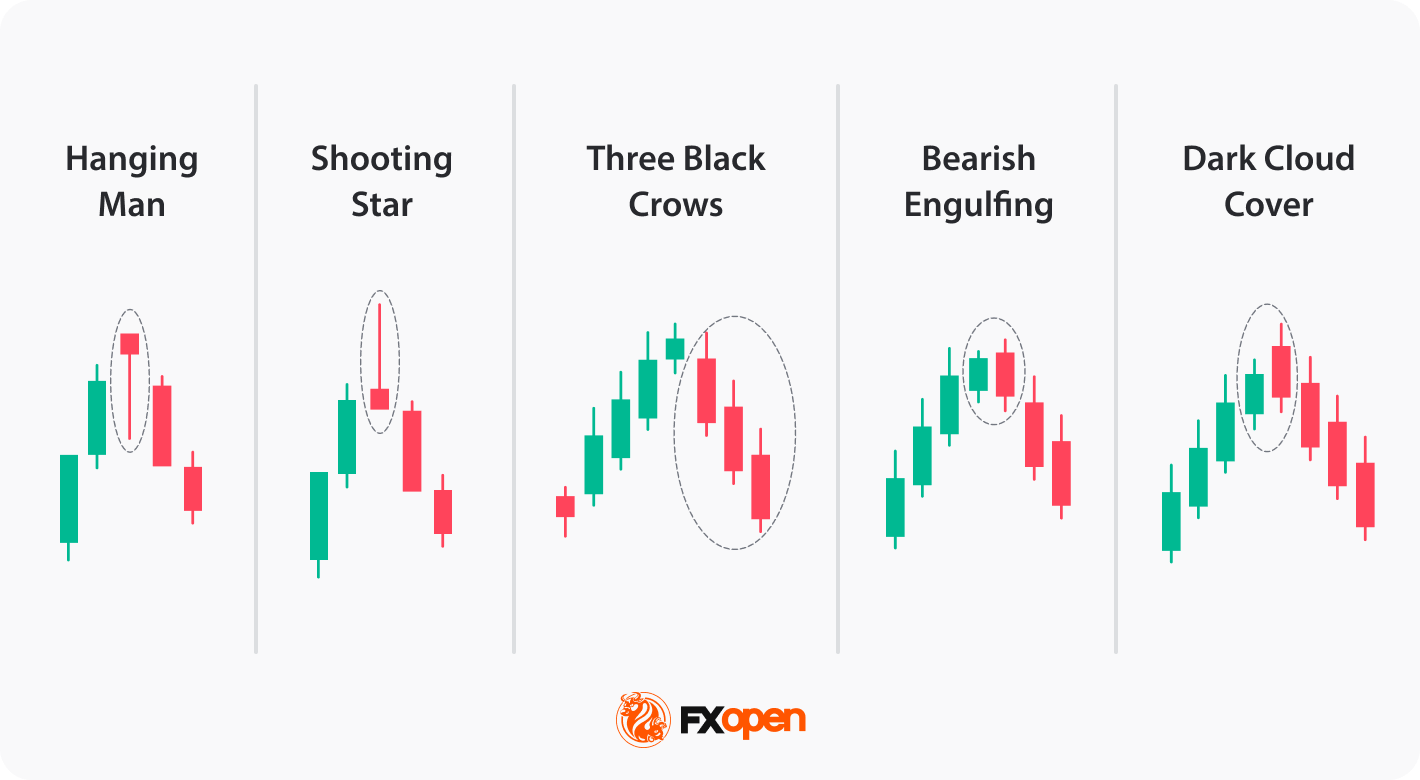
Hanging Man
The hanging man has a small body, a lower wick at least twice the body length, and little to no upper wick. This candlestick pattern structure appears at the end of an uptrend after sustained buying pressure. A close below the hanging man’s low on the following candle supports the signal.
Shooting Star
The shooting star has a small body, an upper wick at least twice the body length, and little to no lower wick. It forms after a prolonged uptrend, often near a tested resistance zone. Traders often look for the next candle to close below the candle’s body before acting.
Three Black Crows
The three black crows formation consists of three consecutive bearish candles, each opening within the prior body and closing at a new low with short lower wicks. It develops after an uptrend, typically following a stall near the high. The third candle closing below a recent support level adds weight to the pattern.
Bearish Engulfing
The bearish engulfing forms when a bearish candle’s body fully covers the prior bullish candle’s body. It appears at the end of an uptrend, with the bullish candle often marking the final push higher. A close below the engulfing candle’s low session supports the reversal.
Dark Cloud Cover
The dark cloud cover setup pairs a long bullish candle with a bearish candle that opens above the prior high and closes below the bullish body’s midpoint. It forms at the end of an uptrend, often at a tested resistance zone. Another bearish candle forming after the pattern reinforces the signal.
How Traders Identify Reversal Candles
Identifying a candlestick reversal pattern involves four observable checks. Each one either confirms or filters the signal before it carries weight.
- Trend presence: the pattern forms at the end of a clear uptrend or downtrend. Shapes that appear inside a range or consolidation carry little meaning.
- Key level alignment: the pattern aligns with a tested support or resistance zone, a prior swing point, or a known supply or demand area.
- Candle structure: wick-to-body ratios, close position, and body size match the pattern’s definition. Loose approximations dilute the signal.
- Confirmation: the next candle closes in the reversal direction, or a second pattern, indicator reading, or price-action event aligns with the signal before action.
Skipping any of the four reduces the pattern to a shape on the chart rather than a usable signal. Platforms such as TickTrader let traders explore, identify, and trade these patterns across multiple instruments.
Application in Trading Context
Candlestick reversal patterns sit inside a wider decision process rather than drive trades on their own. Position sizing, stop placement, and volatility conditions shape how traders interpret and act on any signal.
Risk context matters at the trade level. A pattern at a major resistance zone in a quiet market carries different weight than the same pattern ahead of an important economic release. Traders often scale position size based on volatility, recent range, or proximity to liquidity levels. Broader risk management frameworks often define stop placement based on the pattern’s structure rather than arbitrary price offsets.
Volatility expansion around reversal patterns cuts both ways. Wider price ranges can make candlestick patterns more visually distinct, but they also increase the likelihood of false breakouts and unreliable signals. False signals appear more often around news releases, low-liquidity hours, and transitions between major trading windows.
Limitations and Market Risks
Candlestick reversal patterns in technical analysis have consistent limitations worth naming directly.
- Low-liquidity conditions distort pattern formation. Thin order books produce wider spreads, longer wicks, and candles that look like patterns but lack the participation to drive a reversal. Exotic currency pairs during off-peak hours often show this behaviour.
- News releases override technical structure. A hammer printed seconds before a non-farm payrolls release may face volatility that ignores the pattern entirely. Scheduled events and surprise headlines both reset short-term price structure.
- Timeframe dependency shapes signal weight. The same pattern on a 1-hour chart often carries less weight than on a daily or weekly chart, where each candle represents more participation and more information.
Takeaway
Bullish vs bearish candlestick patterns are tools for identifying shifts in market direction across forex, stocks, indices, and commodities. They carry weight when structure, trend context, and key levels align.
In practice, traders treat them as early signals and rely on confirmation before acting. Combined with sound risk management, they may help refine timing.
Traders who want to test candlestick patterns and develop their own strategies can consider opening an FXOpen account today and access over 700 instruments with tight spreads and low commissions (additional fees may apply). Good luck!
FAQ
What Are Candlestick Reversal Patterns?
Candlestick reversal patterns are single candles or short sequences that form at the end of a trend and mark a potential change in market direction. They reflect a shift in the balance between buyers and sellers, visible through the candle’s open, close, high, and low. Common examples include the hammer, shooting star, engulfing patterns, and three black crows. Their weight depends on where they form, not just their shape.
Which Candlestick Patterns Signal a Reversal?
Ten patterns commonly appear in reversal analysis: hammer, hanging man, inverted hammer, shooting star, three white soldiers, three black crows, bullish engulfing, bearish engulfing, piercing line, and dark cloud cover. Each pattern carries weight only when it appears at a tested level in a clear trend.
What Is the Difference Between Bullish and Bearish Reversal Patterns?
Bullish reversal patterns form at the end of a downtrend and point to a potential move higher. Hammer, inverted hammer, bullish engulfing, three white soldiers, and piercing line sit in this group. Bearish reversal patterns form at the end of an uptrend and point to a potential move lower. Hanging man, shooting star, bearish engulfing, three black crows, and dark cloud cover belong here. Shapes often mirror across the pair.
Do Candlestick Reversal Patterns Require Confirmation?
Confirmation matters when trading candlestick patterns. A pattern on its own shows a shift in the last candle or two, but not whether the broader trend has turned. Traders often wait for the next candle to close in the reversal direction, or for a second signal from price action, a technical indicator, or a break of a key level. Patterns that form without confirmation produce more false signals, especially in low-liquidity or high-news conditions.
Are Reversal Patterns Popular in Forex Trading?
In forex, reversal signals are widely used, and for reasons tied to the market’s structure. Forex runs 24 hours on weekdays across overlapping sessions, producing clear trending and reversal behaviour around liquidity transitions. The patterns work across major, minor, and exotic pairs, and across all timeframes from intraday to weekly. Traders often combine them with support and resistance zones, moving averages, or momentum readings to filter signals.
This article represents the opinion of the Companies operating under the FXOpen brand only. It is not to be construed as an offer, solicitation, or recommendation with respect to products and services provided by the Companies operating under the FXOpen brand, nor is it to be considered financial advice.


The stablecoin issuer cited “activity tied to unlawful conduct” but no further explanation for the freezing of the dollar-pegged tokens held in two wallet addresses.


Defiance ETFs has filed a preliminary prospectus with the SEC for the Defiance US AI Resilience ETF. The passively managed fund is designed to hold companies least likely to be disrupted by artificial intelligence (AI).
The filing, submitted on Thursday, marks Defiance’s latest thematic bet. Rather than chasing AI upside, this fund takes the opposite approach by targeting old-economy businesses that AI is unlikely to replace.
What the AI Resilience ETF Holds
The ETF will track the VettaFi US AI Resilience Index. The index selects roughly 50 US large-cap companies from VettaFi’s broader equity universe. It focuses on what the industry has labeled “HALO” firms, short for Heavy Asset, Low Obsolescence.
These are businesses with inelastic demand, long-life physical infrastructure, and revenue profiles insulated from labor automation.
The index emphasizes Consumer Staples, Energy, Healthcare, Industrials, Materials, and Utilities. Holdings are weighted by float-adjusted market cap, capped at 3% per name, and rebalanced quarterly.
Under normal conditions, the fund will invest at least 80% of net assets in companies that meet these AI-resilience criteria. It may use either full replication or representative sampling to track the index.
The HALO Thesis Behind the Fund
The ETF arrives as Wall Street’s appetite for HALO stocks continues to grow. Goldman Sachs introduced the framework in early 2026.
The firm found that capital-intensive companies relying on physical assets have outperformed capital-light, digital-first peers by about 35% since the start of 2025.
The reasoning is straightforward. Transmission grids, pipelines, industrial capacity, and transport infrastructure are costly to replicate and sit outside the reach of generative AI.
Software companies, by contrast, face growing displacement risk as AI systems automate more of their functions.
Defiance, which manages over $8 billion in assets, already operates thematic funds covering quantum computing, AI power infrastructure, and drone automation.
Its Quantum Computing ETF (QTUM) recently passed $4 billion in AUM with a 5-star Morningstar rating. The AI Resilience ETF extends that lineup into contrarian territory.
Key Details and What Comes Next
The prospectus is still preliminary. The ticker has not been assigned, and management fees are listed as placeholders. The fund will trade on Nasdaq once the filing becomes effective, which typically takes about 75 days.
Principal risks highlighted in the filing include interest-rate sensitivity for capital-intensive holdings and sector concentration in staples and industrials.
Penserra Capital Management will handle day-to-day portfolio management through a sub-advisory arrangement.
The actual portfolio managers are Dustin Lewellyn, Ernesto Tong, and Christine Johanson, all from Penserra.
The filing is available on SEC EDGAR under ETF Series Solutions. With AI hype dominating markets in 2026, Defiance is betting that investors will also pay for protection against the other side of that trade.
The post New Filing Pushes AI Resilience ETF Targeting Heavy-Asset US Stocks appeared first on BeInCrypto.

FIGR stock retreated after a brief rally as shifting sentiment hits crypto-linked equities, even as analysts point to strong growth in the fintech’s blockchain-based lending.
Crypto World
More than 90% of Web3 games failed after $15 billion boom as gamers never showed up: Caladan
Web3 gaming burned through up to $15 billion chasing a token-driven future that gamers never bought into.
Data from Caladan, a market-making and trading firm, shows roughly 93% of so-called GameFi projects are now effectively dead, with token values down about 95% from their 2022 peaks and funding to studios collapsing 93% by 2025.
Investors and studios poured billions into tokens and non-fungible tokens (NFTs) before building blockchain-based games containing tradable properties. Then capital shifted into AI, asset tokenization and infrastructure, and more than 300 games shut down, turning Web3 gaming into a cautionary tale about chasing speculation over product-market fit.
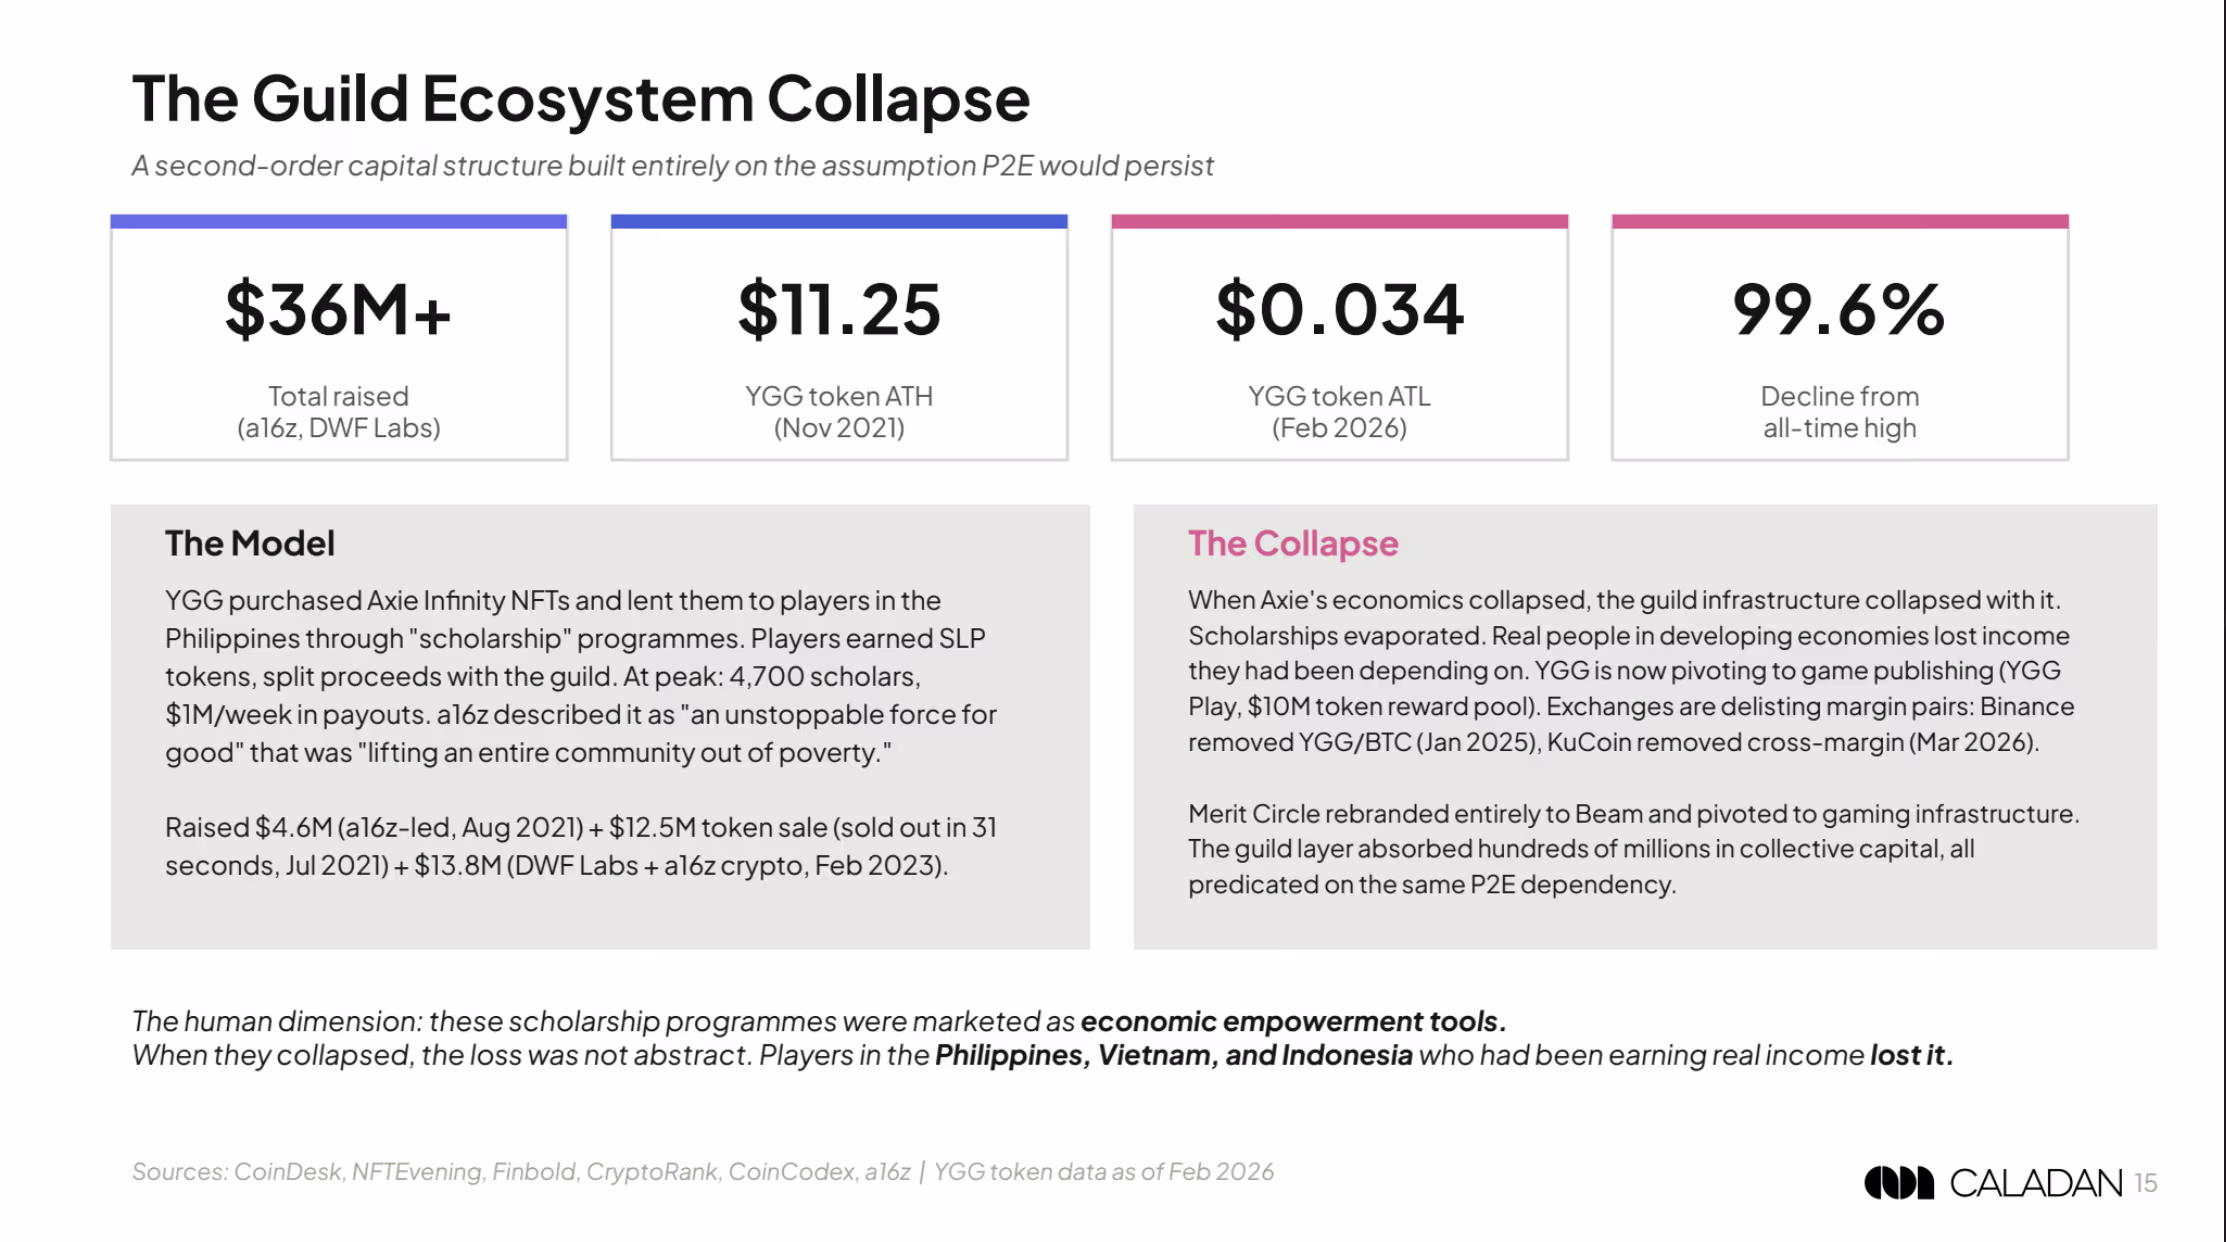
“Capital was destroyed at every layer simultaneously,” the report states, pointing to venture capital, retail NFT buyers, gaming guilds and Telegram’s 300-million-user tap-to-earn wave as parallel casualties. Hamster Kombat alone lost 96% of its users within six months of launch. YGG, the flagship gaming-guild token, trades 99.6% below its November 2021 peak.

Individual post-mortems are brutal. Pixelmon raised $70 million in a 2022 NFT mint and, four years on, still has no public game. Ember Sword burned through $18 million over seven years of development before shutting down last May with no refunds. Gala Games is embroiled in a lawsuit alleging its co-founder diverted $130 million in tokens. Square Enix quietly wound down its Symbiogenesis experiment last July.
Structural mismatch
The failure wasn’t just a bad cycle or weak execution. The data indicate it was a structural mismatch between a model built around financial incentives and an audience that consistently signaled it wanted entertainment instead.
At the heart of the boom was GameFi, the play-to-earn model that turned gameplay into a financial feedback loop.
Players bought tokens or NFTs, earned rewards in those same assets, and cashed in as long as newcomers kept piling in. Once the inflows slowed, the math broke down. Token prices slumped, rewards thinned out, and users walked away — dragging entire in-game economies down with them.
Axie Infinity, the sector’s one-time flagship, watched daily active users crater from roughly 2.7 million at the peak to around 5,500 today, according to DappRadar data.
The demand side never caught up with the flood of capital. Even at the height of the mania, just 12% of gamers had tried a crypto game, according to a Coda Labs survey, cited by Caladan.
Capital allocation made the problem worse. Studios raised tens or hundreds of millions of dollars before shipping viable products, removing the pressure to build games that could retain players.

The most telling data point may be where the money went instead. Gaming commanded 62.5% of all Web3 venture investment in 2022; by 2025, its share had collapsed to single digits as AI, real-world-asset tokenization and layer-2 infrastructure absorbed the displaced capital.

Even Animoca Brands, the sector’s most prolific backer, has cut gaming to roughly 25% of its portfolio and is pivoting to stablecoins, RWAs and AI.
At the same time, development timelines stretched three to five years, while tokens traded in real time and demanded constant momentum. By the time many projects were ready to launch, their associated tokens had already collapsed.
The result is a sector that expanded rapidly on speculative demand and contracted just as quickly when that demand faded. More than 300 blockchain games have shut down, according to DappRadar, and remaining investment has shifted away from titles toward infrastructure.
What was once pitched as the future of gaming now looks more like a cautionary example of what happens when financial engineering runs ahead of product market fit.

More than 120 entities affiliated with the cryptocurrency and blockchain industry are urging US lawmakers to stop stalling on the advancement of a digital asset market structure bill.
In a Thursday letter to leaders in the US Senate Banking Committee, the Crypto Council for Innovation (CCI) and Blockchain Association said that the body should “proceed towards a markup of the CLARITY Act to provide a comprehensive federal market structure framework for digital assets.”
The legislation, expected to be one of the most significant laws to potentially impact the industry crypto, passed the House of Representatives in July 2025 but has been delayed due in part to government shutdowns and debates over stablecoin yield and other issues.
“Timely action is critical, as other major jurisdictions have already implemented comprehensive frameworks, and the absence of comparable US policy risks ceding both economic and strategic advantages,” said the letter. “The US needs a comprehensive market structure framework to support domestic digital asset innovation, or risk migration of investment, jobs, and technological development offshore.”
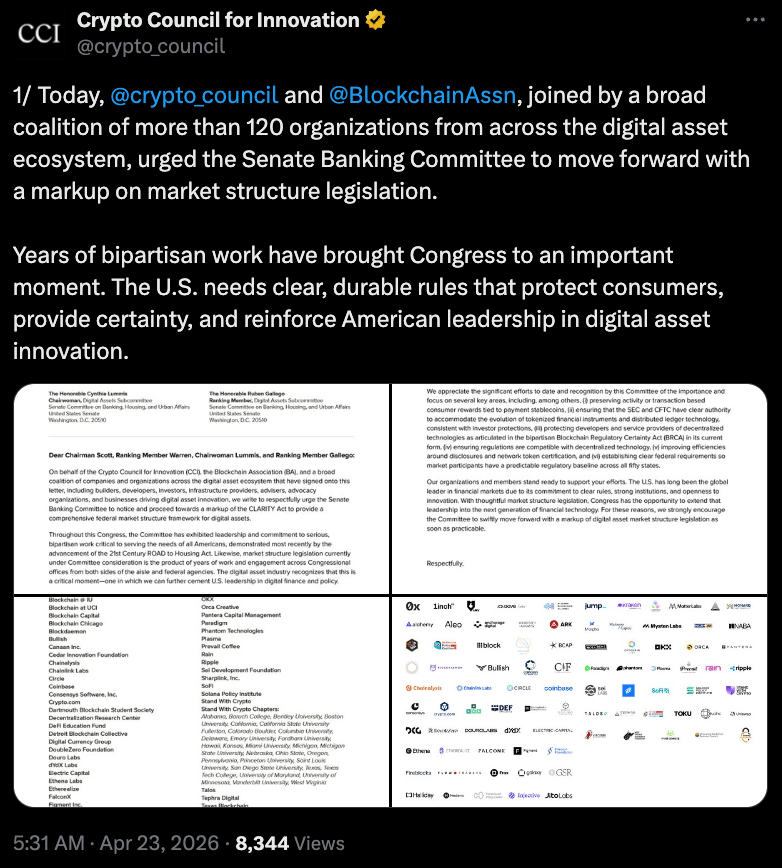
Source: CCI
The Senate Banking Committee, under chair Tim Scott, postponed a markup on the CLARITY Act in January hours after Coinbase CEO Brian Armstrong said that the company could not support the bill as written. Since that time, representatives from the banking and crypto industries have met with lawmakers to discuss issues within the bill — e.g. how to address stablecoin yield — and possible paths forward.
As of Thursday, the banking committee had not publicly announced a new date for the bill’s markup. However, US Senator Thom Tillis on Monday called for committee leaders to consider postponing any markup until May to give crypto and banking representatives more time to discuss a compromise on stablecoin yield.
Related: Four reasons why the crypto market is rallying today: Will bulls maintain control?
About 120 crypto companies and organizations signed onto the letter, including exchanges like Coinbase and Kraken, but also groups like the Texas Blockchain Council and Solana Policy Institute. It came just three days after the advocacy organization The Digital Chamber asked the banking committee to schedule a markup “as soon as the calendar allows”:
“We are now more than halfway through the 119th Congress, and it has been more than 270 days since the House passed the CLARITY Act with strong bipartisan support and we recognize the legislative window for this Congress is narrowing.”
Banking association asks for more, not less, time to address stablecoins
On Tuesday, the American Bankers Association asked four US government agencies responsible for GENIUS regulations for 60 additional days to comment after the Office of the Comptroller of the Currency finalized its rules. The request, if granted, would likely delay full implementation of the stablecoin bill.
Magazine: AI-driven hacks threaten to kill DeFi — unless projects act now
Crypto World
Bitcoin Price Hits 11-Week High After Strategy Buys $2.54 Billion in BTC. What Comes Next?
The Bitcoin price climbed to $77,727 on April 23 after Strategy purchased 34,164 BTC for $2.54 billion, the company’s third-largest weekly buy on record. CoinDesk reported total holdings now sit at 815,061 BTC, and spot Bitcoin ETFs posted five straight days of inflows through April 22 with a single-day peak of $238 million. Total ETF assets under management crossed $96.5 billion as the market turned risk-on after the US-Iran ceasefire extension.
But a full recovery to $126,021, the all-time high from October 2025, returns 61% from current levels. Ethereum (ETH) at $2,340 targets roughly 3x at best. The same capital in Pepeto at $0.0000001866 before the confirmed Binance listing targets 267x, the kind of return that presales with working infrastructure deliver before the first trading candle opens.
Strategy Adds 34,164 Bitcoin as Spot ETFs Post Five Straight Positive Days
Strategy disclosed the purchase on April 20 at an average cost of $74,395 per coin per CoinDesk. That buy lifted the company above BlackRock’s spot ETF, which holds roughly 800,000 Bitcoin on behalf of clients. Spot Bitcoin ETFs recorded five consecutive positive sessions through April 22, with the strongest day pulling $238 million.
President Trump extended the US-Iran ceasefire on April 21, removing the key risk weighing on markets for weeks. The Bitcoin price touched $79,388, an 11-week high, before settling at $77.727 The token trades above the short-term holder realized price of $69,400, a level that historically supports further gains.
Bitcoin Price Compared: Bitcoin, Ethereum, and the Presale Opportunity Pepeto
The Pepe Cofounder Ships a Working Exchange as Pepeto Crosses $9.45 Million
The original Pepe Coin launched at roughly the same cost Pepeto sits at today. Wallets that entered Pepe at $0.0000001 and held through the listing turned small positions into six-figure returns as the token reached $11 billion on community strength alone. That entry window stayed open for days and nearly everyone who saw it chose to wait.
Pepeto brings that window back with stronger foundations. The same builder who guided Pepe now runs an exchange handling trades on Ethereum, BNB Chain, and Solana with zero fees. An AI tool scans every contract for hidden permissions and exit traps before capital enters, and a bridge connects all three networks at zero gas cost. SolidProof reviewed the full codebase before the presale opened.
Over $9.45 million entered during a period where fear controlled the market. Staking runs at 178% APY, compounding daily at $0.0000001866. A former Binance listing specialist leads the technical path, and the CoinMarketCap page is live, which lines up directly with listing confirmation. The Bitcoin price offers 1.6x back to $126,021. Pepeto offers a path from six decimal zeros to listing valuation for the return that rewrites a portfolio permanently.
Bitcoin Price Outlook: Where BTC Heads and Why Presale Returns Lead
Bitcoin (BTC) Price at $77,727 as Institutional Demand Hits New Highs
Bitcoin (BTC) trades at $77,727 on April 23 per CoinMarketCap, consolidating after its $79,388 high on April 22. The token sits 38% below the $126,021 all-time high from October 2025. Support holds near $75,000 with resistance at $80,000.
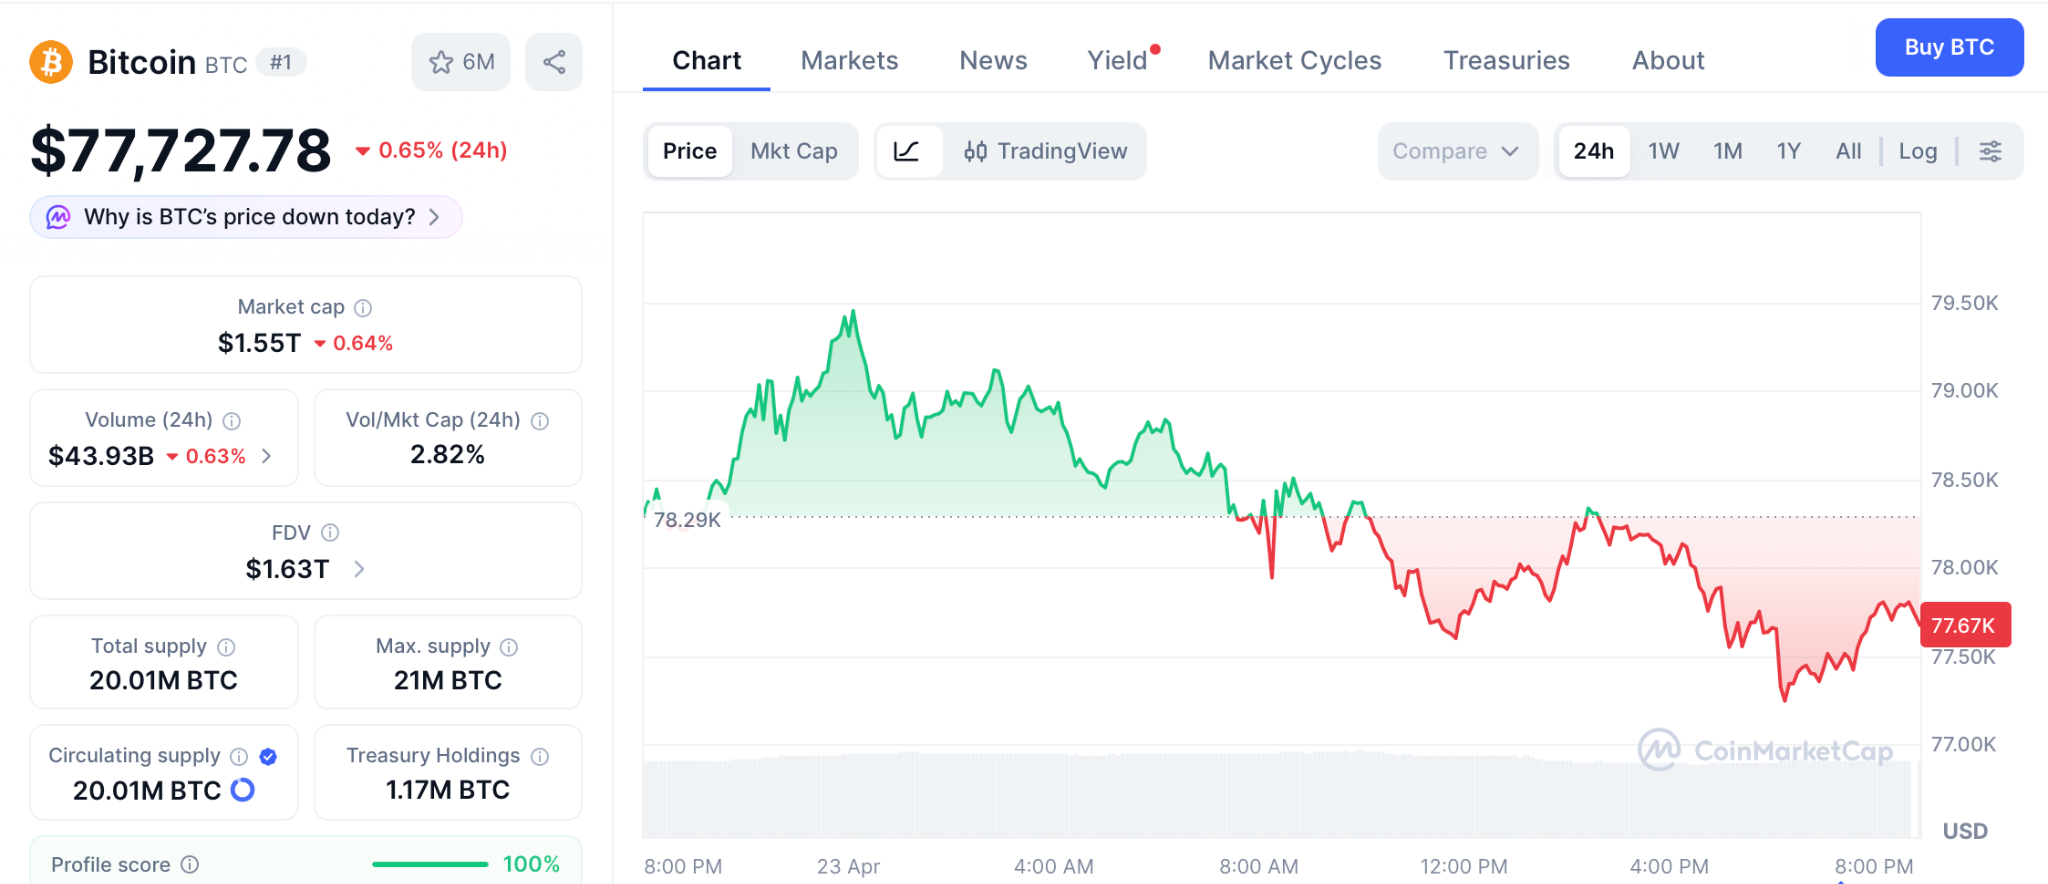
Strategy’s 815,061 BTC position and $96.5 billion in ETF assets confirm demand not seen since late 2025. Ethereum trades at $2,340 as capital rotates from ETH into Bitcoin on institutional flows. Analysts target $80,000 to $85,000 if the ceasefire holds through May. Even the bullish case delivers 1.6x from a $1.5 trillion base, a clean trade but not close to what a presale at six decimal zeros creates.
Conclusion:
Every cycle follows the same pattern. Institutional capital lands on Bitcoin first, the broader market responds days later, and presales with real products absorb the next wave before most traders notice the window closing. Strategy’s $2.54 billion purchase and five straight days of ETF inflows confirm the 2026 leg is underway, and the Bitcoin price pushing toward $80,000 is the trigger for presale positions that outperform the blue chip by magnitudes.
Pepeto sits in that position because the builder behind Pepe delivered a working exchange, a full SolidProof review, and a confirmed Binance listing at a presale cost that still reads $0.0000001866. The moment the first candle opens, that number turns into history. Each completed round raises the floor and brings the listing date forward, so the distance between reading this article and taking action shrinks with every token that leaves the presale.
Click To Visit Pepeto Website To Enter The Presale

FAQs
What is the Bitcoin price target for 2026 compared to Pepeto?
Bitcoin (BTC) trades at $77,727 with a path to its $126,021 all-time high for roughly 1.6x. Pepeto at $0.0000001866 targets 267x at listing, the kind of return only early presale entries produce while large caps never reach those multiples.
What is Pepeto and why are large wallets entering the presale?
Pepeto is a meme coin presale built by the Pepe cofounder with a zero-fee exchange, cross-chain bridge, and AI contract scanner. The presale raised $9.45 million with 178% APY staking and a confirmed Binance listing.
Disclaimer: This is a Press Release provided by a third party who is responsible for the content. Please conduct your own research before taking any action based on the content.


OpenAI released GPT-5.5 on April 23, codenamed “Spud,” positioning the model as its most capable system for autonomous, multi-step work.
The launch arrives one week after Anthropic shipped Claude Opus 4.7, setting up a direct comparison between the two frontier models.
GPT-5.5 Targets Agentic Work and Coding
GPT-5.5 is built to plan, execute, verify, and iterate across tools without constant human oversight. OpenAI describes it as “a new class of intelligence for real work and powering agents.”
Follow us on X to get the latest news as it happens
“We believe in iterative deployment; although GPT-5.5 is already a smart model, we expect rapid improvements. Iterative deployment is a big part of our safety strategy; we believe the world will be best equipped to win at the team sport of AI resilience this way,” wrote Sam Altman in a post.
The model rolls out now to ChatGPT Plus, Pro, Business, and Enterprise users. A more powerful Pro variant is also available. API pricing starts at $5 per million input tokens and $30 per million output tokens with a one-million-token context window.
OpenAI’s own benchmarks show GPT-5.5 ahead of Claude Opus 4.7 on several agentic tasks. It scored 82.7% on Terminal-Bench 2.0, compared to 69.4% for Opus 4.7.
On FrontierMath Tiers 1 through 3, it reached 51.7% versus 43.8%. Early independent tests reported similar trends in coding and knowledge-work evaluations.
Where Claude Opus 4.7 Still Leads
Anthropic’s model retains advantages in research writing, legal and financial reasoning, and instruction-following consistency, according to independent reviewers.
Opus 4.7 also supports higher-resolution vision at up to 3.75 megapixels, more than three times its predecessor.
On computer use, the gap narrows. GPT-5.5 scored 78.7% on OSWorld-Verified, while Opus 4.7 posted 78.0%.
The two models also trade leads on browsing benchmarks, with GPT-5.5 Pro pulling ahead at 90.1% versus 79.3%.
AI Race Accelerates in 2026
The back-to-back launches reflect a broader pattern. OpenAI has shipped multiple GPT-5.x variants this year, while Anthropic has steadily upgraded Claude through successive releases.
Google’s Gemini 3.1 Pro also competes for the same enterprise market.
For developers choosing between the two, the decision may come down to use case. GPT-5.5 appears stronger for agentic automation and long-horizon coding.
Claude Opus 4.7 may suit precision-heavy analytical workflows better. Whether independent benchmarks confirm OpenAI’s published numbers will become clearer in the days ahead.
Subscribe to our YouTube channel to watch leaders and journalists provide expert insights
The post OpenAI Launches GPT-5.5 to Challenge Anthropic’s Claude Opus 4.7 appeared first on BeInCrypto.

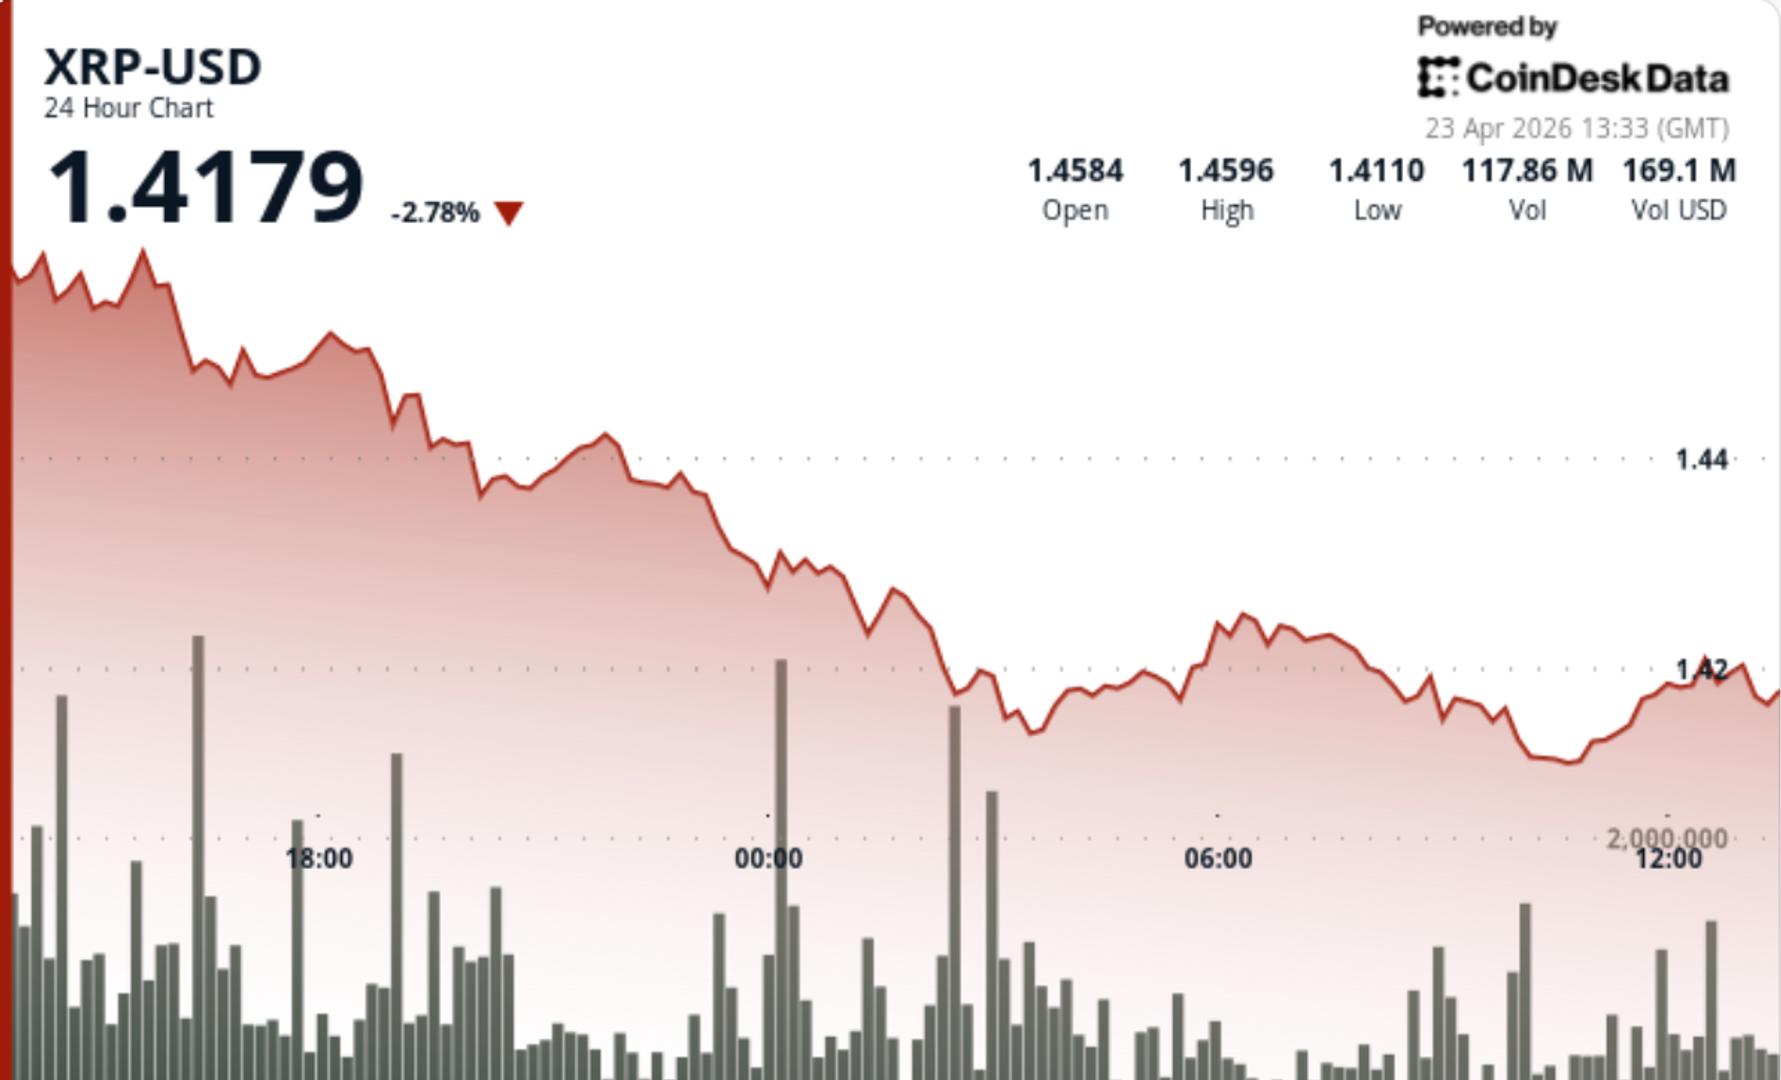
XRP moved higher briefly on Wednesday, but the move didn’t hold as bitcoin slid on profit-taking following its move to near $80,000 in Asian morning hours Thursday. Sellers stepped in near resistance and pushed price lower, suggesting the market still lacks conviction to break out, especially as broader crypto sees profit-taking led by bitcoin.
News Background
• GraniteShares has pushed back the launch of its 3x leveraged crypto ETFs to May 7, including XRP products. The delay removes a near-term catalyst that could have boosted speculative demand.
• The proposed products would offer both long and short exposure, amplifying daily price moves and potentially increasing volatility once live, particularly among retail traders.
Price Action Summary
• XRP tested the $1.44 level before reversing and slipping back toward $1.42.
• The move failed to sustain above resistance, with selling pressure accelerating into the close.
• Price is now drifting back into its prior range after the rejected breakout attempt.
Technical Analysis
• The key signal is the rejection at resistance. Buyers pushed price higher but couldn’t maintain control.
• Volume picked up during the move, but lacked follow-through needed to confirm a breakout.
• The broader structure remains range-bound, with no clear shift in trend yet.
• This kind of failed breakout often leads to either consolidation or a deeper pullback.
What traders should watch
• $1.44 remains the key resistance. A clean break is still required to change the structure.
• $1.40 is the immediate support level. Losing it would increase downside risk.
• Continued weakness after the rejection could push XRP back toward lower range levels.
Crypto World
Inside the $71 million freeze on Arbitrum that has the crypto world questioning what decentralization really means


The Arbitrum Security Council moved swiftly this week to contain the fallout from the KelpDAO exploit, touting the emergency “freeze” of more than 30,000 ETH linked to the attacker as a win for user protection.
But beneath the language of containment, the intervention has reopened one of crypto’s oldest and most uncomfortable debates: What decentralization actually means when a group of people can step in and override outcomes for a network after the fact.
At the center of the debate is the role of Arbitrum’s Security Council, a small, elected group chosen by token holders every 6 months, empowered to act in emergencies. In this case, it exercised those powers to take control of funds associated with the exploit, effectively locking them away pending further governance decisions.
Supporters see this as a system working as intended, preventing tens of millions of dollars from being laundered and buying time for potential recovery. Critics, however, argued the move underscores a different reality: That even in ostensibly decentralized systems, ultimate control can still rest with a handful of actors.
For Arbitrum insiders, however, the decision was far from a reflexive intervention. According to Steven Goldfeder, co-founder of Offchain Labs, the company that originally created and supports Arbitrum, the starting point was inaction.
“The default was do nothing,” Goldfeder said to CoinDesk, describing the early stages of the Security Council’s deliberations. “Then this idea actually emerged [from a security council member]… a way to do it in a very surgical way… without affecting any other user, not affecting the network performance and not having any downtime.”
The result was what Arbitrum has described as a “freeze.” But technically, the move required something more active: The use of privileged powers to transfer funds out of the attacker-controlled address and into a wallet with no owner, effectively rendering them immobile.
That distinction is at the heart of the decentralization debate. In its purest form, decentralization implies that no individual or group can unilaterally interfere with transactions once they are executed, often summed up by the phrase “code is law.” Critics worry that if a small group can step in to stop a hacker, the same mechanism could, in theory, be used in other situations as well, whether under regulatory pressure or political influence.
In simpler terms, the concern is less about this specific case and more about precedent: If intervention is possible, where is the line drawn, and who decides?
That capability, now demonstrated in practice, raises broader questions about the boundaries of decentralization on Layer 2 blockchains, and the tradeoff between security and neutrality.
While the Security Council is elected by token holders, it is still a relatively small group capable of acting quickly and, in this case, decisively.
Patrick McCorry, the head of research at the Arbitrum Foundation and who coordinates with the Security Council, emphasized that this structure is by design.
The Security Council is “a very transparent part of the system,” according to McCorry; “You can see exactly what powers they have.” In addition, he said, “they’re elected by token holders… not hand-picked by us [Arbitrum Foundation + Offchain Labs].”
Currently, the Security Council is selected through recurring on-chain elections, with token holders voting every six months to appoint its 12 members
From that perspective, Arbitrum’s model reflects a different interpretation of decentralization, one where authority is delegated by the community, rather than eliminated entirely.
Some critics have argued that a decision of this magnitude should have gone through token-holder governance. But Goldfeder pushed back on that idea, arguing that speed and discretion were essential.
“The DAO cannot be consulted, because the second the DAO is consulted, that essentially means North Korea is consulted,” he said, referring to ongoing investigative efforts suggesting the attacker’s ties.
“If you say, ‘hey guys, should we move these funds?’ then you might as well do nothing,” he said.
In that framing, the choice was not between decentralized and centralized decision-making, but between acting quickly or allowing the funds to disappear. Indeed, the attackers began moving and laundering the remaining stolen funds within hours of the Security Council’s intervention.
Supporters of the move say that reality highlights a different tradeoff, one between ideals and practical risk management. Without some form of emergency intervention, stolen funds in crypto are typically unrecoverable, and large exploits can cascade through the ecosystem.
From this perspective, the Security Council functions less as a centralized authority and more as a last-resort safeguard, designed to step in only under extreme conditions.
“We’re no more or less decentralized today than we were yesterday,” Goldfeder said.
Read more: Arbitrum freezes $71 million in ether tied to Kelp DAO exploit
Ether’s (ETH) 33% rally from its sub-$1,800 multi-year lows appears to be cooling, but several key metrics suggest the top altcoin may be primed for a bigger rally toward $6,000 or higher.
Key takeaways:
- Ether is currently displaying a technical setup similar to past cycles that ignited a massive rally in ETH price.
- Supply squeeze potential is growing as increasing accumulation and exchange outflows reduce immediate sell pressure.
- A rising Coinbase premium reflects the return of US institutional demand.
Ether’s fractal targets a $6,000 ETH price
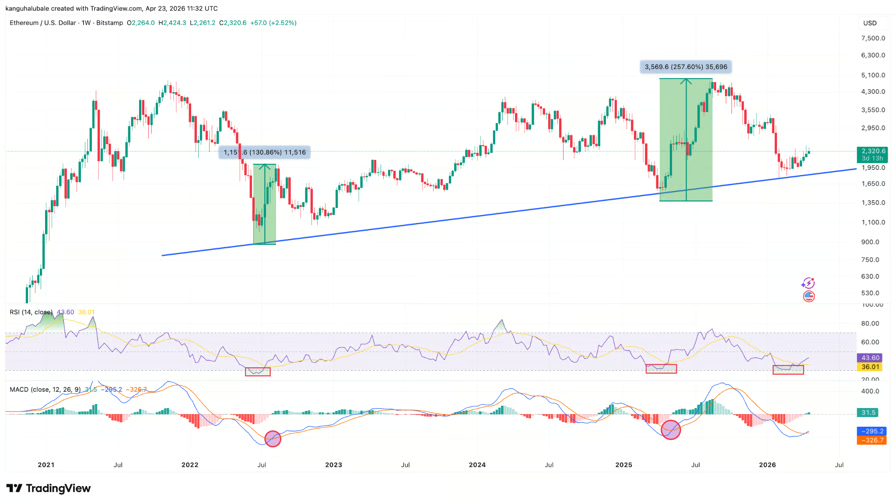
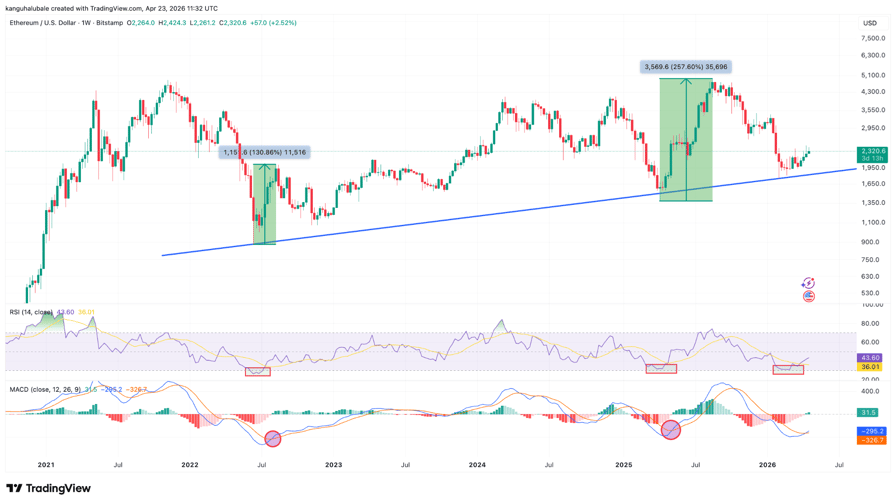
Ether is currently bouncing off a multi-year trend line that has historically marked macro ETH price bottoms. Previous instances in April 2025 and mid-2022 resulted in 260% and 130% ETH price rallies, respectively.
“$ETH is holding a long-term ascending trendline support,” analyst CryptoJack said in a recent X post, adding:
“Will history repeat itself?”
ETH/USD weekly chart. Source: Cointelegraph/TradingView
A bullish cross from the moving average convergence divergence (MACD) indicator also confirmed the price bottom.
“$ETH weekly MACD bullish cross is now confirmed,” analyst Ash Crypto said in a recent X post, adding:
“The last 2 times this happened, ETH pumped 183% and 75%.”
The weekly RSI is meanwhile recovering from levels that marked previous macro lows, suggesting that Ether’s recent drop to $1,750 was the bottom.
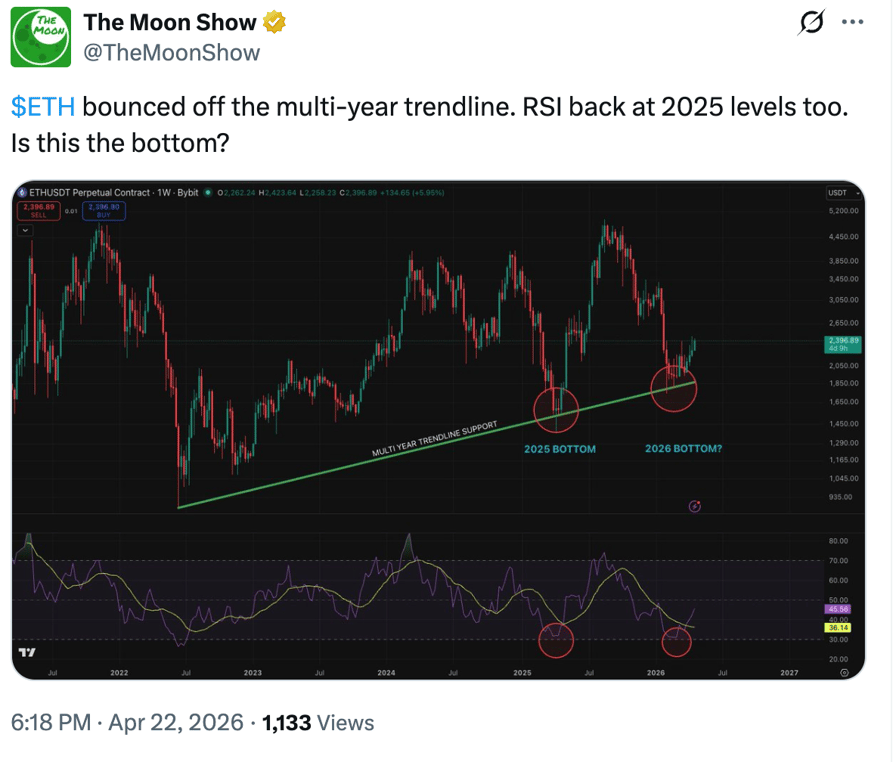
ETH/USD weekly chart. Source: The Moon Show
Ether’s current price action is following a similar pattern, with the price again bouncing off the same structural support, a confirmed bullish MACD crossover, and the RSI’s recovery from oversold conditions.
If history repeats itself, ETH may rally by between 75% and 260% from the bottom, placing Ether’s upside target at $3,000-$6,300.
ETH supply squeeze potential rises
Ethereum’s on-chain metrics reveal a tightening supply dynamic, an occurrence that has previously ignited significant ETH price rallies.
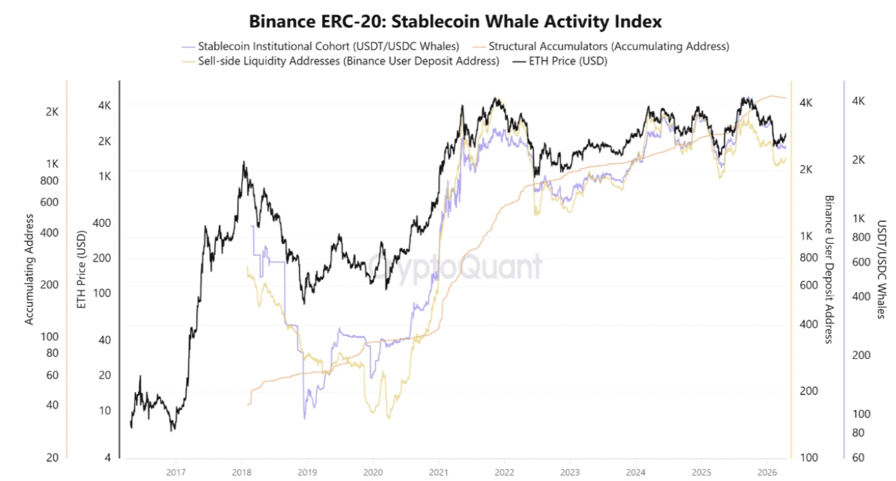
The Binance ERC-20: Stablecoin Whale Activity Index indicator reveals structural supply exhaustion.
The chart below shows that the number of daily accumulation addresses (wallets steadily buying ETH) has increased to 2,434, surpassing the number of exchange depositing addresses (wallets preparing to sell), which has dropped to 2,300.
This shift suggests that large players have moved from a “wait-and-see” phase into active accumulation, CryptoQuant analyst GugaOnChain said in a recent QuickTake analysis.
“This scenario is extremely positive for the price structure, as it reveals that there are significantly fewer addresses sending ETH to the exchange with the intention to sell than players accumulating or positioned to absorb liquidity,” the analyst said, adding:
“The supply shock is fully underway.”
Binance ERC-20 stablecoin whale activity index. Source: CryptoQuant
This is also seen in increasing exchange outflows, as the ETH net position change among exchanges for the past 30 days fell by 1.4 million ETH on April 2, marking the largest spike in seven months, according to Glassnode data.
The net position change is at -351,300 ETH (30 days) at the time of writing on Thursday.
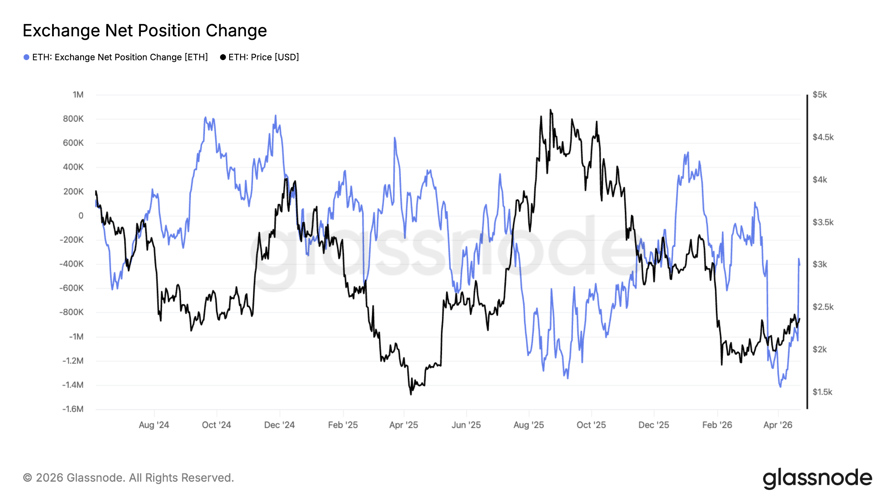
ETH: Exchange net position change. Source: Glassnode
Such outflows typically indicate strong accumulation by large holders, who move tokens to cold storage or invest in investment products, thereby reducing immediate sell pressure.
This is usually referred to as a “supply squeeze,” conditions that have, historically, preceded sharp upside moves, especially when combined with improving market sentiment.
Ethereum demand recovers
As Cointelegraph reported, Ether futures on Binance have risen to a near two-month high as aggressive buyers stepped into the market over the past week. Buy-taker volume rose above $5 billion, and the current setup leans bullish.
The US market is driving a significant share of this demand, as measured by the Coinbase premium index.
The ETH Coinbase premium index measures the price difference between the ETH/USD pair on Coinbase and Binance.
This metric flipped positive on April 4, rising to 0.055 on April 14, its highest level since October 2025. The index fell to as low as -0.21 in early February and has now recovered to 0.04.
This typically signals increased demand from institutional investors, particularly in the US market.
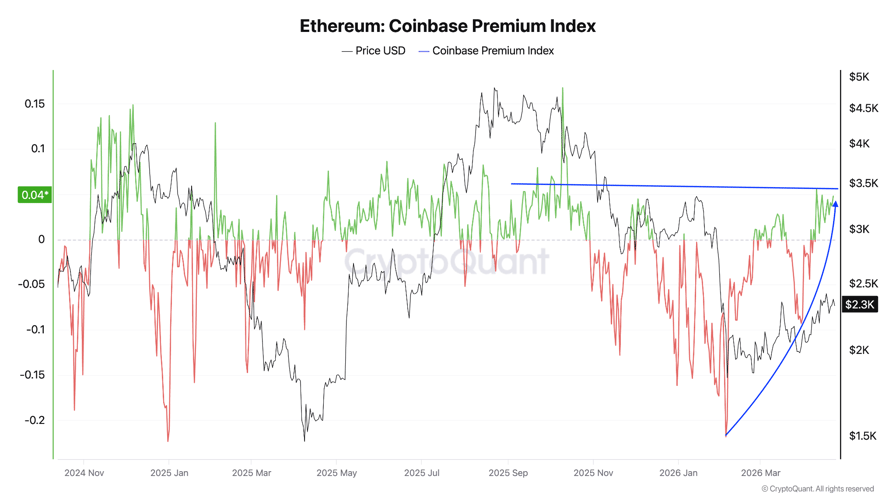
Ethereum Coinbase Premium Index. Source: CryptoQuant
Meanwhile, spot Ethereum ETFs have recorded net inflows for 10 consecutive days, totaling $590 million. This marks the longest inflow streak since December 2024, accompanying a 95% ETH price rally in Q4 2024.
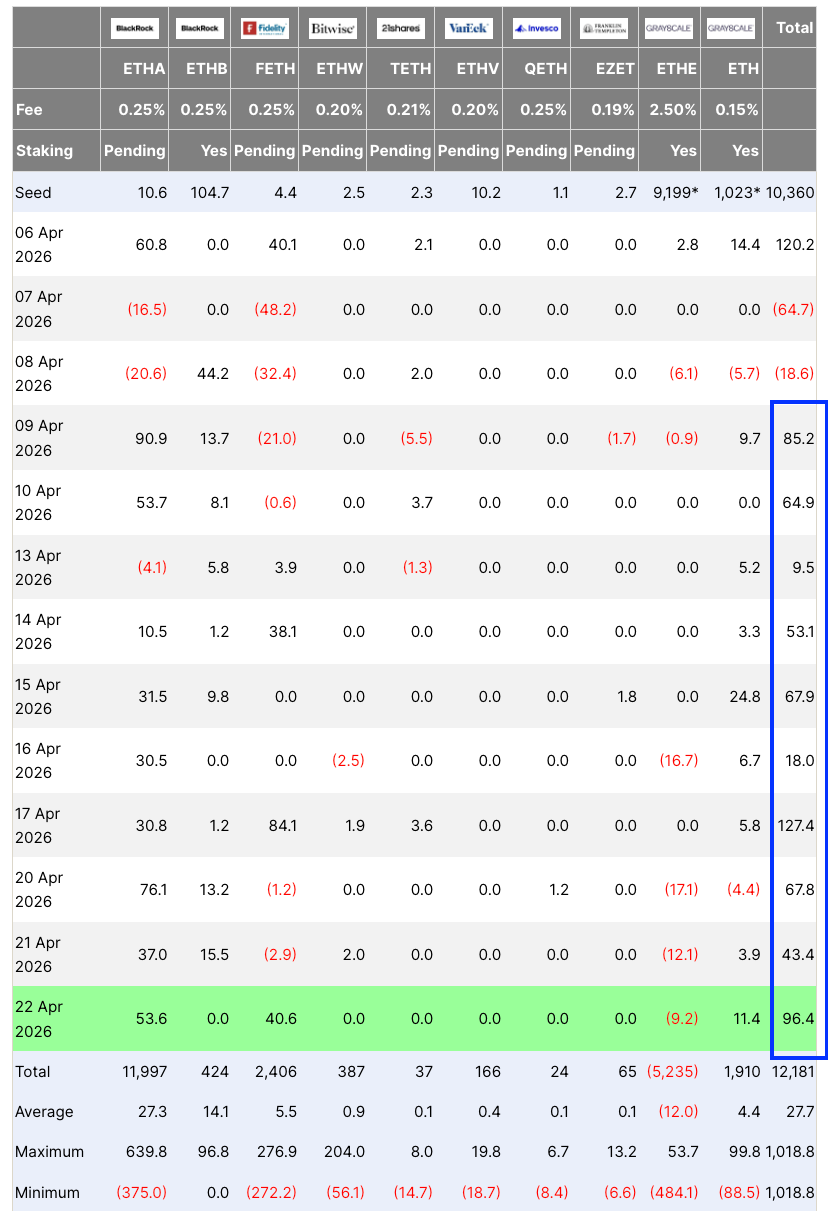
Spot Ethereum ETF flows table. Source: SoSoValue
Meanwhile, Bitmine Immersion Technologies, the world’s largest public holder of Ether, increased its holdings last week with another 101,627 ETH purchase, reflecting a return of demand for ETH among institutional investors.

Will 84-Year-Old Mother of Today Anchor Be Found Before Day 100?
Tether freezes $344M USDt stablecoins at US law enforcement request

‘One cheap drone can shut down the global economy’
Manchester United reach agreement with Casemiro over contract clause amid transfer speculation

US brings back mandatory military draft registration

Steven Gerrard disagrees with Gary Neville over ‘shock’ Chelsea and Arsenal claim | Football


-

 Sports6 days ago
NWFL Suspends Two Players Over Post-Match Clash in Ado-Ekiti
-

 Fashion6 days ago
Weekend Open Thread: Theodora Dress
-

 Politics6 days ago
Palestine barred from entering Canada for FIFA Congress
-
Entertainment4 days ago
NBA Analyst Charles Barkley Chimes in on Ice Spice McDonald’s Fiasco
-

 Tech5 days ago
Auto Enthusiast Scores Running Tesla Model 3 for Two Grand and Turns It Into Bare-Bones Go-Kart
-

 Business4 days ago
Powerball Result April 18, 2026: No Jackpot Winner in Powerball Draw: $75 Million Rolls Over
-

 Politics4 days ago
Zack Polanski demands ‘council homes not luxury flats for foreign investors’
-

 Crypto World6 days ago
Russia Pushes Bill to Criminalize Unregistered Crypto Services
-

 Politics3 days ago
Gary Stevenson delivers timely reminder to register to vote as deadline TODAY
-

 Business1 day ago
Rolls-Royce Voted UK’s Most Iconic Trade Mark as IPO Register Hits 150
-

 Politics1 day ago
Disabled people challenge government SEND proposals over segregation concerns
-

 Politics1 day ago
Making troops accountable for war crimes threatens US alliance, ex-SAS colonel warns
-
 Business7 days ago
Creo Medical agree sale of its manufacturing operation
-

 Crypto World6 days ago
Russia Introduces Bill To Criminalize Unregistered Crypto Services
-

 Politics1 day ago
Starmer handler McSweeney to be dragged from shadows by Foreign Affairs Committee
-

 Politics1 day ago
Zack Polanski responds to home secretary’s taser threat
-
Politics1 day ago
Wings Over Scotland | How To Get Away With Crimes
-
 Crypto World5 days ago
Kelp DAO rsETH Bridge Hack Drains $292M as DeFi Losses Top $600M in Two Weeks
-

 Politics24 hours ago
‘Iran is still a nuclear threat’
-

 Crypto World2 days ago
New York sues Coinbase, Gemini over prediction market offerings
You must be logged in to post a comment Login