
Crypto World
Alphabet (GOOGL) Stock Soars 10% as Q1 Results Demolish Analyst Projections

Quick Overview
- Alphabet delivered Q1 earnings per share of $5.11, demolishing the analyst consensus of $2.63, while revenue reached $109.9B — representing 22% growth year-over-year
- Cloud division revenue exploded 63% to $20B, while the backlog nearly doubled quarter-over-quarter to surpass $460B
- Shares of GOOGL rallied nearly 10% during Thursday’s trading session after the earnings release
- Scotiabank upgraded its price objective to $450, suggesting approximately 30% potential upside; Barclays set a $405 target
- The company increased its quarterly dividend payment by 5% to $0.22 per share
Alphabet unveiled its Q1 2026 financial results on Thursday, significantly exceeding Wall Street’s projections and propelling GOOGL stock upward nearly 10% — climbing from an opening level of $347.31 to approximately $383.69 by midday trading.
Adjusted earnings per share registered at $5.11, essentially doubling the Street consensus of $2.63. Total revenue reached $109.9 billion, surpassing expectations of $106.81 billion and representing 22% year-over-year expansion.
The quarter marked Alphabet’s 11th consecutive period of double-digit revenue expansion.
Cloud Division Delivers Outstanding Results
The Google Cloud business emerged as the quarter’s star performer. Revenue skyrocketed 63% to $20 billion, powered by enterprise artificial intelligence offerings and fundamental cloud infrastructure services.
The Cloud division’s committed backlog almost doubled from the previous quarter, now exceeding $460 billion. Chief Executive Sundar Pichai attributed AI solutions for enterprise customers as the primary catalyst behind Cloud’s exceptional growth.
Google Services revenue advanced 16% to $89.6 billion. Search revenue expanded 19%, YouTube advertising increased 11%, and the subscriptions, platforms, and devices segment rose 19%.
Operating margin widened by two percentage points to 36.1%. Net income surged 81%, benefiting partially from a $37.7 billion gain on unrealized equity securities.
Total paid subscription count hit 350 million. Gemini Enterprise experienced 40% quarter-over-quarter expansion in paid monthly active users.
Wall Street Responds with Higher Targets
Scotiabank elevated its price objective from $400 to $450 after reviewing the quarterly results, keeping a “sector outperform” recommendation. This target represents approximately 30% upside potential from pre-earnings price levels.
Barclays analyst Ross Sandler increased his objective to $405, noting that Alphabet’s comprehensive positioning throughout the AI technology stack is fueling the strongest growth in four years across virtually every business segment.
The consensus recommendation among Wall Street analysts stands at “Buy,” with an average price objective of $355.07. Seven analysts have assigned Strong Buy recommendations and 29 have issued Buy ratings.
Wells Fargo elevated GOOGL to “strong-buy” during February. JPMorgan increased its objective to $395 with an “overweight” recommendation.
Alphabet simultaneously announced a 5% dividend boost to $0.22 per share on a quarterly basis.
Challenges Remain Despite Strong Quarter
Some concerns persist despite the impressive results. Swiss regulators initiated an investigation into alleged keyword-bidding tactics, while the European Union continues adjusting oversight regulations concerning cloud and AI operations.
Insider transactions have been notable. Chief Executive Sundar Pichai divested 32,500 shares during February at $335.18 per share, reducing his holdings by 1.47%. Director John Hennessy similarly reduced his position in March.
Substantial AI infrastructure investments and reported cloud capacity limitations could potentially squeeze margins in upcoming quarters.
Employee opposition regarding Pentagon contracts and classified AI initiatives has also introduced some reputational concerns for the technology giant.
The Scotiabank $450 price objective was established on April 30, 2026, coinciding with Alphabet’s Q1 earnings announcement.


Best Multi-Asset Broker is a category within the BeInCrypto Institutional 100, covering platforms that bring crypto into broader brokerage accounts alongside equities, FX, futures, ETFs, and other asset classes.
This Category sits under Pillar 1: Retail to Crypto Bridge, with the 2026 long list drawn from multi-asset brokers and bank-brokerage platforms active between April 2025 and March 2026.
A shortlist will be named in May 2026, with the winner announced at Proof of Talk in Paris on June 2–3, 2026.
- Longlist: 15 firms, covering Nasdaq- and LSE-listed multi-asset brokers, FINMA-supervised Swiss banks with integrated crypto exchanges, German banking-licensed pan-European platforms, US wealth managers entering spot crypto, and CFD-led FX brokers building dedicated spot venues.
- Candidates screened: Starting pool of 32 multi-asset brokers and bank-brokerage hybrids with live crypto offerings; 15 advanced to this longlist, with 5 additional firms held in the outreach pool.
- Scoring (Track B): 30% quantitative data · 50% Expert Council · 20% disclosed company data.
- Criteria assessed: Crypto coverage, execution quality, cross-asset integration, volume and adoption, regulatory standing, innovation, and industry standing.
- Sources: Regulator registers (FCA, FINMA, BaFin, ASIC, CFTC, MAS), audited filings, firm disclosures, partner integrations, and private-market platforms.
| # | Firm | HQ | In Crypto Since | Scale Signal | Crypto Product | Status | Representative Work |
|---|---|---|---|---|---|---|---|
| 1 | Interactive Brokers | Greenwich, CT | 2021 | Nasdaq: IBKR 2.5M+ accounts across 170+ markets |
11 spot cryptos via Paxos and Zero Hash Coinbase nano BTC/ETH futures added Feb 2026 |
Public · Nasdaq listed | Expanded crypto access inside a global brokerage account Added crypto-to-account transfers in Mar 2026 |
| 2 | IG Group | London, UK | 2018 | LSE: IGG · FTSE 100 820,000 active clients in FY25 |
55+ tokens via FCA cryptoasset registration Crypto 10 Index and Independent Reserve exposure |
Public · LSE listed | First FCA-registered crypto offering from a UK-listed broker Acquired Independent Reserve in 2025–26 |
| 3 | Swissquote | Gland, Switzerland | 2017 | SIX: SQN 650,000+ accounts; FINMA and CSSF licences |
50+ cryptos through SQX exchange Staking on ETH, DOT, SOL, ADA, XTZ |
Public · SIX listed | Integrated crypto into a Swiss banking and brokerage model Offers native exchange, custody, and staking access |
| 4 | Saxo Bank | Copenhagen, Denmark | 2018 | 1M+ clients 200+ banks and 400+ intermediaries |
Crypto ETPs for all clients Crypto FX pairs for elective professional clients |
Private · Bank-licensed | White-label broker infrastructure with crypto-linked products J. Safra Sarasin 70% acquisition closed Mar 2026 |
| 5 | Charles Schwab | Westlake, TX | 2024 | NYSE: SCHW ~$12T client assets; 38.9M brokerage accounts |
Schwab Crypto launching Q2 2026 Spot BTC and ETH via Schwab Premier Bank |
Public · NYSE listed | Brings spot crypto to one of the largest US wealth platforms Announced 0.75% crypto trading fee in Apr 2026 |
| 6 | Fidelity Investments | Boston, MA | 2018 | Privately held Enterprise custody through Fidelity Digital Assets |
Fidelity Crypto retail trading FBTC, FETH, FSOL and IRA-eligible products |
Private · Trust company | Combines retail trading, custody, and crypto ETP access Uses institutional infrastructure built through Fidelity Digital Assets |
| 7 | flatexDEGIRO | Frankfurt, Germany | 2024 | FRA: FTK 3.35M+ customers across 16 European countries |
Spot crypto launched Dec 2024 0.6% all-in cost; 90%+ customer eligibility |
Public · Frankfurt SE | Reported first €500M crypto-volume quarter in Q1 2026 Grew crypto volume roughly 5x year-on-year |
| 8 | CMC Markets | London, UK | 2017 | LSE: CMCX 12,000+ instruments; 2M+ user logins |
Crypto CFDs across major tokens Bermuda digital asset licence |
Public · LSE listed | Offers crypto CFDs inside a broad multi-asset trading platform Developing broader DeFi “super app” strategy |
| 9 | Plus500 | Haifa, Israel | 2017 | LSE: PLUS $415.1M H1 2025 revenue; 179,931 active customers |
Crypto CFDs on major tokens Separate regional spot and CFD entities |
Public · LSE listed | Maintains crypto exposure across regulated CFD entities Plus500 US extends group into CFTC-regulated markets |
| 10 | XTB | Warsaw, Poland | 2018 | WSE: XTB 2.16M+ clients across 13+ jurisdictions |
50+ crypto CFDs in the EEA 5,400+ instruments through xStation 5 |
Public · WSE listed | Brings crypto CFDs into a large European brokerage platform Expanded regulatory footprint with UAE licence upgrade |
| 11 | Webull | St. Petersburg, FL | 2020 | Nasdaq: BULL 4.3M+ funded accounts across 13+ countries |
Webull Pay crypto app US crypto access via Bakkt |
Public · Nasdaq listed | Separates crypto access from core brokerage through Webull Pay Added prediction markets in 2026 |
| 12 | Pepperstone | Melbourne, Australia | 2019 | Privately held 160 countries; seven-regulator footprint |
Pepperstone Crypto spot exchange BTC, ETH, SOL, USDC, USDT at 0.1% flat fee |
Private · Multi-regulated | Launched dedicated Australian spot crypto exchange in Feb 2026 Also offers 21 crypto CFD pairs globally |
| 13 | OANDA | New York, NY | 2024 | Privately held NFA member with 25+ year operating history |
Spot crypto via Paxos itBit Eight tokens including BTC, ETH, LINK, UNI |
Private · NFA member | Added spot crypto to a long-standing FX brokerage platform Uses mobile and TradingView access for US crypto users |
| 14 | Capital.com | Limassol, Cyprus | 2018 | Privately held 845,000+ traders; $1T+ cumulative client volume |
450+ crypto CFDs MiCA CASP licence through CySEC |
Private · MiCA-licensed | Offers one of the broadest crypto CFD lineups in the sector Secured MiCA CASP licence in Jan 2026 |
| 15 | Exness | Limassol, Cyprus | 2018 | Privately held $1T+ monthly trading volume |
BTC, ETH, LTC, BCH, XRP CFDs BTC cross pairs across several fiat currencies |
Private · Multi-regulated | Brings crypto CFD access into a high-volume FX platform Moving selected BTC cross pairs to close-only in Apr 2026 |
About This List
The BeInCrypto Institutional 100 — Multi-Asset Brokers (2026 Long List) identifies brokers and bank-brokerage platforms bringing crypto into wider trading accounts. These firms offer crypto exposure alongside traditional assets, including equities, FX, ETFs, futures, bonds, and CFDs.
The long list covers brokers, Swiss- and European-bank-backed platforms, US wealth managers, and CFD-led operators building spot crypto venues or integrated crypto access. Firms focused only on digital asset trading are evaluated separately under dedicated broker, exchange, and trading infrastructure categories.
Methodology
This category evaluates multi-asset brokers under Track B of the BeInCrypto Institutional 100 methodology: 30% editorial quantitative metrics, 50% Expert Council scoring, and 20% disclosed data.
Assessment spans seven criteria: crypto coverage, execution quality, cross-asset integration, volume and adoption, regulatory standing, innovation, and industry standing.
Data was verified using regulator registers, audited filings, company disclosures, transparency pages, partner integrations, and private-market sources, including PitchBook, Tracxn, and Crunchbase. Figures reflect the most recent available data at the time of publication.
To submit a nomination or share feedback, contact awards@beincrypto.com.
The post BeInCrypto Institutional Research: 15 Multi-Asset Brokers Integrating Crypto Trading appeared first on BeInCrypto.
Digital asset adoption in Latin America is evolving, with more users now converting funds into stablecoins than into Bitcoin — a shift that reflects growing pressure from local economic conditions.
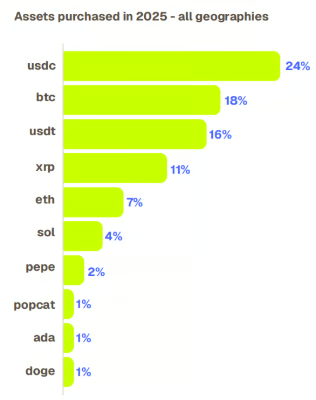
According to Bitso’s 2025 report on crypto adoption in Latin America, 40% of crypto purchases in 2025 were US dollar-linked stablecoins such as Tether’s USDt (USDT) and Circle’s USDC (USDC), while Bitcoin (BTC) accounted for 18%. The report marks the first time stablecoin purchases have surpassed Bitcoin in the region.
The findings are based on data from Bitso’s nearly 10 million retail users across its exchange platform.
The trend reflects a broader move toward what the Latin American crypto exchange described as “digital dollarization.” In countries facing persistent inflation, currency depreciation and limited access to traditional banking, stablecoins offer a relatively accessible way to store value and transact in US dollar equivalents.
While the US dollar itself is not immune to inflation, it tends to depreciate more slowly than many local currencies and remains the world’s dominant medium of exchange, making it an attractive benchmark for users seeking stability.
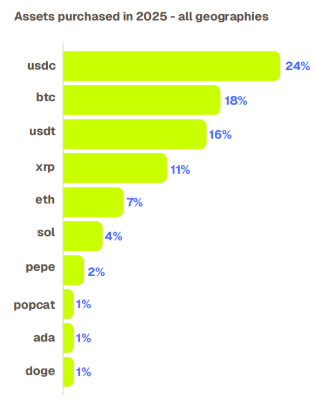
The most purchased assets in 2025 across Latin America. Source: Bitso
The global stablecoin market has grown to roughly $320 billion, with adoption expanding across both developed and emerging economies. Their Latin American regional appeal is particularly practical: users rely on stablecoins for preserving savings, making payments and sending cross-border remittances.
Use of home-grown stablecoins is benefiting from the expansion. Brazilian retail giant Mercado Libre in early April launched a cross-border remittance product using the Meli dollar stablecoin for users in Brazil, Mexico and Chile, Cointelegraph Brasil reported. That came after the retailer discontinued issuing its own stablecoin, Mercado Coin, earlier this year.
Related: Visa adds Polygon, Base support as stablecoin settlement run rate hits $7B
Bitcoin remains dominant as a store of value
While Bitcoin purchases have declined as a share of total activity, the Bitso report shows the asset still plays a central role as a long-term savings vehicle in Latin America.
“Bitcoin continues to function as Latin America’s primary long-term digital store of value,” the report said, noting that the cryptocurrency is held in 52% of crypto portfolios across the region in 2025. That’s down only slightly from 53% the previous year.
Bitcoin has long been viewed as a store of value, despite periods of volatility and uneven performance compared with previous market cycles. The asset rose above $126,000 in October before pulling back sharply, with prices later trading in the low $60,000 range.
Recent research by index maker MarketVector reframes the store-of-value narrative beyond price performance alone, arguing that Bitcoin and gold share core traits, including scarcity, decentralization and resistance to supply expansion, that underpin their long-term value.
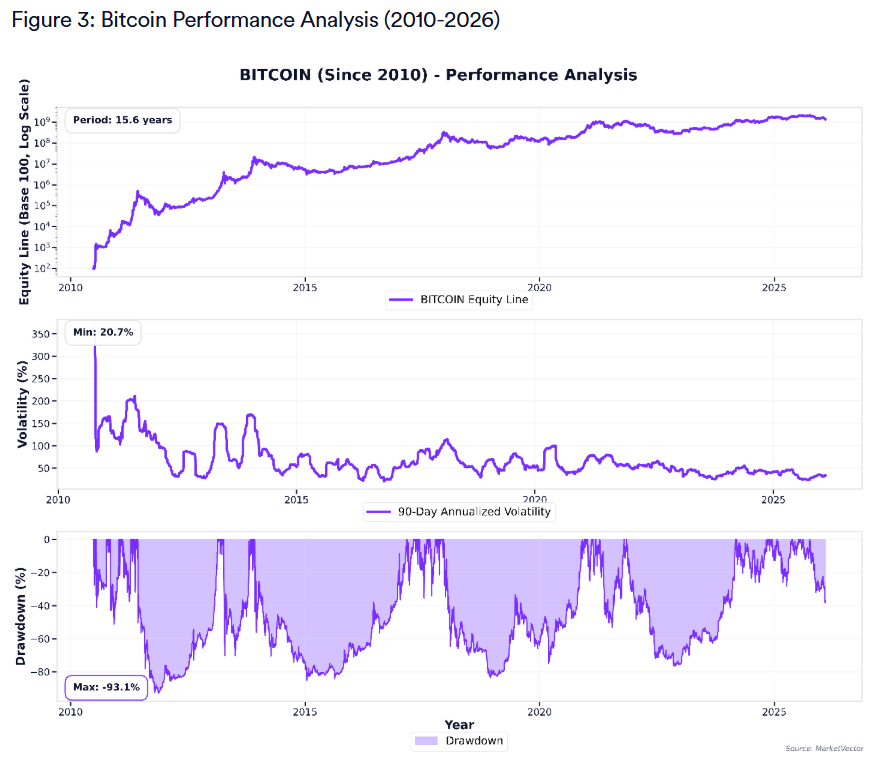
A comparison of Bitcoin’s price performance, volatility and drawdowns since inception. Source: MarketVector Indexes
Related: Did Bitcoin bottom versus gold? BTC price will reach $167K in 2027 if history repeats
Latin America’s crypto adoption path is pivoting toward stablecoins in 2025, reflecting how local conditions—high inflation, currency depreciation, and uneven access to traditional banking—shape user behavior. Bitso’s 2025 crypto adoption report, drawn from nearly 10 million retail users on its exchange, shows stablecoins accounted for 40% of crypto purchases that year, while Bitcoin represented 18%. The shift marks the first time stablecoins outpaced Bitcoin in the region’s purchase mix.
The findings illuminate what Bitso calls a movement toward “digital dollarization.” In economies where local currencies struggle to preserve value, stablecoins pegged to the U.S. dollar offer a comparatively accessible way to store value and transact in dollar equivalents. As global payment rails expand, stablecoins appear increasingly practical for everyday savings, payments, and cross-border remittances across Latin America.
Key takeaways
- Stablecoins dominated Latin American crypto purchases in 2025 at 40%, versus 18% for Bitcoin.
- Bitcoin remains a core long-term store of value, present in 52% of regional crypto portfolios in 2025, a slight dip from 53% the prior year.
- The region’s stablecoin momentum feeds into a broader global trend, with the sector near $320 billion in market capitalization and growing use as a financial tool beyond investing.
- Local use-cases are expanding, notably Mercado Libre’s cross-border remittance product using the Meli dollar stablecoin for Brazil, Mexico and Chile, following the earlier discontinuation of its Mercado Coin offering.
Stablecoins reshape Latin American on-ramps
Bitso’s data underscore a practical shift in how individuals interact with crypto: stablecoins are increasingly used as a first point of entry and a medium of daily value transfer. In economies facing persistent inflation and currency volatility, stablecoins provide a more predictable unit of account than many local currencies, alongside faster settlement and lower friction for cross-border payments.
Beyond on-ramps, stablecoins are gaining traction as a component of regional financial infrastructure. The Bitso study situates stablecoins not merely as speculative assets but as tools that empower savers and small businesses to navigate volatility, access dollar-denominated payment rails, and send remittances with lower costs than traditional channels.
Bitcoin endures as a regional store of value
While the share of crypto activity tied to Bitcoin has declined slightly as stablecoins gain ground, the asset continues to anchor Latin American portfolios. The Bitso report notes that Bitcoin remains the primary long-term digital store of value, held in 52% of crypto portfolios in 2025, down marginally from 53% in 2024.
Industry observers have long framed Bitcoin as a scarce, decentralized store of value akin to gold. New analyses, including research from MarketVector, broaden that lens by highlighting common traits—scarcity, decentralization, and resistance to supply expansion—that underpin Bitcoin’s narrative as a durable store of value, even amid price volatility.
Local innovations push adoption forward
Regional deployments illustrate how stablecoins are moving beyond speculation toward practical use cases. In early April, Mercado Libre reported the launch of a cross-border remittance product using its Meli dollar stablecoin for users in Brazil, Mexico and Chile. The rollout followed the company’s earlier decision to discontinue issuing its own stablecoin, Mercado Coin, earlier this year. The move signals a shift toward dollar-linked digital currencies as a backbone for cross-border commerce within Latin America.
These developments sit within a broader ecosystem trend: the global stablecoin market has grown to roughly $320 billion, with adoption expanding across both developed and emerging economies. The Latin American experience demonstrates how stablecoins can function as a bridging technology—supporting savings, domestic payments, and regional remittances in an increasingly interconnected digital economy.
Broader market backdrop and policy signals
The Latin American story unfolds against a global backdrop where stablecoins are increasingly integrated into payments and settlement rails. For example, larger payment networks have begun to explore or implement stablecoin settlements, a trend that could accelerate liquidity and adoption in regions with imperfect traditional banking access. In related Asia-Pacific and European developments, industry participants emphasize that stablecoins offer efficiency gains for merchants and users alike, while regulators weigh consumer protections and systemic risk considerations.
US dollar dynamics also matter in this narrative. While the dollar itself faces inflationary headwinds, it historically retains greater stability relative to many local currencies, reinforcing the appeal of dollar-pegged digital assets for regional users seeking to preserve purchasing power.
What comes next for Latin America’s crypto landscape
Looking ahead, readers should watch how LATAM regulators balance innovation with safeguards as stablecoins scale in everyday use. The region’s mix of high inflation in some economies, ongoing currency depreciation, and evolving fintech ecosystems creates both opportunity and risk for stablecoins, Bitcoin, and related services. Investor and user interest may hinge on liquidity, on-ramps for new users, and the development of compliant custody and payment rails that can support cross-border activity at scale.
As Bitso’s findings illustrate, stablecoins have moved from niche instruments to practical components of everyday financial life in Latin America. The coming year will reveal whether this digital dollarization trend broadens beyond pockets of inflationary stress to become a pervasive feature of the region’s financial infrastructure.


The prediction market will deploy a custom on-chain detection model to flag insider activity.


A U.S. Senate that’s struggled to move crypto market structure legislation moved like lightning on Thursday to ban themselves from participating in prediction markets.
Acting on a simple, 14-line resolution pushed by Ohio Republican Senator Bernie Moreno, the Senate agreed unanimously to put a restriction between members and the increasingly popular, controversial betting platforms that have drawn scrutiny over insider-trading activity and fights over who has regulatory jurisdiction.
“United States Senators have no business engaging in speculative activities like prediction markets while collecting a taxpayer-funded paycheck, period,” said Senator Moreno in a Thursday statement. “Serving in Congress should never be about finding new ways to profit; it should be about delivering results for the American people.”
Effective immediately, the change to Senate rules now holds that senators can’t enter “an agreement, contract, or transaction that provides for any purchase, sale, payment, or delivery that is dependent on the occurrence, nonoccurrence, or the extent of the occurrence of a specific event.”
Political betting has surged in popularity, and some candidates for office have already been penalized for wagering on their own races.
One of the leading platforms, Polymarket, posted on social media site X that the company is in “full support” of the Senate’s action. Polymarket, which isn’t supposed to operate in the U.S. after a 2022 agreement with the CFTC, noted that its user rules “already prohibit such conduct, but codifying this into law is a step forward for the industry.”
Betting on Polymarket currently gives Democrats even odds that they’ll reclaim the Senate majority in the November elections. Democrats have generally been more critical and suspicious of the fast-growing industry.
Crypto World
Apple (AAPL) Stock: Q2 Earnings Beat Expectations with 17% Revenue Jump and $100B Buyback

Key Highlights
- AAPL demonstrates 17% revenue increase, though shares decline in extended trading
- Quarterly performance surpasses Wall Street projections on both earnings and sales
- Company unveils $100B share repurchase initiative alongside robust services performance
- iPhone sales maintain momentum while market response remains cautious post-announcement
- Solid Q2 performance meets mixed investor sentiment in after-hours session
Apple Inc. (AAPL) shares climbed following the tech giant’s impressive quarterly performance, though momentum cooled during extended trading hours after initial gains. The Cupertino-based company delivered robust financial results powered by sustained iPhone sales and expanding services offerings. Nonetheless, certain segment shortfalls and ongoing supply challenges tempered enthusiasm in after-market activity.AAPL shares concluded regular trading at $271.35, registering a 0.44% increase following the earnings announcement.
Quarterly Financial Performance Shows Robust Top-Line Expansion
Apple disclosed quarterly sales totaling $111.2 billion, representing a 17% year-over-year improvement. The technology leader posted earnings per share of $2.01, surpassing consensus estimates from analysts. Sustained consumer appetite for iPhone products underpinned overall results, even as certain product categories delivered mixed outcomes.
iPhone division generated $56.99 billion in revenue, falling marginally short of projections while still demonstrating healthy annual expansion. Both Mac and iPad product lines outperformed expectations, providing diversified revenue contributions. The services division continued reinforcing the company’s subscription-based income foundation.
Services segment revenue climbed to $30.97 billion, showcasing consistent growth from subscription offerings and digital content. Gross profit margin expanded to 49.3%, signaling enhanced operational efficiency. The company sustained earnings momentum despite persistent global supply chain complexities.
Expanding Services Division and Capital Allocation Strategy Bolster Position
Apple’s services business unit posted consistent advancement, fueled by increasing subscriber adoption across multiple digital platforms. The corporation strengthened its ecosystem spanning payment solutions, cloud infrastructure, and media entertainment services. Consequently, the services segment generated higher-margin revenue contributions.
Management authorized a fresh $100 billion stock buyback initiative designed to maximize shareholder value. The company simultaneously raised its quarterly dividend to 27 cents per share, reinforcing its commitment to returning capital. These measures bolstered investor sentiment in the wake of earnings disclosure.
Research and development expenditures surged substantially, demonstrating ongoing commitment to emerging technologies and innovation. R&D costs jumped 33% compared to the prior year, totaling $11.42 billion. The company remains focused on advancing artificial intelligence capabilities and next-generation product development.
Regional Performance, Supply Dynamics, and Executive Succession Frame Future Direction
Apple achieved notable expansion in Greater China, generating $20.49 billion in regional revenue. This outcome surpassed market forecasts and illustrated strengthening demand in key territories. The organization benefited from sustained premium device positioning across international markets.
Worldwide memory component shortages stemming from AI data center infrastructure buildout created manufacturing constraints for hardware divisions. Elevated memory pricing pressured margins throughout the broader technology industry. Apple successfully preserved profitability despite these headwinds.
Executive leadership succession planning introduced additional strategic considerations for investors. Tim Cook announced his planned September departure, with John Ternus designated as his replacement. The company continues advancing its artificial intelligence roadmap through strategic collaborations and product innovation initiatives.
“Sell in May and go away” has crossed from Wall Street into crypto folklore, signaling summer drawdowns and thin tape. Five altcoin setups for May suggest 2026 could rewrite that script.
Chainlink, Ethereum, Kaspa, Sui, and NEAR spent months grinding through accumulation with compressed volatility. Each name now sits within striking distance of a breakout, and each has a specific catalyst lined up for May.
Chainlink (LINK) Coils Inside an Ascending Triangle
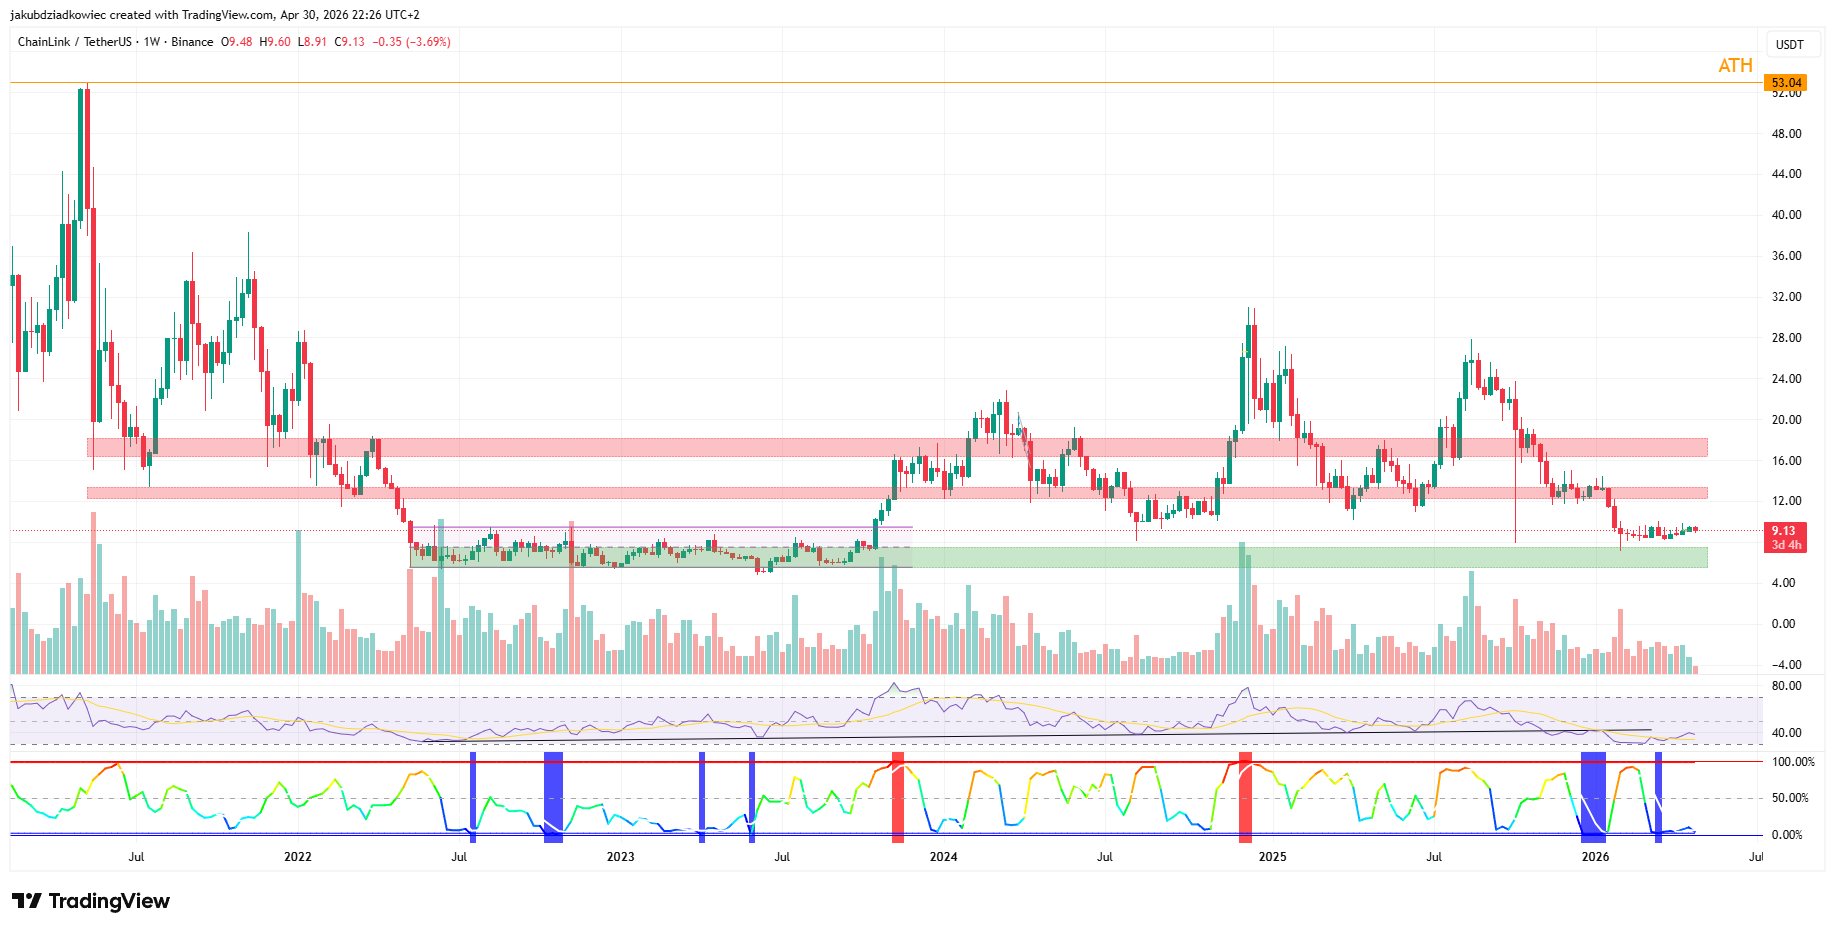
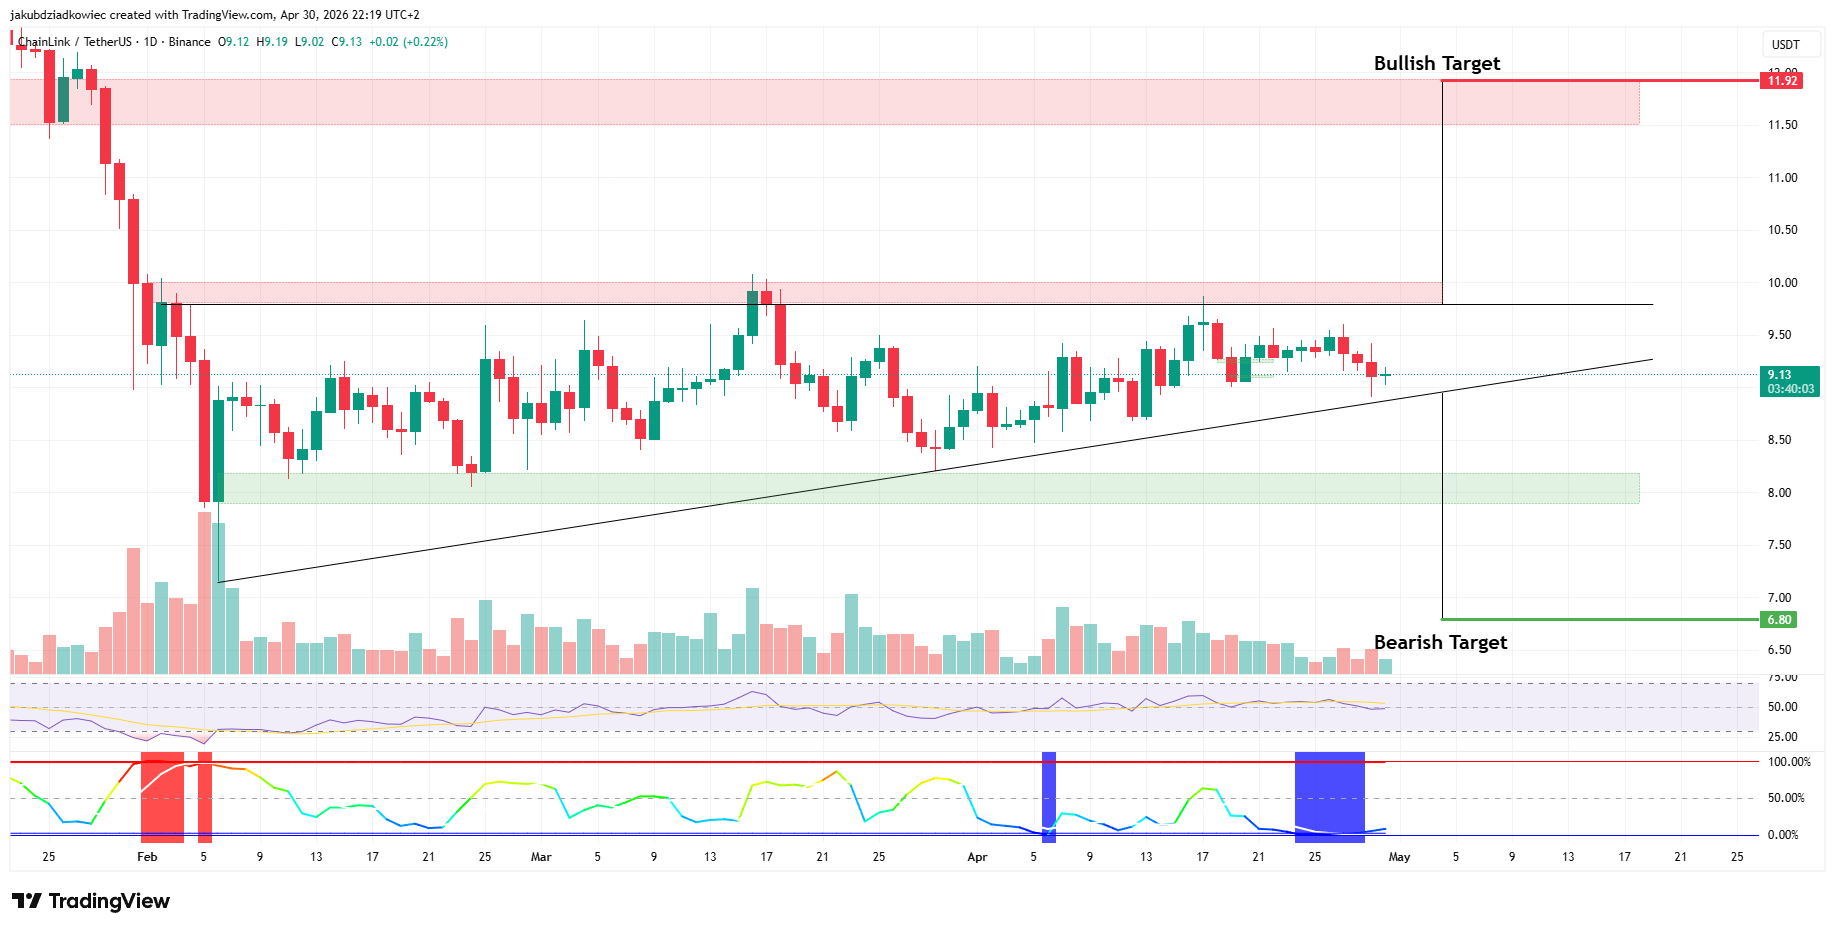
Chainlink (LINK) trades around $9.13 after pulling back from its August 2025 swing high near $31. The weekly chart shows a maturing accumulation pattern that began in January 2026, with main support sitting between $5.50 and $7.50.
The first overhead barrier holds at $13, while the next supply zone sits between $17 and $18. Weekly RSI bottomed in early 2026 and is curling back toward 50. BBWP prints stacked blue bars that flag a compression setup before expansion.

Zooming in on the daily timeframe, LINK has formed an ascending triangle since February. Price defends a rising trendline from the $7 low and presses against horizontal resistance at $10.
A confirmed breakout above $10 projects a measured move toward $11.92, the bullish target marked on the chart. A breakdown of the rising trendline opens the path to $8, with $6.80 as the bearish target.
Daily volume contracts in tandem with BBWP, which signals that an expansion move is close. Daily RSI hovers near 50, confirming neutral momentum.
The fundamental driver in May is the OpenAssets partnership announced in April. The deal routes tokenization flow from ICE, Tether, Fanatics, and Mysten Labs through Chainlink oracles.
The CCIP v1.5 mainnet rollout and a $644 million buyback program reinforce this real-world asset narrative if the daily triangle resolves higher.
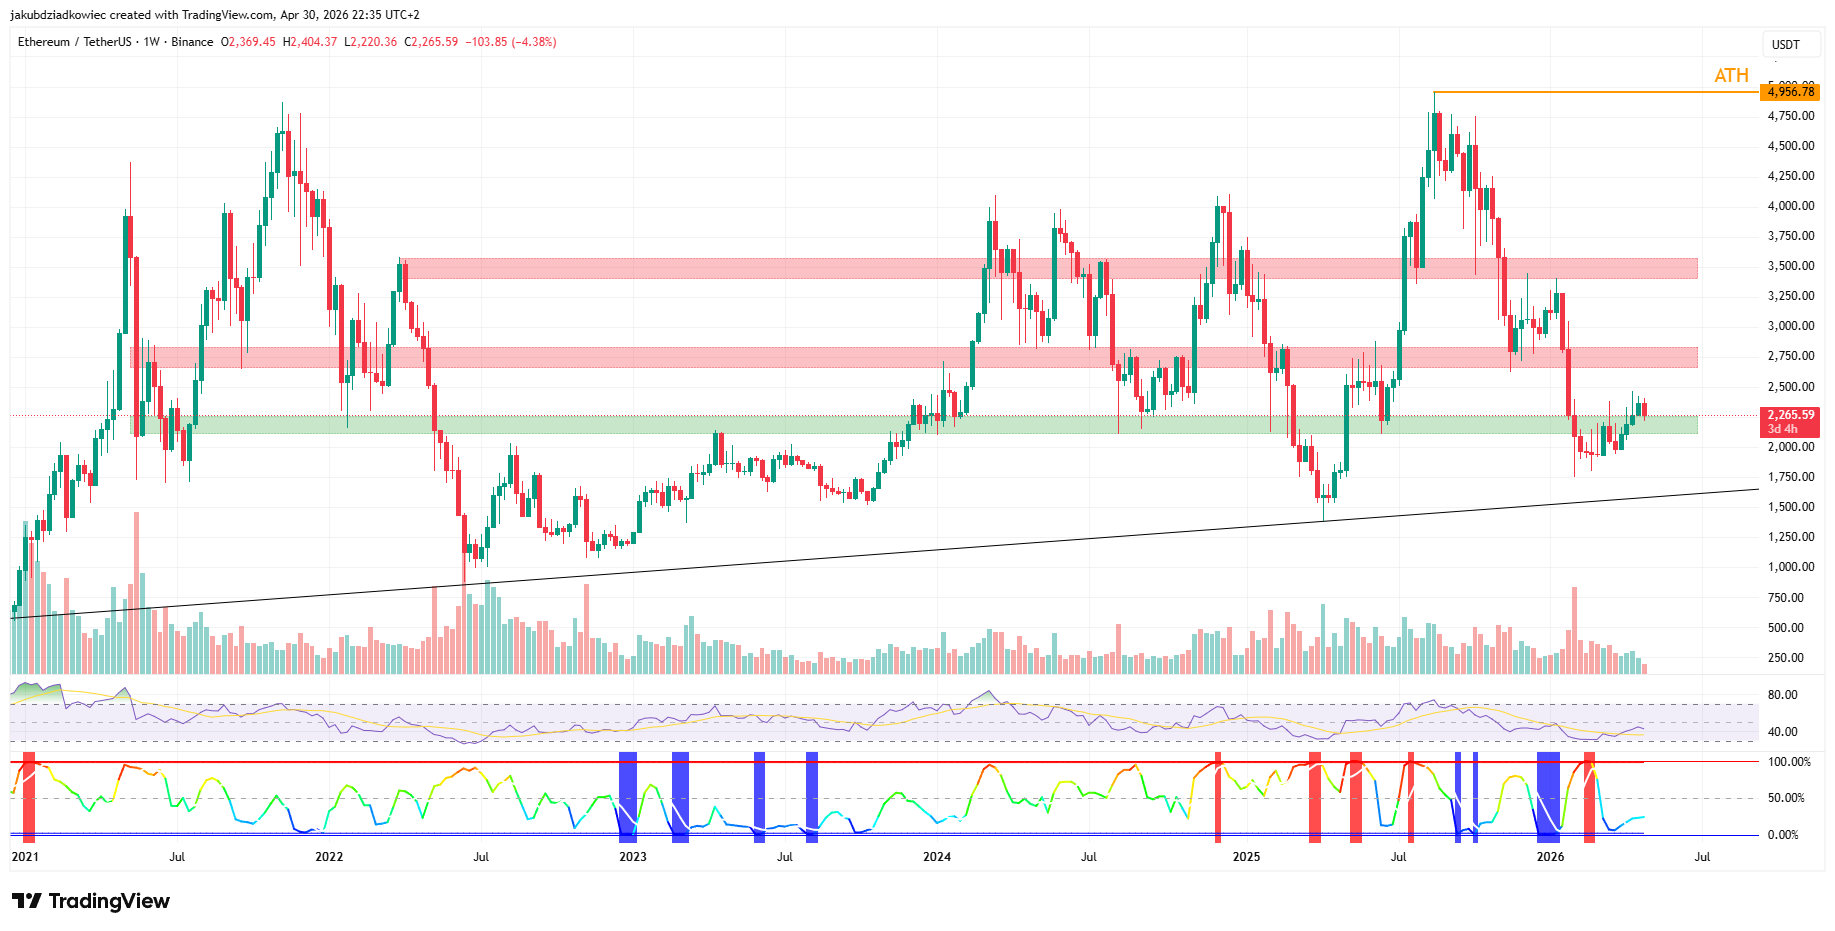
Ethereum (ETH) Defends $2,200 With a Daily Channel
Ethereum (ETH) trades near $2,265 after a sharp correction from the August 2025 all-time high at $4,956. The weekly chart bottomed at $1,748 on February 2 and has since reclaimed the $2,200 support shelf.
Overhead, the next major resistance sits at $2,701, with the deeper supply band between $3,400 and $3,600. A loss of $2,200 exposes a long ascending trendline support near $1,600, drawn from cycle lows.
Weekly RSI is climbing back toward the neutral zone, while BBWP flashes low-volatility blue bars. Both readings hint at a coiled-spring setup before a directional move.
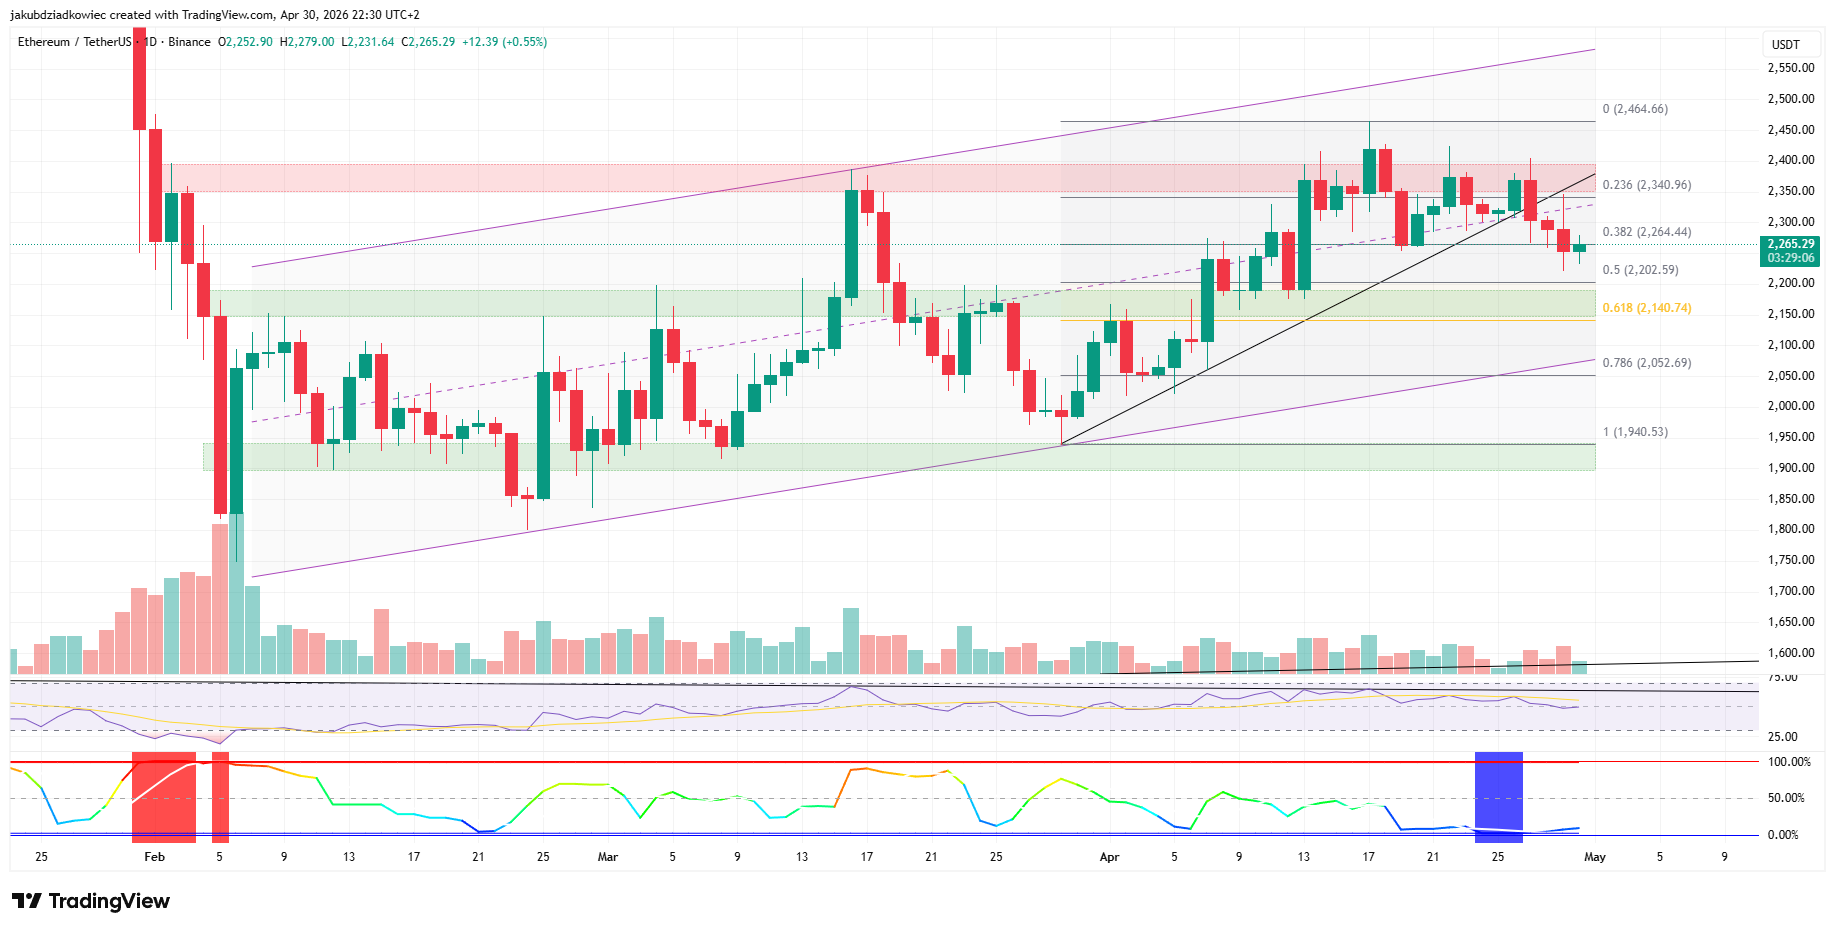
On the daily timeframe, ETH has traded inside an ascending parallel channel since the February low. Price now sits at the 0.382 Fibonacci retracement at $2,264, with channel support flexing through $2,200.
The most important short-term resistance is $2,400, which aligns with the prior pivot supply. A break below the 0.618 retracement at $2,140 would weaken the bullish case and put $2,000 back in play.
Daily volume has thinned, BBWP prints below-normal bars, and RSI sits below its descending trendline near 50. Volatility compression continues to build.
The structural catalyst is the lagged effect of the Fusaka upgrade, activated December 3, 2025. Fusaka raised blob capacity from 6 to 48 per block and lifted the gas cap to 150 million.
Layer 2 fees have collapsed since, fueling renewed DeFi throughput, while the Glamsterdam fork, tentatively scheduled for mid-2026, adds a further bullish accelerant.
Kaspa (KAS) Sets Up Inside a Long-Term Falling Wedge
Kaspa (KAS) trades around $0.0325 after a deep drawdown from its 2024 peak above $0.20. The weekly chart shows a maturing falling wedge that has compressed price action since late 2024.
Falling wedges resolve higher in most cases, and a confirmed breakout would target $0.054 first, then $0.075. Main support sits near $0.030, the floor that has contained price since January 2026.
Weekly volume is contracting, and BBWP shows persistent low-volatility bars. RSI broke above its descending trendline, and KAS now retests that line as new support.
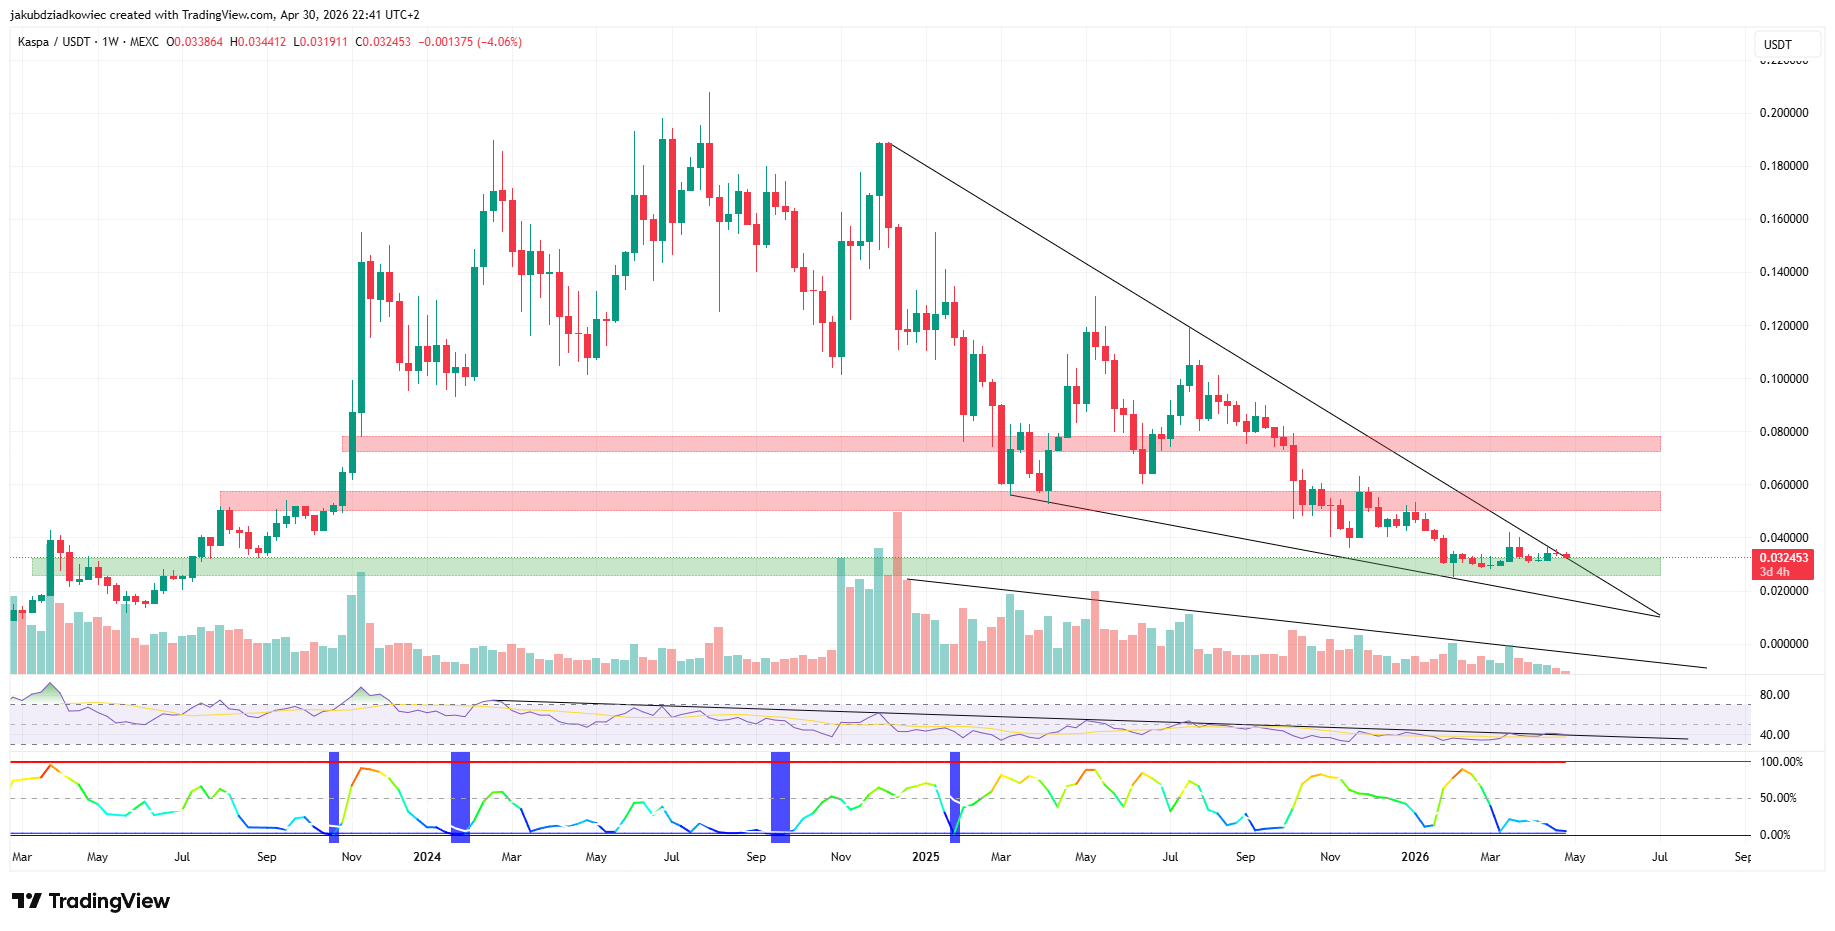
The Toccata hard fork is the headline catalyst, with mainnet activation scheduled for June 5-20, 2026. The upgrade introduces native KRC-20 tokens, programmable covenants via the Silverscript compiler, and base-layer zero-knowledge verification.
Pre-fork accumulation often frontruns these activations, which means May offers the cleanest window before the move prices in.
Sui (SUI) Tests the Lower Edge of a Yearlong Range
Sui (SUI) trades near $0.91 after a steep correction from its 2025 all-time high above $5.30. Price has spent the entire year of 2026 grinding around $0.90 on the same support shelf.
A breakdown opens a deep dive toward the 1.0 Fibonacci extension at $0.355. A successful defense flips the chart, with the 0.786 retracement at $1.43 acting as the first bullish target.
Above that, the 0.618 golden pocket level at $2.27 completes the upside roadmap. BBWP shows low volatility, while weekly RSI hovers near oversold and has not yet flipped bullish.
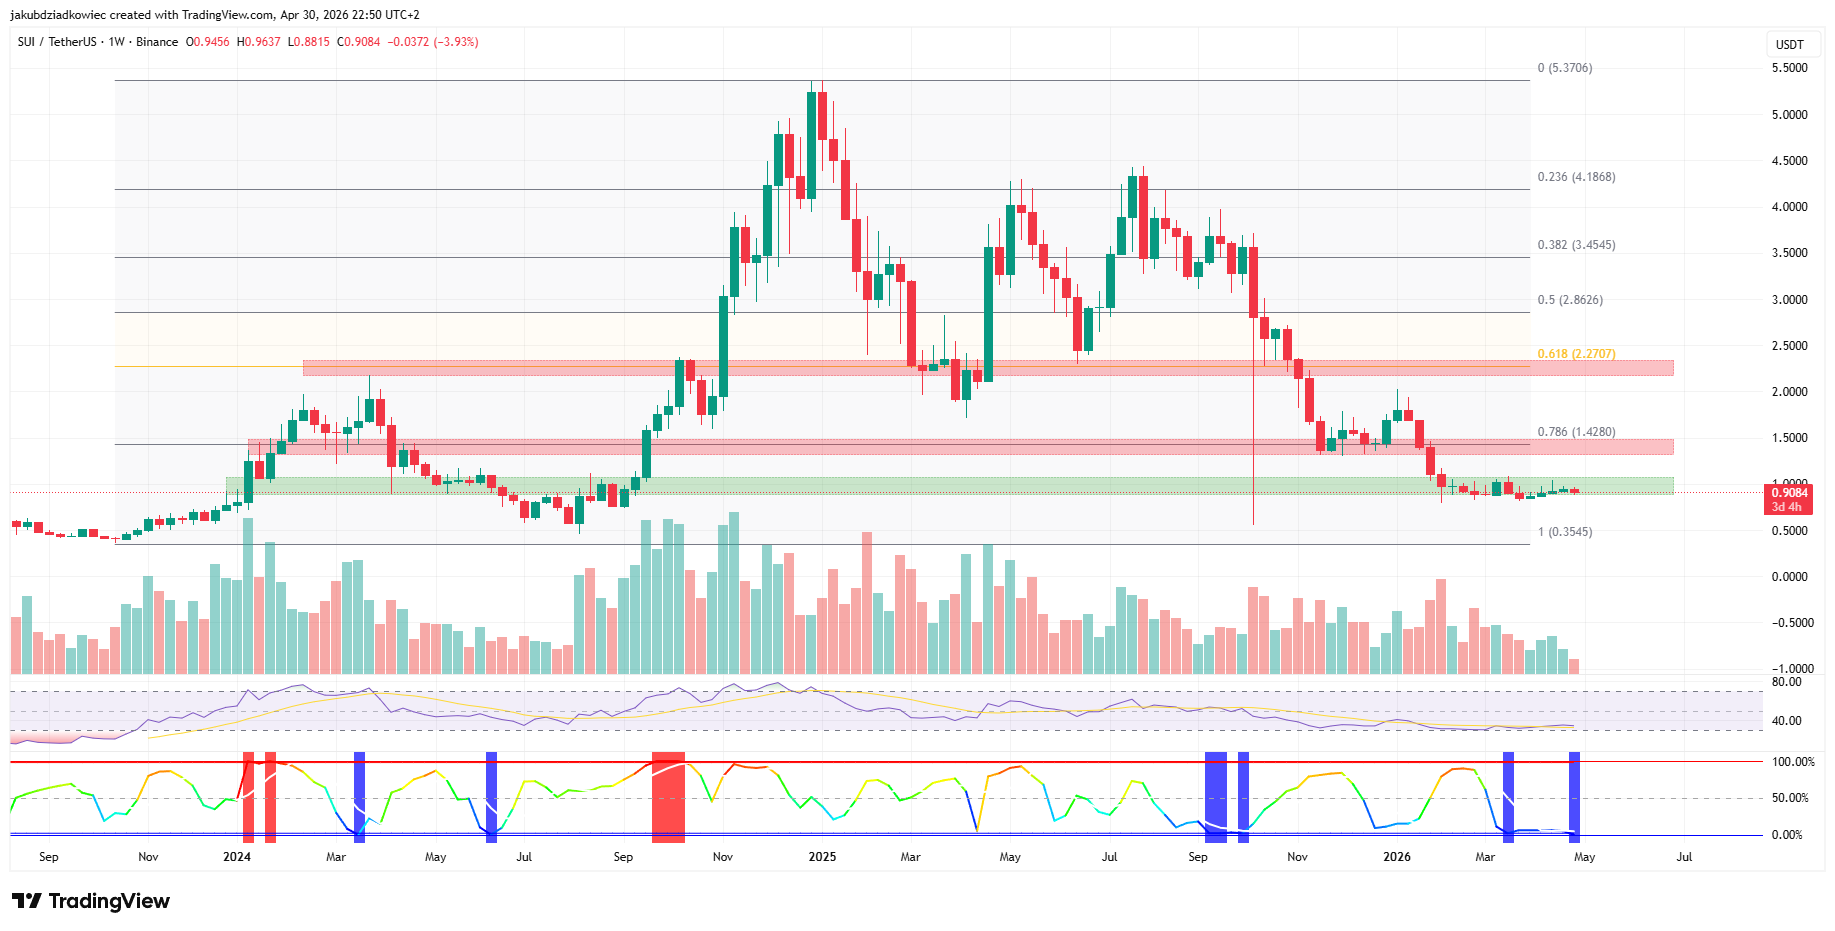
The headline catalyst lands inside the trading window. CME Group launches regulated SUI futures on May 4, 2026, opening a direct institutional rail.
Layered on top, the Grayscale Sui Trust S-1 filing and the 21Shares 2x SUI ETF launch tighten the structural bid through May.
NEAR Protocol (NEAR) Approaches a Multi-Year Resistance Trendline
NEAR Protocol (NEAR) trades at $1.30 after months of basing inside its long-term support zone. Price compresses against a multi-year descending trendline that connects the 2022 high near $20 with the 2024 lower high.
A clean breakout would clear the way to the first target at $3.30, a confluence of support and resistance levels. The second target sits near $8, the double-peak zone formed in March and December 2024.
BBWP prints low volatility, and the weekly RSI is testing its own descending trendline. A break of that RSI line typically precedes a strong directional move.
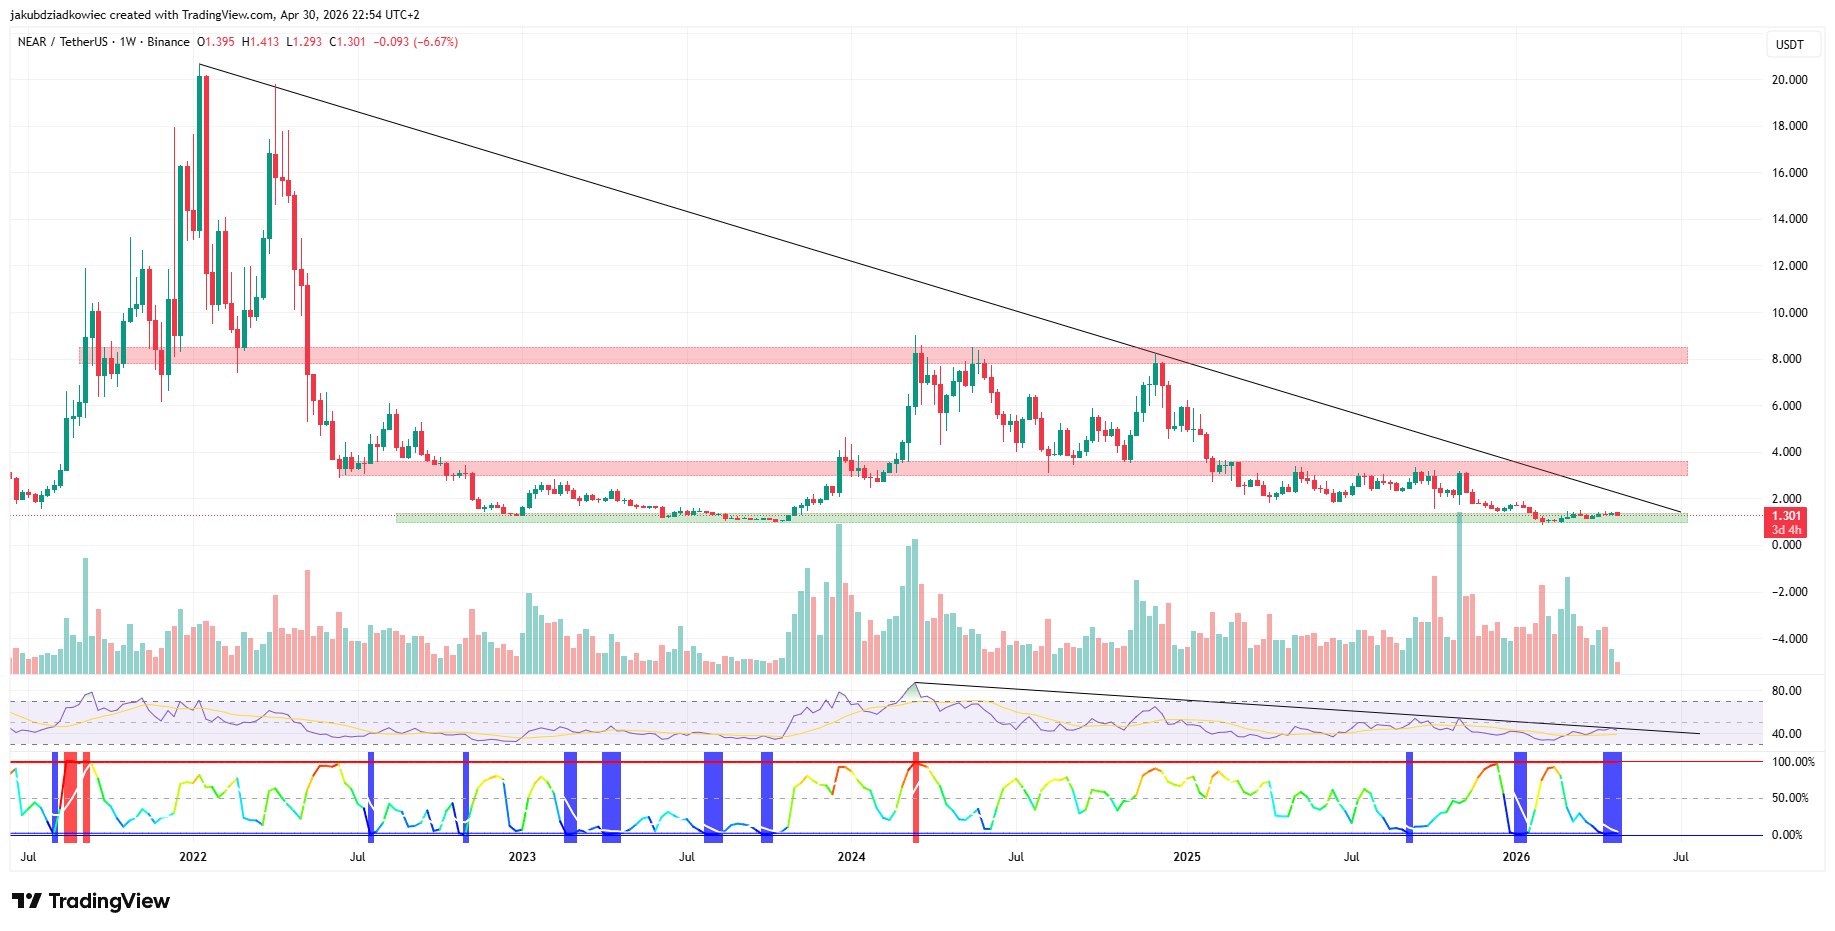
The narrative engine for NEAR is its pivot to user-owned AI, summarized in Messari project research.
The 2026 roadmap prioritizes scaling toward one million transactions per second alongside AI-Intents, and recent launches such as IronClaw, NEAR AI Cloud, and a TEE-secured GPU marketplace already reach more than 100 million users. Pending spot NEAR ETF filings from Grayscale and Bitwise sit as a wildcard upside trigger.
Why These Altcoin Setups Matter Heading Into May 2026
All five charts show a common signature. Each name compresses with thinning volume and stacked BBWP blue bars. RSI is either bottoming or pressing key trendlines in every case.
The coins also share clustered fundamental triggers stacked into a single calendar window. That kind of overlap is unusual across altcoins at the same time.
Whether to “sell in May and go away” still depends on whether macro flows cooperate. If Bitcoin holds its consolidation and the Federal Reserve continues to reprice, May could mark the rotation traders have been circling.
If macro turns hostile, the same compression patterns flip into breakdowns, confirming the seasonal playbook.
The post Top 5 Altcoin Setups For May 2026 appeared first on BeInCrypto.
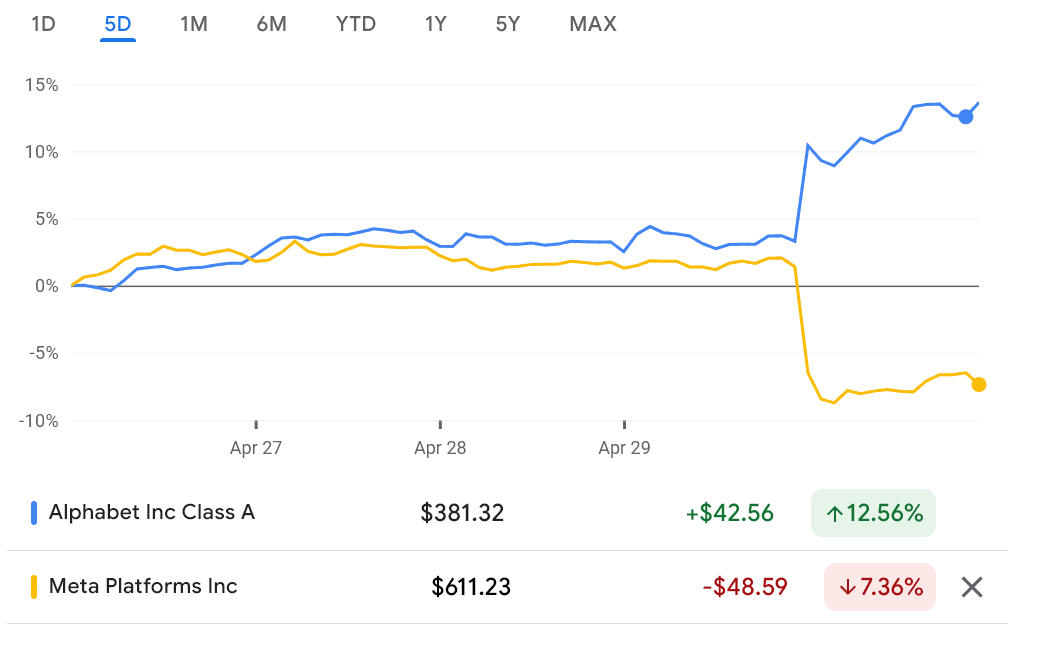
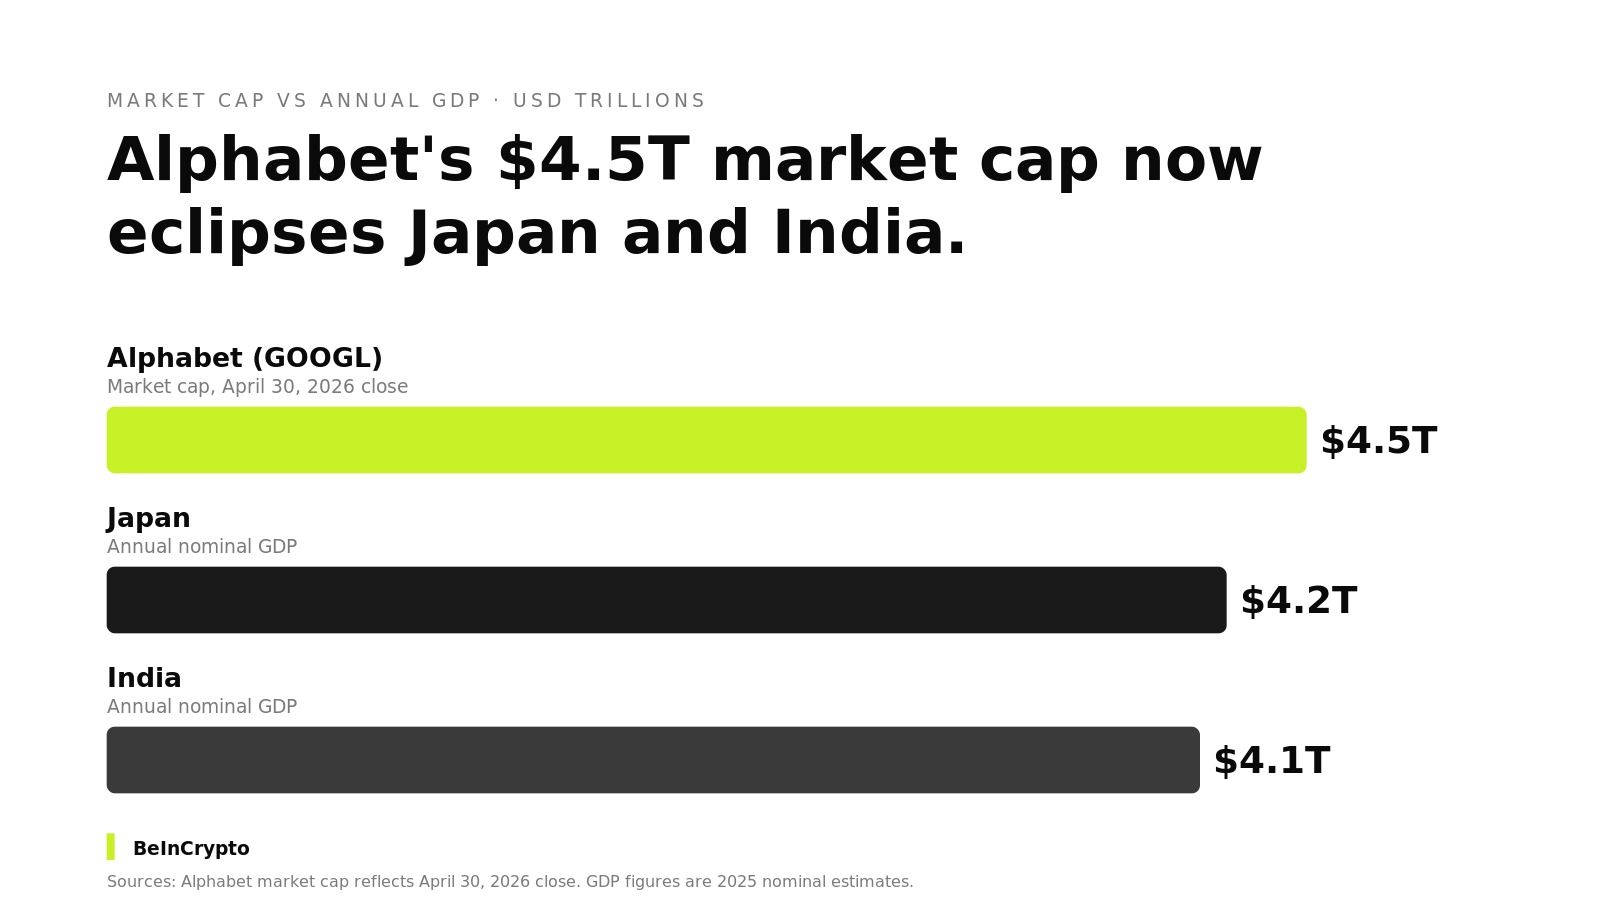
Alphabet (GOOGL) added more than $300 billion in market value on April 30, 2026, lifting its capitalization above $4.5 trillion. Meta Platforms (META) shed roughly $175 billion in the same session despite a stronger top-line beat.
Both companies reported Q1 2026 results after the close on April 29. Investors rewarded Google for visible AI revenue while punishing Meta for its heavier capital-spending guidance.

Cloud Revenue Carried the Beat
Google Cloud reported $20 billion in revenue for Q1, up 63% year over year. Backlog climbed to more than $460 billion, nearly doubling sequentially. Enterprise AI demand is running well ahead of supply.
“Google Cloud saw a meaningful acceleration in growth as revenues increased 63% to $20.0 billion, led by an increase in Google Cloud Platform (GCP) across enterprise AI Solutions and enterprise AI Infrastructure, as well as core GCP services,” read an excerpt in the announcement.
Search queries reached an all-time high during the quarter on the back of Gemini integration. Consumer AI subscriptions topped 350 million. Alphabet also raised its dividend by 5%.
Q1 capital expenditure landed at $35.7 billion. The company lifted full-year 2026 capex guidance to $180 billion – $190 billion, with 2027 spending flagged as “significantly higher.”
Markets absorbed the increase because cloud revenue is already converting that spend into bookings. In this regard, positive sentiment translated into buyer interest, pushing Google’s market cap above $4.5 trillion, adding over $300 billion in one day.
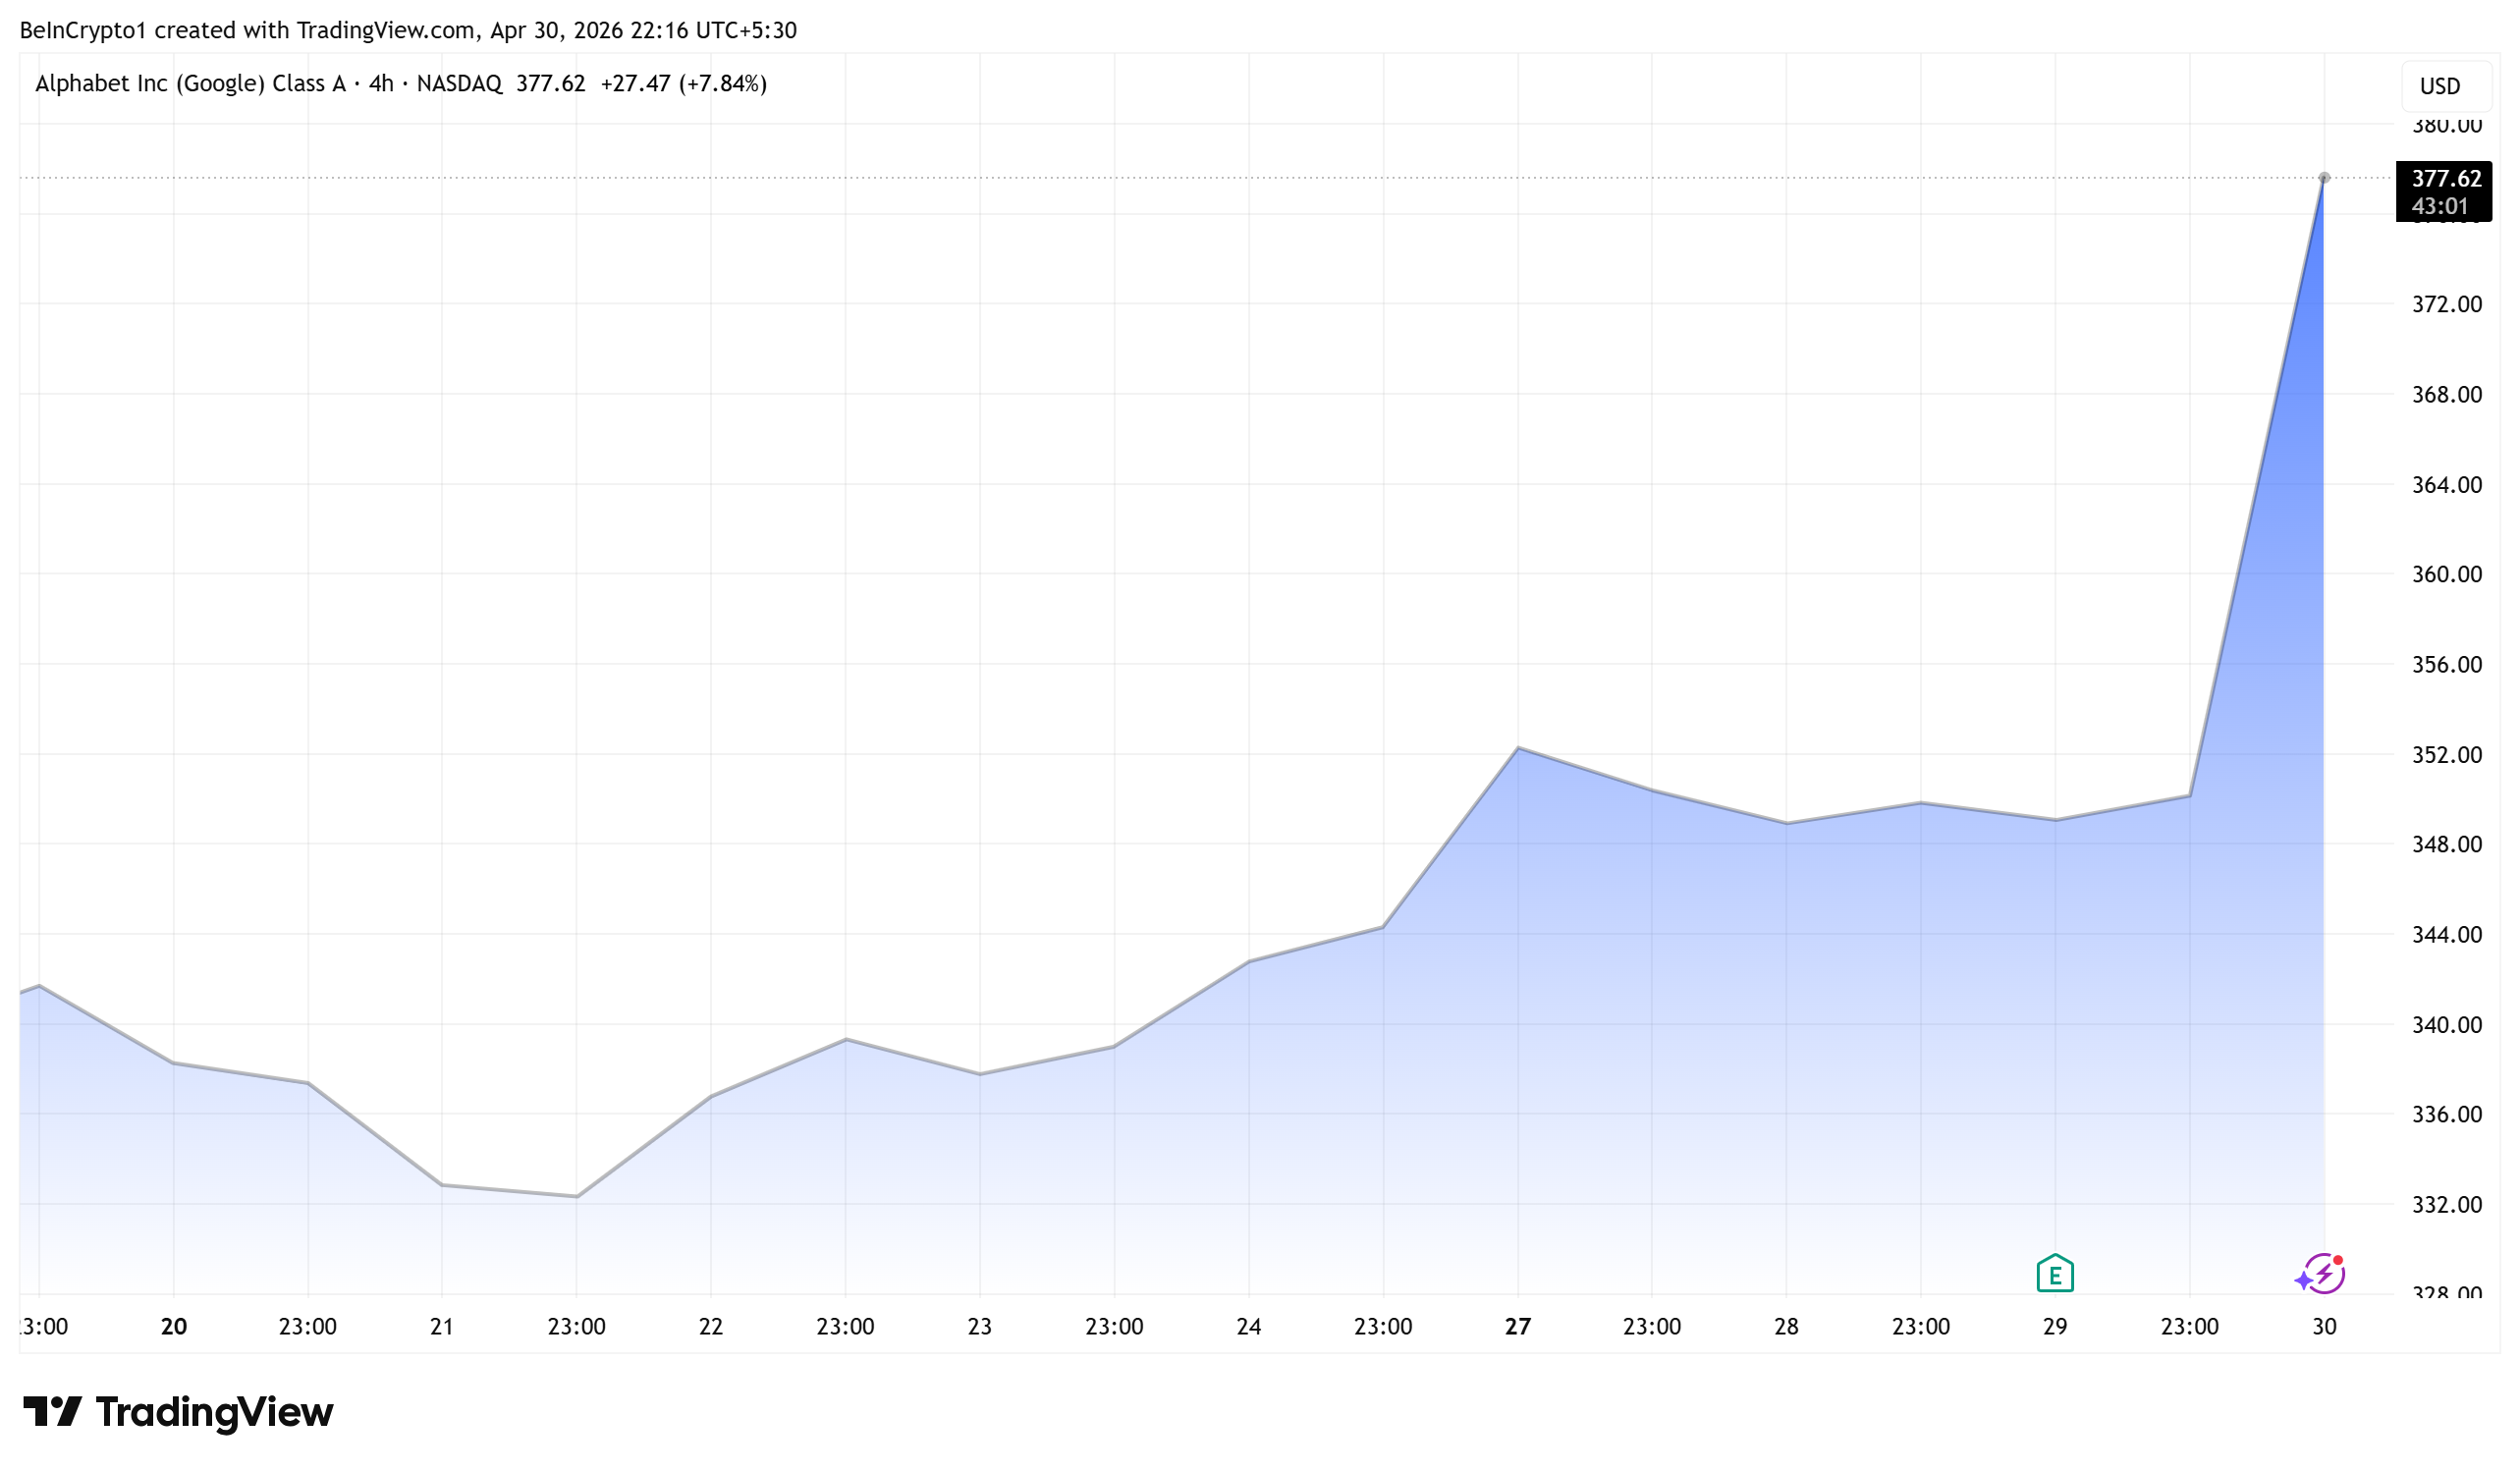
As of this writing, Google’s Alphabet stock was trading for $377.62, marking a new all-time high.
In contrast, markets punished Meta for its more aggressive capital-spending guidance.
Bigger Than Two of the World’s Top Economies
Alphabet’s $4.5 trillion valuation now eclipses the annual GDP of Japan and India. Japan’s economy runs near $4.2 trillion, and India’s at $4.1 trillion. A single US-listed company now sits above two of the world’s largest national economies.
Alphabet’s 2026 spend will pour into the same data-center economy where Bitcoin (BTC) miners compete. Power, GPUs, and grid capacity are now contested directly by hyperscalers.
Several listed miners have already pivoted toward AI hosting contracts. The shift blurs the line between proof-of-work mining and AI cloud hosting.
Google’s $300 billion single-session gain alone exceeded the combined market value of most major altcoins outside Bitcoin and Ethereum (ETH). The print shows how aggressively capital is rotating into AI infrastructure stories this cycle.
The question is whether AI capex spills into compute tokens, public miners, and decentralized GPU networks. Meta’s drop shows markets still want returns, not just spend.
The post How US Stock Markets Rewarded Google But Punished Meta After Q1 Earnings appeared first on BeInCrypto.

Key Insights
- Dogecoin has solid support at $0.095 amid increased whale accumulation.
- Open interest in futures contracts surges to $1.37 billion.
- A breakout above $0.1018 may lead to gains up to $0.1172.
Dogecoin Firm Above Crucial Support Zone
Dogecoin keeps pushing above the important resistance level at $0.095 after experiencing significant corrective moves to the downside over the past weeks. The meme coin, which has corrected about 60% off its October price high, is demonstrating some signs of stabilization.
In terms of price movement, the digital asset has been quite flat over the last few days, implying that traders might be waiting for a breakout on either side. In particular, the coin is above its crucial 50-day exponential moving average near $0.0958.
$0.10 Resistance Becomes Dominant Obstacle
The immediate obstacle for Dogecoin is found at the psychologically important $0.10 area. The area is buttressed by a downtrend line traced from earlier highs in January and April, rendering it as an essential resistance level.
The momentum oscillators are starting to favor the bulls. The RSI oscillator is now at 56, pointing to increased buying interest without being overbought. On the other hand, the MACD oscillator is slightly in positive territory, showing that the buyers continue to dominate.
A breakout above the resistance level, accompanied by high trading volume, would signal the start of the breakout process.
Increase in Whale Holdings Indicates Increasing Confidence
Data on-chain shows an increasing trend in whale activity. The number of whales with holdings ranging from 1 million to 100 million DOGE has grown to 4,920 from 4,872 recorded earlier this year.
The fact that there is an increasing number of whale holders while the price range of the token remains unchanged indicates that there is a lot of accumulation going on.
It is important to note that accumulation always precedes price movements in any asset, and this further strengthens the bull case for Dogecoin.
Bull Case Supported by Futures Trading Volume
More evidence from derivatives is found which strengthens the bullish case for Dogecoin. As reported by CoinGlass, the total open interest volume in Dogecoin futures now stands at $1.37 billion, having increased by 3% in just one day.
The funding rate is also currently 0.0051%, implying that traders who hold long positions are paying a premium to hold their positions.
Breakout Levels and Price Objectives
Market expert Ali Martinez sees the significant level at which a breakout should occur at $0.1018. A bullish confirmation can be achieved by closing above this level for 4 hours with more volume participation.
In case of a breakout above the level mentioned, $0.1172 will be a target price, coinciding with the channel resistance. After that, attention should shift to psychologically important levels of $0.15, $0.20, and possibly even $0.25.
But the Risks Are There to Consider
While the upside appears promising, downside risks still have to be considered. A breach of the $0.095 mark that acts as the 50-day moving average will dampen bullish sentiment.
In this case, traders will aim to test lower support marks at $0.087 and even the February low of $0.080. This will serve as a fallback position, but it will indicate a reversion to bearish trends.
Dogecoin: At an Important Turning Point
At present, Dogecoin finds itself at a crucial point where technical support, whale hoarding, and futures activity come together. With the $0.10 level still acting as the key resistance.
Any breakout to the upside will open doors to substantial gains.
Until then, all eyes will be on DOGE as it consolidates within a narrowing trading range.


The partnership aims to make it easier for companies, including fintechs and paying firms, to issue compliant stablecoins in the United States.

Vistance Networks, Inc. (VISN) Q1 2026 Earnings Call Transcript

BeInCrypto Institutional Research: 15 Multi-Asset Brokers Integrating Crypto Trading

Politics Home Article | Tony Blair Think Tank Calls For Scrapping The Triple Lock
Manchester United reach agreement with Casemiro over contract clause amid transfer speculation

US brings back mandatory military draft registration

Steven Gerrard disagrees with Gary Neville over ‘shock’ Chelsea and Arsenal claim | Football


-
 Tech3 days ago
Register Renaming | Hackaday
-

 Fashion6 days ago
Weekend Open Thread – Corporette.com
-
 Crypto World5 days ago
Hyperliquid $HYPE Rally Builds Momentum as AI Sector Enters Prove-It Phase
-
 Politics3 days ago
Drax board avoid their own AGM, accused of greenwashing & environmental racism
-
 Business7 days ago
Patterson-UTI Energy, Inc. (PTEN) Q1 2026 Earnings Call Transcript
-
 Sports4 days ago
IPL 2026: Ruturaj Gaikwad registers slowest fifty of the season, enters all-time unwanted list | Cricket News
-

 NewsBeat5 days ago
LK Bennett closes all stores after entering administration
-

 Tech4 days ago
Why Blue Badges Disappeared From Toyota Hybrids
-

 Crypto World7 days ago
Michael Saylor says BTC winter is over. Market analyst disagrees, says bitcoin was in a pullback
-

 Fashion2 days ago
Kylie Jenner’s KHY Enters a New Era with ‘Born in LA’
-

 Tech3 days ago
Images of Samsung’s rumored smart glasses have leaked
-
 Entertainment5 days ago
Mariah Carey Slams Deposition Claims In Brother’s Lawsuit
-

 Business2 days ago
Most Commercial Energy Audits Miss the Real Losses
-
 NewsBeat7 days ago
Trump threatens to review UK’s claim to Falkland Islands and punish Nato allies over Iran war disagreement
-
 Business6 days ago
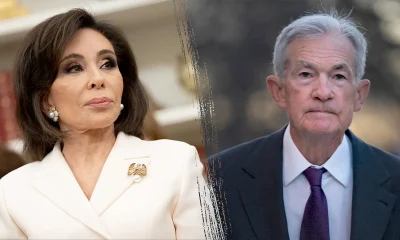
Jeanine Pirro announces closure of Federal Reserve building cost probe
-

 Business3 days ago
(VIDEO) Charlize Theron Climbs Times Square Billboard to Promote New Netflix Thriller ‘Apex’
-

 Tech5 days ago
Microsoft to roll out Entra passkeys on Windows in late April
-

 Crypto World2 days ago
CFTC’s AI will review U.S. crypto registration applications, chairman tells CoinDesk
-
 Crypto World6 days ago
Nvidia (NVDA) Stock Jumps 5% as Intel Earnings Ignite Semiconductor Rally
-

 Tech5 days ago
OpenAI’s Sam Altman apologizes for not reporting ChatGPT account of Tumbler Ridge suspect to police
You must be logged in to post a comment Login