
Crypto World
Ethereum Reclaims $2K Level, Bitcoin Recovery Halted at $72K: Weekend Watch
Meanwhile, XRP and SOL are among the top performers today, with notable increases following the latest market crash.
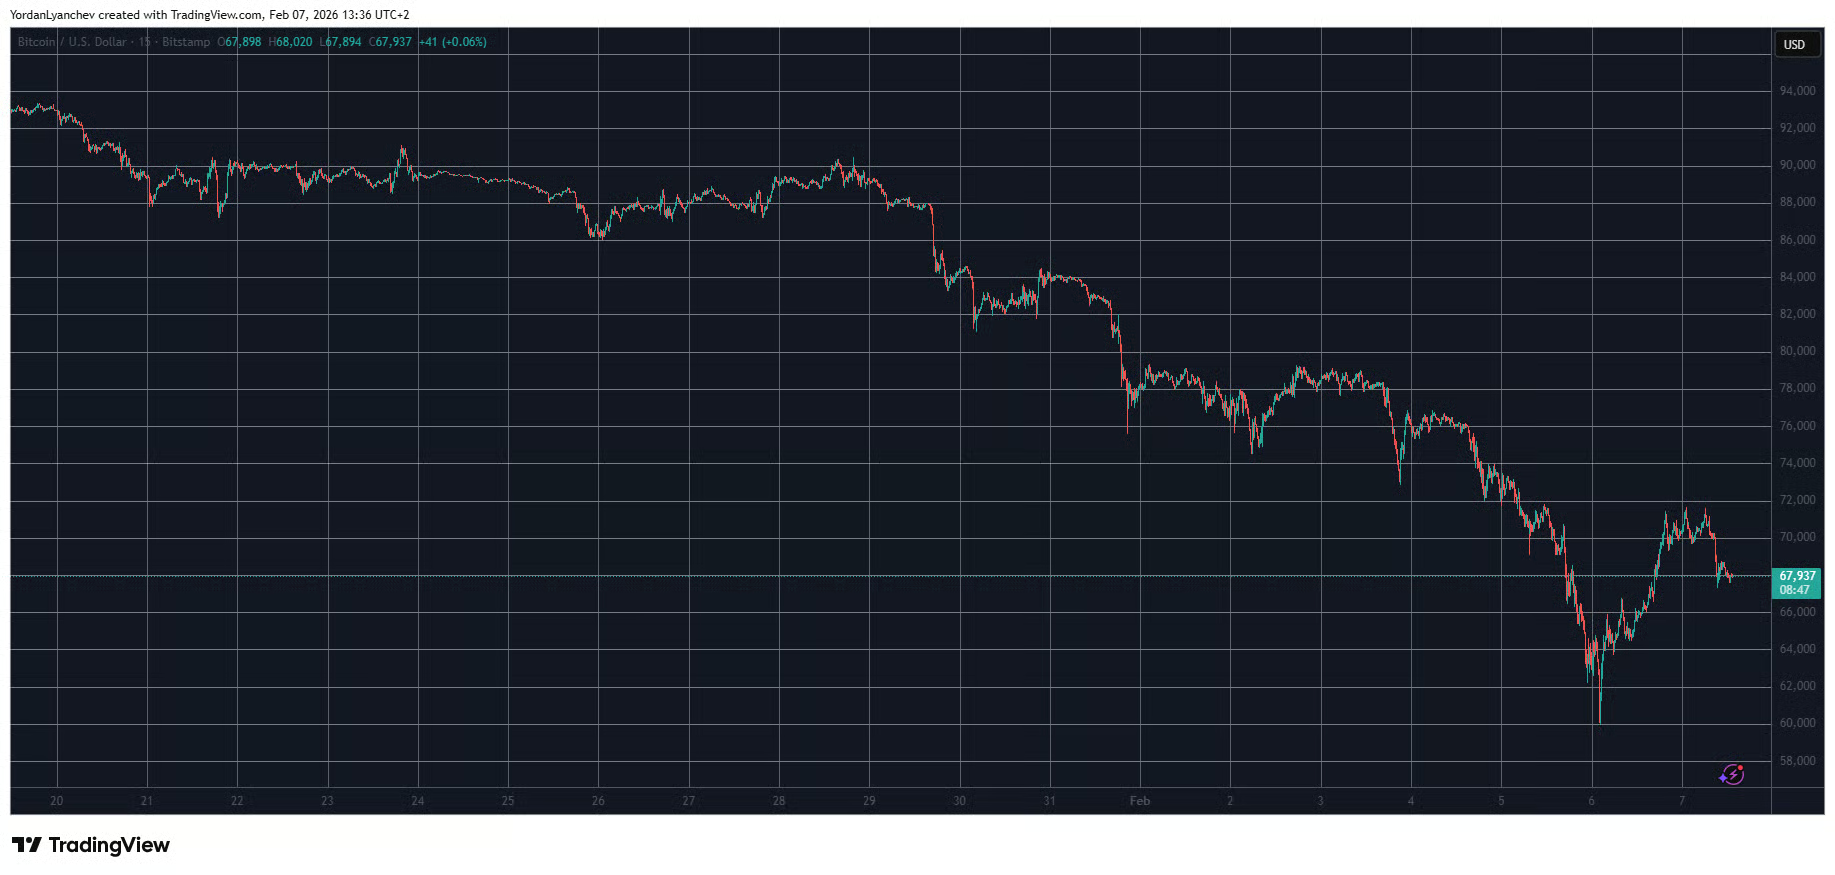
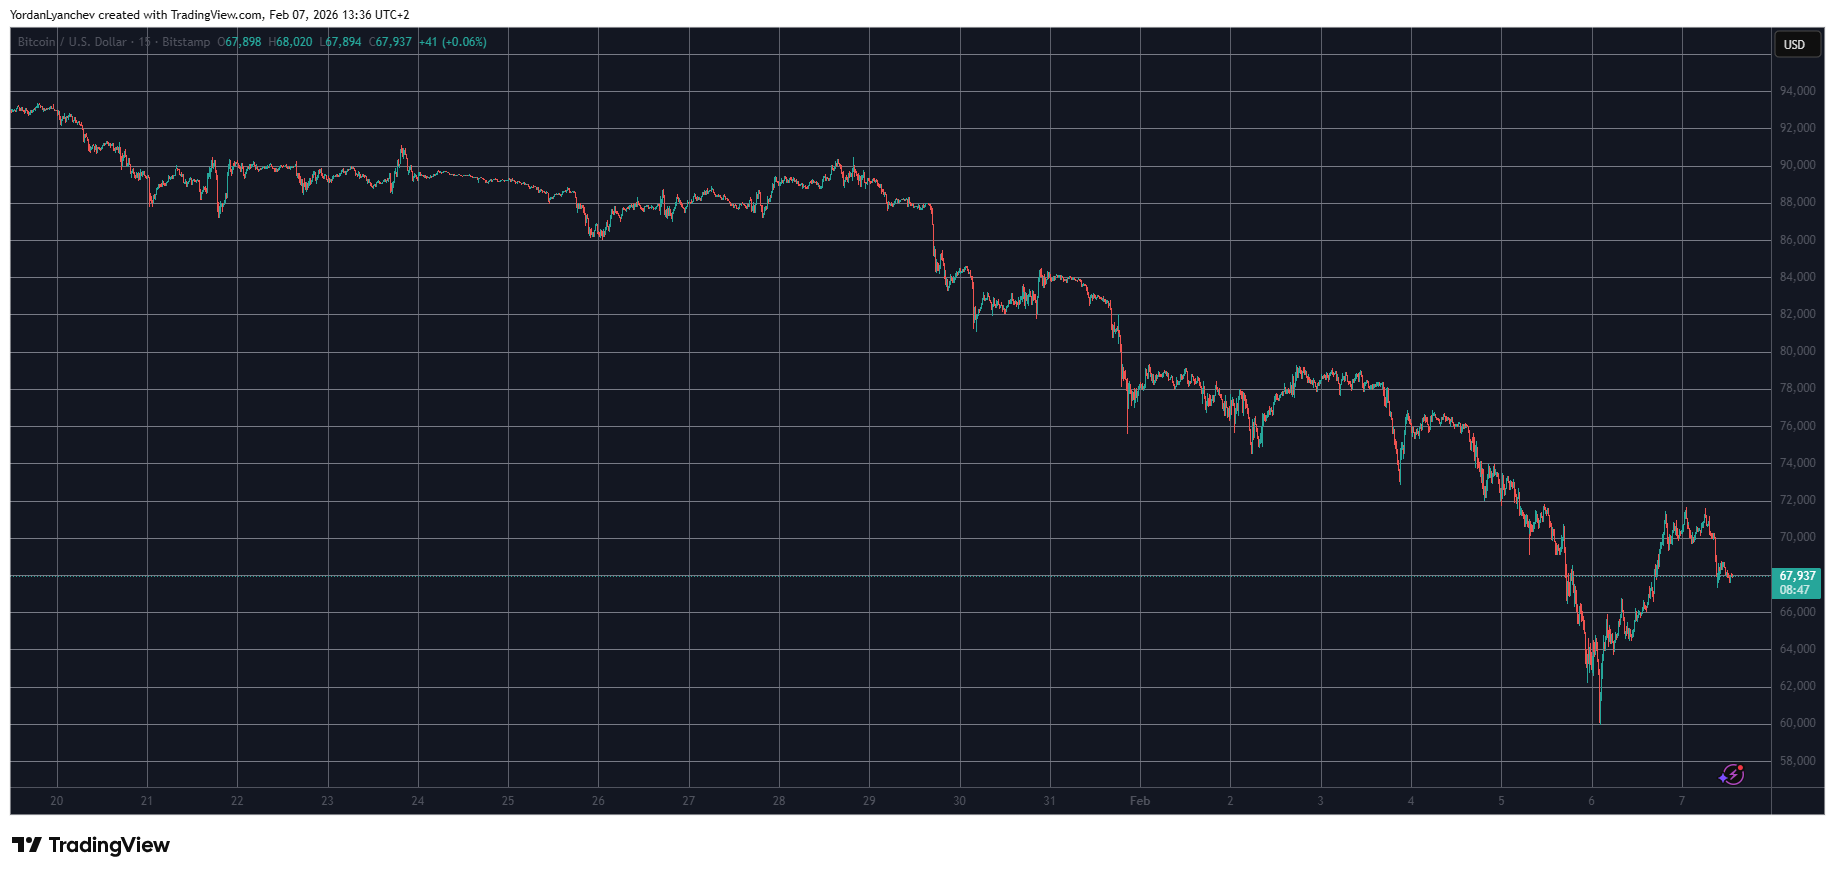
Bitcoin’s price volatility only intensified at the end of the business week as the asset dumped to a multi-month low before it staged an impressive five-digit recovery that was stopped at $72,000.
Most altcoins are well in the green on a daily scale, but the weekly charts are still painful. Nevertheless, many have bounced off the multi-year lows they posted yesterday.
BTC Stopped at $72K
There’s no valid way to sugarcoat what happened in the crypto markets in the past week or so. Just last Saturday, the primary digital asset dumped from $84,000 to under $76,000 in what’s usually a highly uneventful day. Although that was a painful crash on its own, it wasn’t the end of BTC’s struggles.
The asset dipped once again to under $74,000 at the beginning of the business week, but the actual calamity took place on Thursday and culminated on Friday morning.
At the time, BTC plummeted by approximately $17,000 in just over 24 hours from $77,000 to $60,000, which became its lowest price tag since before the US elections in late 2024. After liquidating thousands of traders for billions of dollars, the move south was finally exhausted, and bitcoin actually went on the offensive on Friday evening.
The peak came at almost $72,000, which was tapped on a couple of occasions, but BTC couldn’t break through it. Just the opposite, it was stopped and driven south to $68,000, where it currently sits.
Its market capitalization is down to $1.360 trillion on CG, while its dominance over the alts has slipped to 56.6%.
Alts Try to Rebound
Ethereum was among the poorest performers during the overall crash, dumping from more than $3,000 to under $2,700 in just over a week. It has bounced since then to $2,010 as of press time. SOL, BCH, XMR are also well in the green, followed by XRP, TRX, DOGE, and ADA.
In contrast, the recent high-flyer HYPE has dropped by almost 5% daily and now sits below $33. PUMP and WLFI are also in the red from the larger caps.
The total crypto market cap has recovered over $100 billion since its multi-year bottom on Friday morning and is up to $2.4 trillion on CG.

SECRET PARTNERSHIP BONUS for CryptoPotato readers: Use this link to register and unlock $1,500 in exclusive BingX Exchange rewards (limited time offer).
Disclaimer: Information found on CryptoPotato is those of writers quoted. It does not represent the opinions of CryptoPotato on whether to buy, sell, or hold any investments. You are advised to conduct your own research before making any investment decisions. Use provided information at your own risk. See Disclaimer for more information.


Introduction
The rise of Web3 has sparked a wave of innovation across digital finance, identity, and online interaction. One of the most intriguing developments is SocialFi (Social Finance)—a model that merges social media with blockchain-powered financial systems.
At its core, SocialFi represents a shift in how value is created and distributed online, positioning itself as a natural extension of the broader blockchain industry.
What is SocialFi?
SocialFi combines social networking and decentralized finance (DeFi), allowing users to own, control, and monetize their social interactions.
Unlike traditional platforms, where companies profit from user data and content, SocialFi platforms allow individuals to:
- Earn tokens from content creation and engagement
- Own their digital identity and data
- Participate in governance through decentralized systems
In short, your likes, posts, and influence stop being “free labor” and start becoming financial assets.
The Role of Blockchain in SocialFi
SocialFi would not exist without blockchain. The connection between the two is fundamental and structural—not just complementary.
1. Decentralization
Blockchain removes the need for centralized platforms (like Facebook or X). Instead, SocialFi platforms operate on distributed networks where:
- No single entity controls data
- Users retain ownership of content
- Systems are resistant to censorship
This aligns with blockchain’s core philosophy of trustless, peer-to-peer systems.
2. Tokenization of Social Value
One of the most powerful contributions of blockchain to SocialFi is tokenization.
SocialFi platforms create native tokens that:
- Reward engagement (likes, shares, comments)
- Represent influence or reputation
- Enable trading of social assets (e.g., creator tokens or “keys”)
This turns social capital into financial capital, something impossible in Web2 ecosystems.
3. Smart Contracts and Automation
Blockchain-based smart contracts automate how value flows in SocialFi ecosystems:
- Creators receive instant payments
- Revenue splits happen transparently
- Rewards are distributed without intermediaries
This eliminates reliance on advertisers or platform owners and ensures fair and transparent monetization.
4. Digital Ownership via NFTs
SocialFi also leverages NFTs (non-fungible tokens) to represent:
- Content ownership
- Membership access
- Unique digital identities
This gives users provable ownership of their online presence—something traditional platforms never offered.
5. DAO Governance
Many SocialFi platforms are governed by Decentralized Autonomous Organizations (DAOs), allowing users to:
- Vote on platform changes
- Influence policies
- Shape the ecosystem’s future
This transforms users from passive participants into active stakeholders.
Why SocialFi Matters to the Blockchain Industry
SocialFi is more than just another crypto trend—it addresses one of blockchain’s biggest challenges: real-world adoption.
Bridging Web2 and Web3
SocialFi integrates familiar social media behaviors with blockchain infrastructure, making Web3 more accessible to everyday users.
Expanding Use Cases
Blockchain moves beyond finance (DeFi) into:
- Creator economies
- Community building
- Digital identity systems
Driving Network Effects
Social platforms thrive on user activity. By combining this with blockchain incentives, SocialFi creates self-reinforcing ecosystems where:
- More users → more engagement
- More engagement → more value
- More value → more adoption
Challenges Facing SocialFi
Despite its potential, SocialFi faces several hurdles:
1. Scalability
Blockchain networks can struggle with high transaction volumes, which is critical for social platforms.
2. User Experience
Managing wallets, gas fees, and keys can still feel like solving a puzzle with missing pieces.
3. Security Risks
Some developers and users have raised concerns about vulnerabilities in SocialFi platforms, especially around user data and smart contracts.
4. Regulation
Combining finance and social media raises legal questions around:
- Data privacy
- Financial compliance
- Content moderation
The Future of SocialFi in Blockchain
SocialFi represents a natural evolution of blockchain technology—from purely financial systems to human-centric digital economies.
As infrastructure improves (Layer 2 scaling, better UX, decentralized identity), SocialFi could:
- Disrupt traditional social media giants
- Create new income streams for creators
- Redefine digital ownership and community governance
In the long run, the success of SocialFi may determine whether blockchain becomes a niche financial tool—or the foundation of the next internet.
Finale
The connection between SocialFi and the blockchain industry is deeply intertwined. Blockchain provides the technology, trust, and economic framework, while SocialFi brings human interaction and cultural relevance.
Together, they form a powerful narrative:
A decentralized internet where users don’t just participate—they own, earn, and govern.
REQUEST AN ARTICLE


- TxFlow launches L1 blockchain with 250K TPS for on-chain finance.
- TxFlow DEX goes live with invite-only access and CLOB trading.
- TIP standards enable multi-app finance ecosystem on TxFlow L1.
TxFlow has announced the launch of its Layer 1 blockchain, TxFlow L1, marking the start of a multi-application on-chain finance ecosystem built around its TIP Liquidity Standards.
Alongside the mainnet launch, TxFlow DEX — a central limit order book (CLOB) decentralized exchange for perpetual trading — is now live with invitation-only access as the first application on the network.
Additional applications, referred to as “Channels,” are expected to follow, reflecting a broader vision described by the team as “the blockchain where all finance happens”.
TxFlow L1: High-performance infrastructure for multi-application finance
TxFlow L1 processes over 250,000 TPS on-chain.
Two core architectural decisions drive this performance: DAG-based parallel execution enables high transaction throughput by processing non-conflicting transactions simultaneously, while a multi-threaded pipeline with a state machine supports efficient transaction processing without bottlenecks.
This level of performance is a deliberate architectural requirement to support high-frequency, CLOB-based trading and other demanding financial use cases.
Building on this infrastructure, TIP Liquidity Standards define how applications are constructed and interact within the ecosystem.
These composable trading protocol standards allow developers to create “Channels” by combining TIP modules.
TIP1 covers spot trading, TIP2 derivatives, and TIP3 prediction markets, with additional standards expected as the ecosystem expands.
The design reflects a specific thesis: teams with deep liquidity expertise can build trading applications directly on TxFlow L1, while others can deploy Channels that access existing on-chain liquidity without building it from scratch.
TxFlow L1 is also designed with a long-term focus on AI-driven applications.
TxFlow DEX is now live: Fully on-chain CLOB
TxFlow DEX, the first Channel application on TxFlow L1, is now live with invitation-only access.
Designed as a high-performance central limit order book (CLOB) exchange for perpetual trading, the platform processes over 250,000 transactions per second with one-block finality.
All trading activity — including order placement, cancellation, matching, and liquidation — is executed and settled fully on-chain.
The launch serves as an initial demonstration of TxFlow L1’s ability to support financial applications at production scale.
At launch, the platform includes 13 perpetual markets, as well as Protocol Vaults and User Vaults for liquidity provisioning and strategy deployment. A blockchain explorer provides real-time visibility into on-chain activity.
The broader objective is to support an open ecosystem of financial applications on TxFlow L1, where Channels can interoperate, access shared liquidity, and settle transactions without intermediaries.
Access is currently invitation-only. Onboarding instructions are available at txflow.com.
About TxFlow L1
TxFlow L1 is a high-performance blockchain built for on-chain financial infrastructure, organized around TIP Liquidity Standards that define how financial products are built, composed, and settled on-chain.
TxFlow DEX is the first Channel on TxFlow L1 — a CLOB orderbook DEX for perpetual trading, processing over 250,000 TPS with one-block finality.
TxFlow L1 is designed from the ground up to be AI-native, built for a financial ecosystem where autonomous agents and human traders operate on equal footing.
No investor token allocation. Governance and ownership rest entirely with the community.
Official website: https://txflow.com/
Media contact
Gelsey Birkett
Head of PR
[email protected]
This article is authored by a third party, and CoinJournal does not endorse or take responsibility for its content, accuracy, quality, advertisements, products, or materials. Readers should independently research and exercise due diligence before making decisions related to the mentioned company.
Binance Research’s March 30 Geopolitical and Macro Pulse flagged five converging risk events that could reshape crypto positioning this week, from Middle East escalation to unresolved SEC rulings.
The report landed as the VIX climbed 13.16%, the S&P 500 dropped 1.75%, and the Nasdaq fell 1.93% in a single session, while Brent crude rose 1.19% and Ethereum (ETH) gained 0.96%.
War, Regulation, and Stalled ETF Rulings Hit at Once
USS Tripoli arrived in the Middle East on March 28 carrying 3,500 troops, according to U.S. CENTCOM.
Yemen’s Houthi rebels launched ballistic missiles at Israel the same day, marking their formal entry into the U.S.-Israel war against Iran.
Polymarket odds for a ceasefire by end-April sat at just 32%, while Hormuz Strait normalization trailed at 21%.
The CLARITY Act entered closed-door review in the Senate Banking Committee. Its latest draft bans passive yields on stablecoins, a provision that triggered sharp reactions from issuers.
Circle lost $5.6 billion in market capitalization in a single session after the text surfaced. However, the March 25 Tokenization hearing showed bipartisan support, and a late-April markup remains on the table.
The SEC let the March 27 deadline pass on 91 pending crypto ETF applications without issuing final decisions.
Bloomberg analysts still maintain high approval ratings for Ripple (XRP) and Solana (SOL). Any formal approvals or modest extensions this week warrant close attention.
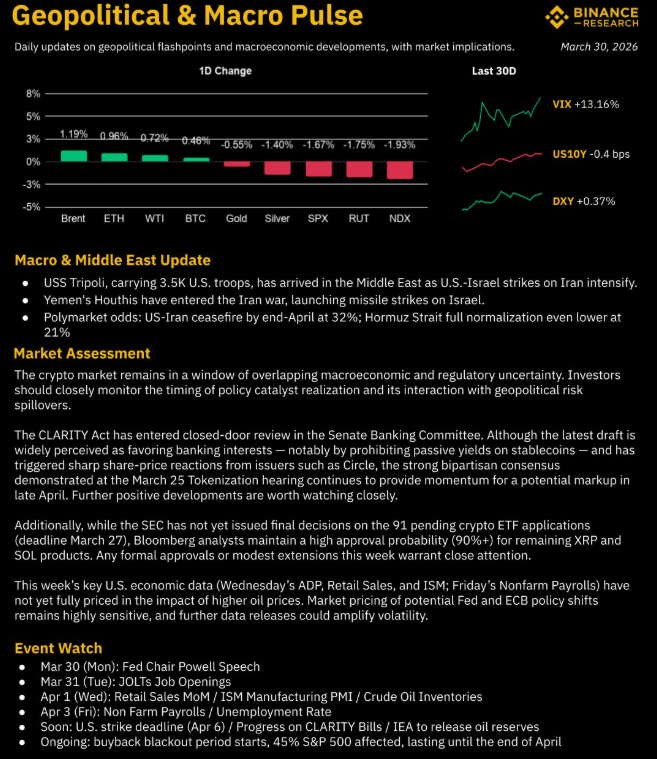
Fed Chair Jerome Powell speaks today, JOLTs data drops Tuesday, and Friday’s Nonfarm Payrolls will test whether markets have priced in rising oil costs.
The buyback blackout season, affecting 45% of S&P 500 firms through late April, removes a key bid for equity.
The post Binance Research Just Dropped 5 Signals Every Crypto Trader Should Fear appeared first on BeInCrypto.
The total meme coin market capitalization has slipped to roughly $36 billion, with every major subsector posting year-to-date losses except one. Four converging signals suggest a recovery remains distant.
The first signal is the breadth of the decline. CoinGecko data paints a grim picture across meme coin categories.
Follow us on X to get the latest news as it happens
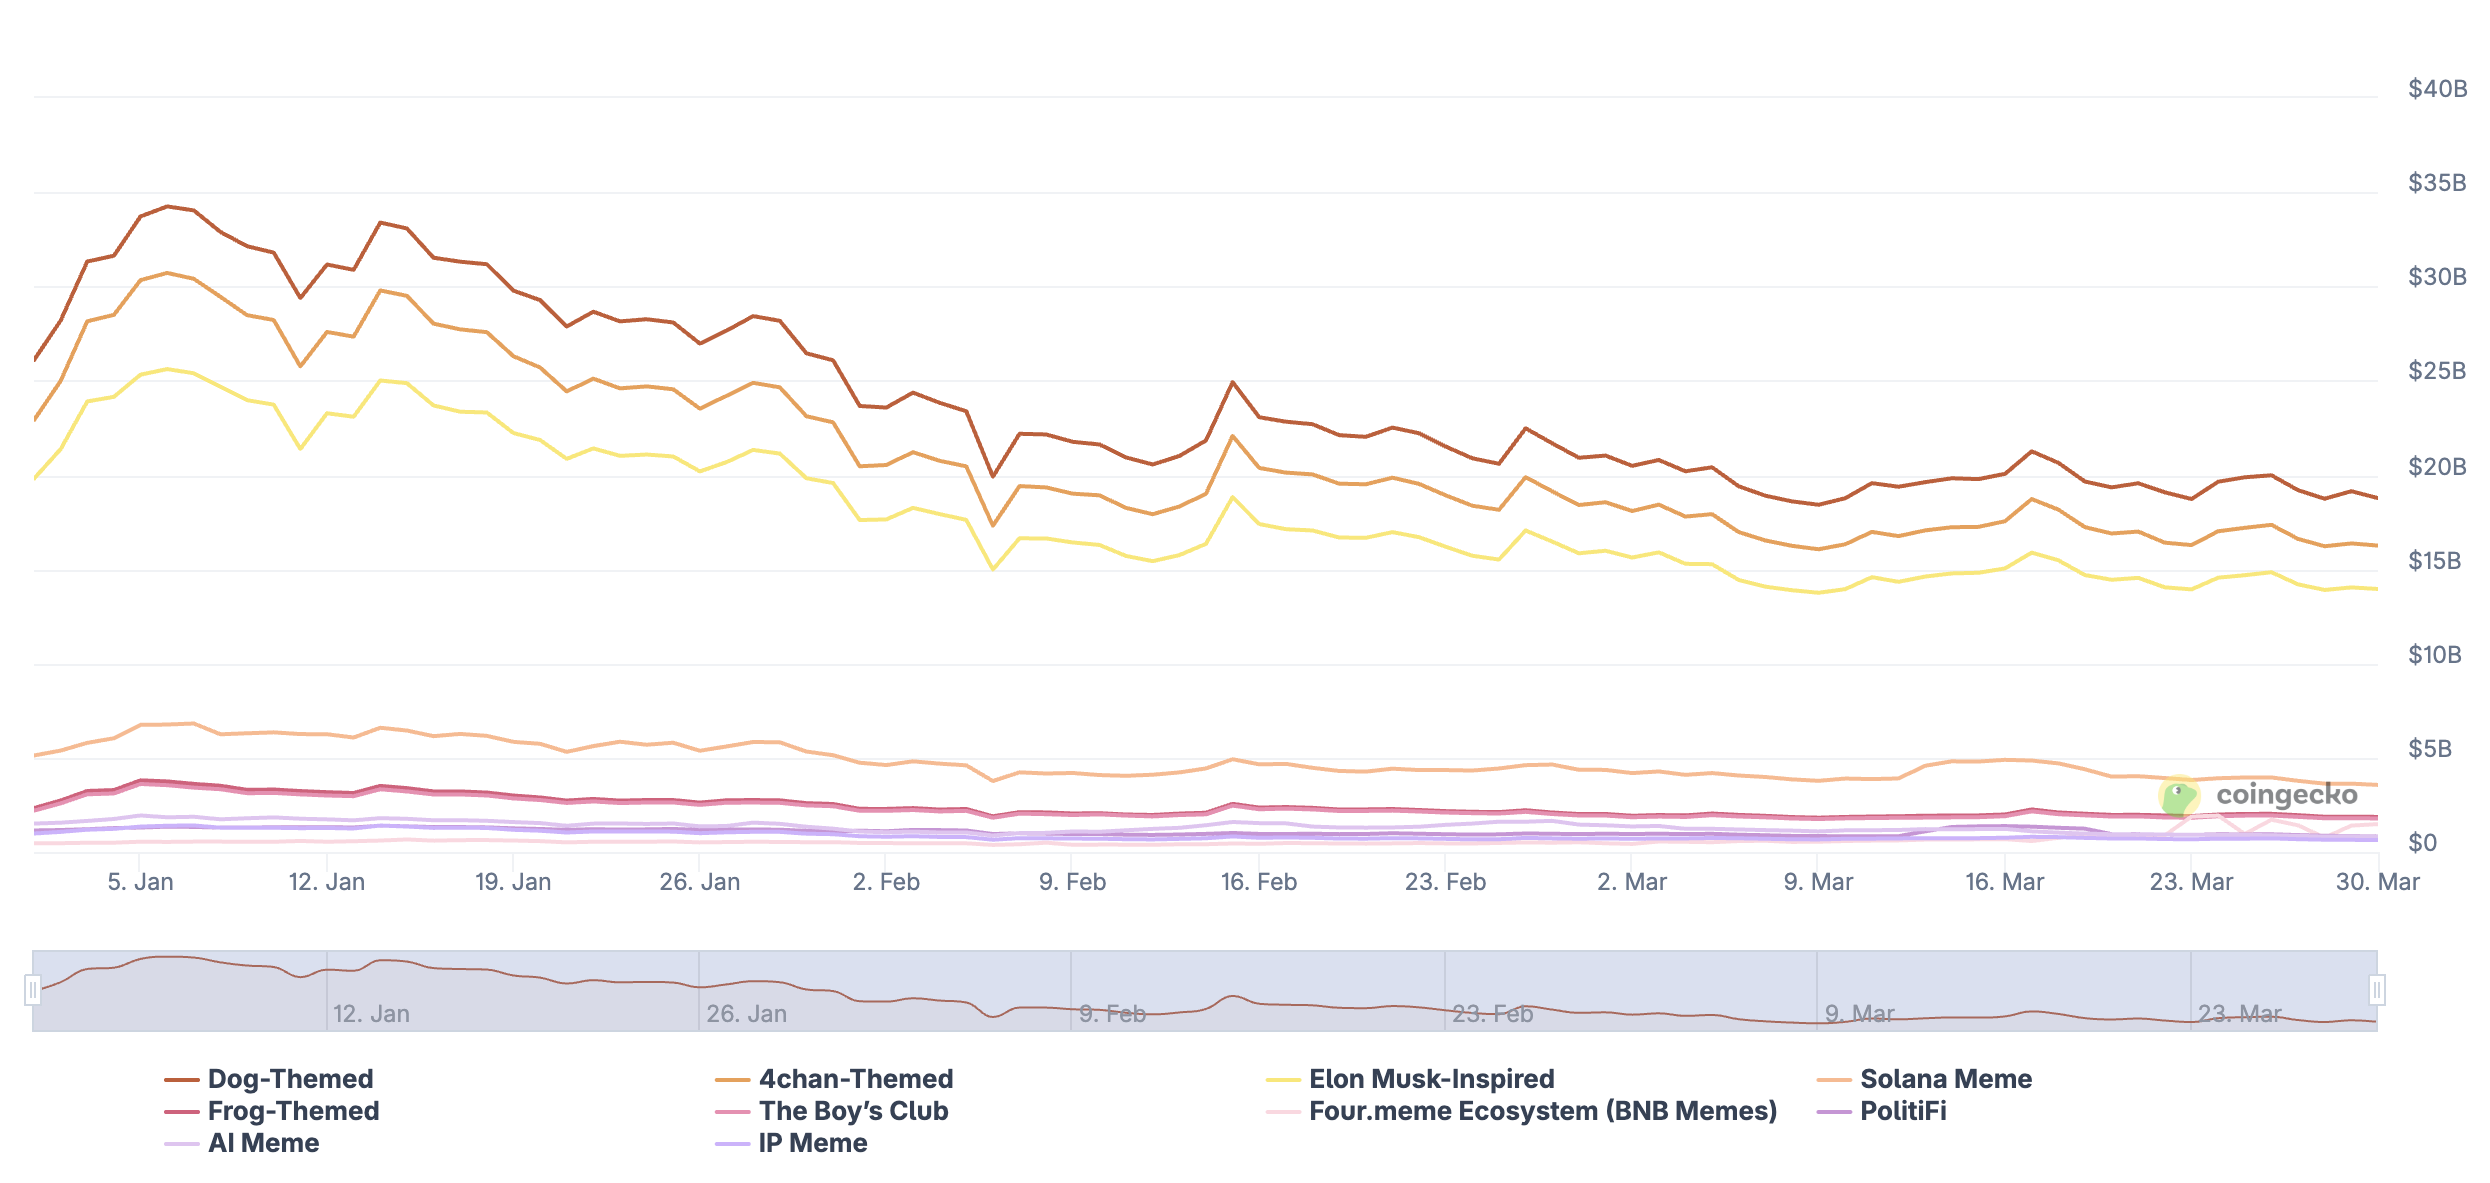
AI Meme tokens have been hit hardest, falling 46% year to date. Dog-themed, 4chan-themed, and Elon Musk-inspired tokens all dropped roughly 28% to 30% in lockstep.
The Boy’s Club and Frog-themed categories held up relatively better, each declining around 19% to 20%. The sole outlier is the Four.meme Ecosystem on BNB Chain, which has more than tripled since January.
The second signal is fading dominance. CryptoQuant data shows meme coin dominance within the altcoin market fell from 0.042 in mid-February to 0.034 in March. This suggests that capital is rotating away from meme tokens.
The third signal is collapsing participation. Solana, which served as the primary hub for memecoin speculation, has seen on-chain engagement collapse. Analyst Shah noted that the number of daily decentralized exchange (DEX) traders on Solana has hit their lowest levels on record.
“Participation is at all time lows, just a few thousand people are still active, so good coins that once had 100M–1B potential are stuck trading between 500k- 20M,” he wrote.
Analyst Capexbt described the chain as a “ghost town.”
The fourth signal is the macro backdrop. Escalating geopolitical tensions, particularly the US-Iran conflict, have kept the Crypto Fear and Greed Index in extreme fear territory.
Without fresh liquidity and renewed risk appetite, conditions for a meme coin rally remain absent.
Subscribe to our YouTube channel to watch leaders and journalists provide expert insights
The post 4 Reasons Why Meme Coin Season Won’t Return Anytime Soon appeared first on BeInCrypto.

The GENIUS Act may have closed the door on interest-bearing payment stablecoins, but it has not ended the search for yield. It has simply pushed that search into new structures, where the return comes through DeFi design rather than through the stablecoin itself.
BeInCrypto asked two industry experts how the market is adapting.
Stefan Muehlbauer, Head of U.S. Government Affairs at CertiK, says the issue remains politically contested. He says”
“The question of yield is still facing strong opposition from banks, beyond the GENIUS Act, but also leading to discussions during the recent roadblock of the Senate’s version of the CLARITY Act market structure bill.”
In his view, the line now sits between products that resemble interest and products that present rewards differently.
“Banks are taking aim at yield that is earned as interest, while DeFi players are innovating around products that treat rewards more as a service fee through mechanisms such as staking,” Muehlbauer continues.
Anton Efimenko, co-founder at 8Blocks, sees the same divide. He notes:
“Under U.S. law, stablecoin issuers can’t issue stablecoins with passive yield accrual. Rebasing is basically banned. At the same time, “there’s nothing stopping those stablecoins from being used in DeFi products that generate yield through staking.”
He adds that the opportunity may extend even further. “If you think the structure through properly, a stablecoin issuer can also launch its own DeFi platform and distribute deposit yield through that layer.”
That leaves the U.S. stablecoin market in an unusual place. Yield remains one of the strongest product incentives in crypto, but in 2026, it has to be packaged with much more care.
Federal Charters Change the Balance of Power
Federal charters are where the balance of power changes most visibly. Crypto-native firms are already entering the U.S. financial system, and the focus now is how directly they can compete with the institutions that have controlled access to payments and settlement for decades.
Muehlbauer argues that this is where the biggest realignment is happening:
“The granting of national trust bank charters to crypto-native firms like Circle and Paxos has effectively dismantled the ‘walled garden’ that once protected legacy giants like JPMorgan Chase from outside tech competition.”
In his view, these licenses change who can operate with institutional standing inside the system. By securing federal charters, he says, digital asset issuers gain “the official federal imprimatur needed to compete directly for core payment and settlement services.” That gives them a path to “operational autonomy” rather than continued dependence on banking partners.
Fernando Lillo Aranda, Marketing Director at Zoomex, says the key change is that crypto-native firms no longer need to rely entirely on incumbent banks for legitimacy.
Aranda notes:
“Once a non-bank issuer can operate under a federal framework or an OCC-supervised charter, it is no longer just a technology company renting access to the banking system.”
In his view, that gives firms like Circle or Paxos clearer standing across payments, custody, and reserve management, turning them into directly regulated financial institutions rather than outside partners looking in.
At the same time, Lillo Aranda does not see this as a sudden reversal of bank dominance:
“That does not suddenly make JPMorgan weak – incumbents still dominate distribution, balance sheet depth, and client trust.”
But, he argues that the competitive gap has narrowed.
Where banks once held the regulatory advantage and crypto firms mainly moved faster on product design, some crypto-native issuers now have both. That shifts the contest away from basic market access and toward who can scale trust, distribution, and integration fastest.
Efimenko agrees that the market is opening up, but he does not think legacy finance has lost its edge.
“The U.S. stablecoin market is going to be highly competitive, but banks and asset managers will still hold the advantage,” he says. For him, the decisive factor is distribution.
“Crypto companies have to spend heavily on marketing to attract investors, while banks already have those investors on hand.”
Federal charters give crypto-native issuers more room to operate on their own terms, but banks still control the customer relationships that turn financial products into mass-market products.
Federal rules rise, but the states are still in the room
The GENIUS Act may have established a federal path for stablecoins, but it has not erased the state systems that helped define earlier phases of U.S. crypto regulation. What it has done is place them in a more constrained position.
Muehlbauer says the era of states acting as independent “laboratories of innovation” is largely over. In his view, the market is entering a period of “cooperative federalism” in which Washington sets the main rules for stablecoin oversight.
“Although the Wyoming Model and New York’s BitLicense endure, they are no longer autonomous,” Muehlbauer says. He argues that they now function within a federal framework that sets the minimum standards for capital and reserves.
He also points to a hard limit on how far a state-led route can go:
“Even successful state-chartered stablecoin issuers face a definitive ceiling. Once volume hits $10 billion, they must transition to primary federal oversight by the OCC.”
That leaves states with a role, but not the leading role they once claimed in crypto policy. They still influence licensing, supervision, and regional experimentation, though the center of gravity now sits in Washington.
CLARITY still has to solve the token question
Stablecoins may now have a federal framework, but the larger question of token classification remains unsettled. That is where the CLARITY Act comes into play.
Muehlbauer says the bill is designed to address what he calls the “security-forever” dilemma by updating how U.S. law treats tokens across their life cycle. He says:
“The Act isolates the ‘investment contract’ status by introducing ‘Ancillary Assets’, tokens whose value relies on the ‘entrepreneurial or managerial efforts’ of a central group, but only during their initial, centralized phase.”
In his telling, the bill creates a path for tokens to leave that category once a network develops beyond heavy reliance on a core team. Muehlbauer says:
“To provide a legal exit ramp, the Act establishes a ‘Maturity’ test, allowing tokens to graduate to Digital Commodities once the network becomes sufficiently decentralized.”
He says that originators would be able to certify that managerial efforts have become “nominal,” opening a 60-day window for the SEC to challenge that claim or allow the asset to proceed with a presumption of non-security status in secondary trading.
If that framework survives negotiations, it could bring the U.S. closer to a usable definition for utility tokens. Until then, stablecoins may have moved into a clearer legal era, while much of the rest of crypto still waits for its answer.
Final thoughts
The GENIUS Act has given the U.S. its clearest stablecoin framework yet, but it has also opened a new phase of competition. The debate now reaches beyond regulation itself and into who controls issuance, who captures the economics around digital dollars, and who gets direct access to the financial system.
Muehlbauer’s answers suggest that Washington has moved stablecoins into a more formal federal order, while leaving the next major fight unresolved around token classification and market structure.
Efimenko, meanwhile, points to the commercial reality behind that legal progress. Even with new charter opportunities and room for product innovation, crypto-native firms still have to compete with banks that already control distribution and client access.
Lillo Aranda sharpens that point: federal charters may have narrowed the old moat around legacy finance, but they have not erased the incumbents’ advantage in scale, trust, and customer ownership.
Stablecoins are entering a more defined legal era, but the balance of power between crypto firms, banks, regulators, and token issuers is still being contested in real time.
The post The American Pivot and Wall Street 2.0 appeared first on BeInCrypto.
Ethereum’s Ether (ETH) could slip toward the $1,200 region in the coming weeks, as a fractal-driven setup highlighted by trader Leshka.eth points to a potential deeper pullback if key support gives way. The analyst emphasizes a daily Supertrend pattern that has preceded outsized declines when bearish flips have failed to hold.
Historically, the pattern produced notable reversals: bullish flips that failed to sustain gains in October 2025 and January 2026 culminated in sharp drops of roughly 45% and 48%, respectively. The current formation forms near $1,990, and the trader warned that a break below that level could open the path toward the $1,200 zone. As Leshka.eth put it: “If that level breaks, the next target is the $1,200 zone.”
The narrative sits alongside a broader chart look that ties the bearish setup to a measured downside target from a bear-flag pattern on ETH’s daily chart, signaling a test of lower levels if momentum remains negative. The Ethereum price context has shifted as the market contends with a softer macro backdrop and a tug-of-war between risk appetite and liquidity considerations.
On the price action front, ETH has erased more than 17% from its monthly high in a little over two weeks. The pullback comes as Ether futures and spot sentiment loosen, with Ether ETFs reportedly registering net outflows of about $300 million in that span. Market observers describe the demand for Ethereum as having cooled to one of its weakest levels in 16 months, adding to the headwinds for a near-term recovery.
In the broader market backdrop, macro forces are not supportive of an immediate rebound. Risk appetite has waned amid geopolitical headwinds and recession concerns, while bond traders have pushed back expectations for Federal Reserve rate cuts beyond December 2027, according to probabilities tracked by CME’s FedWatch tool. The combination of softer macro signals and cleaner liquidity dynamics has kept ETH in a fragile zone even as short-term liquidity remains plentiful in some pockets of the market.
Key takeaways
- Bearish fractal setup on ETH’s daily chart points to a possible drop to $1,200 if the near-term level around $1,990 is breached, reaffirming a risk of deeper downside rather than a quick bounce.
- Historical occurrences where similar bullish flips failed have preceded sharp declines of roughly 45% to 50%, underscoring the difficulty of a sustained reversal in this pattern.
- On-chain demand signals show weak conviction among large and mid-size holders, with mega-whales (>10,000 ETH) flattening and mid-tier cohorts not reaccumulating decisively, suggesting limited downside protection from holders at present.
- The macro environment and ETF flows temper near-term momentum, with outflows and recession concerns weighing on Ethereum’s immediate prospects even as staking activity and exchange-supply dynamics offer a more complex longer-term picture.
Bearish fractal signals and price structure
The proposed bearish path hinges on a Supertrend-based pattern observed on ETH’s daily chart. The Supertrend, a trend-following indicator that changes color to mark direction, has previously produced brief bullish flips that did not stick. In the two notable prior instances—October 2025 and January 2026—the price rose briefly above the upper band only to fail and slide aggressively once the band’s support failed to hold. The current setup centers near $1,990, with the implication that a break below that crumb could activate the next leg lower toward the $1,200 zone. This aligns with a broader bear-flag interpretation that yields a measured downside target consistent with a sharper decline if support fails.
Trading-view charts referenced by the analyst illustrate a pattern where the price dropped decisively after the upper-band break and the subsequent loss of support, reinforcing the risk of a renewed downtrend if the current formation cannot sustain upward momentum. While such fractals do not guarantee outcomes, they provide a framework for assessing risk in a market dominated by macro uncertainty and shifting liquidity conditions.
On-chain behavior and holder conviction
Beyond price patterns, on-chain metrics paint a mixed picture of ETH demand. Glassnode data show that accumulation signals remain tepid across major wallet cohorts. For instance, mega-whale addresses holding more than 10,000 ETH have flattened after peaking in late 2025, and the 30-day change across this cohort has moved back toward neutral after extended declines. That pattern suggests that the biggest holders have not been stepping in with renewed aggression to back a sustained rally.
The story is similar for smaller but meaningful cohorts. Ethereum wallets holding between 1,000 and 10,000 ETH remain well below their late-2025 highs, with the 30-day change hovering around flat to marginally negative levels. Likewise, addresses in the 100–1,000 ETH bracket continue to trend below last year’s peaks, indicating a broad lack of renewed buying conviction among mid-sized to mid-tier holders. Taken together, the on-chain picture points to distribution pressures rather than broad-based accumulation, reinforcing the risk of a continued slide if the $1,990 zone gives way.
Despite the overall cautious stance from holders, there are some glimmers of potential longer-term support. Market observers note that on-chain activity around Ether staking has been rising, while the amount of Ethereum available on exchanges has fallen to ten-year lows. This combination signals that some holders are choosing to stake rather than liquidate, a dynamic that could eventually bolster Ethereum’s supply-side stability and reduce immediate selling pressure if demand improves. Still, these factors have not yet outweighed the current headwinds reflected in price action and investor sentiment.
For readers tracking the narrative, the balance of signals suggests that the immediate trajectory will hinge on whether ETH can defend the $1,990 threshold. A break lower would align with the fractal-driven downside scenario and the bear-flag target discussed by analysts, potentially amplifying the downside risks in the near term.
What to watch next
Investors should monitor a few key developments in the days ahead. First, whether ETH can sustain a move back above $1,990 or whether sellers regain control and push the price toward the $1,200 zone. Second, on-chain data—especially the behavior of mega-whales and the flow of Ether into staking pools—will be crucial for gauging whether demand may crystallize later in the year. Finally, macro momentum, including Fed expectations and risk appetite in relation to geopolitical developments, will continue to shape ETH’s risk premium and potential recovery path.
The market’s path remains uncertain, but the combination of a fragile macro backdrop, cooling on-chain demand, and fragile price patterns suggests a cautious stance for ETH in the near term as traders weigh the potential for further downside against the lure of long-term staking and shrinking exchange supply.
Crypto World
Ethereum Price Prediction: Prediction Market Bettors Think ETH Will Slide From Second Biggest Crypto

Ethereum price is trading at $2,052, with its second-place ranking now genuinely in question in a fast-moving prediction market. Prediction market data assigns a 59% probability that ETH loses its number-two spot by 2026, a dramatic surge from just 17% earlier this year.
The pressure is coming from an unlikely direction: stablecoins. Tether’s market cap has reached approximately $184 billion, narrowing the gap with Ethereum’s $243 billion valuation to a margin that once seemed untouchable.
The broader stablecoin sector now tops $310 billion, up from roughly $5 billion in 2020, driven by surging demand for liquidity, payments, and cross-border settlement rather than price speculation. Prediction markets have been under scrutiny lately, but these odds are hard to dismiss.
Unlike Ethereum, USDT doesn’t need a bull market to grow. That asymmetry is what makes this threat structurally different from past competitive cycles.
Discover: The best pre-launch token sales
Ethereum Price Must Hold Above $2,000 or Prediction Market Odds Can Come Into Fruition
ETH is currently trading at $2,052, clinging to a psychologically significant level after a brutal drawdown. The asset peaked near $4,900 in October 2025 before collapsing to under $2,000 last week, a decline exceeding 50%. The recovery since then has been tentative at best.
$2,000 is now the line in the sand. A sustained break below that level opens the path back toward the $1,700–$1,800 range, where longer-term structural support clusters. Momentum indicators remain weak. Price is trading below key moving averages, and volume on recovery attempts has been unconvincing.
Three scenarios shape the near-term outlook:
- Bull case: ETH reclaims and holds above $2,200, momentum shifts, and the $2,500–$2,700 range becomes the next target.
- Base case: ETH consolidates between $1,900 and $2,200 through Q2, with no decisive directional move. Ranking risk persists but doesn’t crystallize immediately.
- Bear case: A close below $1,900 on elevated volume invalidates the recovery thesis entirely.
The bearish pressure below $2,000 has been well-documented. What’s new is the structural narrative layered on top of a weak technical picture, and that combination tends to attract sustained selling pressure rather than dip-buyers.
Discover: The best crypto to diversify your portfolio with
Bitcoin Hyper Eyes Early-Mover Positioning as Ethereum Tests Critical Support
Ethereum’s stall at current levels, down more than 50% from its peak, with ranking risk now quantified at 59%, is prompting a segment of active traders to rotate toward earlier-stage infrastructure plays where asymmetric upside still exists. At $2,052, ETH’s market cap of $243 billion leaves limited room for the kind of multiples that defined its earlier cycles.
One project drawing attention in that rotation is Bitcoin Hyper ($HYPER), a Bitcoin Layer 2 integrating the Solana Virtual Machine, positioning it as the first-ever SVM-powered Bitcoin L2. The pitch: Solana-grade speed and programmability, secured by Bitcoin’s trust layer.
The presale has raised more than $32 million at a current price of just $0.0136, with staking available at high APY for early participants. The rise has accelerated in recent weeks alongside broader Bitcoin ecosystem momentum.
Key features include sub-second transaction finality, a decentralized canonical bridge for BTC transfers, and low-cost smart contract execution, targeting the gap between Bitcoin’s security and Ethereum’s programmability.
Those researching early-stage infrastructure plays can review Bitcoin Hyper’s presale details here.
This article is for informational purposes only and does not constitute financial advice. Crypto assets are highly volatile. Always do your own research before investing.
The post Ethereum Price Prediction: Prediction Market Bettors Think ETH Will Slide From Second Biggest Crypto appeared first on Cryptonews.
The first week of April brings a cluster of catalysts that could move select altcoins sharply in either direction. Token unlocks, protocol upgrades, and new mining integrations are converging within days of each other.
In line with the same, BeInCrypto has analysed three such altcoins that the investors should watch as April and Q2 2026 begin.
Dogecoin (DOGE)
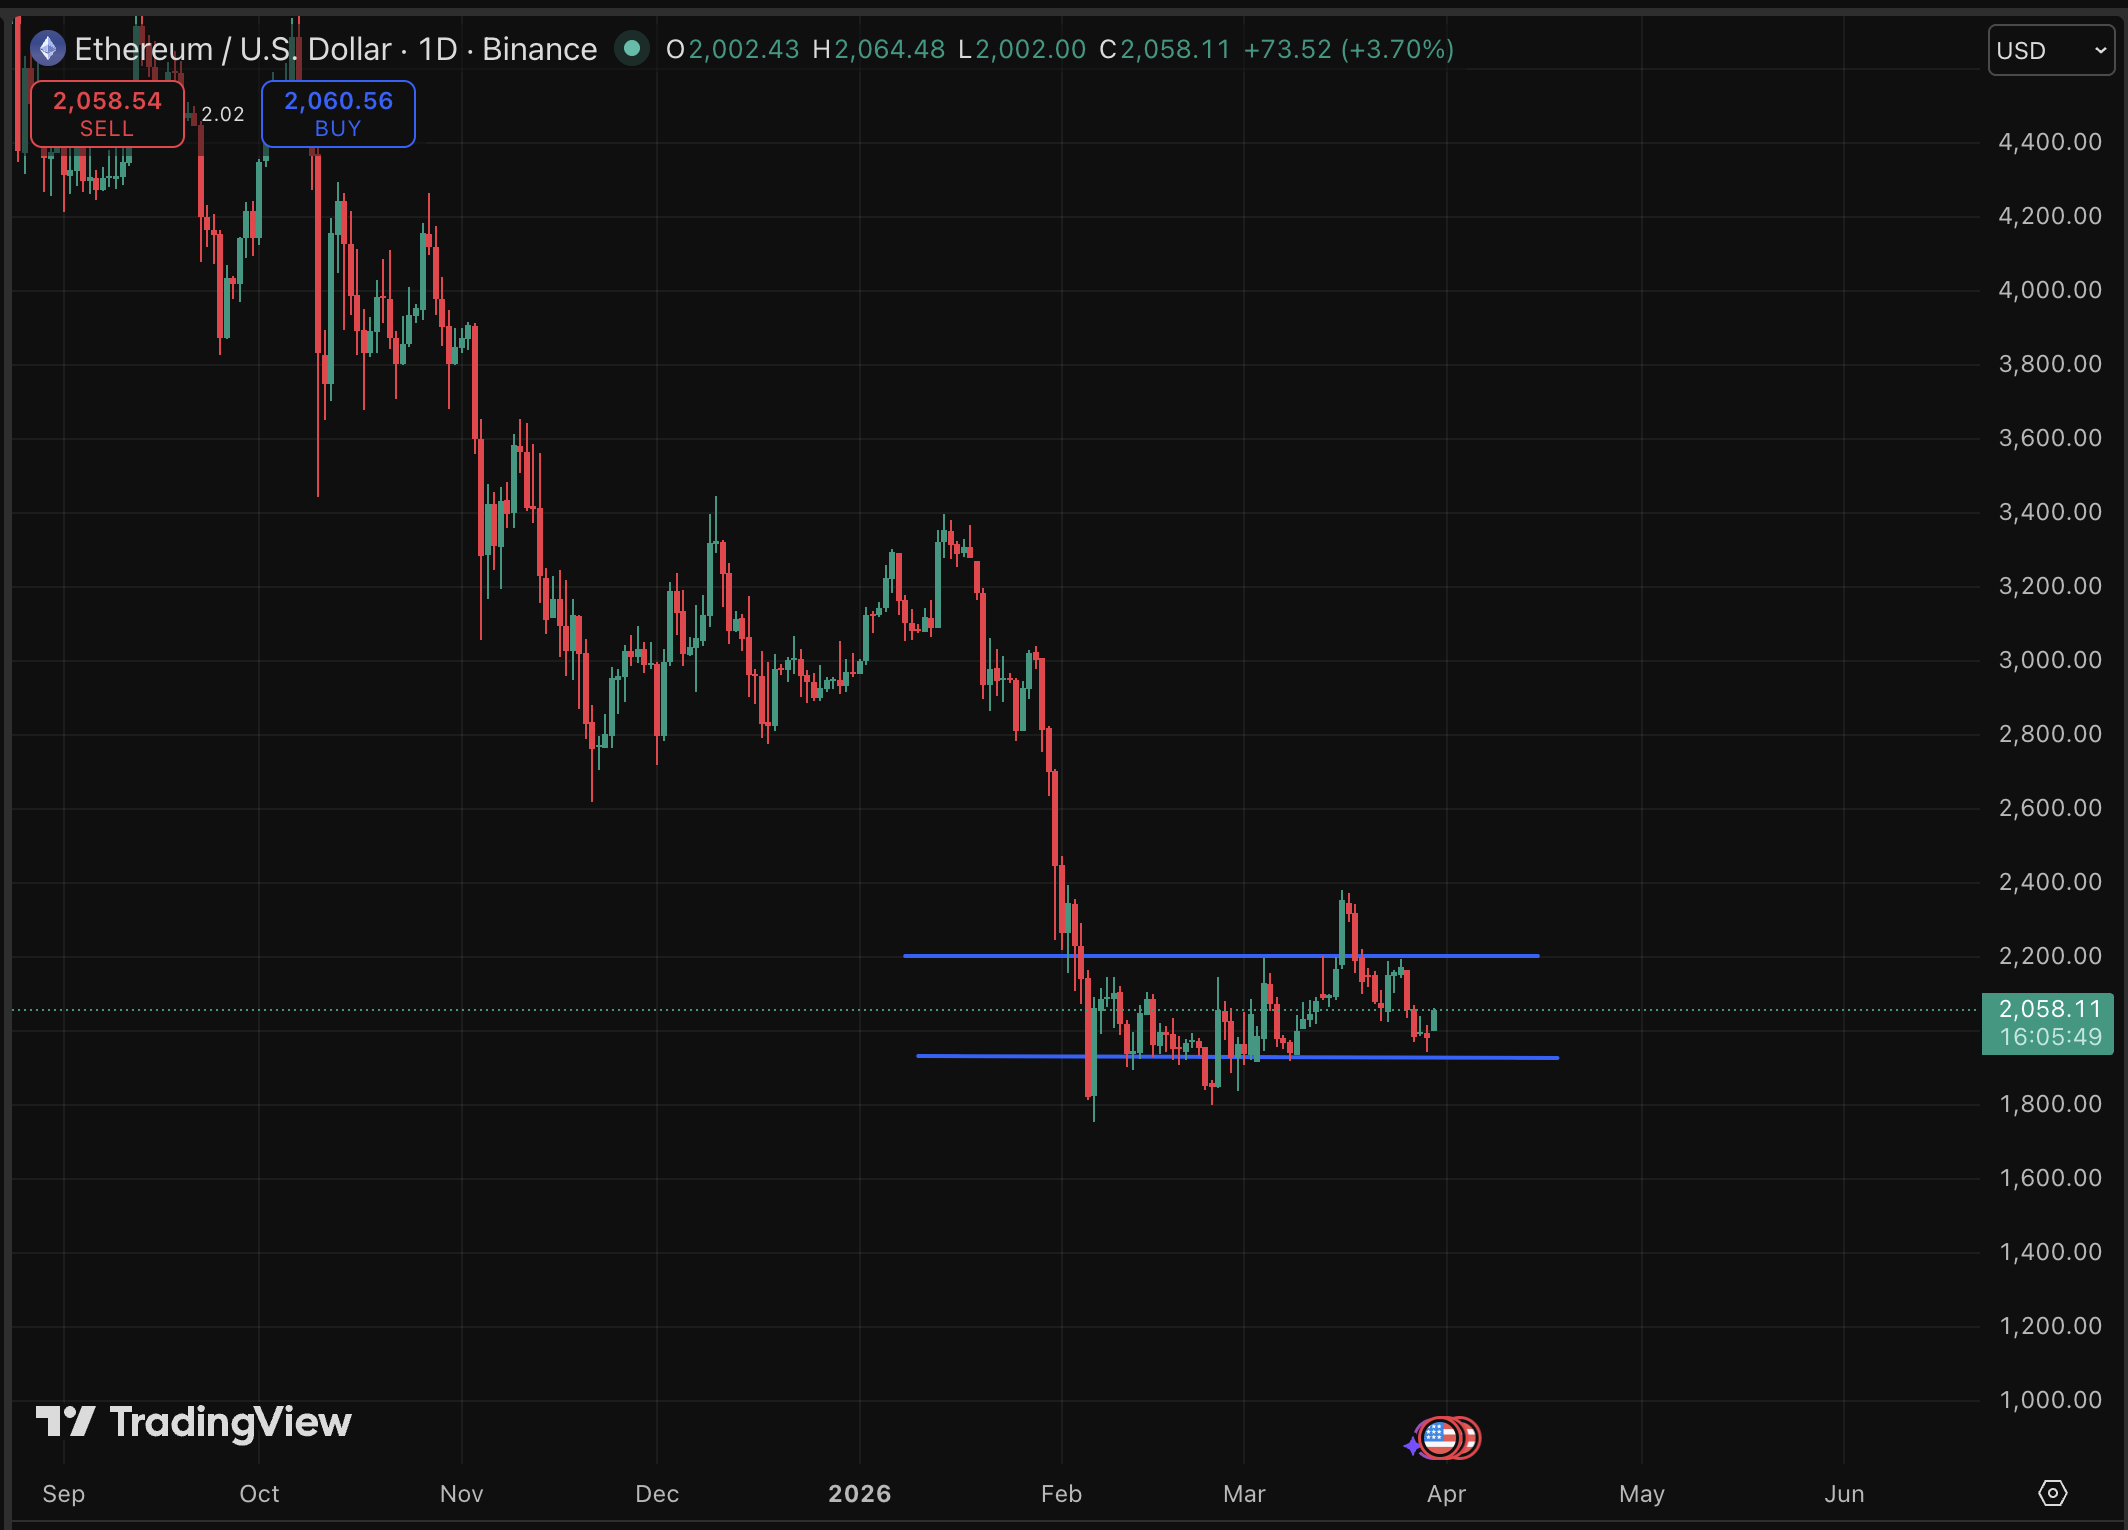
Dogecoin (DOGE) is trading at $0.09315, up 2.99% on the day, consolidating just above the 0.618 Fibonacci level at $0.08807. DOGE is within a descending channel visible since late January. The Chaikin Money Flow (CMF) is reading exactly 0.00, signaling neither accumulation nor distribution, as price hovers near the lower boundary.
Qubic’s Dogecoin mining mainnet, targeting April 1, adds a new demand narrative for DOGE. If the catalyst drives a breakout above the descending channel upper trendline, currently converging toward $0.09933, a push toward the 0.382 Fibonacci level becomes viable. The channel compression means the resolution is approaching fast.
A daily close below $0.08807 would confirm bears remain in control inside the descending structure. The 0.786 level at $0.08005 then becomes the next meaningful downside reference. A sustained CMF drop below zero on rising volume would reinforce the bearish case heading into April.
Celo (CELO)
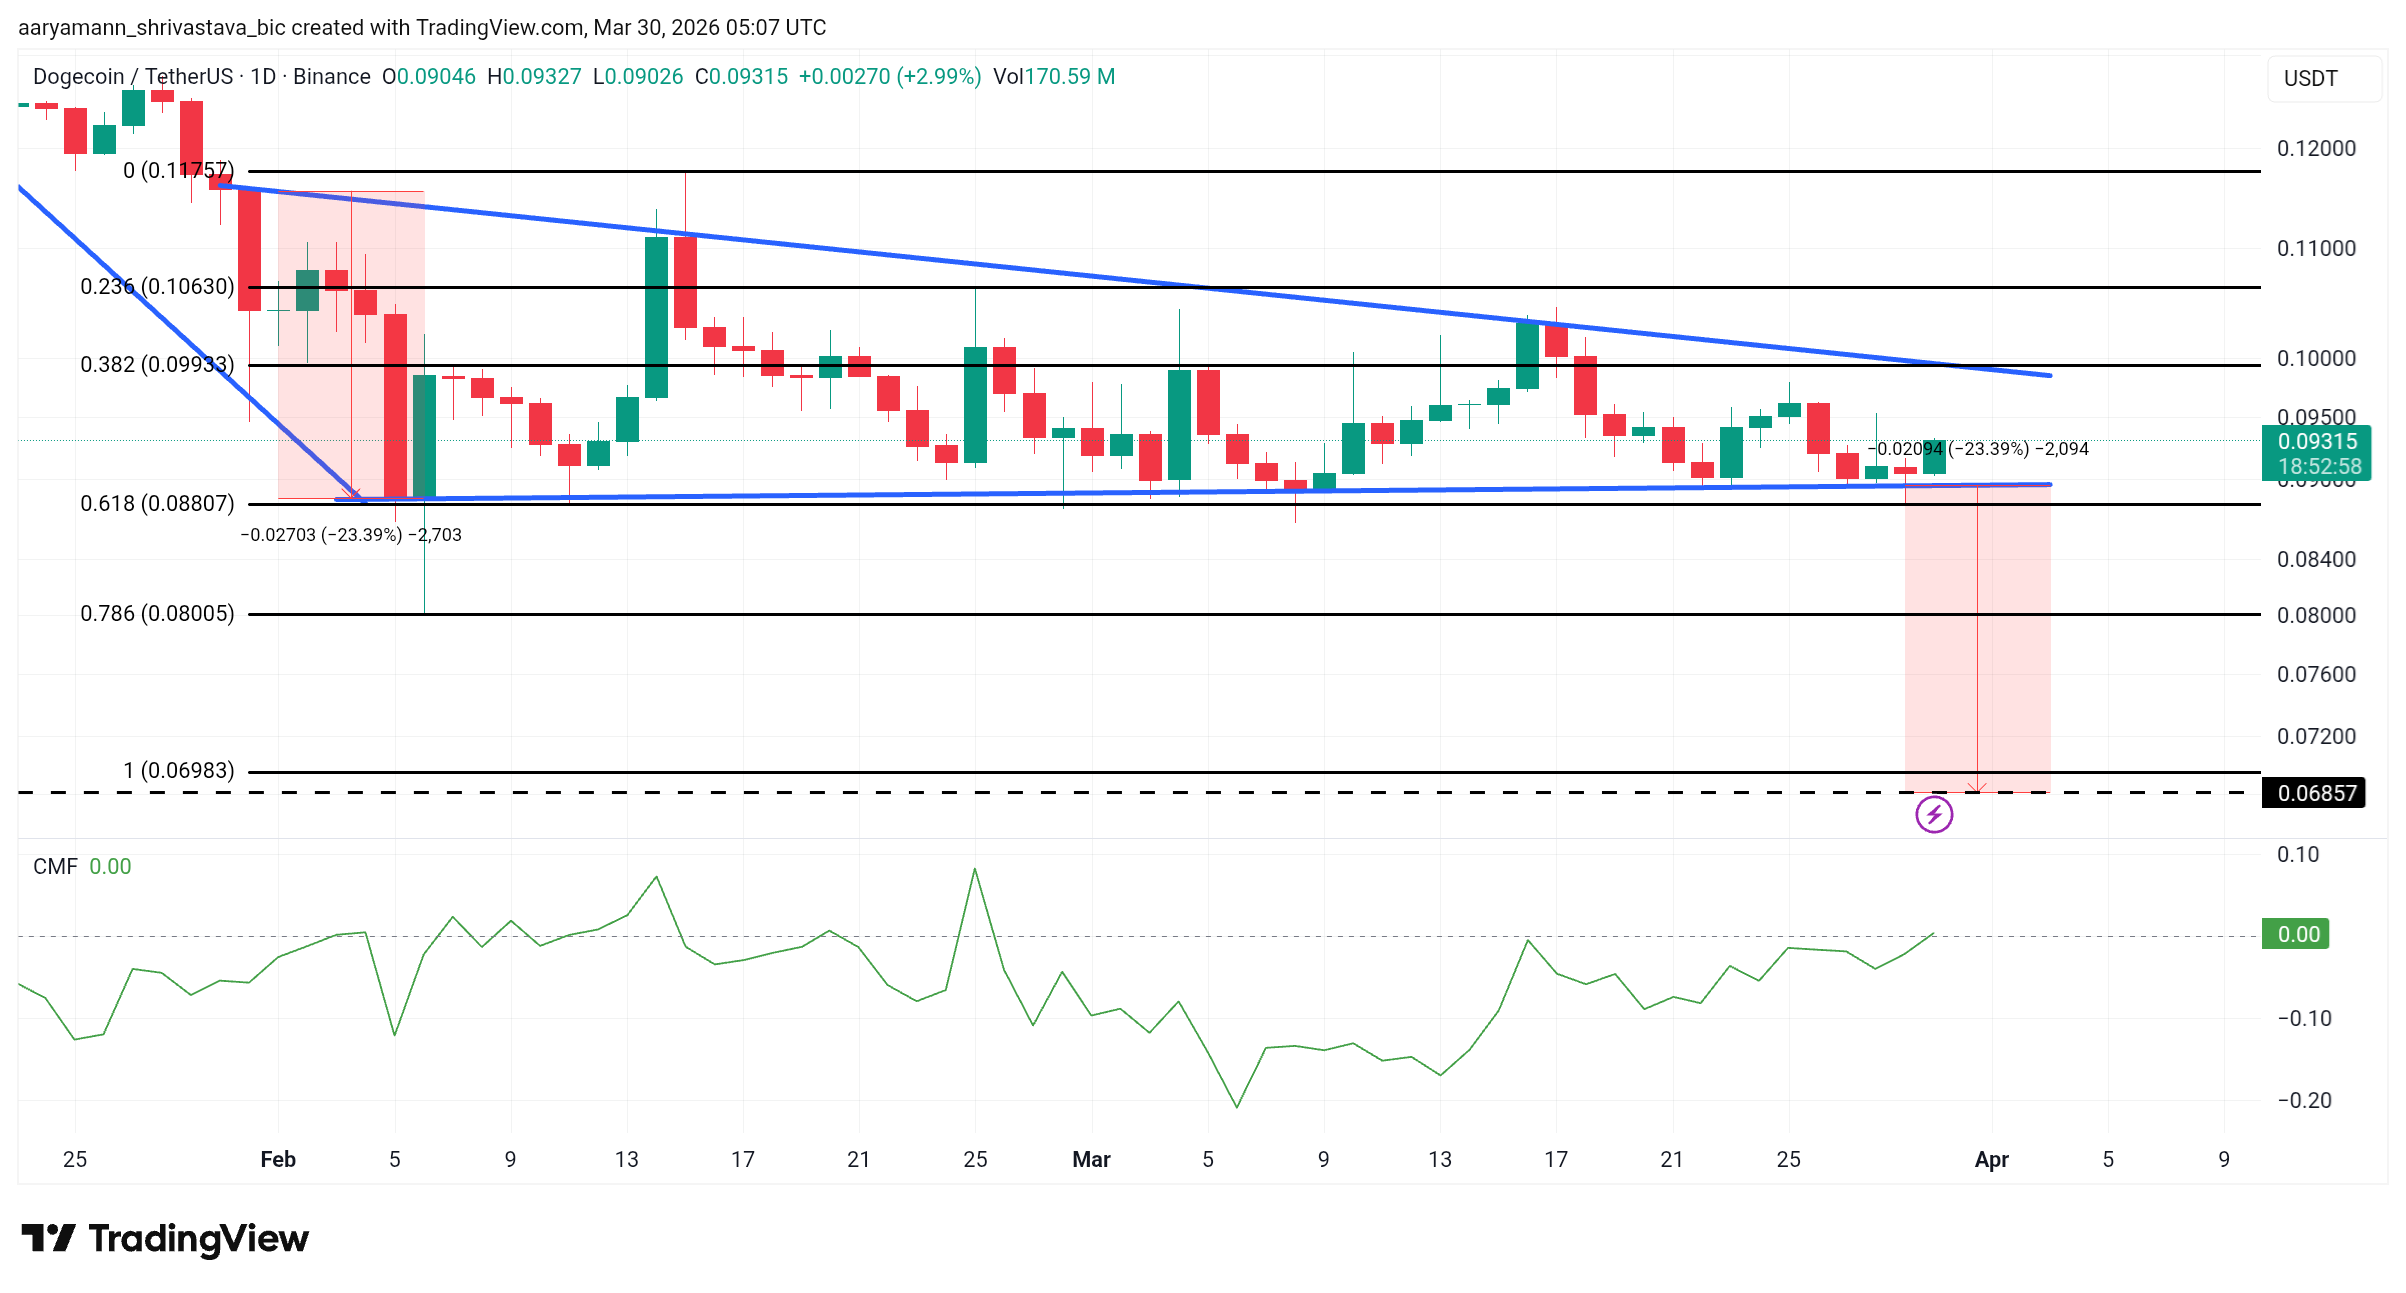
Celo (CELO) is trading at $0.0757, up 3.70% on the day, sitting below the 0.382 Fibonacci level at $0.0773 with the EMA sloping downward at $0.0785. Price has been oscillating between $0.0741 and $0.0825 for weeks, unable to reclaim the 0.618 level and trading dangerously close to the all-time low at $0.0689.
The Jovian Hardfork going live on March 31 brings gas mechanic upgrades and a buyback-and-burn tokenomics proposal to CELO. A successful upgrade that sparks buying could push the price through $0.0773 and toward the 0.618 Fibonacci resistance at $0.0825. Here, the green horizontal level on the chart has capped multiple recovery attempts.
Failure to hold above the 0.236 level at $0.0741 would be a bearish signal. This would suggest that the event is already priced in. Below there, the all-time low at $0.0689 becomes the only remaining technical reference point on the chart.
Sui (SUI)
Sui (SUI) is trading at $0.8714, up 2.91% on the day, sitting inside a broadening wedge with price pressing against the lower trendline. The Bollinger Bands show the middle band at $0.9552 and the lower band at $0.8381. The Money Flow Index (MFI) has dropped to 32.70, approaching oversold territory after peaking near 80 in mid-March.
The 42.94 million SUI unlock on April 1 is the dominant near-term catalyst. If the market absorbs the supply and MFI bounces from 32.70, a recovery toward the $0.8814 becomes plausible. A close above $0.9687 would shift the short-term structure back in favor of buyers.
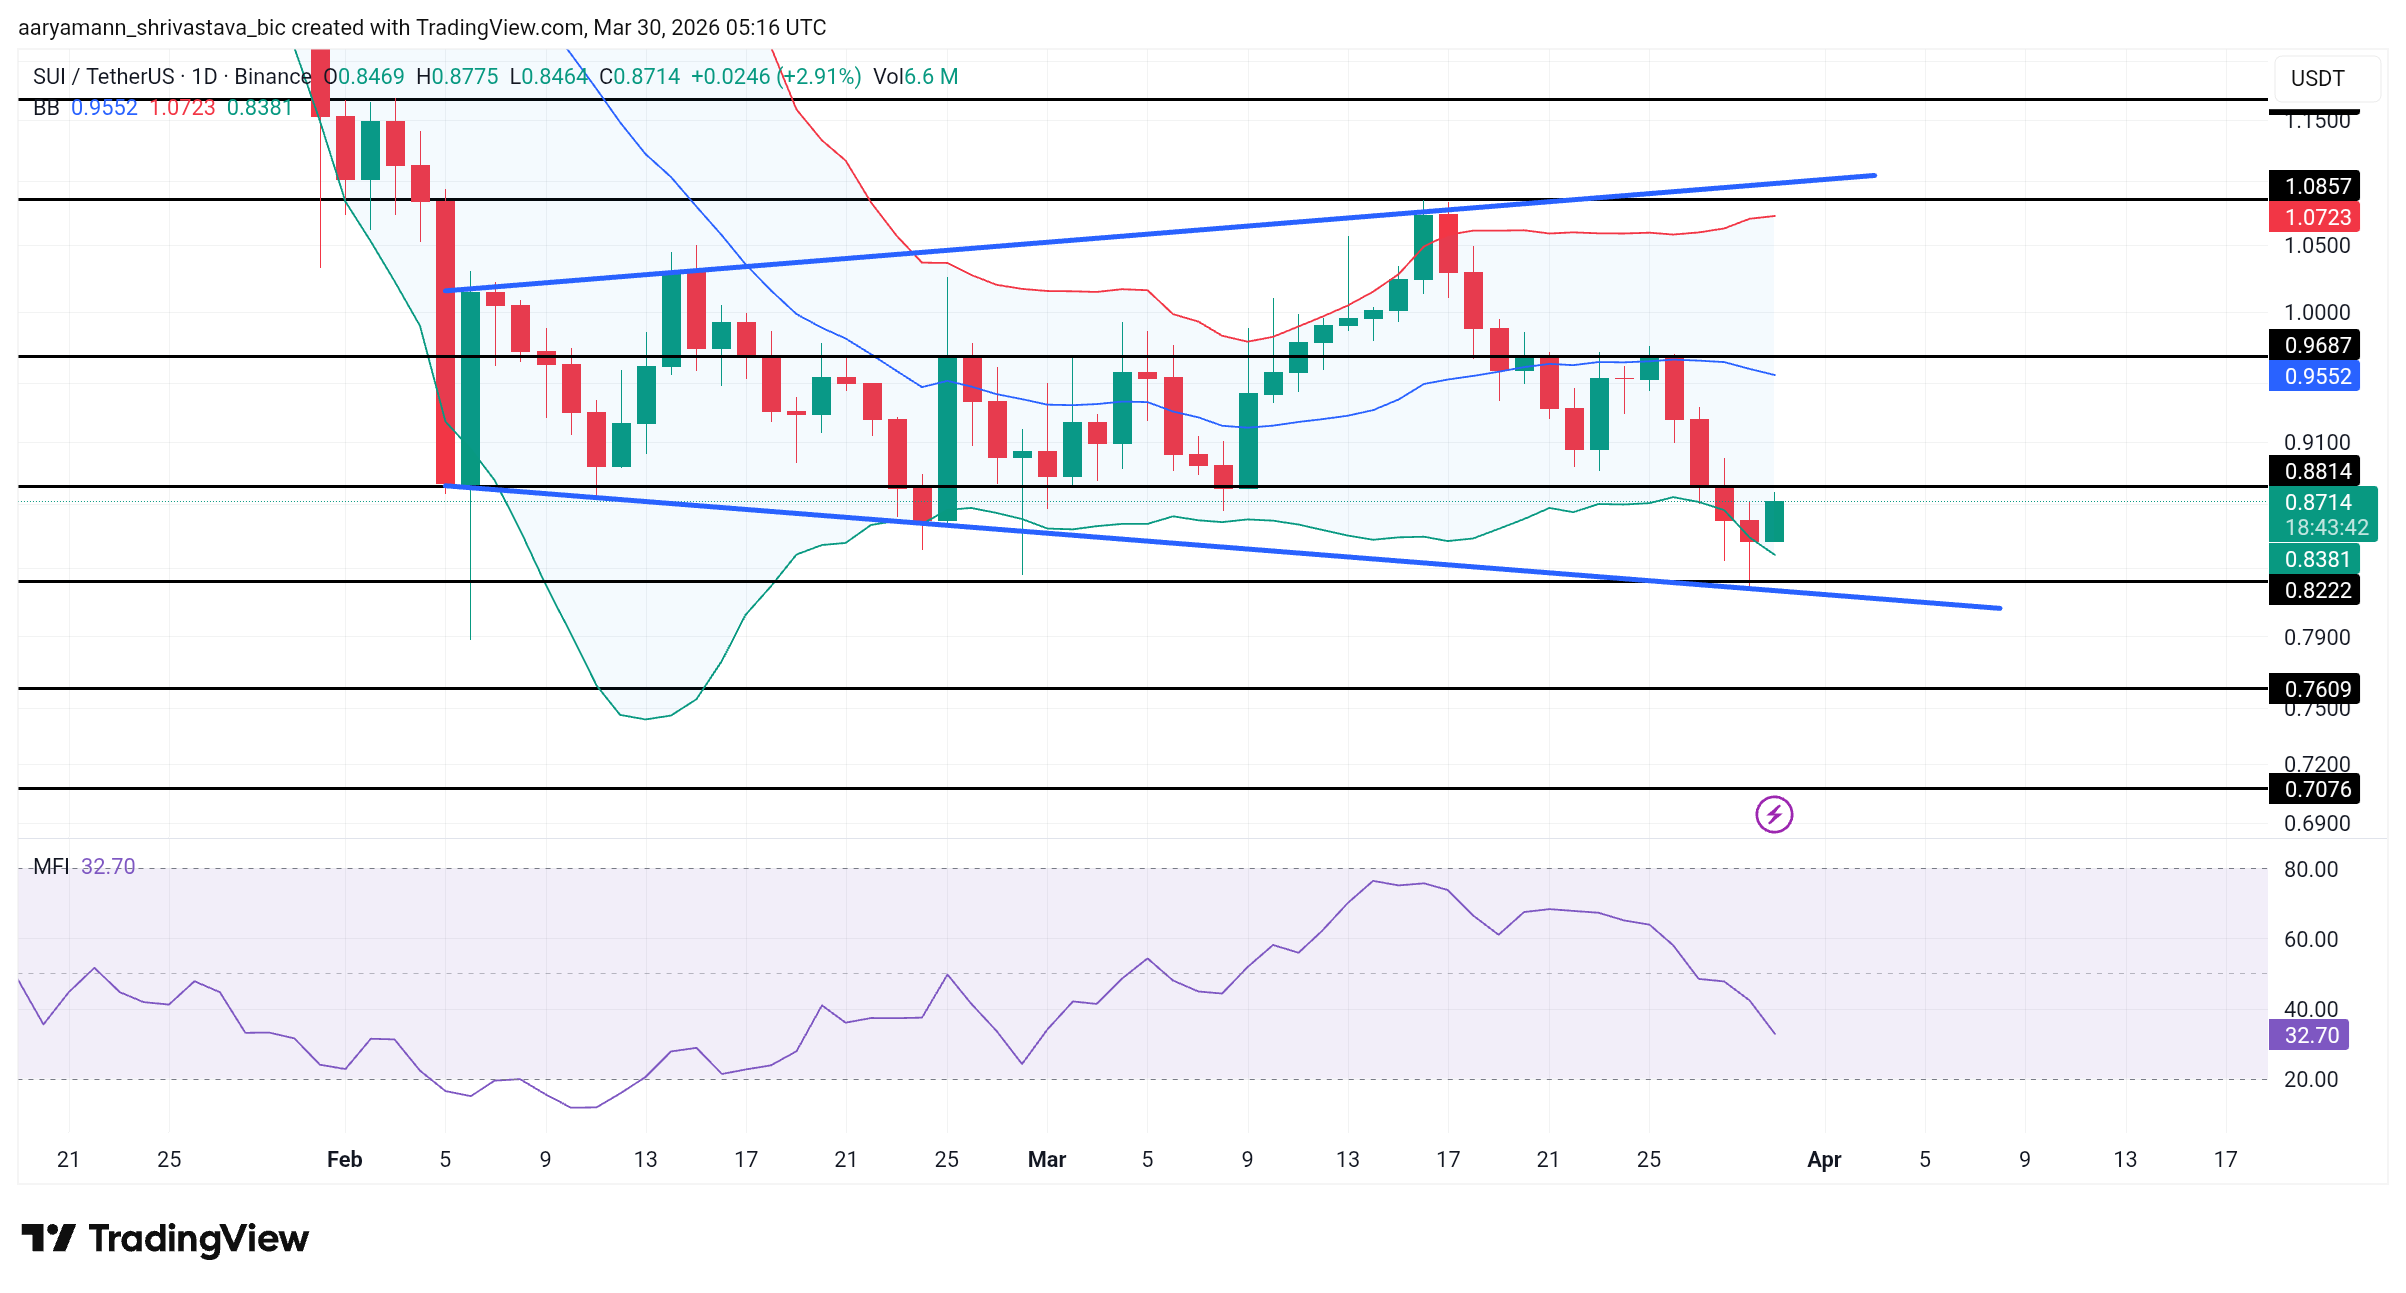
A failure to hold the lower wedge trendline and a close below $0.8222 would invalidate any recovery thesis. Below there, $0.7609 is the next visible support on the chart. MFI sliding further without a bounce would confirm sustained selling pressure through the unlock event.
The post 3 Altcoins To Watch In The First Week Of April 2026 appeared first on BeInCrypto.


The Ethereum Foundation has staked over $46 million worth of ether in its largest single-day allocation, while continuing to rotate parts of its treasury through sales.
Summary
- Ethereum Foundation has staked 22,517 ETH worth over $46 million in its largest single-day deposit into the Beacon Chain.
- The move has followed a 2025 treasury strategy to deploy holdings for yield.
On-chain data from Arkham Intelligence shows the foundation transferred 22,517 ETH (ETH) to the Ethereum Beacon Deposit Contract at around 1:38 a.m. ET on Monday.
The contract is used to lock ETH into the network’s proof-of-stake system, where it helps validate transactions and secure the chain. The move marks the foundation’s biggest recorded staking transaction so far.
The latest deposit builds on a broader shift in treasury management that began last month, when the nonprofit first staked 2,016 ETH following a 2025 policy update outlining plans to actively deploy treasury assets to generate returns while supporting the network’s long-term development.
According to the foundation, this approach allows it to both strengthen Ethereum’s security and fund core operations, including protocol research and development, ecosystem growth initiatives, and community grants.
The increase in staking activity comes shortly after the foundation also executed a separate treasury transaction, selling 5,000 ETH in an over-the-counter deal worth just over $10.2 million to BitMine Immersion Technologies.
It marked the second instance of the foundation directly selling ETH to a corporate treasury firm, following a 10,000 ETH sale to SharpLink Gaming in July last year. The foundation has maintained that periodically selling assets across market cycles allows it to sustain development efforts without relying solely on external funding.
At the time of writing, ETH price was trading above $2,057, up more than 2.5% over the past 24 hours, with gains extending across both weekly and monthly timeframes.

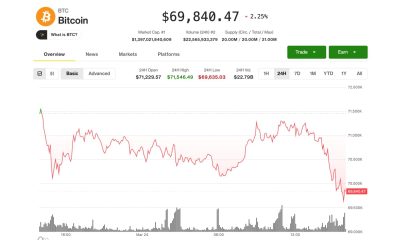
Bitcoin price is trading at $67,500, up 1.5% in the last 24 hours, a soft jump that, on its own, means little, especially for those believing at 200K prediction. But combine it with radio silence from Michael Saylor’s Strategy and suddenly the question writes itself.
Has the most aggressive institutional buyer in crypto history finally tapped out?
— That Martini Guy ₿ (@MartiniGuyYT) March 29, 2026
 LATEST
MICHAEL SAYLOR HAS NOT POSTED THE SAYLOR TRACKER TODAY
IT SUGGESTS STRATEGY BOUGHT NO BITCOIN AFTER 13 STRAIGHT WEEKS OF BUYING pic.twitter.com/wpjUrVq39e
No fresh Strategy purchase announcement has emerged in the last 48 hours, an unusual silence from a firm that conditioned markets to expect near-weekly BTC accumulation disclosures. Profit-taking talk has intensified alongside it.
Still, with U.S. economic data releases imminent and ETF flow reports due, the next 72 hours carry outsized weight. Recent BTC price action analysis suggests the market is coiled, not broken.
Discover: The best crypto to diversify your portfolio with
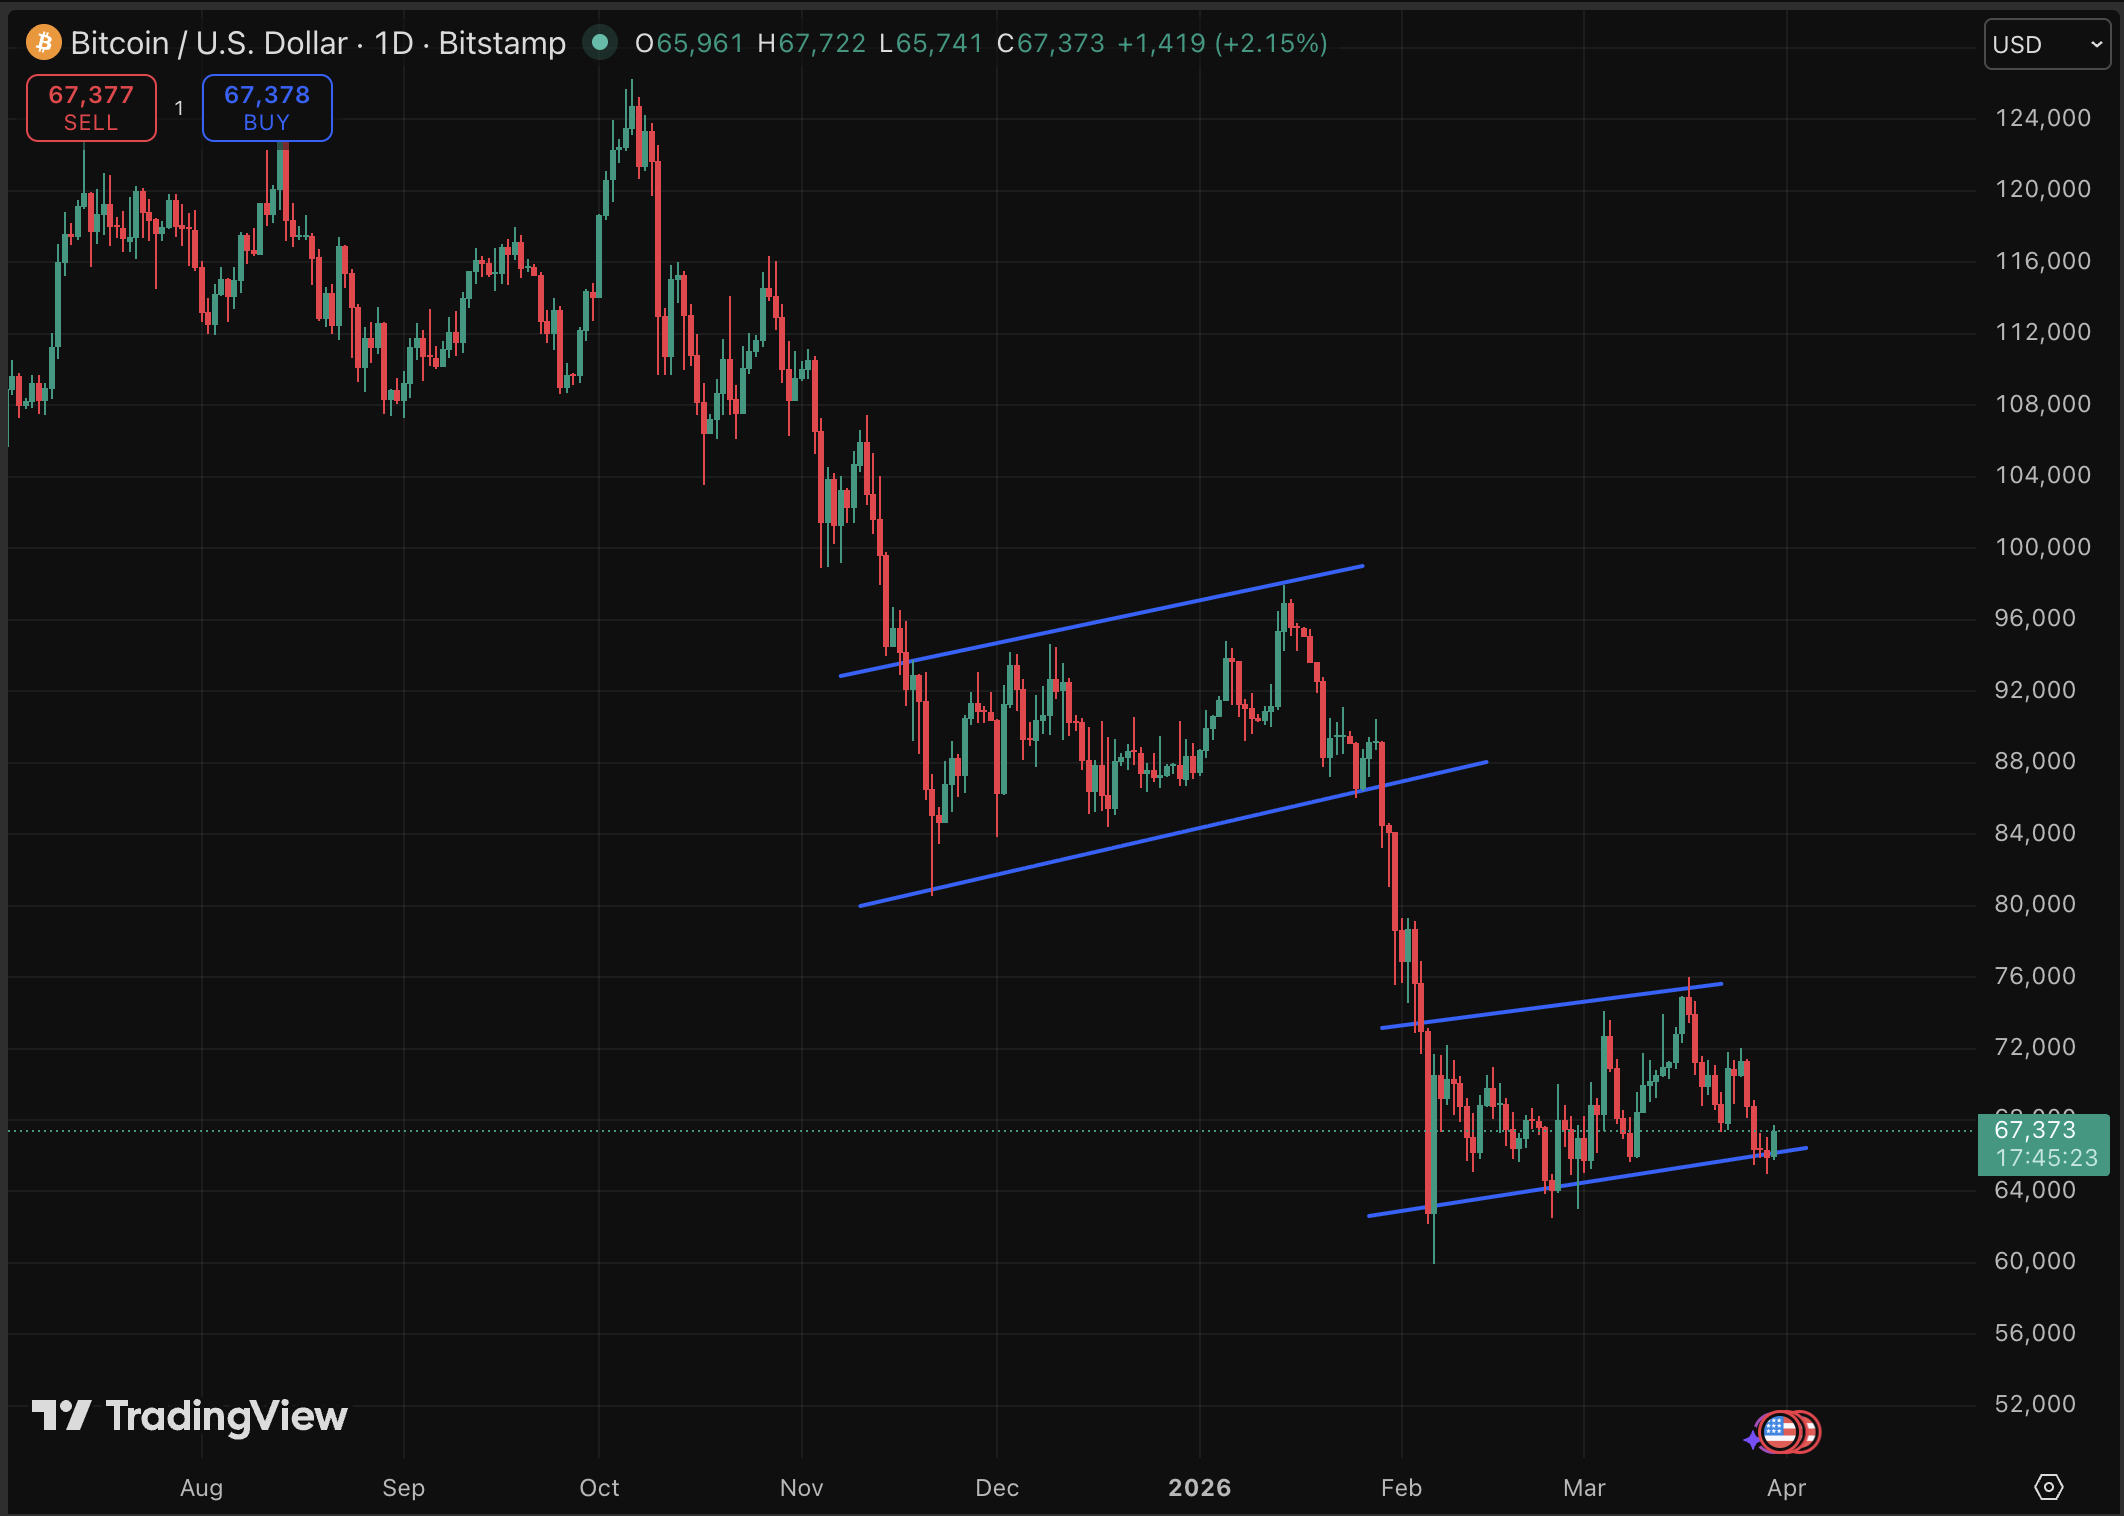
Bitcoin Price Prediction: Can BTC USD Break $72,000 Resistance This Week?
Bitcoin’s current technical picture is a study in controlled tension. Price sits at just above $67,000, wedged between primary support at $65,000 (recent swing lows) and immediate resistance at $72,000 as the “now” ceiling.
The yearly trend remains bearish at 17% drop, and the 30-day base has held without a serious test. March opened at $65,000 leve; before staging the run, which was invalidated last week.
Three scenarios deserve equal attention right now:
- Volume returns, Strategy resumes buying (or another institutional name steps in), and BTC clears $72,000 on a daily close, opening a path toward the $75,000 area.
- Consolidation persists between $65,000 and $72,000 through early April as markets digest U.S. macro data; no breakdown, no breakout, just accumulation.
- A confirmed close below $65,000, however, would shift momentum, with $63,000 the next meaningful floor.
The Saylor silence is worth watching. GameStop’s recent 4,710 BTC treasury move hints corporate demand hasn’t evaporated; it may simply be rotating to new buyers. If ETF flow data due this week confirms continued institutional inflows, the $72,000 resistance test looks more likely than not.
Discover: The best pre-launch token sales
Bitcoin Hyper Targets Early Mover Upside as Bitcoin Tests Key Levels
Here’s the uncomfortable truth for late-cycle BTC buyers: at $67K, the asymmetric upside that early institutional adopters captured simply doesn’t exist anymore. Bitcoin’s risk-reward at current levels demands patience, possibly years of it. For traders who want Bitcoin-ecosystem exposure with early-stage return potential, the calculus looks different.
Bitcoin Hyper ($HYPER) is making a credible case for attention. It’s positioned as the first Bitcoin Layer 2 with Solana Virtual Machine (SVM) integration, a genuinely novel architecture that is faster transaction performance than Solana itself while preserving Bitcoin’s security layer.
The presale has raised over $32 million at a current price of $0.0136, with high-APY staking already live for participants.
This article is not financial advice. Crypto investments carry significant risk. Always conduct your own research before investing.
The post Bitcoin Price Prediction: Michael Saylor Strategy Stops Buying? appeared first on Cryptonews.

Protest scheduled outside ‘ludicrous’ trial of movement leaders

Trump says he has ‘no problem’ with Russian oil tanker bringing relief to Cuba

USA: Discount Opens Up, Creating A 'Buy' Opportunity (Upgrade)


-
 NewsBeat5 days ago
Manchester United reach agreement with Casemiro over contract clause amid transfer speculation
-

 News Videos4 days ago
Parliament publishes latest register of MPs’ financial interests
-

 Sports7 days ago
Gary Kirsten Accuses Pakistan Cricket Board Of ‘Interference’, Mohsin Naqvi Responds
-

 Sports7 days ago
Remo Stars and Kano Pillars Strengthen Survival Hopes in NPFL
-

 NewsBeat3 days ago
The Story hosts event on Durham’s historic registers
-

 Business4 days ago
Instagram, YouTube Found Responsible for Teen’s Mental Health Struggle in Historic Ruling
-

 News Videos7 days ago
Ch 9 Financial Management Part 1 | Detailed One Shot | Class 12 Business Studies Boards 2026
-
 NewsBeat5 days ago
Tesco is selling new Cadbury Dairy Milk bar and people can’t wait to try it
-
 Entertainment7 days ago
Cynthia Bailey Dishes on ‘RHOA’ Season 17, Discusses Kandi
-

 Tech7 days ago
Samsung will soon let you control smart home devices from your car’s dashboard
-
 Entertainment1 day ago
Lana Del Rey Celebrates Her Husband’s 51st Birthday In New Post
-

 Business6 days ago
More women enter wealth management, but few in advisory roles: study
-
 NewsBeat7 days ago
Colombian military plane with 110 soldiers onboard crashes following takeoff
-

 Fashion6 days ago
Does It Matter What You Wear When You’re Laid Off and Looking?
-

 Fashion7 days ago
Fringe Bags for the Season
-

 NewsBeat6 days ago
Entrepreneurs Forum survey reveals optimism in North East
-
 NewsBeat6 days ago
NASA Artemis II Astronauts enter 14-Day quarantine as moon rocket reaches launchpad
-

 Business6 days ago
Late-paying firms face multimillion-pound fines under new crackdown
-

 Politics7 days ago
How Media Platforms Balance Performance and Accessibility in Image Delivery
-
 Crypto World6 days ago
BTC gives up $70,000 level as markets mull higher interest rates
You must be logged in to post a comment Login