

Crypto World
Bitcoin, Nasdaq investors are celebrating, while U.S. consumers turn gloomy.
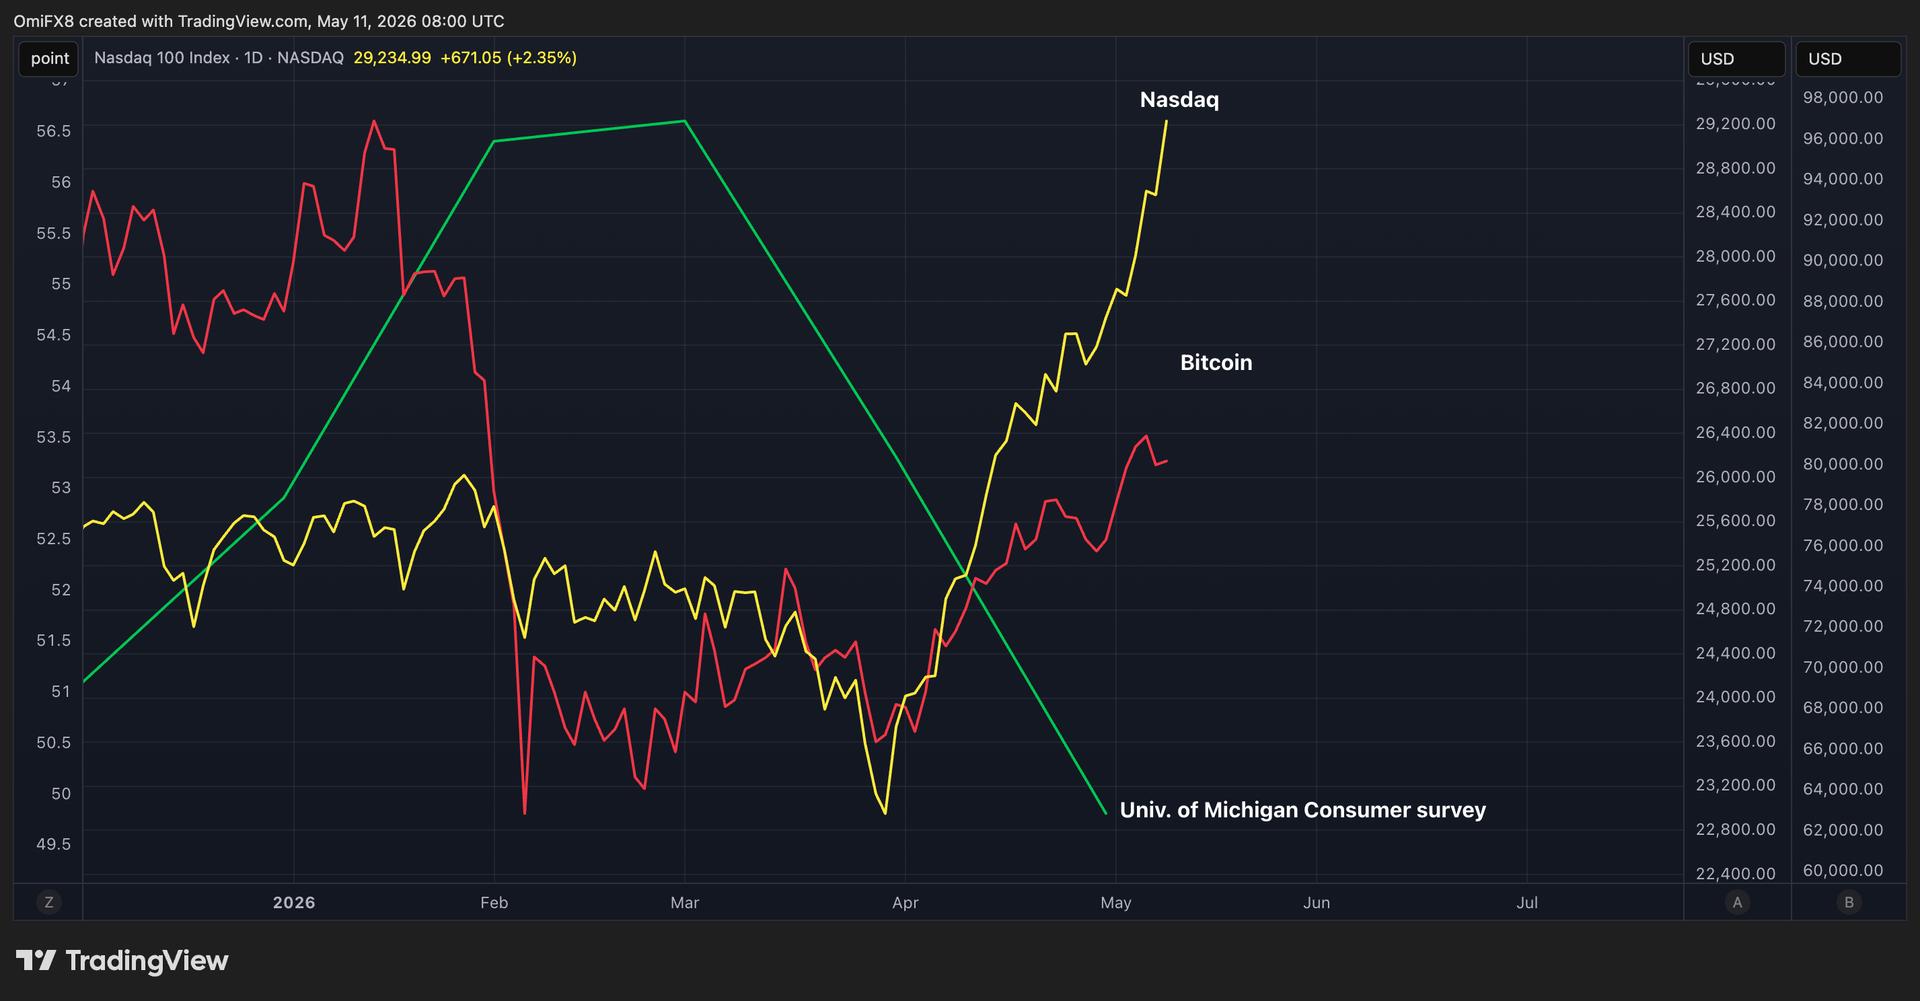

Major financial assets and the American consumer are moving in opposite directions, telling two very different stories about the U.S. economy.
Bitcoin, the leading cryptocurrency by market value and a macro asset, jumped 11.8% last month, the largest gain since April 2025 and has since extended the rally by nearly 6% to $80,700, CoinDesk data show.
This upswing has come alongside record risk-taking on Wall Street, as the tech-heavy Nasdaq index has jumped 22% since April 1, hitting a lifetime high of 23,235 points. The broader index, S&P 500, has rallied over 12% to 7,398 points, according to data source TradingView.
The combined rally in stocks and crypto is normally expected to lift the spirits of the American consumer, who is known to invest in both assets. Reports suggest approximately 30% of American adults, or 70.4 million people, own cryptocurrency. Further, on average, 62% of adults have owned stocks since 2023.
But that’s not the case, as highlighted by the University of Michigan’s closely watched survey of consumers released Friday. The survey posted a preliminary record-low reading of 48.2 points, down 7.7% from a year ago and extending the decline from April’s reading of 49.8 points.
In simple terms, the American consumer is more downbeat than ever, and it’s mainly due to inflation fears. One-third of respondents cited gas prices as the biggest concern, and another one-third cited tariffs.
The growing disconnect between Wall Street and Main Street reflects two very different economic realities, according to Alvin Kan, COO at Bitget Wallet.
“Institutional capital continues flowing into AI, semiconductors, and digital assets, pushing the Nasdaq and Bitcoin higher as markets price in long-term productivity growth and technological transformation. At the same time, consumer confidence remains weak as households continue dealing with inflation, high living costs, and economic uncertainty. In effect, markets are trading the future while consumers are still focused on present-day financial pressure,” Kan told CoinDesk.
An AI capex boom and strong corporate earnings from mega-cap tech companies have driven the Nasdaq rally, stoking demand for other emerging technologies such as bitcoin. The U.S.-listed spot ETFs have pulled in billions in recent weeks amid the Nasdaq rally.
“This divergence is being driven by strong tech earnings, sustained ETF and institutional inflows into Bitcoin, and the growing role of digital assets as both growth and diversification plays. It also shows how crypto is increasingly tied to macro liquidity and innovation cycles instead of purely retail sentiment,” Kan said.
Bitcoin and Nasdaq are known to share a strong positive correlation. The crypto market began as a grassroots movement, often moving independently of Wall Street and traditional financial markets. But the rapid institutionalization following the launch of spot ETFs two years ago has made its price action increasingly correlated with broader equity markets.
That shift in how investors view BTC, decoupling it from Main Street sentiment, is evidence of the fading promise of financial democratization, according to Markus Thielen, founder of 10x Research.
“The democratization of finance was once one of crypto’s defining promises, yet reality has moved in the opposite direction. Wealth remains heavily concentrated in the hands of a small minority, a trend that is even more pronounced in the US stock market, where gains have increasingly accrued to the wealthiest participants,” Thielen told CoinDesk.
What next?
When rising costs squeeze households, it may seem natural to expect markets to align with the dour sentiment on Main Street. But that’s not necessarily promised.
“This gap is expected to persist,” Gracy Chen, CEO of Bitget, said.
She added that digital assets are increasingly diverging from traditional cycles and attracting fresh capital seeking asymmetric returns, suggesting promising long-term structural growth.
“While risks such as monetary policy tightening, geopolitical macro events, or regulatory shifts could add near-term pressure. However, the emerging ecosystem is maturing and becoming a core tool for diversification and active risk management in volatile markets,” she noted.

Crypto World
Canton Network’s Digital Asset targets $2 billion valuation in raise led by a16z crypto: Bloomberg


Digital Asset Holdings, the company behind the Canton Network blockchain used by several major banks and trading firms, is seeking $300 million from investors including Andreessen Horowitz’s a16z crypto at a roughly $2 billion valuation, according to Bloomberg.
The funding round is expected to close in the next few weeks, and the amount raised could vary, people familiar with the matter told Bloomberg.
The sources said investment banking company FT Partners is consulting Digital Asset on the funding round.
Digital Asset Holding, Canton Network and a16z crypto did not respond to a CoinDesk request for comment and confirmation.
The Canton Network is a privacy-enabled blockchain infrastructure whose purpose is to connect financial institutions and their tokenized assets across interoperable, permissioned applications.
In February, it revealed that a group of global financial firms completed the first cross-border, intraday repurchase agreement using tokenized British government bonds on its blockchain. The transaction was the first time digital versions of gilts, a $2 trillion market, had been used in an intraday repo across borders.
Digital Asset received backing estimated at about $50 million in late 2025 from investors, including Bank of New York Mellon and Nasdaq. Existing backers also include DRW and Citadel Securities.
For Andreessen Horowitz, participation in this fundraising round could be its first since raising $2.2 billion a week ago for its latest crypto fund, taking its total capital dedicated to the sector to just shy of $10 billion across five funds.

Macro investor and former hedge fund manager Jordi Visser said he recently bought Ether as he sees the “tokenization reality” starting this year, with tokenized assets powering agentic AI payments.
“I don’t think enough people are talking about tokenization and what’s happening,” Visser told Anthony Pompliano on a podcast on Saturday, predicting that tokenization and AI will be intertwined.
AI agents cannot access banking services or credit, so their primary method of transacting online autonomously will be digital assets such as Ether or stablecoins, which do not require bank accounts, logins or human approval.
“AI agents are with us,” he said. “They need food, and that food is not physical food. It is tokens,” he added. “There’s been a shortage,” which could lead to a supply and demand issue, he continued.
Autonomous online payments have surged this year, recording more than $24 million in transaction volume over the past month on the Coinbase x402 standard, according to x402.org.
Meanwhile, crypto protocols are racing to implement agentic AI payment protocols into their blockchains. The Algorand Foundation is one of the more recent, announcing on Saturday support for agentic commerce via a partnership with Google on the AP2 Agentic Payments Protocol.
Tokenization is needed for price discovery
Ethereum is a major blockchain for real-world asset tokenization, commanding more than 60% market share of tokenized assets, including layer-2 networks, according to RWA.xyz.
He also connected tokenization to a broader need for price discovery in illiquid assets, arguing that tokenization isn’t just a crypto story but a structural necessity for unlocking capital trapped in dormant assets such as private credit, private equity and venture capital.
Related: Agentic AI commerce may spell the end of internet ads: a16z Crypto
He argued that markets are entering a period where transparency and liquidity are “becoming critical” because a lot of money is stuck in these dormant assets.
“So tokenization is actually needed for no other reason than price discovery for a lot of these things that they’re trapped in.”

Source: YouTube
The head AI macro at 22V Research and a former hedge fund manager, however, cautioned about rising inflation, stating that he wanted to be in gold and silver and has also bought Bitcoin (BTC) as a hedge.
Magazine: Strategy reveals why they would sell BTC, Trump Media posts loss: Hodler’s Digest
Bitcoin (BTC) has climbed roughly 40% from its February lows, bringing the price back to a critical resistance zone that could determine whether the bear market continues or finally ends.
Key takeaways:
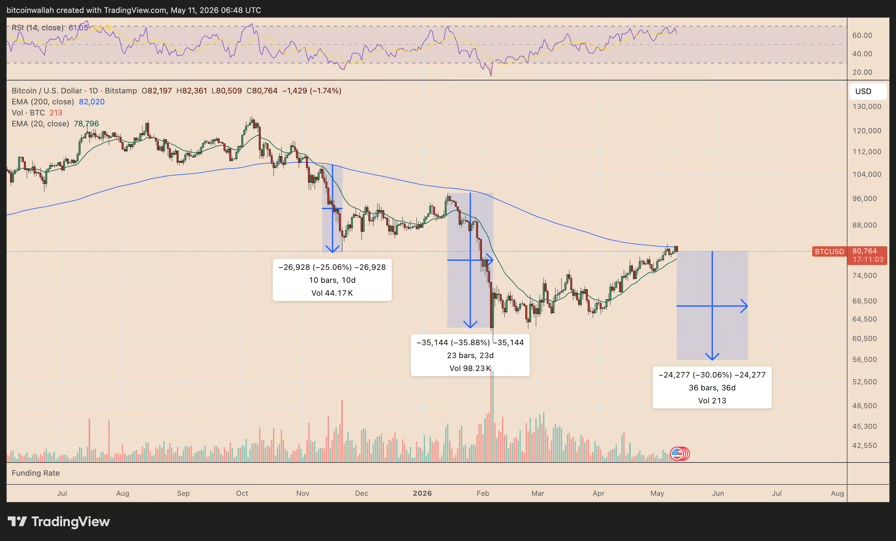
- Bitcoin fell 2.25% to around $80,500 after failing once again to break above its 200-day EMA resistance.
- Previous rejections from the same technical level triggered Bitcoin declines of 25% and 36%.
Bitcoin bulls must decisively break key trend line
As of Monday, BTC/USD was down 2.25% near $80,500, erasing its overnight gains as buyers once again failed to clear the 200-day exponential moving average (200-day EMA, blue line).
The level has capped Bitcoin’s rebound attempts since November 2025. Each rejection from the 200-day EMA has preceded steep drawdowns of 25% and 36%, respectively, putting the average decline near 30%.

BTC/USD daily chart. Source: TradingView
In his Monday post, analyst Brett said breaking above the 200-day EMA, currently near $82,580, could be “the end of the bears.” But given Bitcoin’s ongoing pullback, the prospects of BTC falling further in the coming sessions appear higher.
BTC’s price could fall toward $56,600 from current levels if it repeats its average 30% drawdown from the 200-day EMA rejection zone.
BTC price “lifetime support” model shows $56,000 floor
The $56,600 level aligns closely with Bitcoin’s broader macro support range.
A new Bitcoin Lifetime Support Model, highlighted by analyst PlanC, places BTC’s long-term upper support band near $57,110. The lower support was roughly around the $46,760 level.

Bitcoin lifetime support model. Source: Coin Metrics/PlanC
The model averages Bitcoin’s lifetime simple moving average with its single-, double-, triple- and quadruple-EMAs, then plots a 10% band around the result.
Historically, similar lifetime support zones have acted as macro bear-market floors. That means Bitcoin’s immediate setup remains bearish, but a decline toward the mid-$50,000s would still place BTC near a major long-term support area.
Bitcoin’s still unresolved bear flag pattern also hints at a potential drop below $60,000 in the coming weeks, as shown below.

BTC/USD daily chart. Source: TradingView
Bitcoin’s 2026 rebound mirrors past cycle bottoms
Despite the near-term bearish setup, Bitcoin’s latest rebound from the 200-week simple moving average (200-week SMA, blue line) is flashing a historically bullish signal.
BTC bounced by over 38% after testing the 200-week SMA near $61,000. This blue level closely aligns with major cycle bottoms seen in 2018 and during the March 2020 crash.

BTC/USD weekly chart. Source: TradingView
In both prior instances, Bitcoin briefly dipped toward or below the 200-week SMA before staging a sustained recovery toward the 50-week SMA (red).
Related: Analyst says Bitcoin’s $60K bottom signals weaken bear-market forecast
Bitcoin’s next upside target could be near $94,700, up roughly 17% from current price levels, if the fractal continues to play out. A move that high could support Brett’s view that the bear market is nearing its end.
The bullish outlook is also backed by strong fundamentals, including aggressive whale accumulation that recently absorbed nearly 500% of Bitcoin’s newly issued supply.
After a relatively quiet weekend, bitcoin went through a highly volatile evening session on Sunday and Monday morning, before it was stopped at $82,400 after Trump’s comments on Iran’s latest proposal.
Many altcoins tried to break out yesterday, including XRP and ADA, but the overall bearish sentiment prevailed.
BTC Stopped at Over $82K
Last week was quite positive for the primary cryptocurrency. It began with a price surge to $80,800 on Monday, a level not seen in three months, before a sudden but brief crash drove it south by over two grand. However, BTC quickly rebounded and reclaimed the $80,000 level and even rocketed to $82,800 on Wednesday to mark a new local peak.
After gaining $8,000 in a week, though, bitcoin was due for a correction, which took place on Thursday and especially on Friday when it dipped to $79,100. Nevertheless, the bulls persevered and initiated a minor leg up that helped BTC reclaim the $80,000 level on Saturday.
The following 36 hours were calmer, but more volatility ensued on Sunday evening and Monday morning. BTC first jumped to $81,500, before it dived to $80,250, and then rocketed to $82,500. However, then dumped back down below $81,000 after US President Donald Trump rejected Iran’s latest proposal, calling it “totally unacceptable.”
BTC’s market cap remains around $1.620 trillion on CG, while its dominance over the alts is still above 58%.

Alts Stopped
XRP became the top performer yesterday evening at one point, gaining over 5% and exceeding $1.50 for the first time in over three weeks. As analysts were predicting a major breakout, though, the familiar rejection came, and the asset lost its momentum, dropping back down to $1.45. ADA faced a similar price trajectory and now sits at essentially the same level as yesterday.
ETH, BNB, SOL, TRX, and DOGE are also in the green on a daily scale, but are all lower than their respective peaks from yesterday evening. SUI has rocketed the most now, gaining 12% daily, while ZEC has plunged by over 6%. HYPE and UNI are also in the red.
The total crypto market cap is down to $2.780 trillion on CG after it topped $2.830 trillion yesterday evening.

The post BTC, XRP, ADA Stopped by Trump’s Latest Response to Iran Proposal: Market Watch appeared first on CryptoPotato.
Scalping indicators are technical tools that signal entries and exits in forex and CFD markets. They are typically applied on 1-minute to 5-minute charts during very short-term trades. These forex scalping indicators process price, momentum, and volatility data into structured readings. They suit conditions defined by tight spreads, fast execution, and small price fluctuations.
Scalpers execute many trades over minutes or seconds, aiming to capture minor price moves in active markets. Technical indicators offer the structured signals needed to support these fast decisions. This article covers the main indicators for scalping and their application to intraday trading.
Common scalping indicators include:
- Exponential Moving Average (EMA): smooths recent prices to indicate trend direction.
- Hull Moving Average (HMA): a faster moving average designed to reduce lag.
- Relative Strength Index (RSI): a momentum oscillator measuring overbought and oversold conditions.
- Bollinger Bands: volatility bands set around a moving average.
- Stochastic Oscillator: measures the closing price relative to a recent trading range to identify momentum.
- MACD: compares two moving averages to identify momentum and trend direction.
Role of Indicators in Short-Term Execution
As you may know, scalping is a trading strategy where traders aim to take advantage of small price movements by executing numerous trades within short timeframes, often closing trades within a few minutes. This approach requires swift decision-making and precise timing.
Technical indicators may be important tools in this context, as they provide real-time data and insights into market trends, momentum, and volatility. Using these indicators, traders can identify optimal entry and exit points, potentially enhancing their ability to navigate the rapid pace of the market.
Below, we’ll break down five indicators for scalping. You’ll find these scalping indicators in MT4 and MT5, and TradingView. Also, you can get started in seconds with FXOpen’s TickTrader trading platform.
Indicators in scalping are typically used for:
- Trend identification: spotting whether price is moving directionally.
- Entry timing: pinpointing moments to act on a setup.
- Volatility assessment: gauging how widely the price is swinging in real time.
Moving Averages

Moving averages (MAs) are considered by some to be the most popular indicator for scalping, smoothing out price data to help identify trends by calculating the average price over a specific period. In scalping, where quick decisions are crucial, certain types of moving averages can be useful.
Exponential Moving Average (EMA)
Unlike the Simple Moving Average (SMA), which assigns equal weight to all data points, the EMA gives more significance to recent prices, making it more responsive to current market movements. This responsiveness is advantageous for scalpers.
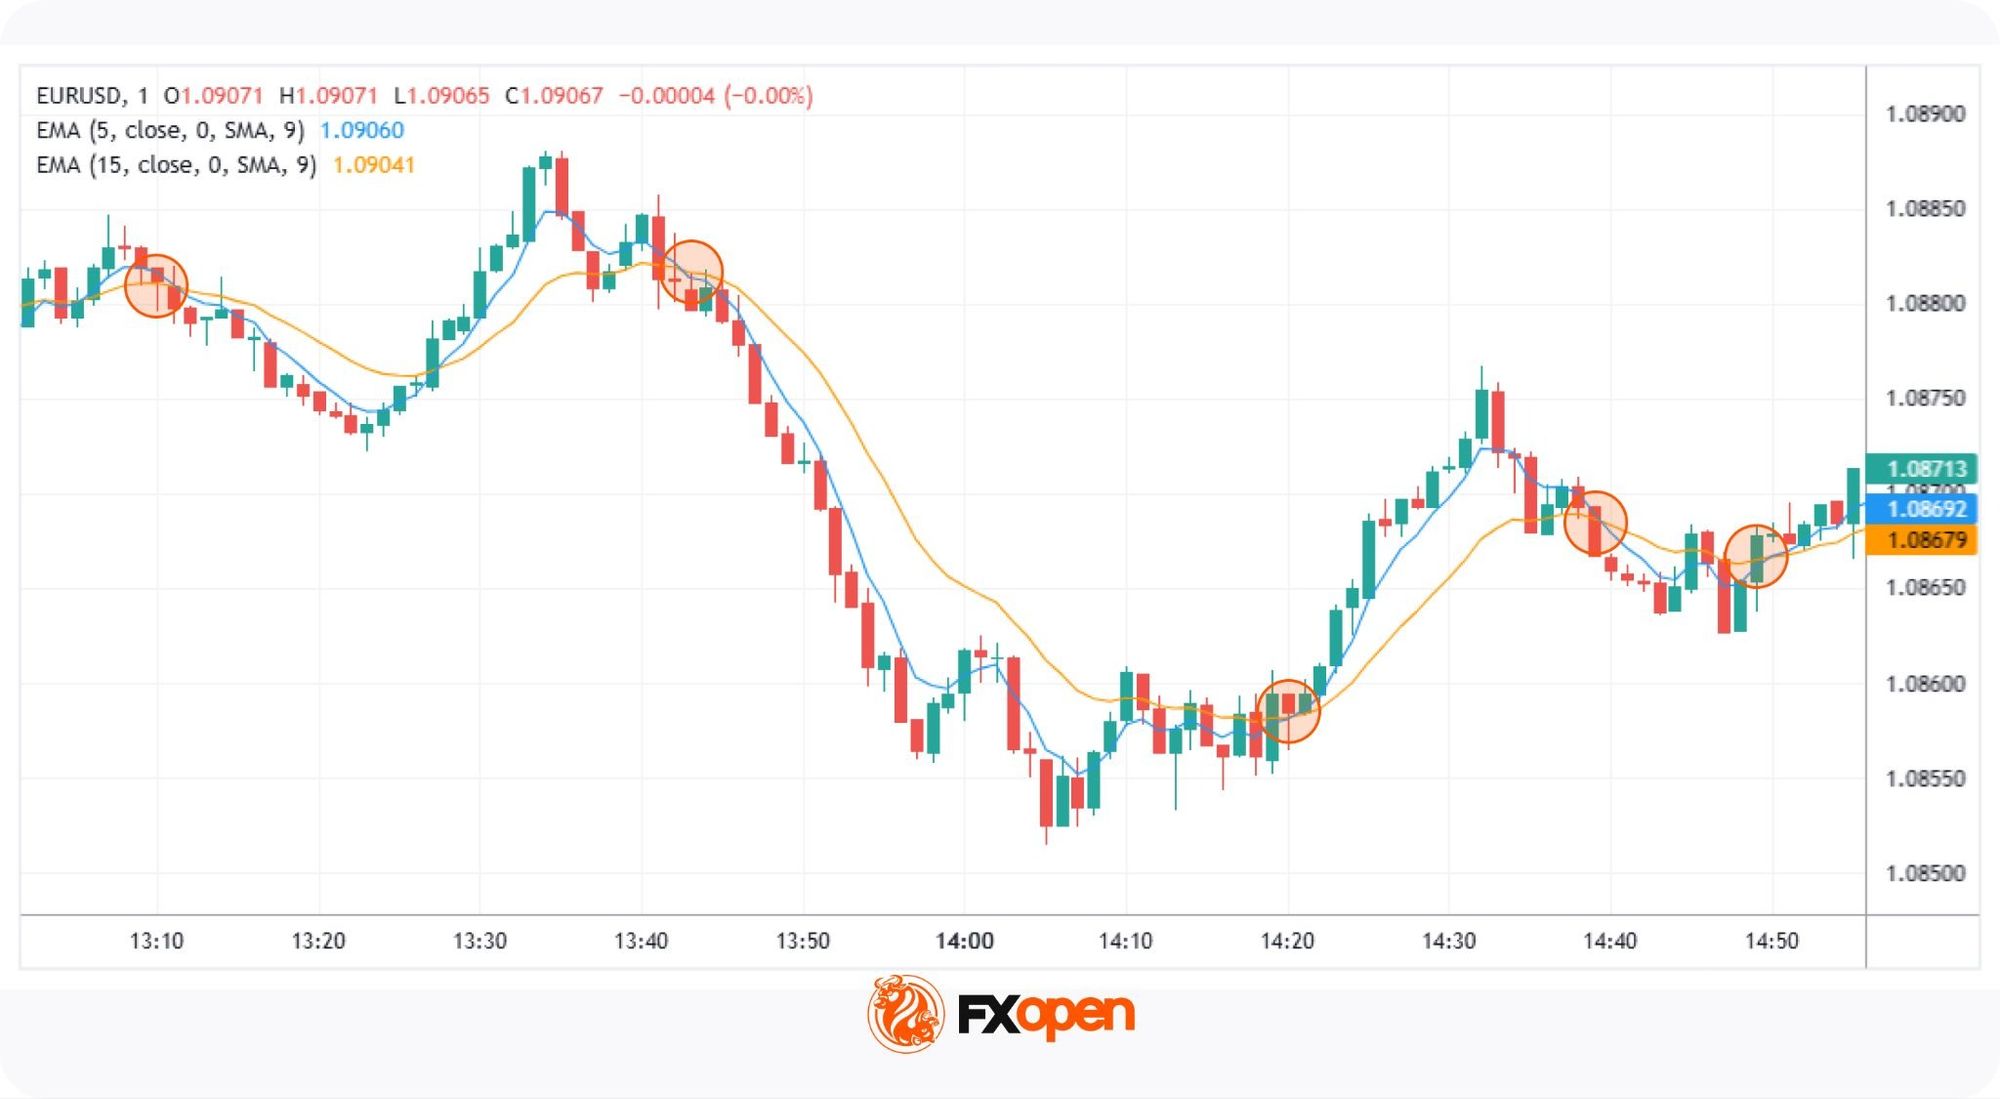
Common EMA settings for scalping include 5, 9, and 20 periods, depending on chart timeframe. For instance, a 9-period EMA reacts swiftly to recent price changes, potentially providing timely signals for entry and exit points. The EMA for scalping may also act as dynamic support or resistance during trending price action.
Hull Moving Average (HMA)
Developed by Alan Hull, the HMA further reduces lag. It does this by weighting recent prices more heavily and applying a different calculation. The result is a moving average that tracks price action more closely while smoothing noise.
Applying Moving Averages in Scalping
- Crossover Strategy: Scalpers often use two EMAs of different lengths. A common approach involves a fast EMA (e.g., 5-period) and a slow EMA (e.g., 15-period). When the fast EMA crosses above the slow EMA, it may indicate a bullish trend, suggesting an entry point for a buy trade or an exit point for a short trade. Conversely, when the fast EMA crosses below the slow EMA, it may signal a bearish trend, indicating a potential entry for a sell trade or moment to close a long trade.
- Trend Confirmation: The EMA and HMA can be used to confirm trends identified by other indicators. For example, if the moving average is sloping upwards, it may confirm an uptrend, supporting decisions to enter long positions. If it’s sloping downwards, it may confirm a downtrend, supporting decisions to enter short positions.
- Pullbacks: In trending markets, traders often monitor pullbacks to the EMA as potential continuation entries.
You can find these scalping indicators in TradingView and FXOpen’s TickTrader trading platform.
Relative Strength Index (RSI) in Scalping
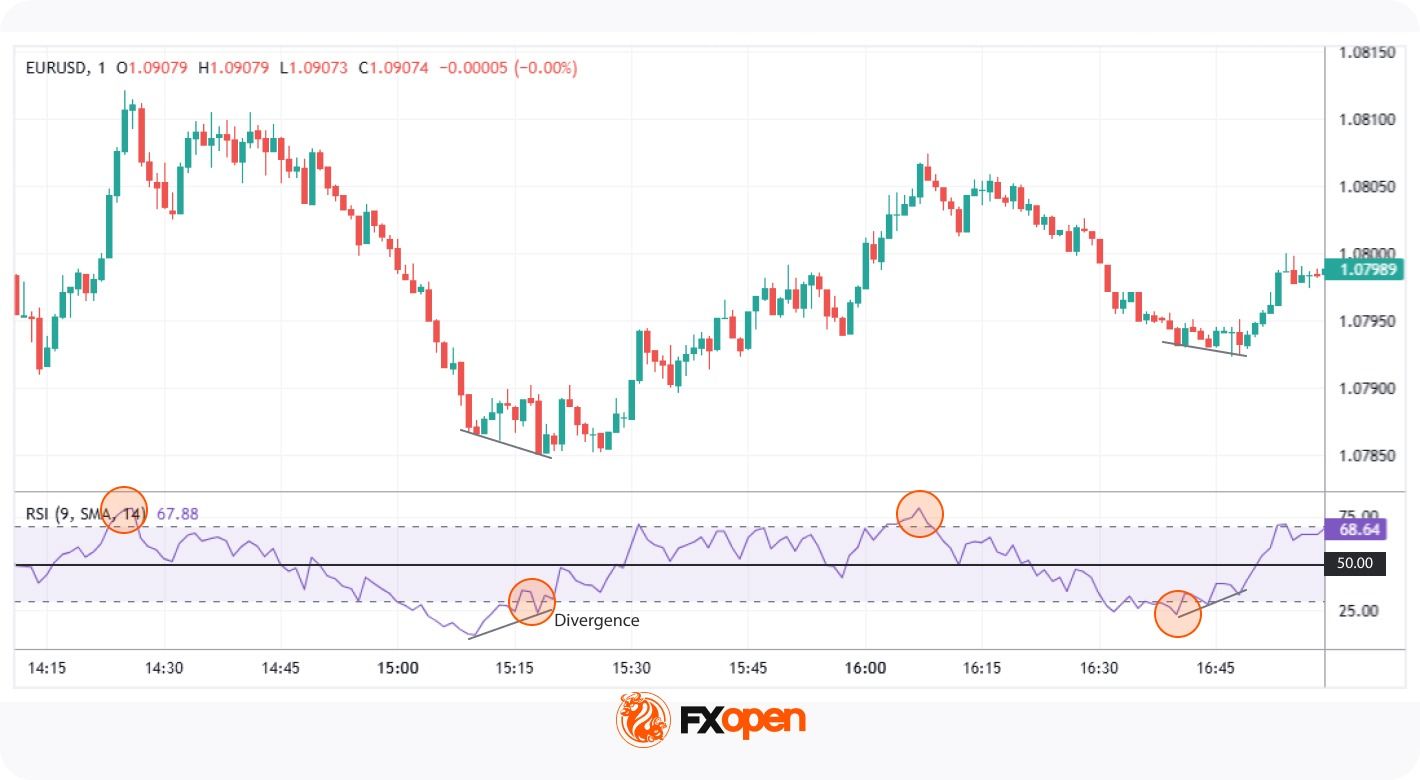
The Relative Strength Index (RSI) is a well-known scalping indicator that measures the speed and change of price movements, oscillating between 0 and 100. Traditionally, an RSI above 70 indicates overbought conditions, while below 30 suggests oversold conditions.
In scalping, traders often adjust the RSI from its typical length of 14 to shorter periods, such as 7 or 9, to capture rapid price swings occurring over minutes. This adjustment makes the RSI more sensitive to recent price changes, providing timely signals for quick trades. Shorter RSI scalping settings between 2 and 6 periods are also commonly used on very fast timeframes.
Applying RSI in Scalping
- Overbought/Oversold Levels: When the RSI moves beyond 70 or drops below 30, traders watch for potential reversal points. However, scalpers may focus on the RSI’s movement back into the 30-70 range as an early sign of momentum shifting.
- Divergences: Scalpers also look for divergence between price movement and the RSI. For example, if the price reaches a new high but the RSI does not, it may signal a weakening trend and possible reversal. This divergence may support traders in anticipating quick market shifts.
- Midpoint (50 Level): The 50 level serves as a midpoint, indicating the balance between gains and losses. An RSI crossing above 50 may suggest bullish momentum, while dropping below 50 can indicate bearish momentum. Scalpers use this midpoint to assess the prevailing market trend.
Bollinger Bands
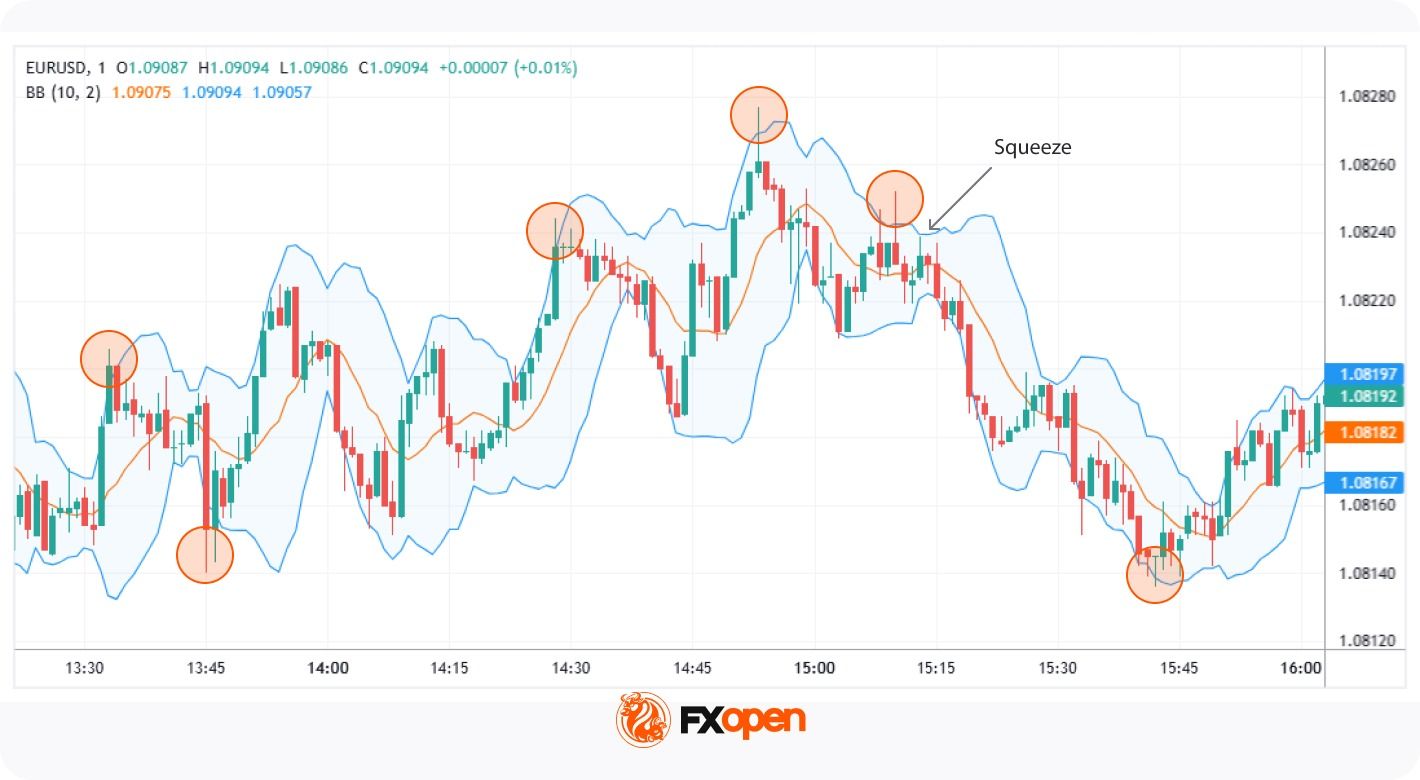
Bollinger Bands are a technical analysis tool comprising three lines: a simple moving average (SMA) in the middle, with upper and lower bands set at a specified number of standard deviations from the SMA. These bands expand and contract based on market volatility, providing a visual representation of price fluctuations. Squeeze conditions, where the bands narrow sharply, often precede expansion and stronger directional moves.
In scalping, traders often adjust Bollinger Bands scalping parameters to shorter timeframes, such as 1-minute or 5-minute charts, to capture quick price movements. A common approach involves setting the SMA period to 7-10 and the standard deviation to 1.5-2, potentially enhancing sensitivity to short-term market changes.
Applying Bollinger Bands in Scalping:
- Bollinger Squeeze: When the bands contract, indicating low volatility, it often precedes significant price movements. Scalpers watch for a breakout above or below the SMA. When the price breaks above the SMA, it may signal that the price will rise, and vice versa.
- Reversal: Price breaching the upper band may suggest overbought conditions, while below the lower band may indicate oversold conditions. Scalpers use these signals to anticipate potential price reversals.
Stochastic Oscillator
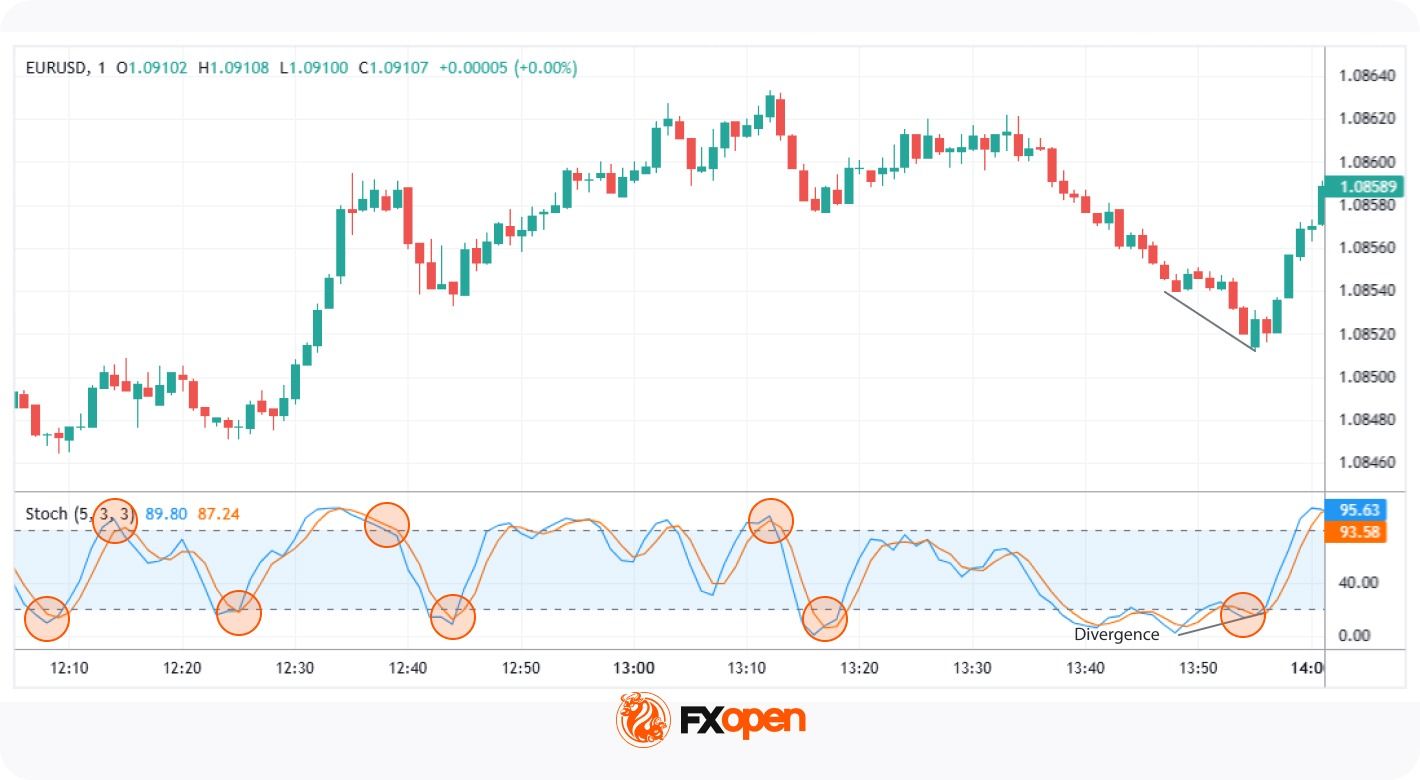
The Stochastic Oscillator is a momentum indicator that compares an asset’s closing price to its price range over a specific period, typically 14. It includes the %K line, the current closing price relative to the range, and the %D line, a moving average of %K. The scale runs from 0 to 100, where readings over 80 suggest overbought levels, and those under 20 point to oversold levels. The Stochastic Oscillator is more popular in range-bound markets than in strong trends.
In scalping, traders may adjust the Stochastic Oscillator to shorter settings, such as 5,3,3, to increase sensitivity to rapid price movements. This adjustment may help in capturing short-term market fluctuations.
Applying the Stochastic Oscillator in Scalping:
- Overbought and Oversold Conditions: When the %K line crosses the %D line in the overbought (above 80) or oversold (below 20) zones, it can signal a potential reversal. Scalpers use these crossovers as quick alerts for shifts in momentum, helping them to act swiftly in volatile markets.
- Crossovers: Besides extreme conditions, traders also monitor crossovers between %K and %D. A %K line crossing above %D from a lower level can suggest an upward move, while a downward crossover may hint at a short-term price decline.
- Divergence: If the price makes a new high/low but the Stochastic Oscillator does not, it may signal a weakening trend, indicating a potential reversal.
Moving Average Convergence Divergence (MACD)
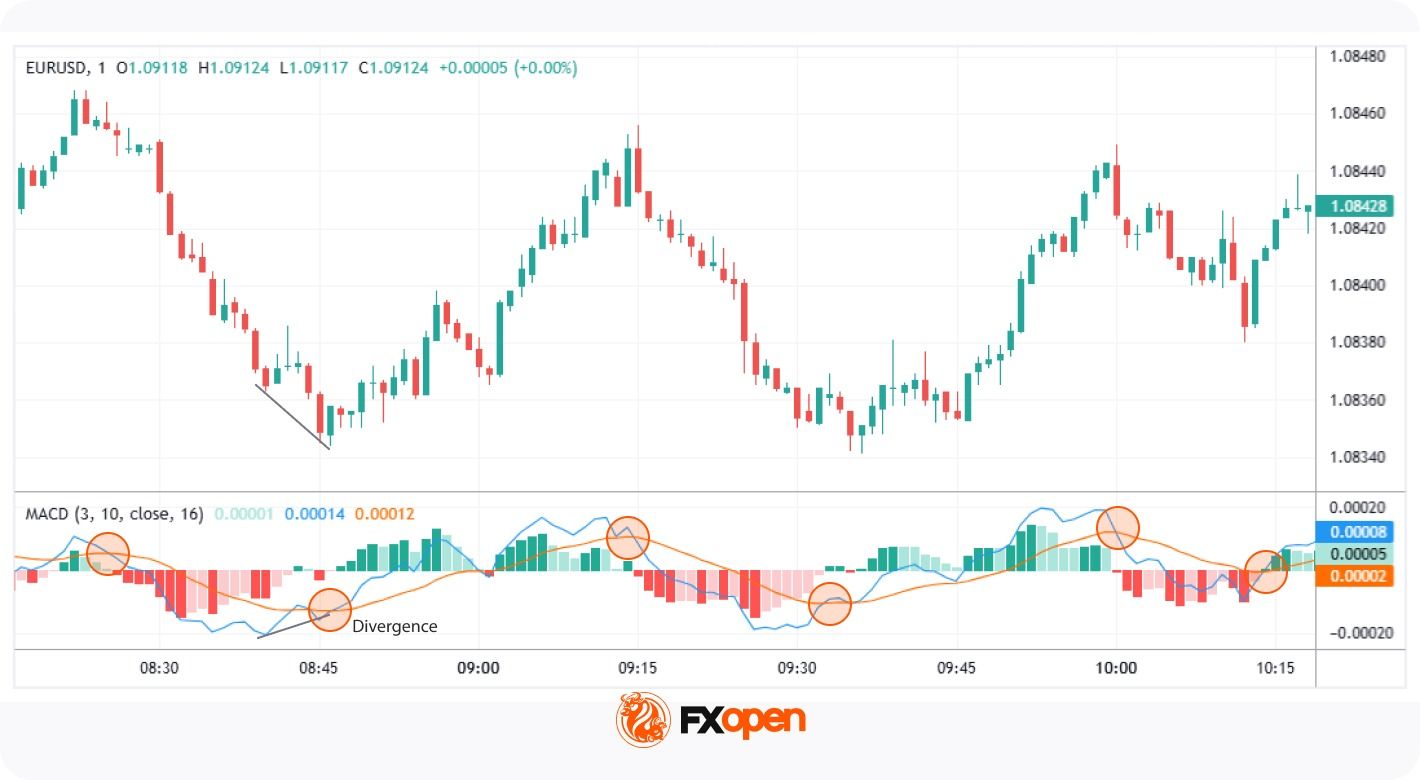
The Moving Average Convergence Divergence (MACD) is a widely used scalping indicator. It’s a momentum indicator that reflects the relationship between two moving averages. It comprises the MACD line (the difference between the 12-period and 26-period exponential moving averages), the signal line (a 9-period EMA of the MACD line), and a histogram, which illustrates the gap between the two lines.
Scalpers prefer to adjust these settings to 3, 10, and 16, respectively, to make the MACD more responsive to rapid price movements.
Applying MACD in Scalping:
- Crossovers: When the MACD line crosses above the signal line, it may indicate bullish momentum; a crossover below suggests bearish momentum. Scalpers monitor these crossovers to identify potential entry and exit points.
- Histogram Analysis: The histogram represents the difference between the MACD and signal lines. Histogram contraction in the MACD scalping indicator may reflect weakening momentum, while expansion tends to indicate momentum building in the prevailing direction. Scalpers use these changes to gauge the intensity of price movements.
- Divergences: A divergence occurs when the price moves in one direction while the MACD line moves in the opposite. For example, if the price reaches a new low but the MACD does not, it may reflect a potential upward reversal. Scalpers watch for such divergences to anticipate shifts in market direction.
Indicator Confluence in Scalping
Confluence refers to combining signals from multiple indicators to potentially filter noise and improve signal reliability. Each indicator offers unique insights, and their combined use may help filter out false signals. Here are some pairings:
- EMA + RSI → trend direction plus momentum confirmation: Utilising the Exponential Moving Average to identify trend direction alongside the Relative Strength Index to gauge momentum may help traders confirm the strength of a trend before making decisions. For instance, if the EMA indicates an uptrend and the RSI is above 50, it may suggest strong bullish momentum.
- Bollinger Bands + Stochastic → volatility plus reversal signals: Bollinger Bands measure volatility, while the Stochastic Oscillator identifies overbought or oversold conditions. When prices touch the upper or lower bands and the Stochastic Oscillator reflects overbought or oversold conditions, it may indicate potential reversal points.
- MACD + RSI → momentum confirmation across two indicators: The Moving Average Convergence Divergence (MACD) highlights momentum changes, and the RSI indicates overbought and oversold conditions. Using them together can support traders in confirming potential entry or exit points. For example, if the MACD shows bullish momentum and the RSI is rising but not yet overbought, it may signal the price will rise.
Indicator Settings Commonly Used in Scalping
The table below summarises typical scalping configurations for each indicator covered above. These are the settings traders most often apply on these indicators for 1-minute trading and 5-minute trading.
Market Conditions and Indicator Behaviour
Indicator readings shift in reliability depending on the underlying market environment. No single tool performs identically across trend, range, and low-volatility conditions.
In trending markets, the EMA and momentum indicators such as MACD tend to dominate. Trend-following signals carry more weight when price moves directionally with sustained pressure.
In range-bound markets, oscillators become more relevant. The Stochastic Oscillator and RSI often produce cleaner reversal signals when price oscillates between defined support and resistance levels. Moving average crossovers may generate frequent false signals in these conditions.
Under low-volatility conditions, signals across all indicator types weaken. Bollinger Bands contract, momentum readings flatten, and crossovers lose meaning. Traders often wait for volatility expansion before acting on indicator-based setups.
Limitations of Indicators in Scalping
Scalping with indicators offers valuable insights, but there are some challenges traders should be aware of:
- False Signals: Rapid market movements can trigger misleading signals, causing traders to act prematurely.
- Overtrading: Relying too heavily on short-term indicators can lead to excessive trades, increasing transaction costs.
- Market Noise: High volatility and frequent price fluctuations can make it difficult to distinguish genuine trends from random market “noise.”
- Lagging Indicators: Some indicators may react too slowly, causing traders to miss potential trades.
- Tuning: Tuning indicators may be necessary to optimise performance. Academic research has tested indicators such as MACD and RSI across multiple developed markets, with results varying by index, period, and parameter settings.
Key Takeaways on Scalping Indicators
Scalping relies on precise and timely decisions, which is why technical indicators play an important role in this trading style. Tools such as moving averages and oscillators provide structured signals that may support traders in navigating fast market movements. The choice of indicators varies depending on individual trading preferences, market conditions, and timeframes.
If you want to test the above-mentioned indicators or find something new for yourself, you can open an FXOpen account to access over 700 markets and trade with tight spreads from 0.0 pips.
FAQ
What Indicators Are Used for Scalping?
Common scalping indicators include the Exponential Moving Average (EMA), Relative Strength Index (RSI), Bollinger Bands, Stochastic Oscillator, and Moving Average Convergence Divergence (MACD). The Hull Moving Average is also used by some traders. Each tool serves a different function across trend identification, momentum measurement, and volatility assessment on short-term charts.
What EMA Settings Are Used in Scalping?
Common EMA settings for scalping include 5, 9, and 20 periods on 1-minute and 5-minute charts. Traders often pair a fast EMA, such as 5 or 9, with a slower EMA, such as 15 or 20, to monitor crossovers. Shorter periods react faster but may produce more false signals.
Can RSI Be Used for Short-Term Trading?
Yes, the RSI is popular among short-term trading indicators. Scalpers typically reduce the RSI period from the standard 14 to between 2 and 7 to capture rapid price swings. Traders watch for crosses above 70 or below 30, divergences with price, and movement around the 50 midpoint.
How Do Bollinger Bands Work in Scalping?
In scalping, traders often use a 7 to 10 period SMA with 1.5 to 2 standard deviations. Squeeze conditions may precede breakouts, while band touches may indicate reversal zones.
Do Indicators Behave Differently in Trending and Ranging Markets?
Yes, indicator reliability shifts with market conditions. In trends, momentum indicators such as MACD and EMAs tend to perform more consistently. In ranges, oscillators such as RSI and Stochastic produce cleaner reversal signals. Under low volatility, signals across all indicator types tend to weaken.
What Is the 1-Minute Scalp Strategy?
The 1-minute scalp strategy involves making rapid trades on a 1-minute chart. Traders look for small price movements and enter multiple trades within a short period, often using scalp trading indicators like the EMA or RSI for quick signals.
What Is the 5-Minute Scalping Strategy?
The 5-minute scalping strategy focuses on capturing short-term price movements on a 5-minute chart. Traders typically combine trend and momentum indicators, like the MACD and Bollinger Bands, to make fast, informed decisions.
Are There Good Stocks for Scalping?
The choice depends on the trader’s risk tolerance, trading approach, experience, and toolkit. However, according to theory, stocks with high liquidity, tight spreads, and significant daily volume are good for scalping. Popular choices include tech giants like Apple (AAPL) and Tesla (TSLA), as they offer frequent price fluctuations. But at the same time, they bear higher risks.
This article represents the opinion of the Companies operating under the FXOpen brand only. It is not to be construed as an offer, solicitation, or recommendation with respect to products and services provided by the Companies operating under the FXOpen brand, nor is it to be considered financial advice.


Mixero has expanded Advanced Mode with Monero-based routing for BTC and ETH, giving users a stronger privacy path across two major public blockchain networks.
Mixero, a crypto privacy service for public blockchains, has expanded Advanced Mode across Bitcoin and Ethereum flows. The feature routes assets through Monero before settlement on a fresh receiving address, adding a privacy step built around one of the most established privacy coins in crypto.
Advanced Mode Adds Monero Routing for BTC and ETH
Mixero Advanced Mode uses an XMR bridge for stronger transaction privacy. The platform supports ETH mixing and gives users a Monero-based route for stronger separation between entry and exit activity. Mixero’s FAQ explains the Advanced Mode path as BTC to XMR and back to BTC through auto-generated wallets.
The same privacy concept now applies to Ethereum. Users can route ETH through a Monero-based privacy path before receiving ETH on a fresh address. This extends Mixero’s strongest privacy option beyond Bitcoin and into a network where wallet activity, balances, and transaction history are widely visible through block explorers.
Why Monero Strengthens Transaction Privacy
Bitcoin and Ethereum use public ledgers. Transaction data becomes part of a shared blockchain record, and Ethereum block explorers allow anyone to view real-time data on blocks, transactions, accounts, validators, and other on-chain activity.
Monero was built around privacy by default. Its privacy design uses ring signatures, stealth addresses, and Ring Confidential Transactions. Ring signatures help obscure spent outputs, while stealth addresses create random one-time addresses for every transaction. RingCT hides transaction amounts on the Monero network.
This design makes Monero useful as a privacy bridge for public-chain users. When BTC or ETH passes through XMR inside Advanced Mode, the visible transaction path becomes harder to connect through standard blockchain analysis.
Ethereum Mixing Expands Mixero’s Privacy Coverage
Ethereum users face a privacy problem because each wallet can accumulate a detailed public history. DeFi swaps, stablecoin transfers, NFT purchases, token approvals, and wallet balances can remain visible for long periods. For active users, one wallet can reveal behavior, counterparties, and portfolio exposure.
Mixero’s ETH mixing support gives Ethereum users access to a Monero-based privacy route inside the same Advanced Mode concept used for Bitcoin. The result is a stronger separation between the sending wallet and receiving wallet across an ecosystem with heavy public indexing and analytics coverage.
This is especially relevant for users who want better wallet hygiene before sending funds, separating personal and business activity, or reducing public exposure around holdings. The feature gives ETH users a privacy option built around Monero rather than simple address rotation.
Auto-Generated Wallets Add Separation Between Entry and Exit
Advanced Mode uses auto-generated wallets along the route. These wallets help separate the original deposit activity from the final receiving address, reducing the ease of address clustering.
For BTC, the path follows BTC to XMR to BTC. For ETH, the path follows ETH to XMR to ETH. In both cases, the Monero segment adds a privacy break between the source asset and the final output asset.
This design gives users a higher level of discretion while keeping the final asset familiar. A BTC user receives BTC. An ETH user receives ETH. The privacy step occurs in between, through XMR routing and temporary wallet generation.
About Mixero
Mixero is a crypto privacy service for public blockchains. The platform offers Bitcoin mixing, ETH mixing, Tor access, Letters of Guarantee, and Advanced Mode with Monero routing for users seeking stronger wallet privacy and reduced on-chain linkability.
The post Mixero Crypto Mixer Brings Monero-Level Privacy to Bitcoin and Ethereum appeared first on BeInCrypto.


- Crypto DCA works well, but DeFi infrastructure still complicates automated investing.
- CoinFello simplifies DeFi dollar-cost averaging through conversational, non-custodial automation tools.
- DCA as a strategy has held up across decades of market cycles because the underlying logic is sound.
Dollar-cost averaging (DCA) is one of the most thoroughly studied approaches to long-term investing, with its mechanics being quite straightforward, i.e., instead of trying to call market bottoms or time entries, an investor commits to buying a fixed dollar amount of an asset at regular intervals, letting the purchase price average out over time.
In volatile markets, this tends to produce better outcomes than discretionary timing specifically.
This is partly because it removes emotion from the equation and partly because it sidesteps the statistical near-impossibility of consistently buying at lows.
The evidence for this is well-documented, as research into Bitcoin DCA strategies has found that investors who purchased fixed amounts of BTC on a weekly basis over any rolling four-year window since 2015 came out ahead in nearly every scenario, even when the entry point coincided with a local price peak.
That pattern has held through multiple market cycles, including the sharp correction of 2022 and the subsequent recovery into 2024 and 2025.
Meanwhile, a 2025 Fidelity survey found that among retail investors who describe themselves as long-term crypto holders, the most common strategy cited was some form of regular, fixed-amount purchasing rather than active trading.
The argument for DCA in crypto is, if anything, stronger than in traditional equities, precisely because the volatility that makes single-entry timing so risky also creates the conditions where spread-out purchasing tends to perform best.
In 2025 alone, Bitcoin moved from below $50,000 in the early part of the year to above $100,000 mid-cycle before experiencing a significant pullback.
For anyone attempting to time that range, the experience was punishing, but for anyone buying at fixed intervals throughout, the results were considerably more manageable.
Why DeFi turns a simple habit into a technical project
The disconnect here is worth spelling out, because it is more structural than it might appear at first.
This is because a traditional brokerage’s recurring investment feature involves two steps, i.e., choosing the asset and setting the frequency (while the platform handles everything else).
The DeFi equivalent requires considerably more as a user who wants to regularly move stablecoins into a yield-bearing position, or set up recurring purchases of an asset across any EVM-compatible network, needs to navigate the relevant protocol’s front-end, connect their wallet, handle any cross-chain bridging (if assets sit on a different network), and manage gas fees at the moment of each transaction.
Not only that, this chain of events needs to be repeated across interfaces that change frequently and occasionally go offline without notice.
There is also the monitoring burden that comes alongside any position held in DeFi, as a sudden market dislocation, like the conditions that drove over $1.7 billion in liquidations across Ethereum and EVM-compatible networks in October 2025, can unwind a position within hours.
For users executing DCA manually while also managing active positions, the response window is narrow, and the cognitive load is high.
In all of this, CoinFello has built a digital foundation that addresses such gaps without requiring users to work around DeFi’s UX limitations.
The platform connects to all EVM-compatible wallets, with users also able to create accounts via email or phone number, and provides a chat interface through which DCA instructions can be set in plain language.
A prompt like “buy $100 of ETH every week using my stablecoin balance” is treated as an instruction, with the agent identifying the correct on-chain execution path and presenting the full transaction breakdown to the user before anything touches their portfolio.
Critically, the DCA automation CoinFello currently offers does not require delegating open-ended wallet access, with users retaining full custody of their assets throughout the process, approving each execution in the sequence while maintaining visibility into exactly what is happening on-chain and why.
Lastly, the founder, Jacob Cantele, previously served as Lead of Operations at MetaMask with Consensys, and that background shows in the way CoinFello handles its control layer.
The future of digital finance
DCA as a strategy has held up across decades of market cycles because the underlying logic is sound.
However, the gap that has persisted in DeFi is not that the strategy does not apply (because it clearly does, perhaps more than anywhere else) but that the infrastructure for executing it simply and without custody trade-offs has not kept pace.
And while that gap is starting to close, the tooling doing it is beginning to look a lot more like a conversation than a dashboard.
In any case, the future seems to be full of exciting developments.
Source link
GBP/USD is attempting a consolidation phase above 1.33500. USD/CAD is showing positive signs and might aim for more gains above 1.3725.
Important Takeaways for GBP/USD and USD/CAD Analysis Today
- The British Pound started a recovery wave above 1.3515 and 1.3550.
- There is a key bearish trend line forming with resistance near 1.3620 on the hourly chart of GBP/USD at FXOpen.
- USD/CAD rallied above 1.3650 and 1.3680 before the bears appeared.
- There was a break above a bearish trend line with resistance at 1.3695 on the hourly chart at FXOpen.
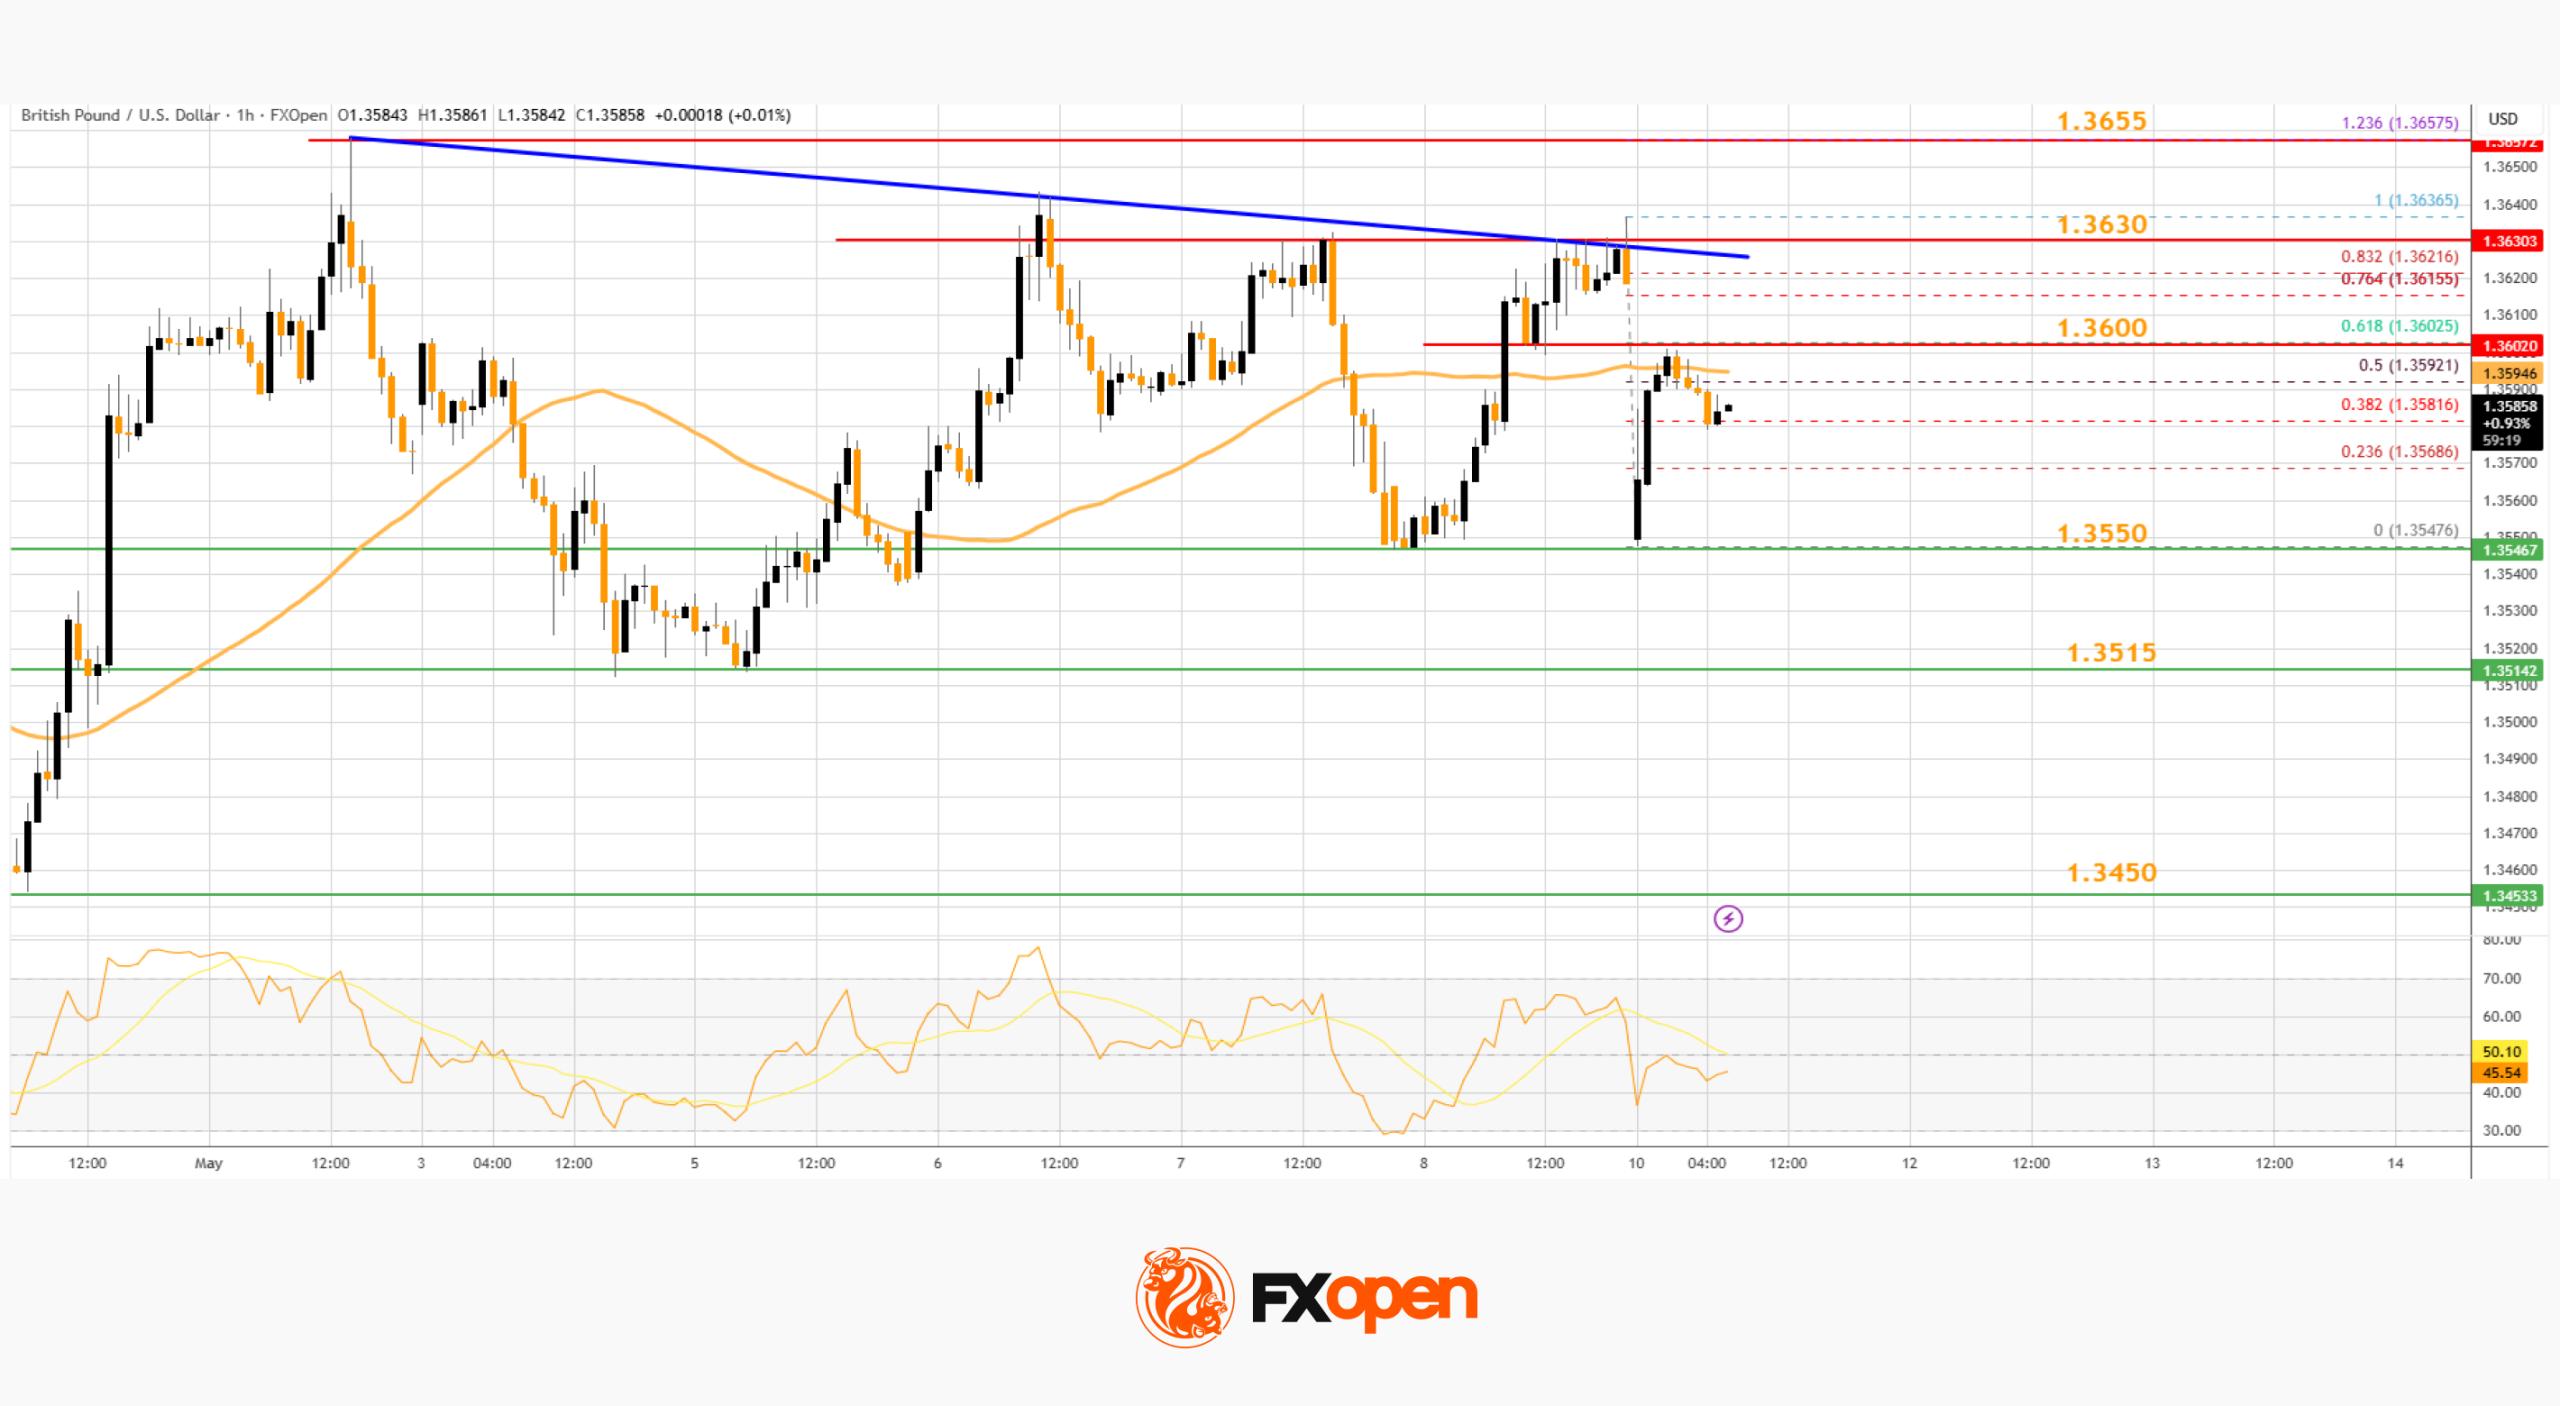
GBP/USD Technical Analysis
On the hourly chart of GBP/USD at FXOpen, the pair started a fresh decline from 1.3635 after a decent increase. The British Pound traded below 1.3600 to again move into a short-term bearish zone against the US Dollar.
The pair even traded below 1.3580 and the 50-hour simple moving average. Finally, the bulls appeared near 1.3550. A low was formed near 1.3547, and the pair is now attempting a short-term recovery wave.

There was a fresh upside above 1.3580 and the 50% Fib retracement level of the downward move from the 1.3636 swing high to the 1.3547 low. The pair is now showing positive signs above 1.3550. Immediate resistance on the upside is near the 61.8% Fib retracement level at 1.3600 or the 50-hour simple moving average.
The first major hurdle for the bulls on the GBP/USD chart is near a bearish trend line at 1.3620. A close above 1.3620 might spark a decent increase. The next stop for the bulls might be 1.3655. Any more gains could lead the pair toward 1.3710 in the near term.
Initial support sits at 1.3550. The next key area of interest might be 1.3515, below which there is a risk of another sharp decline. In the stated case, the pair could drop toward 1.3450.
USD/CAD Technical Analysis
On the hourly chart of USD/CAD at FXOpen, the pair formed a strong support base above the 1.3580 level. The US Dollar started a fresh increase above 1.3635 against the Canadian Dollar.
The pair cleared the 50-hour simple moving average, climbed above 1.3650, and surpassed a bearish trend line at 1.3695. The last swing high was formed at 1.3723, and the pair is now showing positive signs above the 23.6% Fib retracement level of the upward move from the 1.3579 swing low to the 1.3723 high.
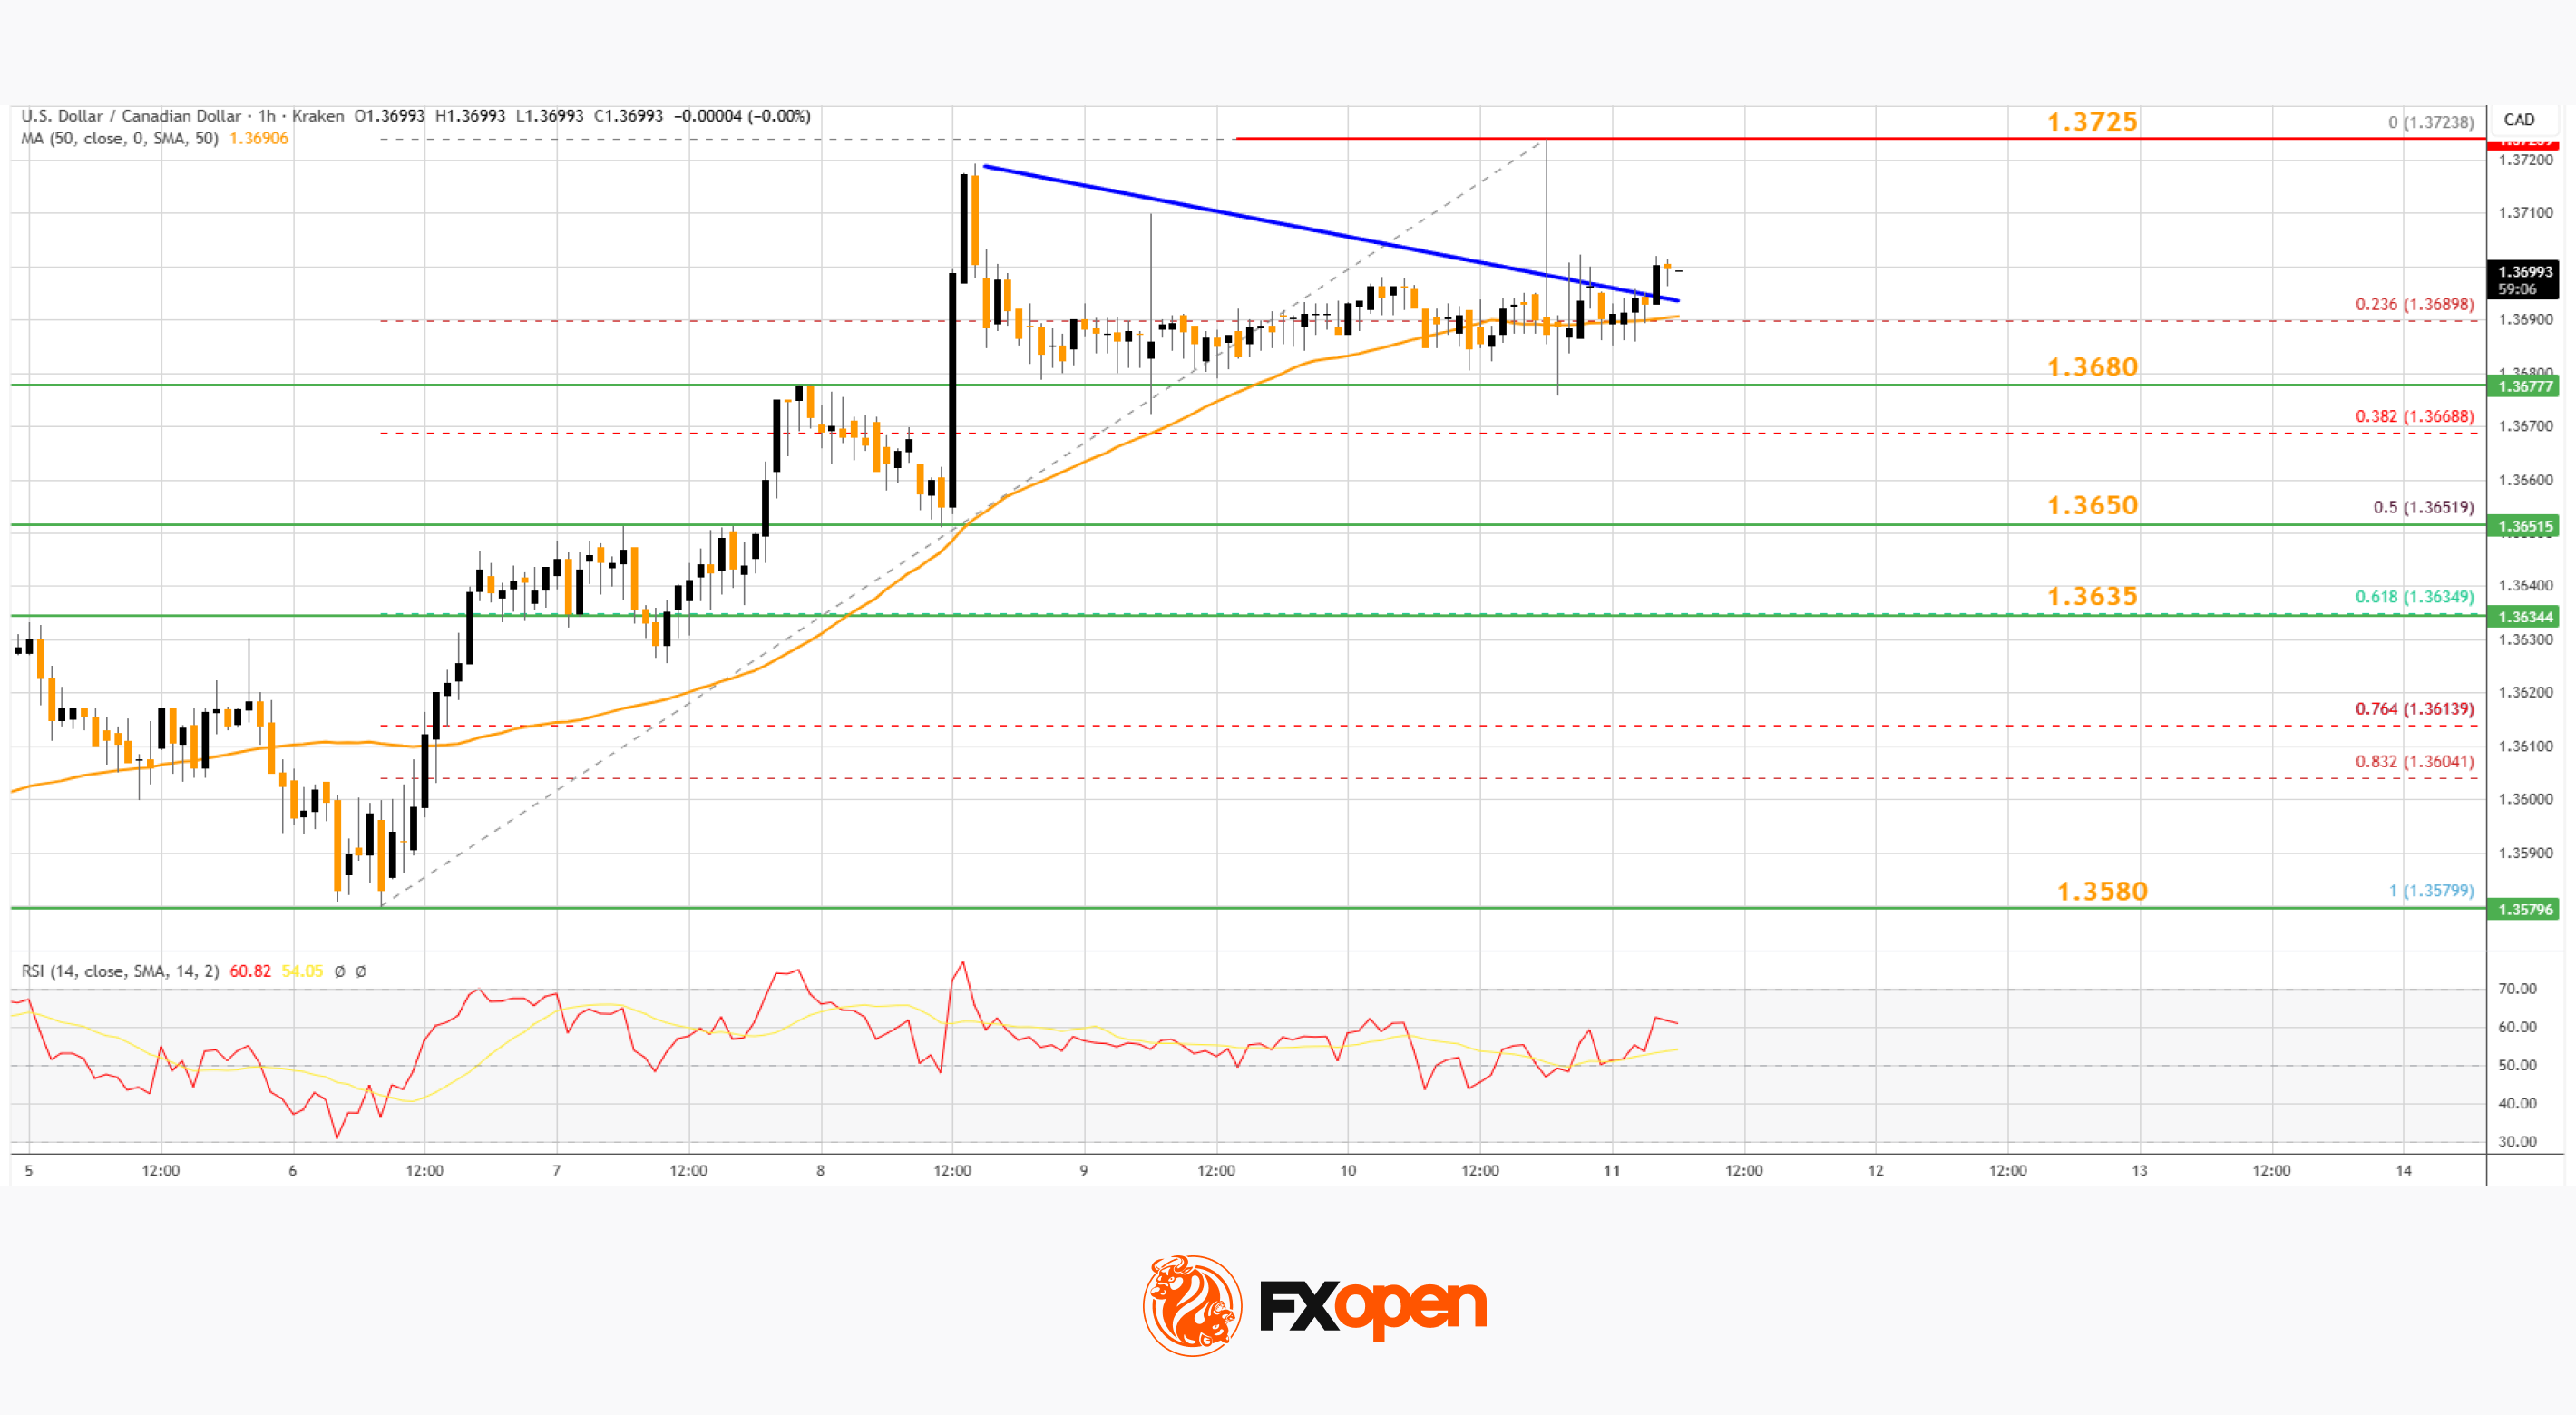
On the upside, Initial resistance sits near 1.3725. The main breakout zone could be 1.3740. A clear upside break above 1.3740 could start another steady increase.
The next major stop for the bulls might be 1.3800. Any more gains could open the doors for a test of 1.4000. If there is a pullback, the pair could find bids near 1.3680 or the 50-hour simple moving average. A downside break below 1.3680 might send the pair toward the 50% Fib retracement at 1.3650.
The next major area on the same USD/CAD chart could be 1.3580. A close below 1.3580 could push the pair further lower. In the stated case, the bears might aim for a test of 1.3500.
Trade over 50 forex markets 24 hours a day with FXOpen. Take advantage of low commissions, deep liquidity, and spreads from 0.0 pips (additional fees may apply). Open your FXOpen account now or learn more about trading forex with FXOpen.
This article represents the opinion of the Companies operating under the FXOpen brand only. It is not to be construed as an offer, solicitation, or recommendation with respect to products and services provided by the Companies operating under the FXOpen brand, nor is it to be considered financial advice.

Key Takeaways
- Bank of America lifted Intel’s price target from $56 to $96 while maintaining an Underperform rating
- The Wall Street Journal disclosed that Apple and Intel secured a preliminary manufacturing deal for chip production
- Intel shares surged 14% on Friday, reaching an all-time closing high of $124.92, marking approximately 240% gains this year
- BofA projects the Apple partnership could generate roughly $10B in yearly foundry revenue for Intel by 2030
- A senior Intel executive offloaded $4M in company shares at $99.53 per share prior to Friday’s stock surge
Intel (INTC) shares reached an unprecedented all-time peak on Friday following a Wall Street Journal disclosure revealing that Apple and Intel have finalized a preliminary manufacturing partnership for producing chips destined for Apple products. Shares concluded trading at $124.92, representing a remarkable 14% single-session increase and pushing year-to-date performance to approximately 240%.
Bank of America reacted by adjusting its Intel price forecast upward — from $56 to $96 — while maintaining its Underperform designation on the equity. The firm’s research team believes investors have already accounted for the potential benefits from the Apple collaboration.
BofA projects the partnership could ultimately deliver approximately $10 billion in yearly foundry revenue for Intel by decade’s end, assuming Intel secures around 25% of Apple’s semiconductor production volume. While this represents a substantial opportunity, analysts caution that significant challenges remain.
In the immediate future, M-Series processors for MacBooks and iPads are anticipated as the initial manufacturing focus. A-Series chips powering iPhones could eventually be included, though that timeline extends considerably further.
BofA has refrained from incorporating the Apple partnership into its official financial projections yet, pointing to insufficient details regarding contract specifics. The firm also highlighted a two-to-three year period required for capital investment, production qualification, and manufacturing scale-up.
Profitability Concerns in Initial Phases
Gross profit margins are anticipated to suffer during the initial implementation period. Equipment depreciation, lower production yields, and launch-related expenses will pressure bottom-line results. Intel’s target of achieving foundry operating profitability by 2027 may be delayed by one to two years, BofA’s research team suggests.
“We reiterate Underperform as we believe these upsides are already fully valued,” the analysts stated. They emphasized that AMD and ARM are better situated to capitalize on the expanding server CPU marketplace, which BofA now forecasts will achieve $120 billion by 2030, revised upward from a previous $80 billion projection.
The price target revision stemmed from an updated sum-of-parts valuation methodology and the revised server CPU market forecast — not directly from the Apple partnership announcement.
Executive Stock Sale Draws Attention
Separate from the partnership announcement, another development merits consideration. Executive VP April Miller Boise divested approximately $4 million in Intel shares at an average transaction price of $99.53 — representing a 28% decrease in her stake. This transaction marked the most substantial insider divestment at Intel over the preceding twelve-month period.
The transaction occurred at a valuation significantly beneath Friday’s closing price of $124.92. Although insider sales occur for various personal and financial reasons, such activity is typically interpreted as a bearish indicator — especially when the sale price falls considerably below subsequent trading levels.
Intel executives as a group control roughly 0.08% of the corporation, presently valued at approximately $483 million. No company insider has acquired Intel shares during the past three months.
As of Monday’s pre-market session, Intel was changing hands at $130.80, representing an additional 4.71% increase beyond Friday’s record finish.

Ripple’s cross-border token went on an impressive run Sunday evening, outperforming all other larger-cap alts and bitcoin.
However, it faced the same fate as it did during its previous several breakout attempts as the bears stepped up. Nevertheless, analysts remain optimistic about its future price performance despite the most recent rejection.
XRP Tried and Failed (Again)
The asset had fallen to $1.38 in the hours leading up to the major breakout attempt, before it jumped to $1.42 and then to over $1.50. This substantial increase came amid many analysts predicting such a move from XRP, given its prolonged consolidation.
However, its momentum quickly faded, nowhere near the targets set by those analysts of up to $1.80. The most likely reason for this failed attempt was the developments on the US-Iran front, which have continuously impacted the entire crypto market.
Iran had sent another peace proposal to the US, which the latter’s President, Donald Trump, deemed “totally unacceptable.” XRP’s price rejection came shortly after Trump’s response went viral, and it was mimicked by many other digital assets. BTC, for example, had risen to $82,300 before it dropped almost immediately to under $81,000.
However, XRP’s situation is rather different as its more macro momentum is mostly downhill. It closed six consecutive months in the red, five of which were by double-digit losses, before it finally broke that streak in April with a minor increase. In addition, all of its breakout attempts in 2026 have been halted, and have marked lower highs since then.
Analysts Still Positive
Despite facing yet another rejection in its tracks, many analysts still believe XRP is on the right path to a more profound breakout. CW noted that the upward momentum in the futures market is “being maintained,” while the downward pressure is “small.” As such, they predicted that “the rise will resume” over time.
Although $XRP has fallen after a rise, the upward momentum in the futures market is being maintained.
Downward pressure during the decline is small.
Over time, the rise will resume. pic.twitter.com/AwJBofQTMj
— CW (@CW8900) May 11, 2026
CRYPTOWZRD said XRP had closed “a bit bullish” but expects validation in the next 12-24 hours. XRP has to hold above $1.445, which is currently being tested, to offer more upside potential.
ERGAG CRYPTO, who focuses mostly on the long-term charts, also noted that the asset’s bull structure is still intact as it remains above the 2-Month 21 EMA. They explained that the actual bull confirmation would come only after XRP reclaims $2.40-$3.36, which would open the door for their massive prediction of up to $13.
The post Why Was Ripple (XRP) Rejected at $1.50 Again? appeared first on CryptoPotato.

Barcelona win La Liga: How Hansi Flick’s side dominated Real Madrid

SME Funded Launches UK’s First One-Stop Finance Platform for Construction & Manufacturing SMEs

Canton Network’s Digital Asset targets $2 billion valuation in raise led by a16z crypto: Bloomberg
Manchester United reach agreement with Casemiro over contract clause amid transfer speculation

US brings back mandatory military draft registration

Steven Gerrard disagrees with Gary Neville over ‘shock’ Chelsea and Arsenal claim | Football


-
 Crypto World3 days ago
HarrisX Poll Found 52% of Registered Voters Support the CLARITY Act
-

 Crypto World4 days ago
Upbit adds B3 Korean won pair as Base token gains Korea access
-

 Fashion3 days ago
Weekend Open Thread: Marianne Dress
-

 Tech7 days ago
Image AI models now drive app growth, beating chatbot upgrades
-
 NewsBeat4 days ago
NCP car park operator enters administration putting 340 UK sites at risk of closure
-

 Politics2 days ago
Politics Home Article | Starmer Enters The Danger Zone
-
 Business2 days ago
Ignore market noise, India’s long-term story intact, say D-Street bulls Ramesh Damani and Sunil Singhania
-

 Tech3 hours ago
GM Agrees To Pay $12.75 Million To Settle California Lawsuit Over Misuse Of Customers’ Driving Data
-
 Sports7 days ago
2026 NHL playoff picks: Second-round predictions, series odds, Stanley Cup bracket
-

 Crypto World6 days ago
UAE Free Zone Deploys Blockchain IDs to Verify Registered Firms
-

 Crypto World5 days ago
BlackRock CEO Larry Fink Discusses a New Asset Class
-

 Crypto World4 days ago
Robinhood says Wall Street is building onchain
-

 Tech1 day ago
Auto Enthusiast Carves Functional Two-Stroke Engine from Solid Metal
-
Entertainment6 days ago
Serena Williams hits Met Gala in metallic dress after GLP-1 reveal
-

 Tech5 days ago
Apple and Samsung are dominating smartphone sales so thoroughly that only one other company makes the top 10
-

 Entertainment7 days ago
Skai Jackson Responds To AI Baklash After Viral Snapchat Photos
-

 Politics6 days ago
Met Gala 2026: Madonna’s Dramatic Red Carpet Look Steals The Show
-

 Tech5 days ago
I tested the Xiaomi 17 Ultra’s camera and I don’t think I’ll ever go back to an iPhone
-

 Fashion5 days ago
The Best Work Pants for Women in 2026
-
 Sports7 days ago
Hearts v Rangers LIVE: Prediction, team news and line-ups as Scottish Premiership title rivals meet at Tynecastle
You must be logged in to post a comment Login