

Crypto World
Why Was Ripple (XRP) Rejected at $1.50 Again?
Ripple’s cross-border token went on an impressive run Sunday evening, outperforming all other larger-cap alts and bitcoin.
However, it faced the same fate as it did during its previous several breakout attempts as the bears stepped up. Nevertheless, analysts remain optimistic about its future price performance despite the most recent rejection.
XRP Tried and Failed (Again)
The asset had fallen to $1.38 in the hours leading up to the major breakout attempt, before it jumped to $1.42 and then to over $1.50. This substantial increase came amid many analysts predicting such a move from XRP, given its prolonged consolidation.
However, its momentum quickly faded, nowhere near the targets set by those analysts of up to $1.80. The most likely reason for this failed attempt was the developments on the US-Iran front, which have continuously impacted the entire crypto market.
Iran had sent another peace proposal to the US, which the latter’s President, Donald Trump, deemed “totally unacceptable.” XRP’s price rejection came shortly after Trump’s response went viral, and it was mimicked by many other digital assets. BTC, for example, had risen to $82,300 before it dropped almost immediately to under $81,000.
However, XRP’s situation is rather different as its more macro momentum is mostly downhill. It closed six consecutive months in the red, five of which were by double-digit losses, before it finally broke that streak in April with a minor increase. In addition, all of its breakout attempts in 2026 have been halted, and have marked lower highs since then.
Analysts Still Positive
Despite facing yet another rejection in its tracks, many analysts still believe XRP is on the right path to a more profound breakout. CW noted that the upward momentum in the futures market is “being maintained,” while the downward pressure is “small.” As such, they predicted that “the rise will resume” over time.
Although $XRP has fallen after a rise, the upward momentum in the futures market is being maintained.
Downward pressure during the decline is small.
Over time, the rise will resume. pic.twitter.com/AwJBofQTMj
— CW (@CW8900) May 11, 2026
CRYPTOWZRD said XRP had closed “a bit bullish” but expects validation in the next 12-24 hours. XRP has to hold above $1.445, which is currently being tested, to offer more upside potential.
ERGAG CRYPTO, who focuses mostly on the long-term charts, also noted that the asset’s bull structure is still intact as it remains above the 2-Month 21 EMA. They explained that the actual bull confirmation would come only after XRP reclaims $2.40-$3.36, which would open the door for their massive prediction of up to $13.
The post Why Was Ripple (XRP) Rejected at $1.50 Again? appeared first on CryptoPotato.

Disclosure: The author of this story owns shares in Strategy (MSTR).
When executive chairman Michael Saylor confirmed on Strategy’s (MSTR) Q1 2026 earnings call on May 6 that the company was prepared to sell bitcoin, it appeared to mark a shift for the world’s largest publicly traded corporate holder of the cryptocurrency. But the move would not be unprecedented. In December 2022, Strategy sold bitcoin for tax-loss harvesting purposes — the same rationale the company now appears to be signaling to the market once again.
On Dec. 22, 2022, Strategy sold 704 bitcoin for approximately $11.8 million at $16,776 per coin, but immediately repurchased 810 bitcoin two days later.
The sale was designed to carry back capital losses against previous gains and generate a tax benefit. A tax loss harvesting event.
“MicroStrategy plans to carry back the capital losses resulting from this transaction against previous capital gains, to the extent such carrybacks are available under the federal income tax laws currently in effect, which may generate a tax benefit”.
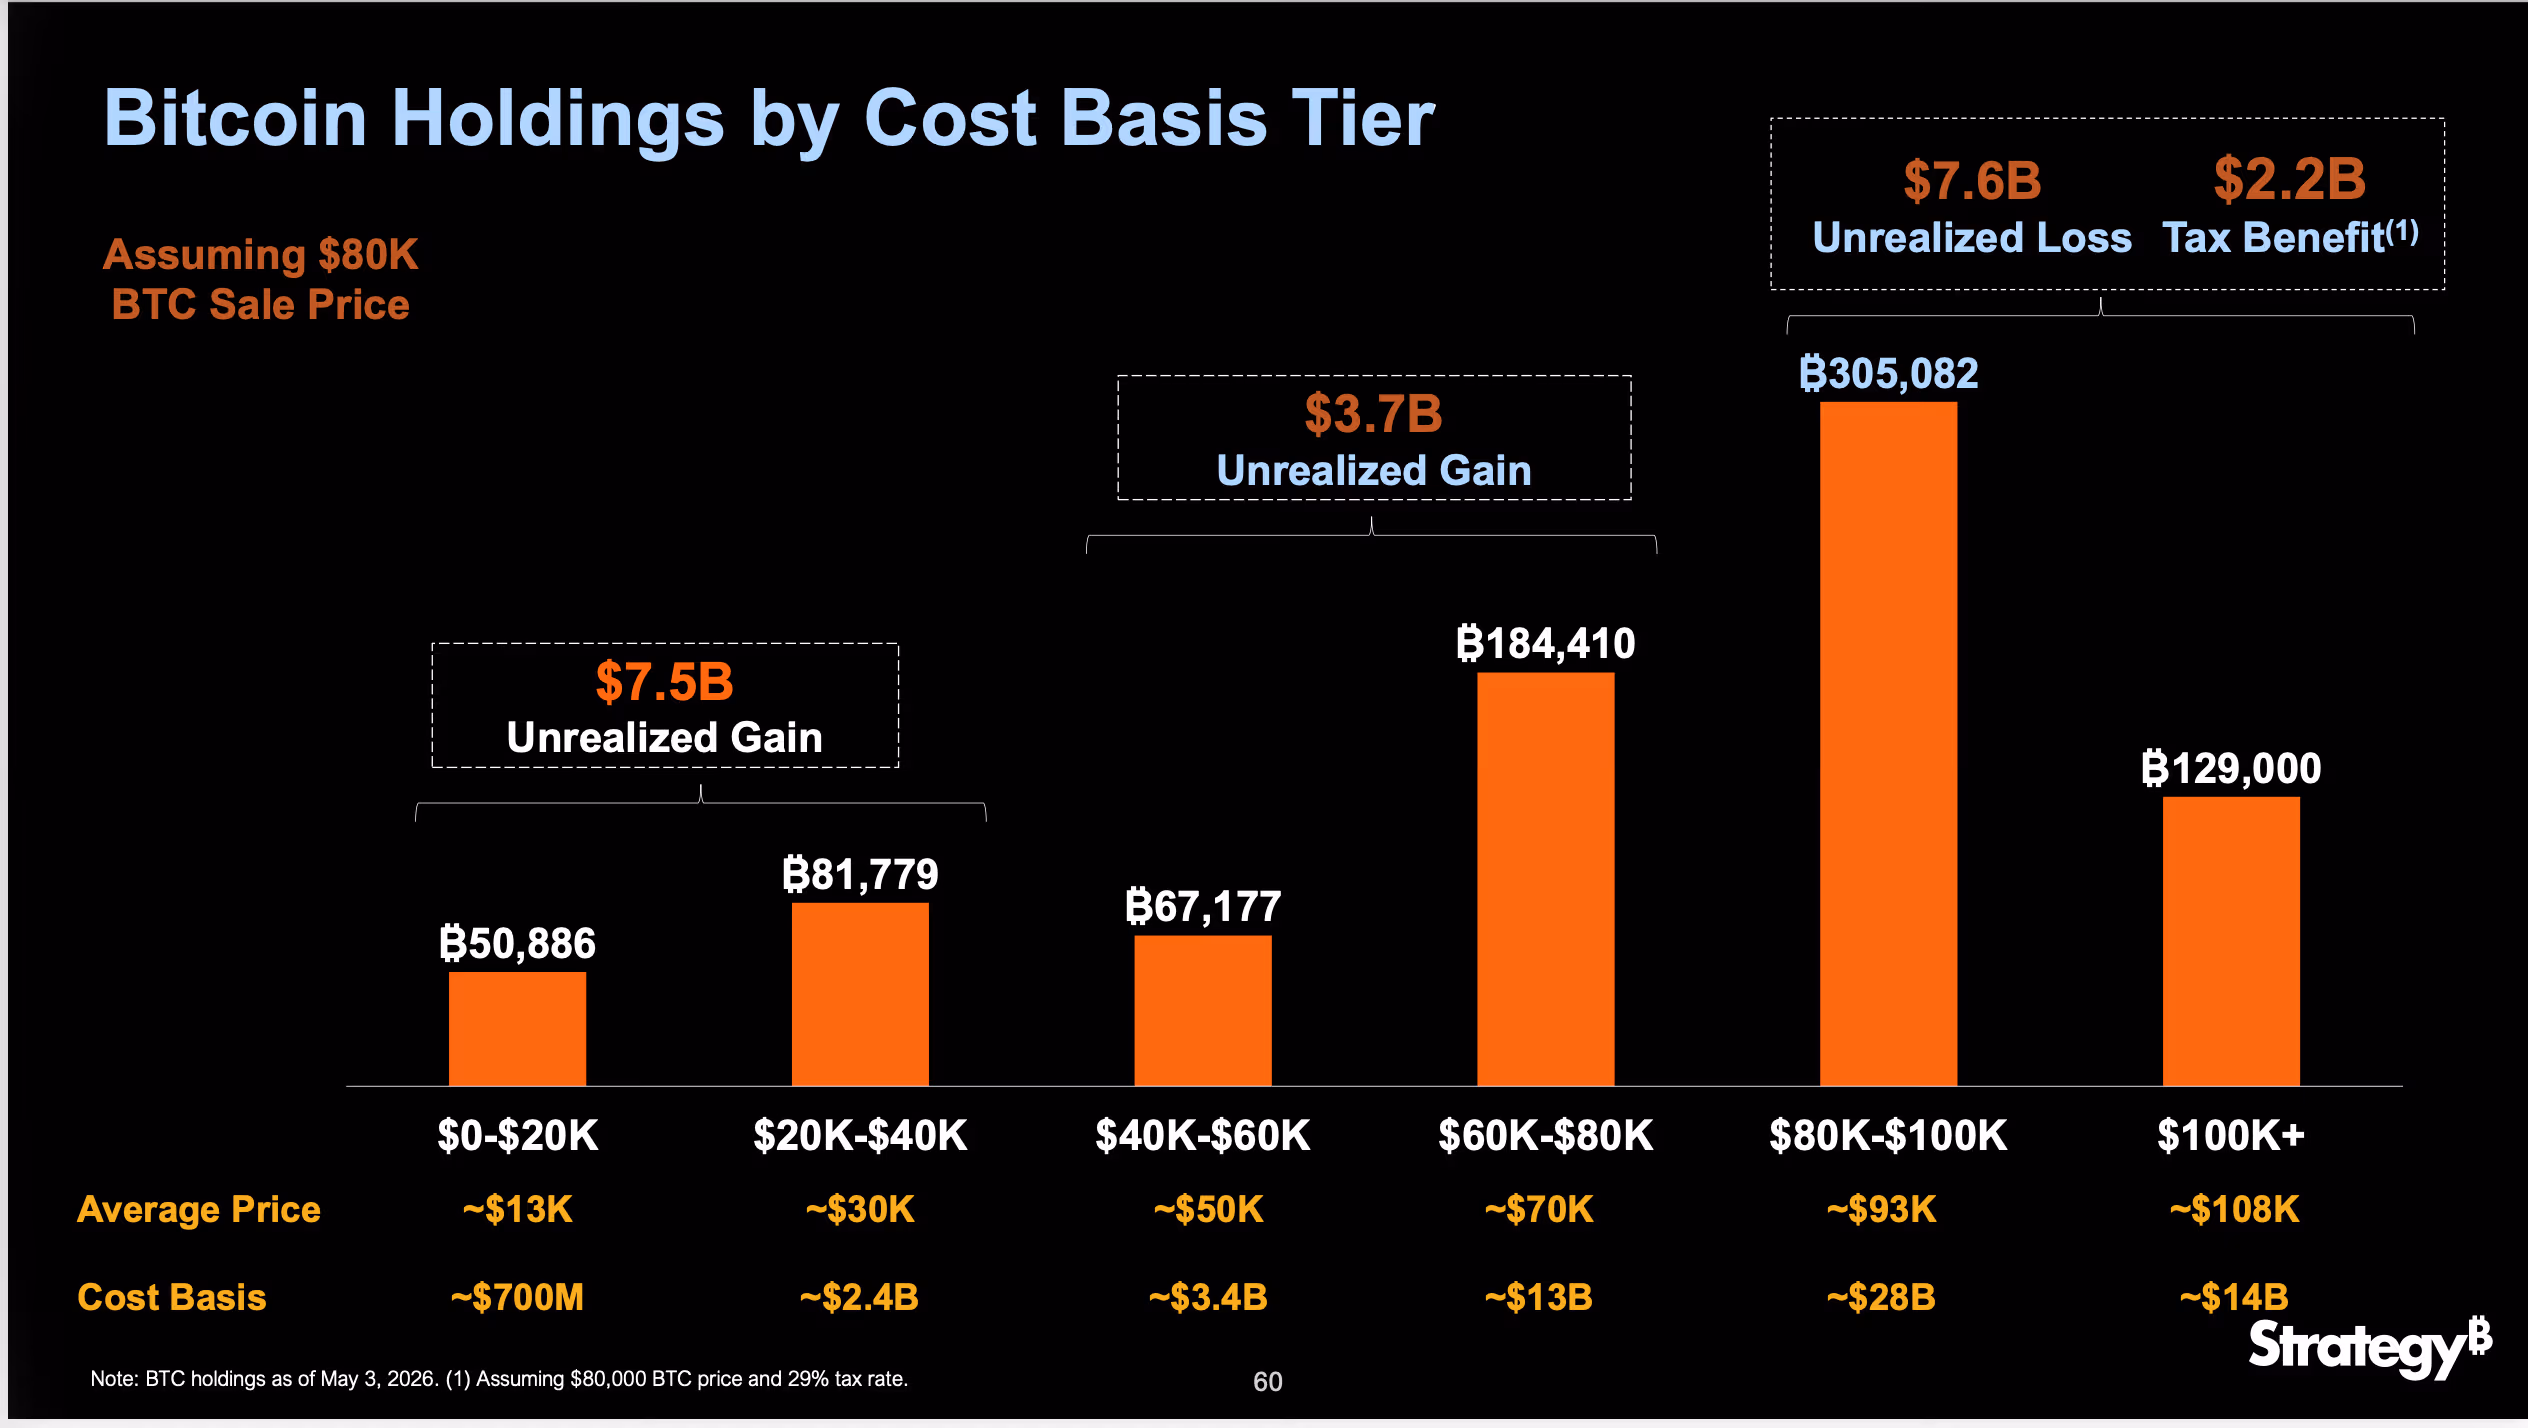
Bitcoin fell 23% in Q1 2026, from $87,500 to $67,700. Under FASB fair value accounting rules adopted Jan 1, 2025, Strategy marks its entire bitcoin holdings to market every quarter, in Q1 posted a $12.54 billion loss which pushed unrealized losses directly through the income statement and generating a $2.2 billion deferred tax asset across its higher cost basis holdings.
According to the MSTR earnings call, assuming an $80,000 bitcoin price, Strategy has purchased over 434,000 BTC above $80,000 generating a $7.6 billion unrealized loss and a $2.2 billion deferred tax asset at a 29% tax rate.

If bitcoin recovers and Strategy sells appreciated bitcoins, that $2.2 billion tax can offsets future gains.
The primary goal for the company is to increase “bitcoin per share” which is the ratio of Strategy’s total bitcoin holdings divided by its total diluted shares outstanding.
The use of proceeds from the bitcoin sale is to retire the $8.2 billion in convertible debt, purchase MSTR common stock when the multiple to net asset value falls below 1.22x or fund $1.5 billion in annual dividend obligations from its perpetual preferred stock Stretch (STRC).
MSTR is up 1% in pre-market trading, while bitcoin trades above $81,000.


- The Osmosis crypto price has surged on extreme trading volume and liquidity inflows.
- Cosmos governance rejection kept Osmosis independent and stable.
- Price now hinges on holding $0.065 and breaking $1 resistance.
The price of the Osmosis (OSMO) crypto has jumped sharply by nearly 200% in 24 hours, moving from a low near $0.03383 to around $1.

This sudden rally has placed the token among the strongest performers in the crypto market today, with trading activity and ecosystem developments both playing a major role in the move.
Notably, the price surge came alongside an extreme spike in trading activity, a shift in altcoin market flows, and a key governance outcome within the Cosmos ecosystem that removed uncertainty around Osmosis’s future structure.
Forces behind the Osmosis crypto price surge
One of the biggest drivers behind the sudden Osmosis crypto price surge is the dramatic rise in trading activity on the Osmosis decentralised exchange.
On-chain data shows a surge in 24-hour trading volume of more than 7,000%, reaching roughly $173.892 million, according to Coingecko data, at press time.
This level of activity is unusually high compared to the token’s typical liquidity profile and signals a sudden inflow of speculative capital.
This spike suggests that traders were actively rotating funds into Osmosis liquidity pools, likely driven by momentum strategies and short-term positioning.
When volume expands this rapidly relative to available liquidity, even moderate buying pressure can produce outsized price movements, which helps explain the sharp upward acceleration.
Another important factor is the broader market environment.
The Altcoin Season Index has risen to around 51, reflecting a mild shift in capital from major assets like Bitcoin into higher-risk altcoins.
In such an environment, mid-cap tokens tied to active ecosystems tend to experience amplified moves, and Osmosis has clearly benefited from this rotation.
The rally was also reinforced by a governance vote within the Cosmos ecosystem.
On April 17, 2026, a proposal to integrate Osmosis more directly into the Cosmos Hub narrowly failed.
While some market participants initially viewed integration as a potential long-term structural upgrade, the failure of the proposal removed uncertainty around Osmosis’s independence.
Following the vote, the Osmosis team confirmed that the network would continue operating independently, maintaining its current structure and focusing on profitability and user security.
The Cosmos Hub proposal to integrate Osmosis narrowly did not pass governance.
While this is not the outcome we thought was best for Cosmos, we want to thank the community, validators, and everyone who engaged deeply with the discussion.
Osmosis continues to operate as an…
— Osmosis 🧪 (@osmosis) April 17, 2026
This clarity appears to have reduced governance-related uncertainty and contributed to improved short-term sentiment.
At the same time, market conditions were already supportive.
The token was trading in a highly reactive range, and once momentum began building, price action accelerated quickly.
The combination of rising volume, altcoin inflows, and narrative confirmation created the conditions for a sharp upward breakout.
OSMO price outlook
From a technical perspective, the move in OSMO has the characteristics of a momentum-driven expansion phase.
The price nearly doubled in a single day, which is typically associated with speculative trading rather than gradual accumulation.
Eyes are not on the support near $0.065, which is an important level for the altcoin to maintain the bullish momentum.
If the token holds above $0.065, it could indicate consolidation after the initial spike.
A break above $1 and sustained trading above this level would suggest continuation of momentum, especially if trading volume remains elevated.
However, volume will play a decisive role in the next phase.
The same surge that pushed the Osmosis crypto upward could also reverse quickly if activity begins to fade.
A drop in trading volume below roughly $100 million would signal weakening participation and could increase the likelihood of a pullback.
If selling pressure increases, a breakdown below $0.055 would be an important bearish trigger.
Such a move would likely indicate that short-term traders are exiting positions after the sharp rally, potentially leading to a deeper retracement toward lower liquidity zones.
The S&P 500 has surged to fresh record highs in 2026, powering through milestone after milestone as Wall Street toasts another banner year.
Strip out the artificial intelligence stocks, though, and the rally all but disappears, leaving a market that has gone essentially nowhere since February.
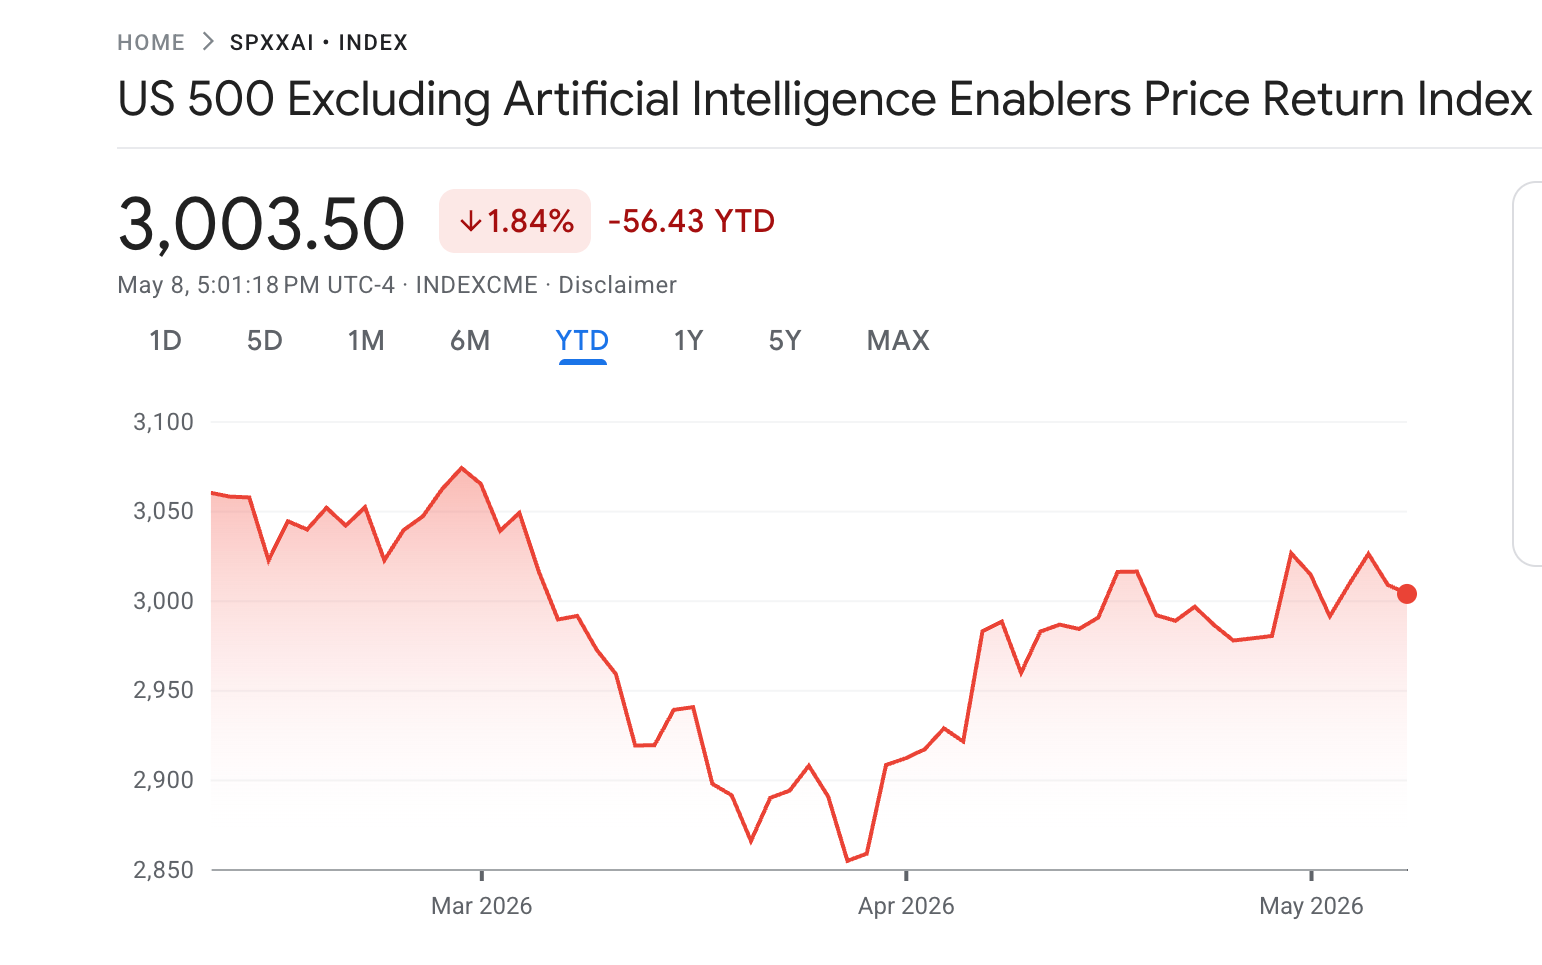
S&P 500 ex-AI Index Flat Since February as Benchmark Climbs 8%
BeInCrypto recently reported that AI-linked stocks now account for a record 45% of the S&P 500’s market capitalization. Strong rallies in hyperscalers and AI-related stocks have helped push the index higher, as investors continue betting on the sector’s long-term growth potential.
The S&P 500 has climbed nearly 7% since early February. While the war-driven volatility caused notable losses in March, the rally accelerated in April, with the index gaining 15.5% since March 30.
However, the gains have not been evenly distributed across the market. According to Google Finance data, the US 500 Excluding Artificial Intelligence Enablers Price Return Index (SPXXAI) has fallen 1.84% since its February launch.
Follow us on X to get the latest news as it happens

Even after rebounding from its March lows, the index is up only around 5.07%. The contrast highlights how heavily AI-related stocks are driving the broader market rally.
Goldman’s earlier work flagged the divergence well before the current rally. Across three years through early 2026, the headline S&P 500 returned 76% versus 32% for the ex-AI version.
“The gap highlights how a handful of AI giants are driving nearly all market gains, fueling growing concerns that the current bull market is becoming dangerously reliant on the AI trade alone,” Coin Bureau wrote.
This is not just the case for US equities. Bloomberg recently reported that Asia’s AI-driven stock rally has been concealing broader market weakness, with surging tech shares offsetting the economic pressure and investor uncertainty stemming from the US-Iran conflict.
“Outside of AI, there is a genuine absence of catalysts, and many companies’ spending plans and margin outlooks remain on hold until there is greater clarity on the conflict,” said Fabien Yip, a market analyst at IG International.
While AI giants continue to lift headline indices to record highs, much of the broader market remains sluggish amid geopolitical tensions and economic uncertainty.
As a result, investor confidence increasingly hinges on whether the AI boom can continue sustaining market momentum on its own.
Subscribe to our YouTube channel to watch leaders and journalists provide expert insights
The post AI Stocks Drive Nearly All of S&P 500’s Gains, Data Reveals appeared first on BeInCrypto.
Crypto World
Solana Co-Founder Just Confirmed Near-Speed-of-Light Finality Is Coming Next Quarter: Is $150 Back on the Table?

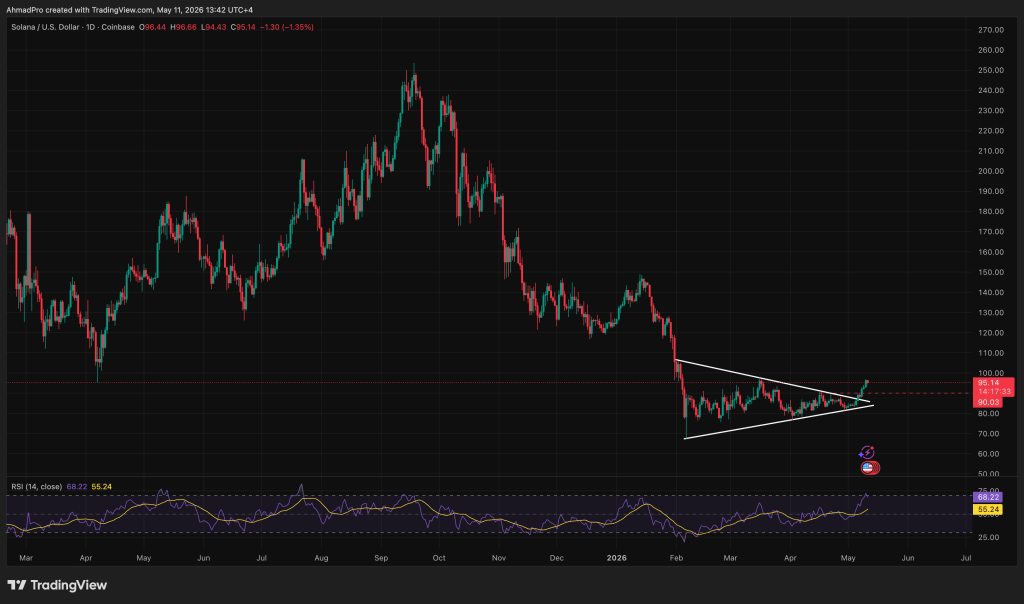
Solana is surging back into focus after a huge Solana news drop. SOL price trades at $95.61, up 12% in the last 7 days, as a major protocol announcement out of Consensus Miami 2026 adds fundamental weight to an already-recovering chart.
Volume tells the real story, and something technical is coming that could redefine what “fast” means on-chain.
Solana co-founder Anatoly Yakovenko confirmed at Consensus Miami 2026 that the long-anticipated Alpenglow upgrade is on track to ship as early as next quarter.
“The Alpenglow release is basically due sometime this year, I think next quarter,” Yakovenko said during a fireside panel.
“That, to me, is this exciting step in the evolution of the protocol.” Alpenglow targets near-speed-of-light transaction finality, tightening confirmation guarantees to approach the physical limits of global data transmission.
For financial applications where milliseconds matter, this isn’t incremental. It’s architectural.
Solana News Bolsters TA: Can Solana Price Hit $150 Before the Alpenglow Launch?
SOL is pushing against a critical resistance band. Technical analysis confirms a breakout from an 8-week symmetrical triangle, with the daily EMA ribbon turning bullish for the first time since January.
That signal has historically preceded significant trending moves. Immediate resistance sits at $96 to $100. A clean break opens the path toward $136.15.
Binance Square analysts are projecting $150 on a confirmed break above $140, citing rising DeFi and NFT adoption alongside Western Union’s USDPT stablecoin launch on Solana via Anchorage as structural demand drivers.
Support holds at $85 to $88. That is the line that cannot break.
If BTC holds firm and SOL clears $100 on volume, the $136 to $150 target comes into play quickly.
If neither happens, price consolidates between $88 and $100 through the token unlock before attempting another push higher. Lose $85 on heavy sell pressure from the unlock event and the near-term bullish structure collapses.
The token unlock is the wildcard. 464,650 SOL worth roughly $38.90 million is releasing this week. Short-term supply shocks can override even the strongest narratives.
Watch volume closely on unlock day. Solana’s developer ecosystem momentum is a real structural tailwind, but it does not neutralize a poorly absorbed supply hit.
Can Bitcoin Hyper be The Solana of This Cycle?
SOL at $95 is compelling, but at this market cap, the asymmetric upside that early Solana buyers enjoyed simply isn’t available anymore. That window closed. Where does the next infrastructure-layer opportunity exist? (Rhetorical, but worth sitting with.)
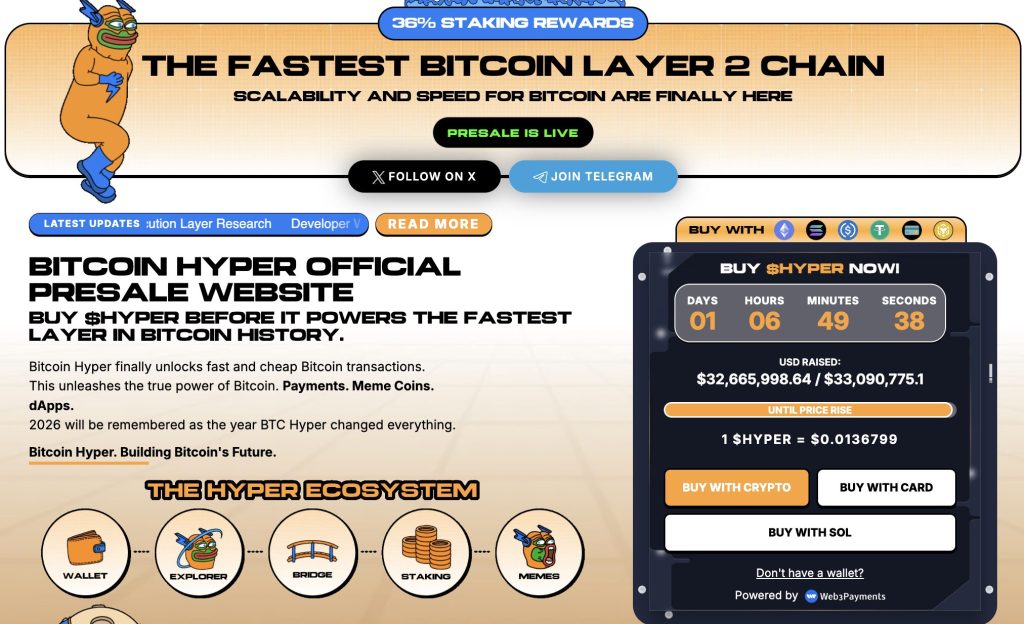
Bitcoin Hyper ($HYPER) is positioning in that exact gap: the first-ever Bitcoin Layer 2 with Solana Virtual Machine (SVM) integration, delivering sub-second finality on top of Bitcoin’s security layer. The pitch is straightforward: Bitcoin’s trust, Solana’s speed, without choosing between them.
The presale has now raised $32,664,913.69 at a current price of $0.0136799, with staking already live for early participants.
The Decentralized Canonical Bridge enables seamless BTC transfers into a fast, low-cost execution environment, solving Bitcoin’s programmability problem at the infrastructure level.
The project crossed $32M raised amid sustained presale demand. Presales carry real risk, token price at launch is never guaranteed, but the raise figure indicates serious market interest.
The post Solana Co-Founder Just Confirmed Near-Speed-of-Light Finality Is Coming Next Quarter: Is $150 Back on the Table? appeared first on Cryptonews.
Bitcoin (BTC) price keeps stalling near $82,000, and the chart is not the real reason. The blame sits with a US buyer base that has been missing since October.
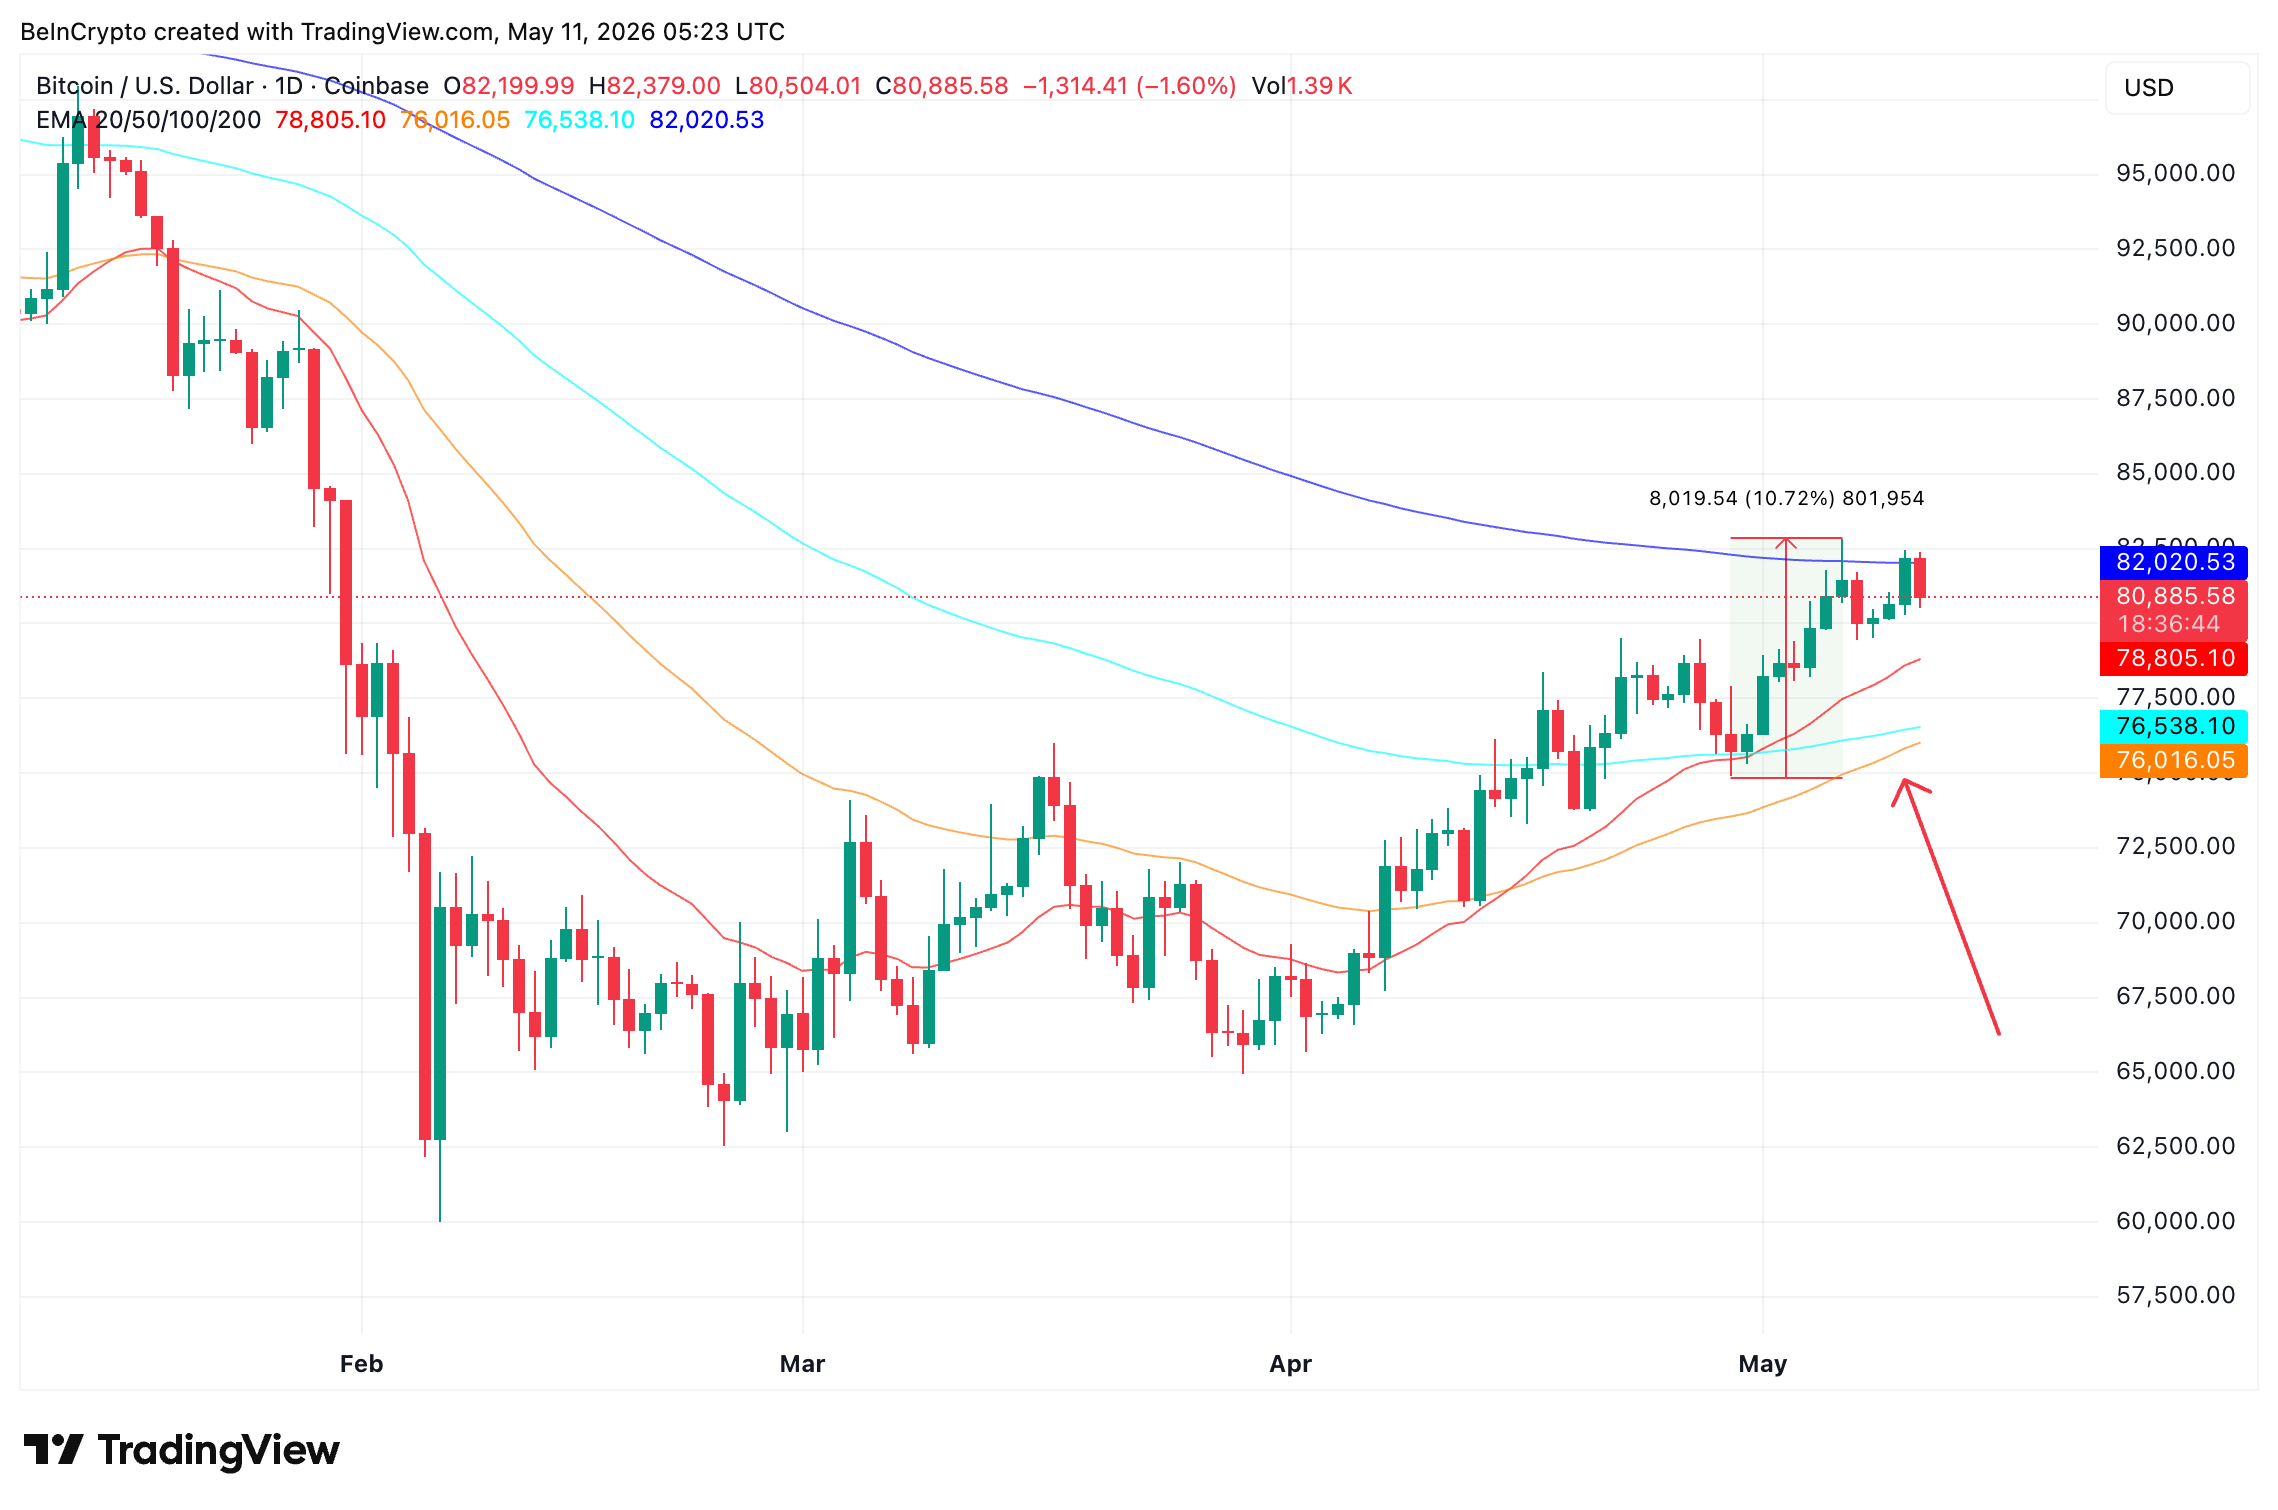
The chart looks ready for a rally. A looming bullish EMA crossover hints at the same setup that delivered 10.72% in April. The catch sits at a key chart-specific level, as one group of buyers keep selling every reclaim attempt.
Bitcoin’s 50-Day and 100-Day EMA Crossover Echoes April’s 10.72% Setup
Bitcoin’s daily chart shows four exponential moving averages (EMA) stacked closely together.
The 20-day sits at $78,805, the 50-day at $76,016, and the 100-day at $76,538. The 200-day stands at $82,020 as the immediate ceiling. EMAs are weighted moving averages that respond faster to recent price than simple averages do.
Want more token insights like this? Sign up for Editor Harsh Notariya’s Daily Crypto Newsletter here.
The 50-day is now closing in on the 100-day, with the gap tightening by the day. A bullish crossover could complete within days. The setup matters because a similar compression played out between the 20-day and 100-day in late April. Once that crossover completed, Bitcoin price action delivered a 10.72% rally over the following weeks.

The catch sits at the 200-day. Bitcoin tried to reclaim the 200-day EMA over the weekend and failed. The May 6 attempt ended in a quick reversal. The May 10 attempt did the same.
Until the 200-day flips from resistance to support, the looming 50-day and 100-day crossover stays a setup without a trigger. The next question is what is keeping bulls from finishing the job. The answer sits in the on-chain data.
Funding Rates and Coinbase Premium Both Point to a US-Driven Bear Tilt
Bitcoin funding rates have undergone a regime shift over the past three months. From May 2025 through late January 2026, the rate was mostly positive, signaling long-side dominance.
Since late January, that flipped. CryptoQuant data shows funding has stayed mostly negative for around 90 days. The latest reading sits at -0.0031% on May 10. The series hit close to -0.02% earlier in the cycle, the deepest negative print in the period.

A funding rate below -0.01% signals strong short dominance, where leverage is crowded on the bearish side. Counterintuitively, that crowding can ease downside pressure and raise short-squeeze risk if price holds.
The spot side tells a similar story but started earlier. The Coinbase Premium Index measures the price gap between Coinbase and other major exchanges. A positive premium signals US-based buyers are paying up. A negative premium signals US sellers are dominant.
Since late October 2025, the premium has stayed mostly negative. The dominant tone is red, with only brief green spikes.

Six months of negative readings means US spot demand has been absent or net negative. That demand usually acts as the swing factor in Bitcoin rallies. Without it, every reclaim attempt gets met with supply from the same cohort.
This metric flipped positive on May 5 (right before the 200-day EMA reclaim attempt). On May 6 it turned negative, resulting in the EMA rejection.

The timing matters. The Coinbase Premium flipped negative three months before funding rates did. Spot weakness led the derivatives shift, not the other way around. A green flip in the Coinbase Premium would confirm US institutional demand is returning. Until then, the price chart has to do all the work alone.
Bitcoin Price Needs to Clear $82,000 to Open the Path to $90,450
With the 200-day EMA still acting as resistance, Bitcoin price has to clear $82,020 cleanly. The upside levels come into play only after that.
Volume tells part of the story. Since April 13, daily volume has trended lower even as price ground higher. That fading participation is one of the reasons every reclaim attempt has stalled.
The next test above the 200-day is $83,608, the 0.236 Fibonacci level. Clearing it confirms the 200-day is no longer suppressing price. The path then opens toward $86,223 and $88,336.
A push beyond $88,336 puts $90,450, the 0.618 Fibonacci, into play as the next major resistance, also highlighted in our crypto market piece.

To the downside, $79,381 is the immediate support. A break below opens $74,903 as the next horizontal floor. Loss of $74,903 sets up a deeper test of $70,493.
Bitcoin price is locked in a tight setup. The 200-day EMA, Coinbase Premium, and funding rate all need to flip green together before any meaningful upside. A move above $82,020 without US buyers showing up risks repeating the May 6 and May 10 failures.
$82,020 separates a 10.72%-style follow-through repeat from a slide back to $74,903 if sell volume returns.
The post Bitcoin Stalls at $82,000 Because US Buyers Have Been Missing Since October appeared first on BeInCrypto.

Dogecoin is slipping. DOGE trades at $0.109, down 2% in the last 7 days, and the critical $0.10 floor is closer than most retail bulls want to admit.
A brief 9% pump last week has fully faded, leaving the chart in a quiet deterioration that often precedes sharper moves.
The clearest bearish signal isn’t on the chart; it’s on Polymarket, where 74% of bettors with $223K in volume are positioned for DOGE to close May below $0.10.

No Musk catalyst, no Tesla integration news, no institutional trigger has emerged to absorb that pressure.
3Commas has flipped to an outright “Sell” recommendation, citing a 24-hour trading range of just $0.093–$0.094. Community enthusiasm for X remains loud, but retail noise rarely wins against positioning at this scale.
The setup points to a decisive test of key support levels within days, and the outcome matters beyond DOGE itself.

Can Dogecoin Hold $0.10 Support or Is a Drop Below $0.10 Imminent?
DOGE price structure is technically fragile.
DOGE price is sitting at $0.10972 on the daily chart, and the big picture here is a coin that got cut from $0.31 at the October peak all the way down to $0.085 in February, losing over 70% in roughly 4 months.
What has happened since that February low is the first genuinely constructive price action in a long time, with DOGE holding above $0.085 and now pushing toward $0.12 for the first time since December, printing a series of higher lows over the past 3 months.
The $0.12 level is the immediate ceiling that matters for Dogecoin: it was support during the December breakdown and is now the first resistance to clear on the way back up.
Above that, $0.15 and $0.18 are the next meaningful levels from the prior distribution zone, and clearing them would shift the narrative from recovery to a genuine trend reversal.
The downside risk is straightforward: a failure to hold $0.10 sends DOGE price back toward the $0.085 February low, and a break below that puts fresh lows on the board with no nearby support.
The base has been building for 3 months, the structure of higher lows is intact, and the price is now testing its first real resistance since the downtrend began.
$0.12 is the line. A clean break above it with follow-through is the first signal that this recovery has real legs.
Why OG Smart Memecoins Traders Are Turning to Maxi Doge
DOGE holders watching $0.10 approach face an uncomfortable question: how much downside is acceptable waiting for a catalyst that may not arrive this month?
That rotation calculus is exactly what’s driving attention toward early-stage meme assets with asymmetric setups, before the crowd arrives.
Maxi Doge (MAXI) is one presale capturing that overflow. The project, a 240-lb canine juggernaut built around a 1000x leverage trading mentality (the tagline: “Never skip leg-day, never skip a pump”), has raised $4,773,041.39 at a current price of $0.0002817.
That’s not a rounding error; that’s the entry point. The ERC-20 token features holder-only trading competitions with leaderboard rewards, a Maxi Fund treasury for liquidity and partnerships, and dynamic staking APY for early participants.
Meme-first marketing leans hard into gym-bro viral culture, which, as DOGE’s own history proves, is an underrated distribution mechanism.
The parallel to early DOGE momentum is deliberate. Presales carry real risk, liquidity is thin pre-launch, and execution is unproven, but for traders watching DOGE stall at $0.108, the contrast in entry price is hard to ignore.
The post There is 74% Odds That Dogecoin Closes May Below $0.10: Are They Right? appeared first on Cryptonews.
The cryptocurrency industry often appears mysterious to newcomers. Many assume blockchain protocols simply “print money” whenever prices rise or new tokens are launched. In reality, sustainable crypto projects operate much more like businesses than people realize. Behind every decentralized exchange, lending protocol, or blockchain network is a system designed to generate revenue, manage expenses, and incentivize growth.
Understanding how crypto projects make money is essential for evaluating whether a protocol has long-term potential or is simply surviving on hype.
The Difference Between Revenue and Token Price
One of the biggest misconceptions in crypto is the belief that a rising token price automatically means a project is successful.
In traditional business, a company’s value is often linked to its revenue and profitability. In crypto, however, token prices can rise purely because of speculation, trends, or market sentiment.
A protocol may have:
- A rapidly increasing token price, but very little real revenue
- Strong revenue generation while its token remains undervalued
- Massive user activity with weak treasury management
- Sustainable cash flow despite bearish market conditions
This distinction matters because long-term survival depends more on actual economic activity than temporary token speculation.
A healthy crypto project usually combines:
- Real protocol usage
- Sustainable revenue streams
- Effective treasury management
- Incentives aligned with long-term growth
Trading Fees: The Core Revenue Engine
For many crypto protocols, trading fees are the primary source of income.
This model is especially common among decentralized exchanges (DEXs) such as:
- Uniswap
- PancakeSwap
- Hyperliquid
Every time users swap tokens, open leveraged positions, or provide liquidity, the protocol collects a percentage-based fee.
For example:
- A DEX may charge 0.3% per trade
- Perpetual futures platforms collect trading and funding fees
- Lending protocols charge interest spreads between borrowers and lenders
When millions or even billions of dollars move through these systems daily, small fees can add up to substantial revenue.
This is similar to how traditional financial exchanges operate. The difference is that blockchain activity is transparent, allowing users to publicly track protocol revenue.
Treasury Management: The Protocol’s Financial Backbone
Most serious crypto projects maintain a treasury, which functions similarly to a corporate reserve fund.
Treasuries may contain:
- Native tokens
- Stablecoins
- Bitcoin
- Ethereum
- Yield-generating assets
- Venture investments
Effective treasury management is critical because crypto markets are highly volatile. A project holding only its own token may struggle during bear markets if the token loses significant value.
Well-managed treasuries help projects:
- Fund development
- Pay contributors
- Support ecosystem grants
- Maintain liquidity
- Survive prolonged downturns
Some protocols also generate income by deploying treasury assets into staking systems or decentralized finance strategies.
Projects with strong treasury discipline are generally viewed as more resilient during market cycles.
Staking: Incentives and Network Security
Staking is another major economic mechanism in crypto.
In Proof-of-Stake ecosystems, users lock tokens to help secure the network and validate transactions. In return, they receive rewards.
Popular staking ecosystems include:
Staking serves multiple purposes:
- Secures the blockchain
- Encourages long-term holding
- Reduces circulating supply
- Aligns users with network growth
However, staking rewards are often misunderstood.
Many beginners see high APY percentages and assume guaranteed profits. In reality:
- Rewards may come from token inflation
- Token prices can fall faster than rewards accumulate
- Unsustainable yields often collapse during weak market conditions
The most sustainable staking systems are backed by real network usage and fee generation rather than excessive token emissions.
Token Models: Utility vs Speculation
A token model, or tokenomics structure, determines how a project distributes value across its ecosystem.
Crypto projects use tokens for different reasons:
- Governance voting
- Transaction fees
- Staking access
- Liquidity incentives
- Revenue sharing
- Ecosystem participation
Strong token models attempt to balance:
- User incentives
- Network growth
- Supply control
- Long-term sustainability
Weak token models often rely heavily on inflation. In these cases, new tokens are constantly issued to attract users, but demand eventually weakens.
This creates a cycle where:
- Rewards attract liquidity
- Token supply expands rapidly
- Selling pressure increases
- Token prices decline
- User participation falls
This pattern has caused many short-lived DeFi projects to disappear after initial hype faded.
Revenue-Sharing Models
Some crypto projects distribute protocol revenue directly to token holders or stakers.
This approach is becoming increasingly popular because it creates clearer economic alignment between users and the protocol itself.
Revenue-sharing can include:
- Buyback-and-burn mechanisms
- Staking rewards funded by fees
- Dividend-like distributions
- Fee rebates for active users
Projects pursuing this model aim to connect actual protocol usage with token demand.
However, regulations surrounding revenue-sharing tokens continue to evolve globally, making compliance an ongoing challenge for many teams.
Why Some Projects Fail Despite Huge Hype
Crypto history is filled with projects that reached multi-billion-dollar valuations without sustainable revenue.
Common failure patterns include:
- Excessive token inflation
- Unsustainable staking rewards
- Poor treasury management
- Weak product-market fit
- Dependency on constant user growth
- Speculative demand without utility
When market sentiment weakens, projects without real economic foundations often struggle to maintain activity.
This is why experienced investors increasingly analyze:
- Protocol fees
- Treasury size
- Active users
- Revenue consistency
- Token supply dynamics
rather than relying solely on price charts.
The Future of Crypto Business Models
The industry is gradually shifting from speculation-driven growth toward sustainable financial infrastructure.
Modern crypto projects are increasingly focused on:
- Real revenue generation
- Long-term treasury stability
- Product utility
- Institutional adoption
- Transparent on-chain economics
As the market matures, projects with strong fundamentals are more likely to survive beyond short-term hype cycles.
In many ways, crypto protocols are evolving into digitally native financial businesses — powered by blockchain technology but governed by the same economic realities that affect every industry.
Final Thoughts
Crypto projects do not generate value magically. Behind every successful protocol is an economic system designed to attract users, generate activity, and sustain operations over time.
Trading fees, staking systems, treasury management, and carefully designed token models all play a role in determining whether a project can survive market cycles and continue growing.
For beginners entering the space, understanding these mechanics is one of the most important steps toward separating sustainable innovation from temporary speculation.
Crypto World
Canton Network’s Digital Asset targets $2 billion valuation in raise led by a16z crypto: Bloomberg


Digital Asset Holdings, the company behind the Canton Network blockchain used by several major banks and trading firms, is seeking $300 million from investors including Andreessen Horowitz’s a16z crypto at a roughly $2 billion valuation, according to Bloomberg.
The funding round is expected to close in the next few weeks, and the amount raised could vary, people familiar with the matter told Bloomberg.
The sources said investment banking company FT Partners is consulting Digital Asset on the funding round.
Digital Asset Holding, Canton Network and a16z crypto did not respond to a CoinDesk request for comment and confirmation.
The Canton Network is a privacy-enabled blockchain infrastructure whose purpose is to connect financial institutions and their tokenized assets across interoperable, permissioned applications.
In February, it revealed that a group of global financial firms completed the first cross-border, intraday repurchase agreement using tokenized British government bonds on its blockchain. The transaction was the first time digital versions of gilts, a $2 trillion market, had been used in an intraday repo across borders.
Digital Asset received backing estimated at about $50 million in late 2025 from investors, including Bank of New York Mellon and Nasdaq. Existing backers also include DRW and Citadel Securities.
For Andreessen Horowitz, participation in this fundraising round could be its first since raising $2.2 billion a week ago for its latest crypto fund, taking its total capital dedicated to the sector to just shy of $10 billion across five funds.

Macro investor and former hedge fund manager Jordi Visser said he recently bought Ether as he sees the “tokenization reality” starting this year, with tokenized assets powering agentic AI payments.
“I don’t think enough people are talking about tokenization and what’s happening,” Visser told Anthony Pompliano on a podcast on Saturday, predicting that tokenization and AI will be intertwined.
AI agents cannot access banking services or credit, so their primary method of transacting online autonomously will be digital assets such as Ether or stablecoins, which do not require bank accounts, logins or human approval.
“AI agents are with us,” he said. “They need food, and that food is not physical food. It is tokens,” he added. “There’s been a shortage,” which could lead to a supply and demand issue, he continued.
Autonomous online payments have surged this year, recording more than $24 million in transaction volume over the past month on the Coinbase x402 standard, according to x402.org.
Meanwhile, crypto protocols are racing to implement agentic AI payment protocols into their blockchains. The Algorand Foundation is one of the more recent, announcing on Saturday support for agentic commerce via a partnership with Google on the AP2 Agentic Payments Protocol.
Tokenization is needed for price discovery
Ethereum is a major blockchain for real-world asset tokenization, commanding more than 60% market share of tokenized assets, including layer-2 networks, according to RWA.xyz.
He also connected tokenization to a broader need for price discovery in illiquid assets, arguing that tokenization isn’t just a crypto story but a structural necessity for unlocking capital trapped in dormant assets such as private credit, private equity and venture capital.
Related: Agentic AI commerce may spell the end of internet ads: a16z Crypto
He argued that markets are entering a period where transparency and liquidity are “becoming critical” because a lot of money is stuck in these dormant assets.
“So tokenization is actually needed for no other reason than price discovery for a lot of these things that they’re trapped in.”

Source: YouTube
The head AI macro at 22V Research and a former hedge fund manager, however, cautioned about rising inflation, stating that he wanted to be in gold and silver and has also bought Bitcoin (BTC) as a hedge.
Magazine: Strategy reveals why they would sell BTC, Trump Media posts loss: Hodler’s Digest
Bitcoin (BTC) has climbed roughly 40% from its February lows, bringing the price back to a critical resistance zone that could determine whether the bear market continues or finally ends.
Key takeaways:
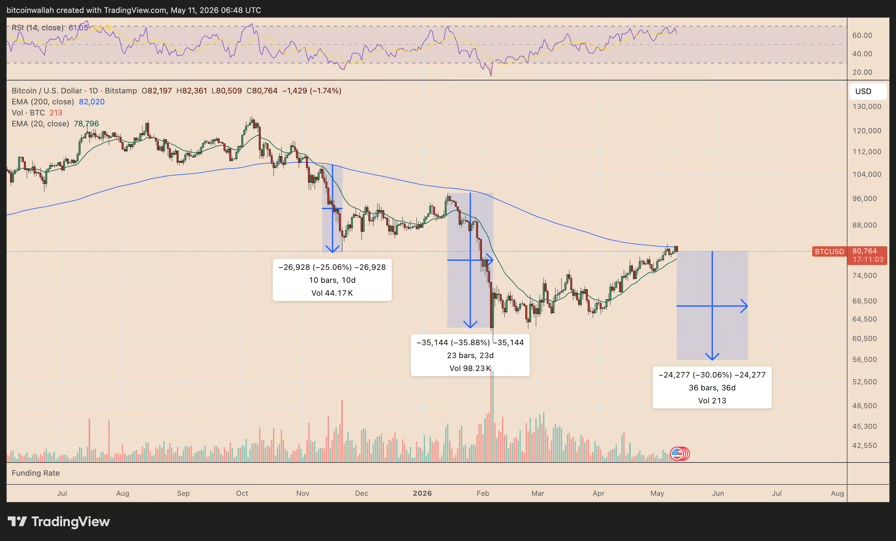
- Bitcoin fell 2.25% to around $80,500 after failing once again to break above its 200-day EMA resistance.
- Previous rejections from the same technical level triggered Bitcoin declines of 25% and 36%.
Bitcoin bulls must decisively break key trend line
As of Monday, BTC/USD was down 2.25% near $80,500, erasing its overnight gains as buyers once again failed to clear the 200-day exponential moving average (200-day EMA, blue line).
The level has capped Bitcoin’s rebound attempts since November 2025. Each rejection from the 200-day EMA has preceded steep drawdowns of 25% and 36%, respectively, putting the average decline near 30%.

BTC/USD daily chart. Source: TradingView
In his Monday post, analyst Brett said breaking above the 200-day EMA, currently near $82,580, could be “the end of the bears.” But given Bitcoin’s ongoing pullback, the prospects of BTC falling further in the coming sessions appear higher.
BTC’s price could fall toward $56,600 from current levels if it repeats its average 30% drawdown from the 200-day EMA rejection zone.
BTC price “lifetime support” model shows $56,000 floor
The $56,600 level aligns closely with Bitcoin’s broader macro support range.
A new Bitcoin Lifetime Support Model, highlighted by analyst PlanC, places BTC’s long-term upper support band near $57,110. The lower support was roughly around the $46,760 level.

Bitcoin lifetime support model. Source: Coin Metrics/PlanC
The model averages Bitcoin’s lifetime simple moving average with its single-, double-, triple- and quadruple-EMAs, then plots a 10% band around the result.
Historically, similar lifetime support zones have acted as macro bear-market floors. That means Bitcoin’s immediate setup remains bearish, but a decline toward the mid-$50,000s would still place BTC near a major long-term support area.
Bitcoin’s still unresolved bear flag pattern also hints at a potential drop below $60,000 in the coming weeks, as shown below.

BTC/USD daily chart. Source: TradingView
Bitcoin’s 2026 rebound mirrors past cycle bottoms
Despite the near-term bearish setup, Bitcoin’s latest rebound from the 200-week simple moving average (200-week SMA, blue line) is flashing a historically bullish signal.
BTC bounced by over 38% after testing the 200-week SMA near $61,000. This blue level closely aligns with major cycle bottoms seen in 2018 and during the March 2020 crash.

BTC/USD weekly chart. Source: TradingView
In both prior instances, Bitcoin briefly dipped toward or below the 200-week SMA before staging a sustained recovery toward the 50-week SMA (red).
Related: Analyst says Bitcoin’s $60K bottom signals weaken bear-market forecast
Bitcoin’s next upside target could be near $94,700, up roughly 17% from current price levels, if the fractal continues to play out. A move that high could support Brett’s view that the bear market is nearing its end.
The bullish outlook is also backed by strong fundamentals, including aggressive whale accumulation that recently absorbed nearly 500% of Bitcoin’s newly issued supply.

Nigel Martyn: Former England goalkeeper savours ‘special’ international cricket call-up
Strategy has already sold bitcoin before for tax loss harvesting in December 2022

The Avengers Are Officially Taking Over Disney+ Ahead of ‘Doomsday’
Manchester United reach agreement with Casemiro over contract clause amid transfer speculation

US brings back mandatory military draft registration

Steven Gerrard disagrees with Gary Neville over ‘shock’ Chelsea and Arsenal claim | Football


-
 Crypto World3 days ago
HarrisX Poll Found 52% of Registered Voters Support the CLARITY Act
-

 Crypto World4 days ago
Upbit adds B3 Korean won pair as Base token gains Korea access
-

 Fashion3 days ago
Weekend Open Thread: Marianne Dress
-

 Tech7 days ago
Image AI models now drive app growth, beating chatbot upgrades
-
 NewsBeat4 days ago
NCP car park operator enters administration putting 340 UK sites at risk of closure
-

 Politics2 days ago
Politics Home Article | Starmer Enters The Danger Zone
-
 Business2 days ago
Ignore market noise, India’s long-term story intact, say D-Street bulls Ramesh Damani and Sunil Singhania
-

 Tech4 hours ago
GM Agrees To Pay $12.75 Million To Settle California Lawsuit Over Misuse Of Customers’ Driving Data
-

 Crypto World6 days ago
UAE Free Zone Deploys Blockchain IDs to Verify Registered Firms
-
 Sports7 days ago
2026 NHL playoff picks: Second-round predictions, series odds, Stanley Cup bracket
-

 Tech1 day ago
Auto Enthusiast Carves Functional Two-Stroke Engine from Solid Metal
-

 Crypto World5 days ago
BlackRock CEO Larry Fink Discusses a New Asset Class
-

 Crypto World4 days ago
Robinhood says Wall Street is building onchain
-
Entertainment6 days ago
Serena Williams hits Met Gala in metallic dress after GLP-1 reveal
-

 Tech5 days ago
Apple and Samsung are dominating smartphone sales so thoroughly that only one other company makes the top 10
-

 Entertainment7 days ago
Skai Jackson Responds To AI Baklash After Viral Snapchat Photos
-

 Politics6 days ago
Met Gala 2026: Madonna’s Dramatic Red Carpet Look Steals The Show
-

 Tech5 days ago
I tested the Xiaomi 17 Ultra’s camera and I don’t think I’ll ever go back to an iPhone
-

 Fashion5 days ago
The Best Work Pants for Women in 2026
-
 Sports7 days ago
Hearts v Rangers LIVE: Prediction, team news and line-ups as Scottish Premiership title rivals meet at Tynecastle
You must be logged in to post a comment Login